-
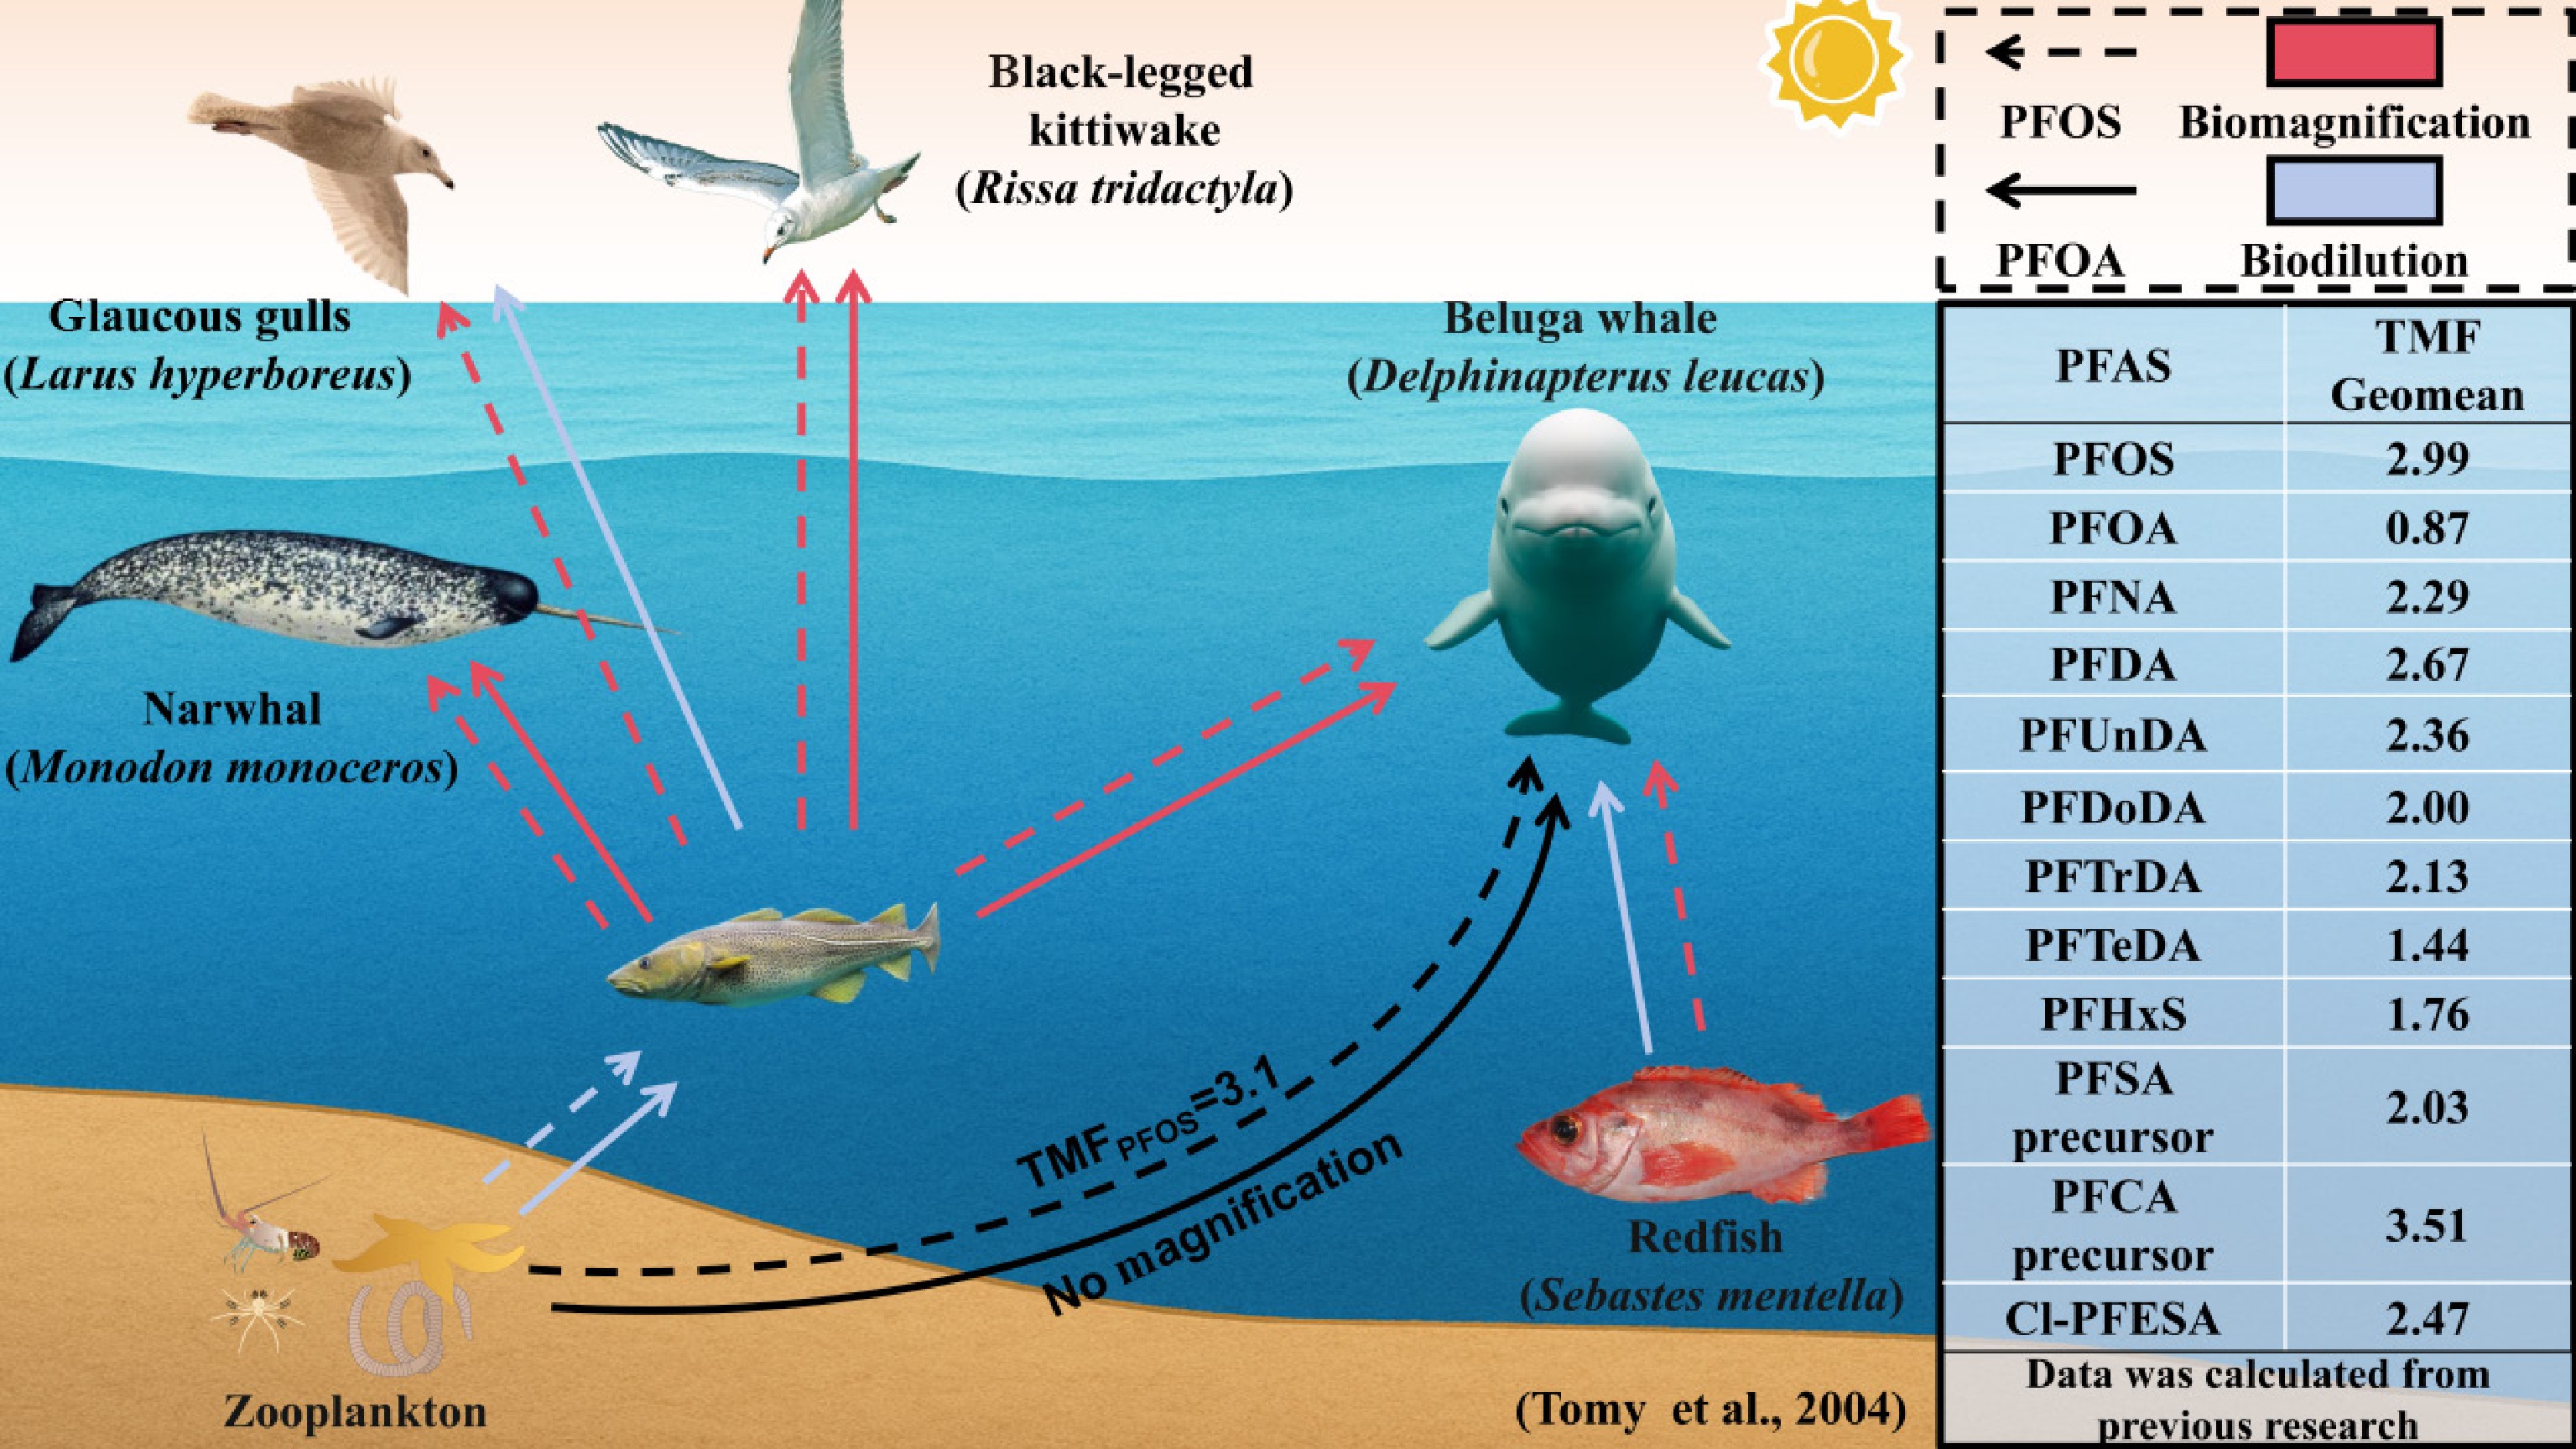
Figure 1.
Biomagnification of PFAS in aquatic ecosystems. The detailed PFAS trophic magnification diagram, adapted from Tomy et al.[30], demonstrates that both PFOS and PFOA exhibit biomagnification in predator-prey relationships. However, only PFOS shows significant biomagnification across the entire food web. The geometric mean (geomean) of the trophic magnification factors (TMFs) for various PFAS is noted, as statistically compiled from previous studies (Supplementary Table S1).
-
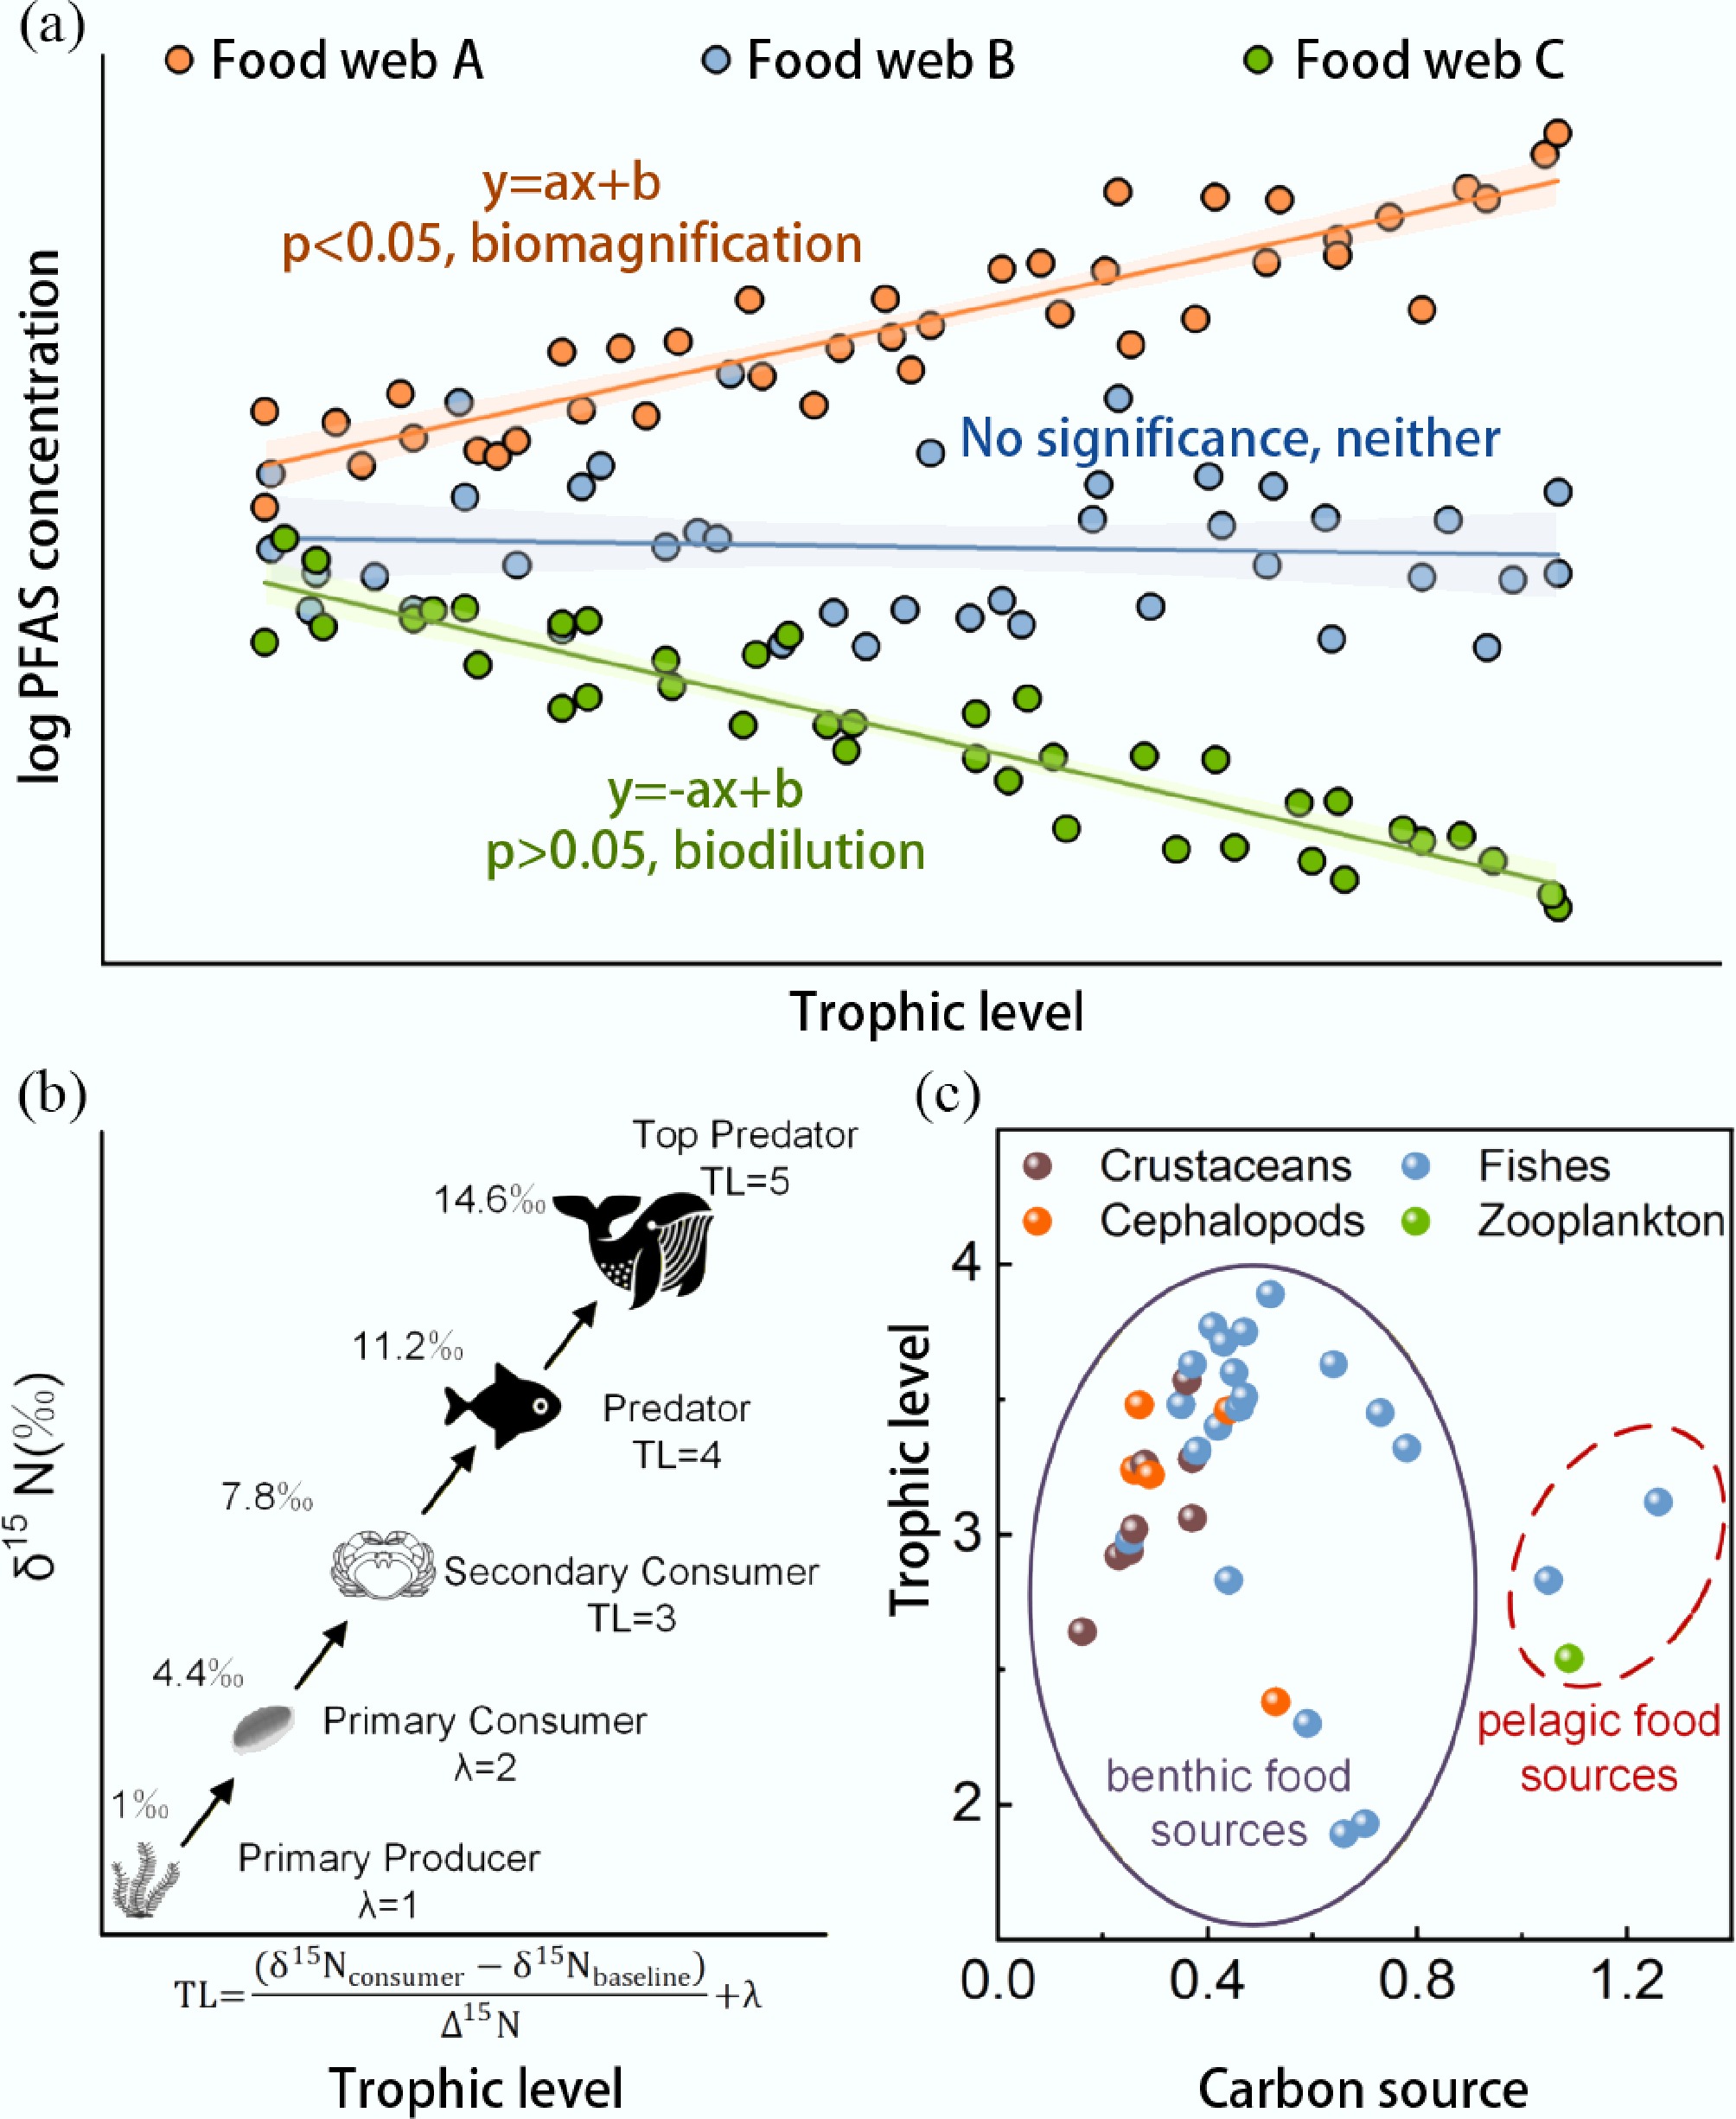
Figure 2.
Integrated assessment of contaminant biomagnification and trophic dynamics. (a) The regression model illustrating PFAS biomagnification, with the slope (a) representing the biomagnification rate and (b) the intercept, according to the equation: Y = aX + b. The shaded areas represent the confidence interval of the fitted line. (b) General trophic positions and bulk delta nitrogen isotope ratios. (c) Carbon sources and trophic levels characterize food web relationships.
-
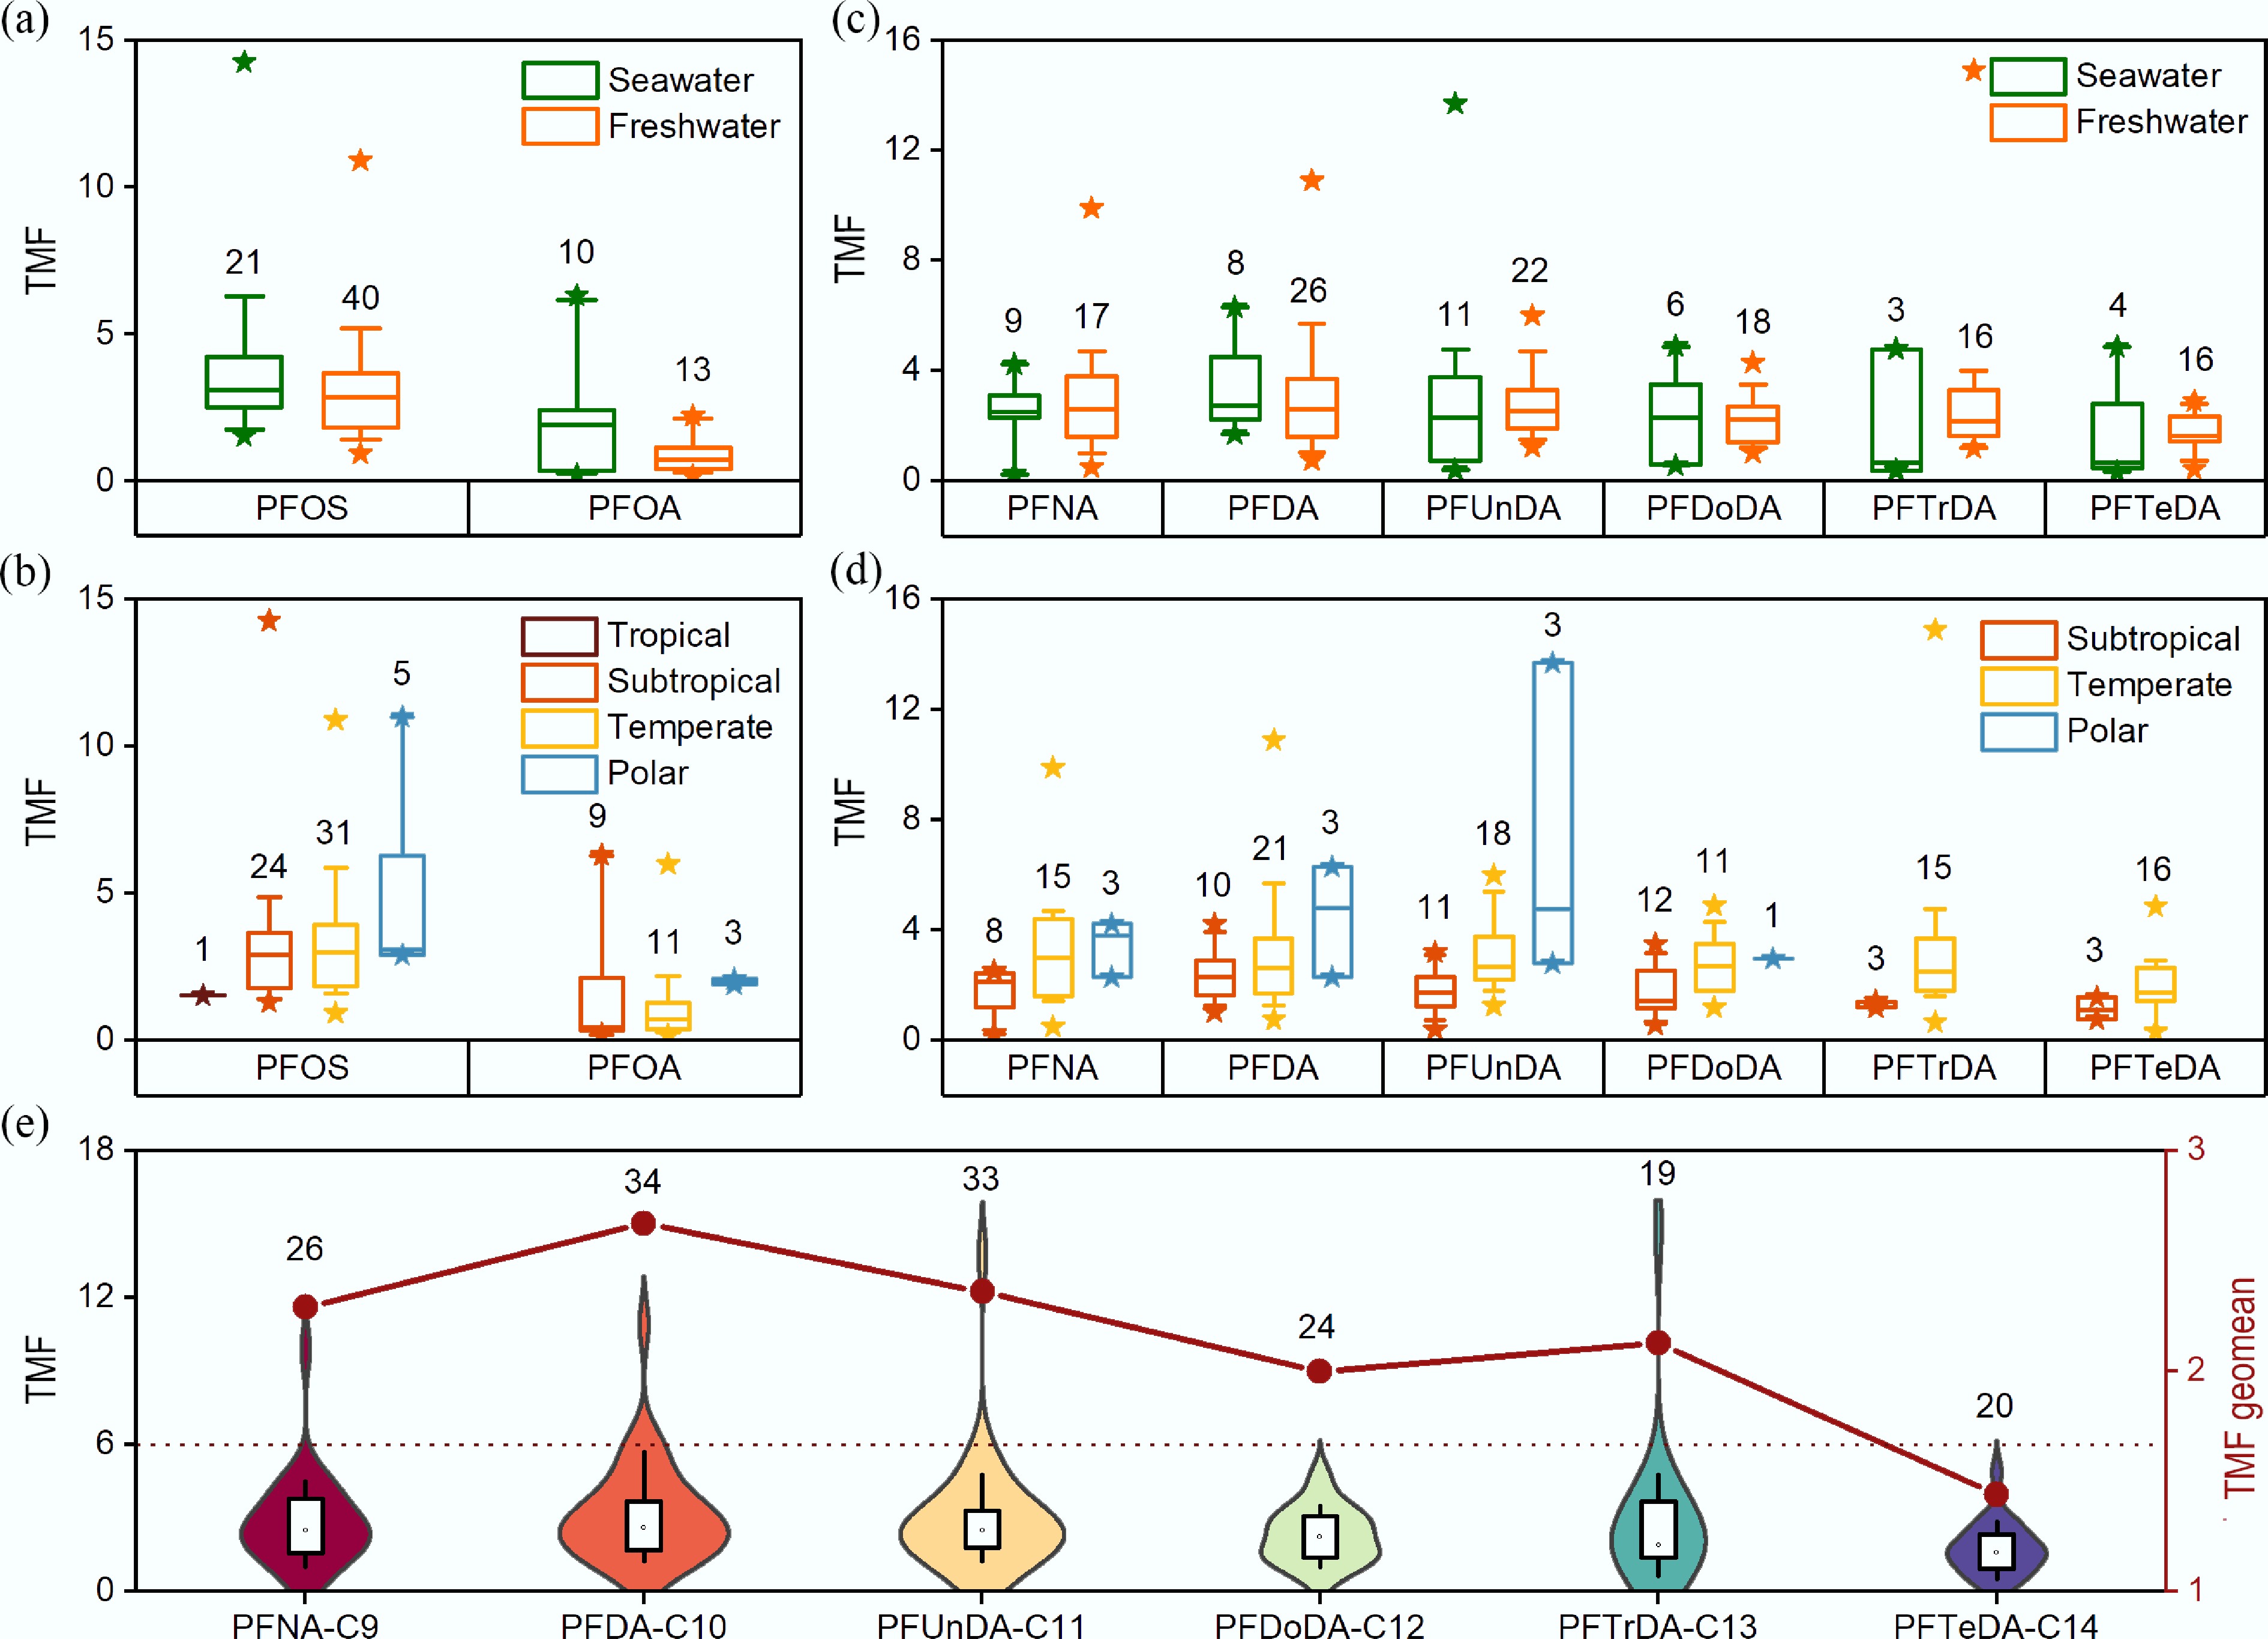
Figure 3.
Trophic magnification factors (TMFs) of per- and polyfluoroalkyl substances (PFAS) in aquatic food webs. (a) Comparison of TMFs for perfluorooctanesulfonic acid (PFOS) and perfluorooctanoic acid (PFOA) in marine versus freshwater ecosystems. (b) Differences in TMFs for PFOS and PFOA across different climate zones. (c) Comparison of TMFs for long-chain perfluoroalkyl carboxylic acids (PFCAs) in marine versus freshwater ecosystems. (d) Differences in TMFs for long-chain PFCAs across different climate zones. The boxplots show the median (horizontal line), 25th–75th percentile (box), and 10th–90th percentile (whisker chart) of TMF, and the asterisk indicates the maximum or minimum values. (e) Variation in TMFs for long-chain PFCAs with increasing carbon chain length. The boxplots show the median (horizontal line), 25th–75th percentile (box), and 10th–90th percentile (whisker chart) of TMFs (left Y-axis). The violin plots represent the data distribution (left Y-axis). The red dotted line represents the geometric mean of TMF, with coordinates on the right Y-axis. The numbers above the bars indicate the sample size (n). Data for this figure were pooled from 33 published studies. Only results with a statistical significance of p < 0.05 were included in the analysis.
-
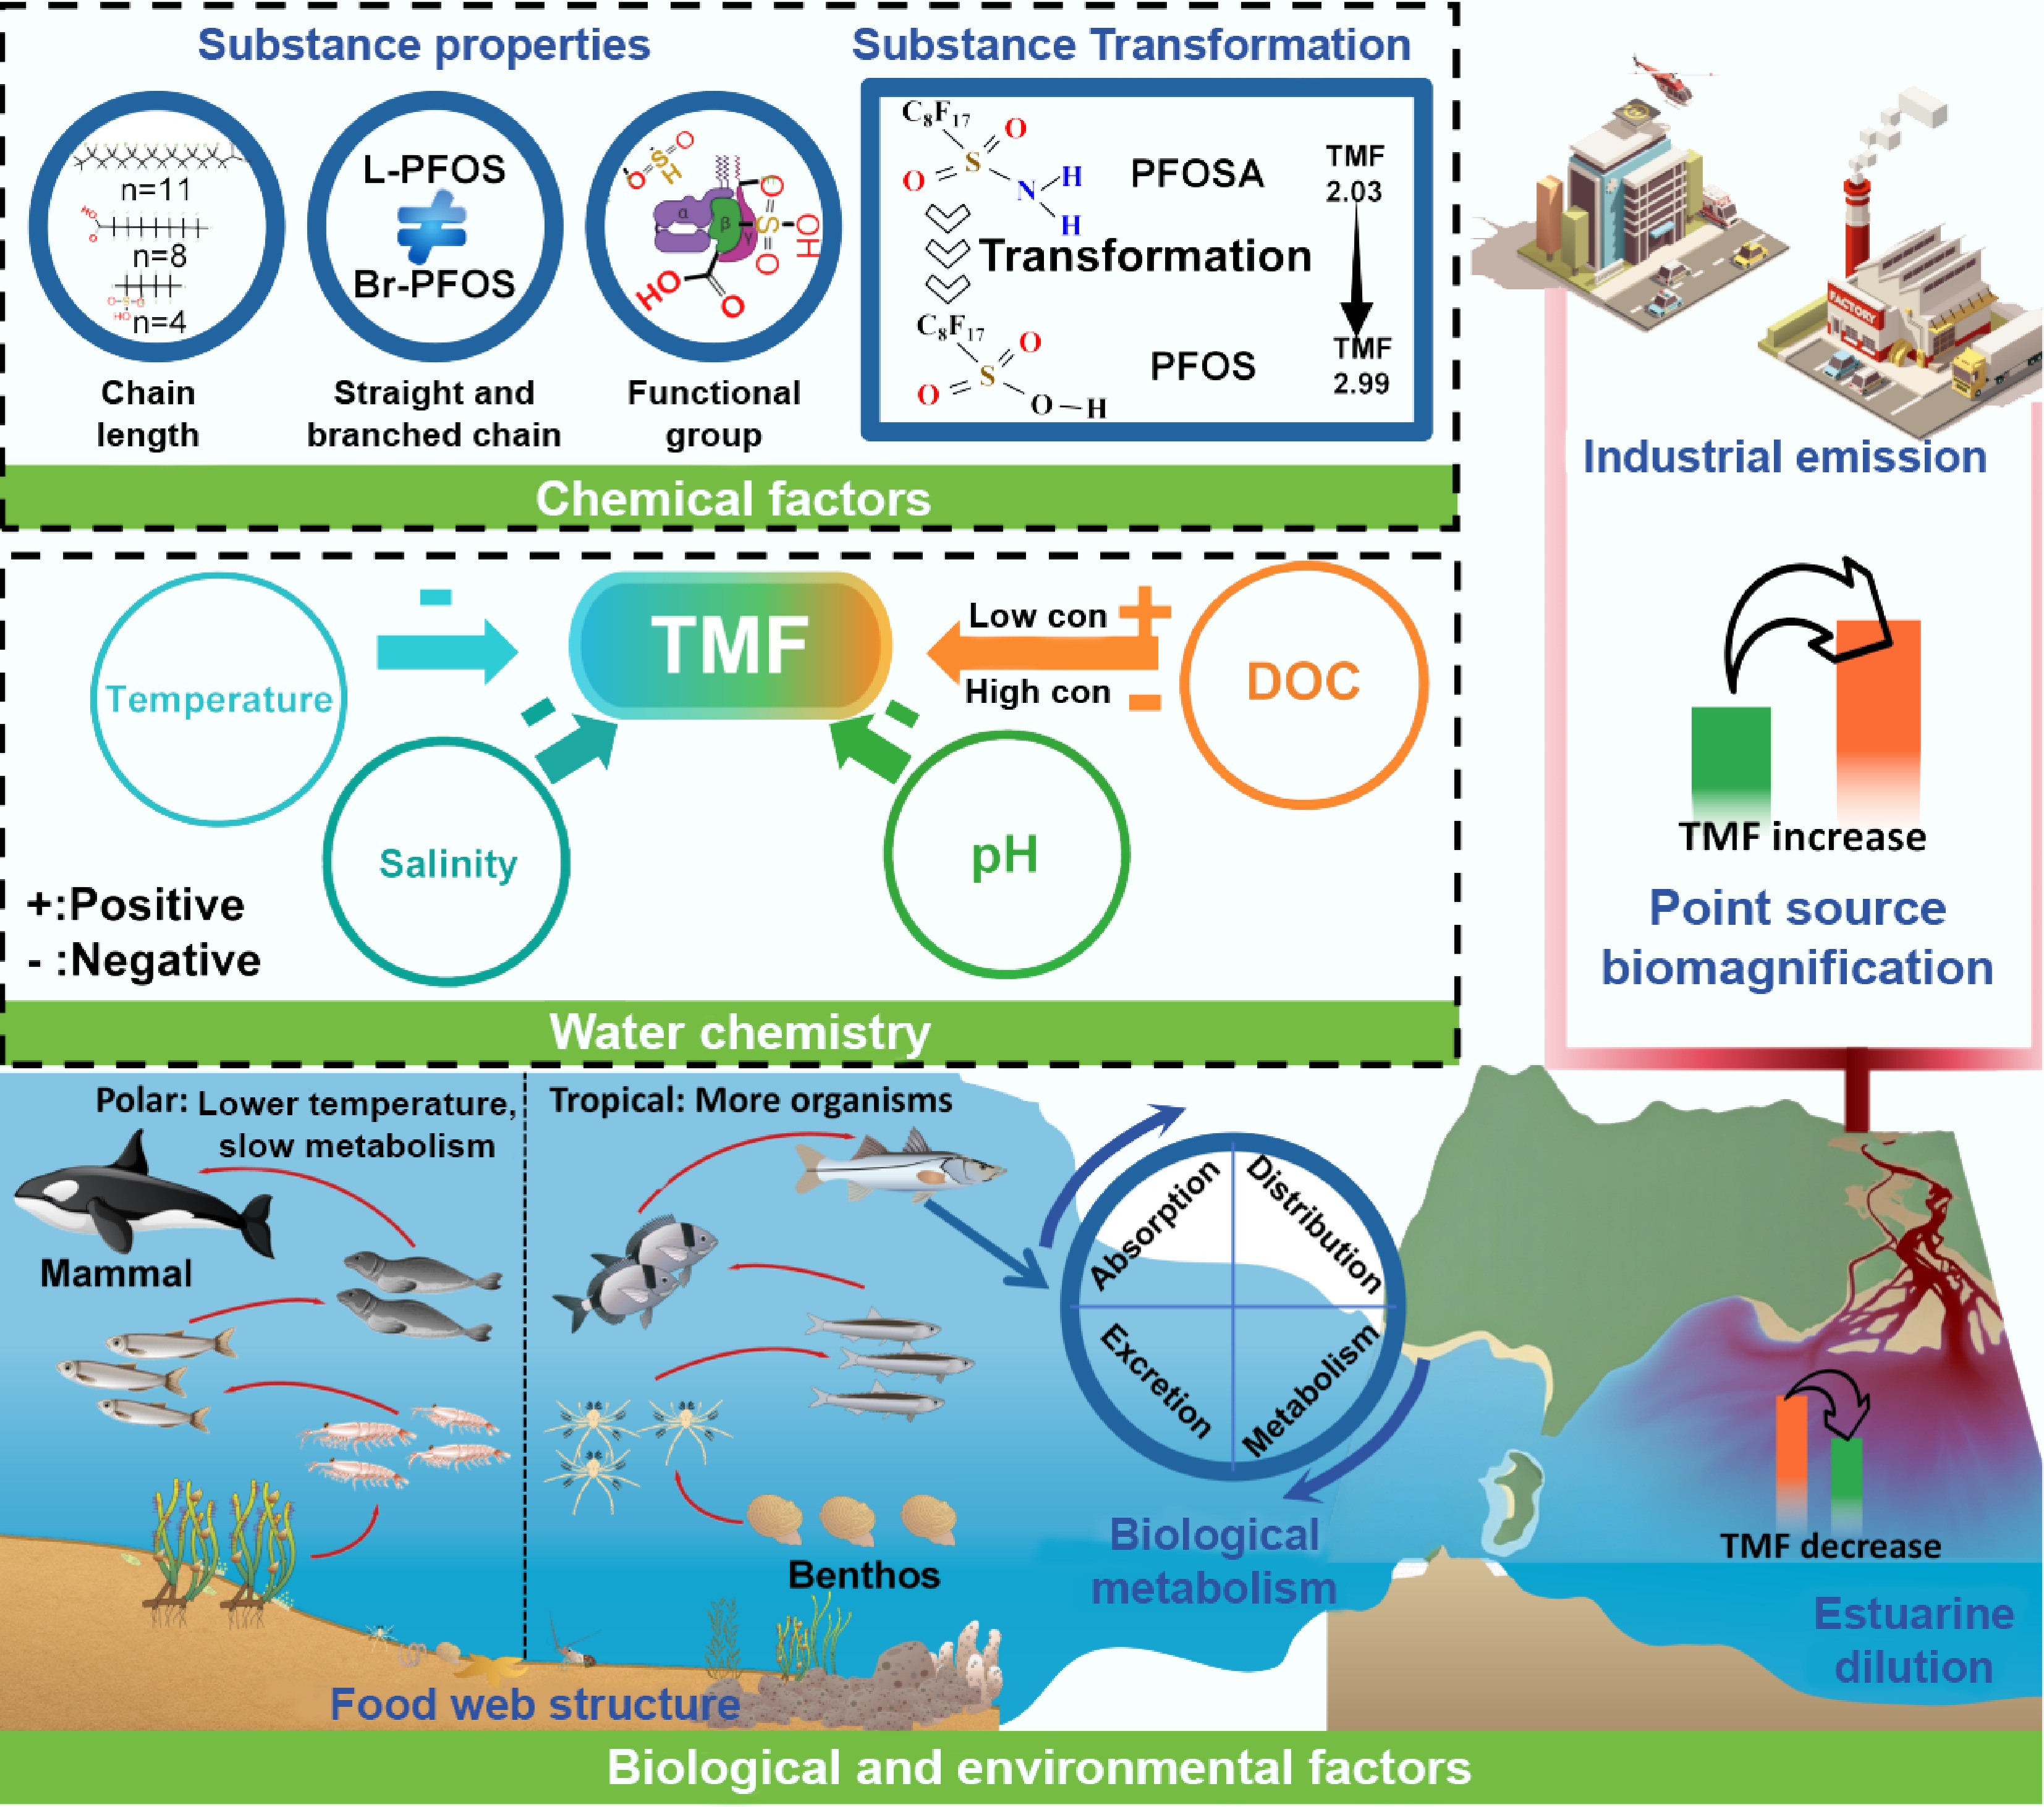
Figure 4.
Factors affecting trophic transfer and biomagnification in aquatic ecosystems.
Figures
(4)
Tables
(0)