-
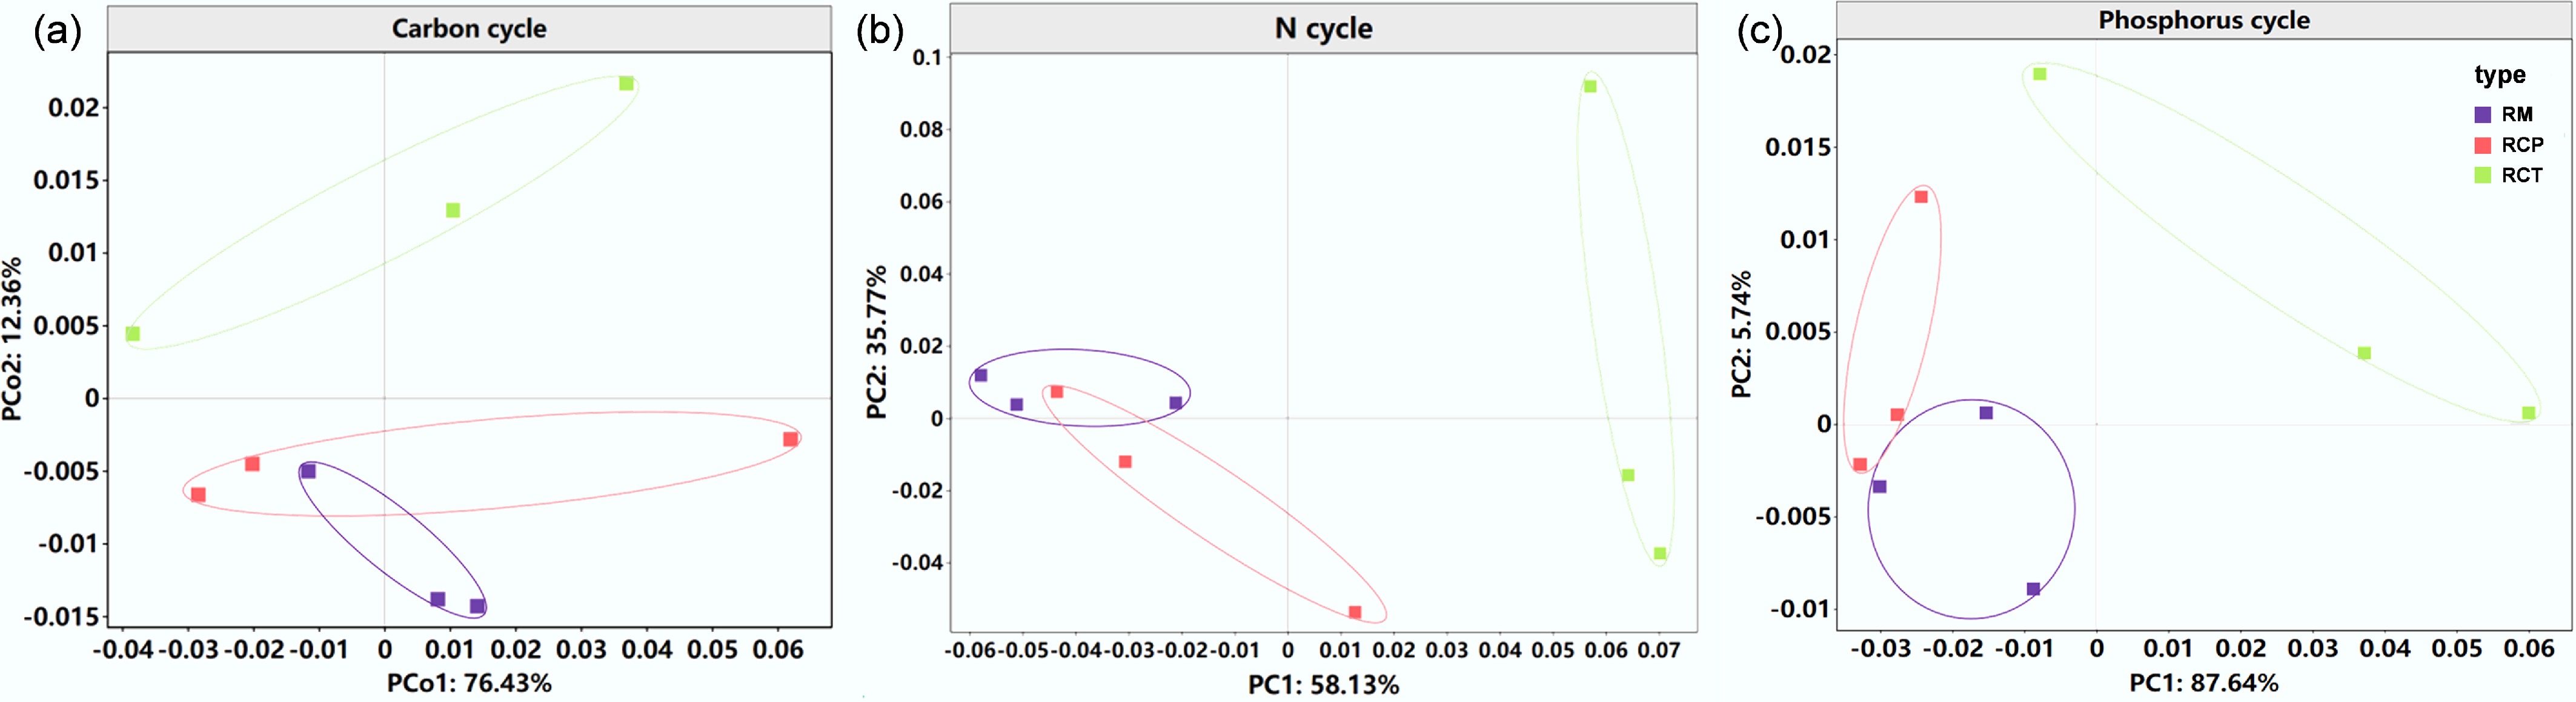
Figure 1.
Microbial functional characteristics of (a) soil C, (b) N, and (c) P cycles identified by principal coordinates analysis (PCoA) based on Bray-Curtis distances. RM: rice monoculture; RCP: paddy field of rice-crayfish farming system; RCT: the peripheral trench of rice-crayfish farming system.
-
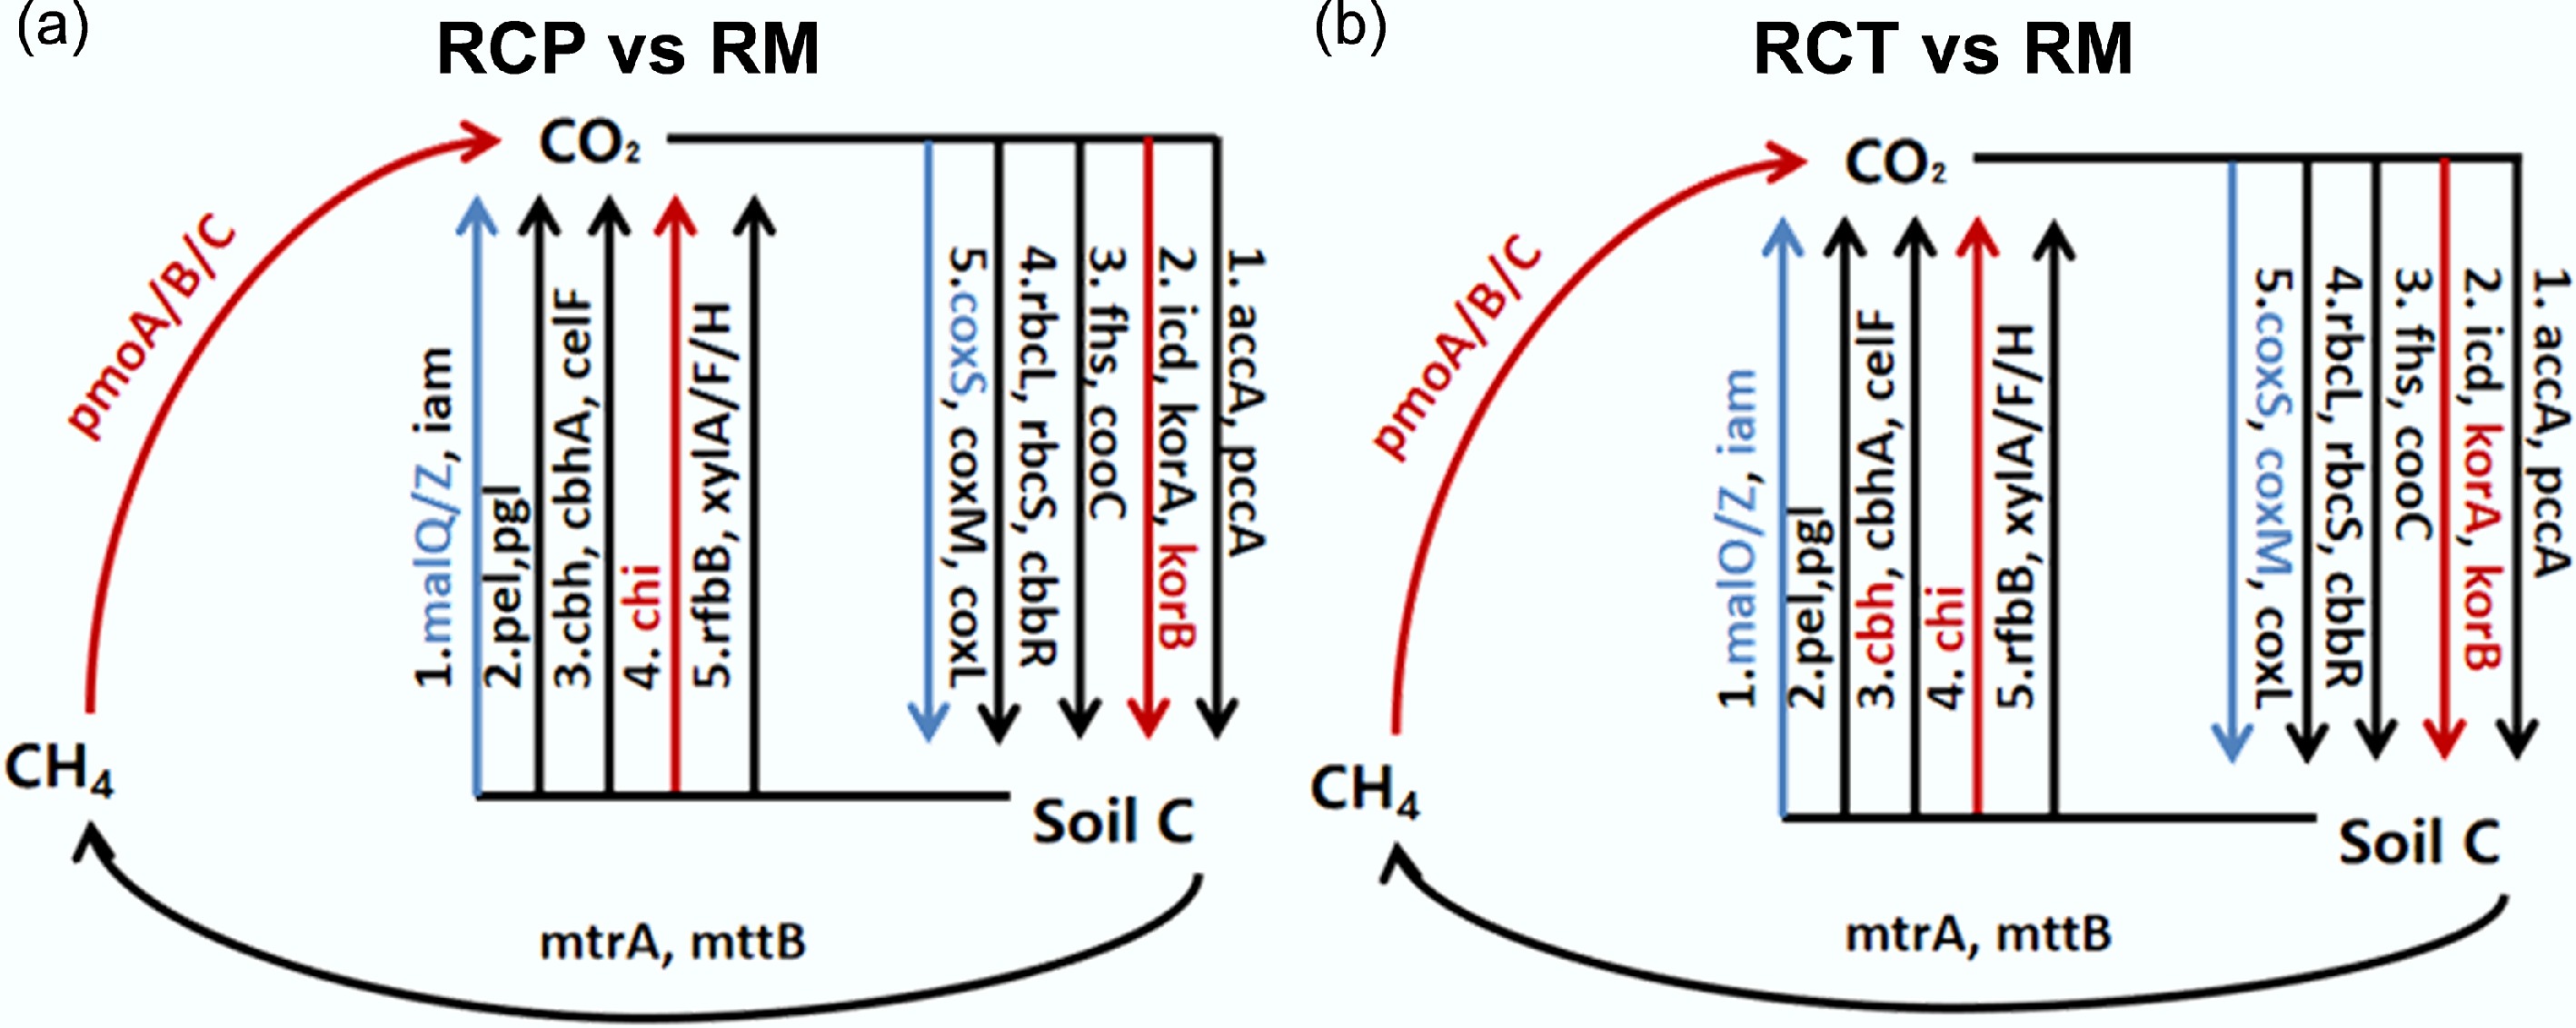
Figure 2.
Diagram depicting the different carbon cycling processes based on metagenomic sequencing. Red indicates that gene abundances were significantly and consistently increased in the former treatment; blue indicates that gene abundances were significantly and consistently decreased in the former treatment. RM: rice monoculture; RCP: paddy field of rice-crayfish farming system; RCT: the peripheral trench of rice-crayfish farming system.
-
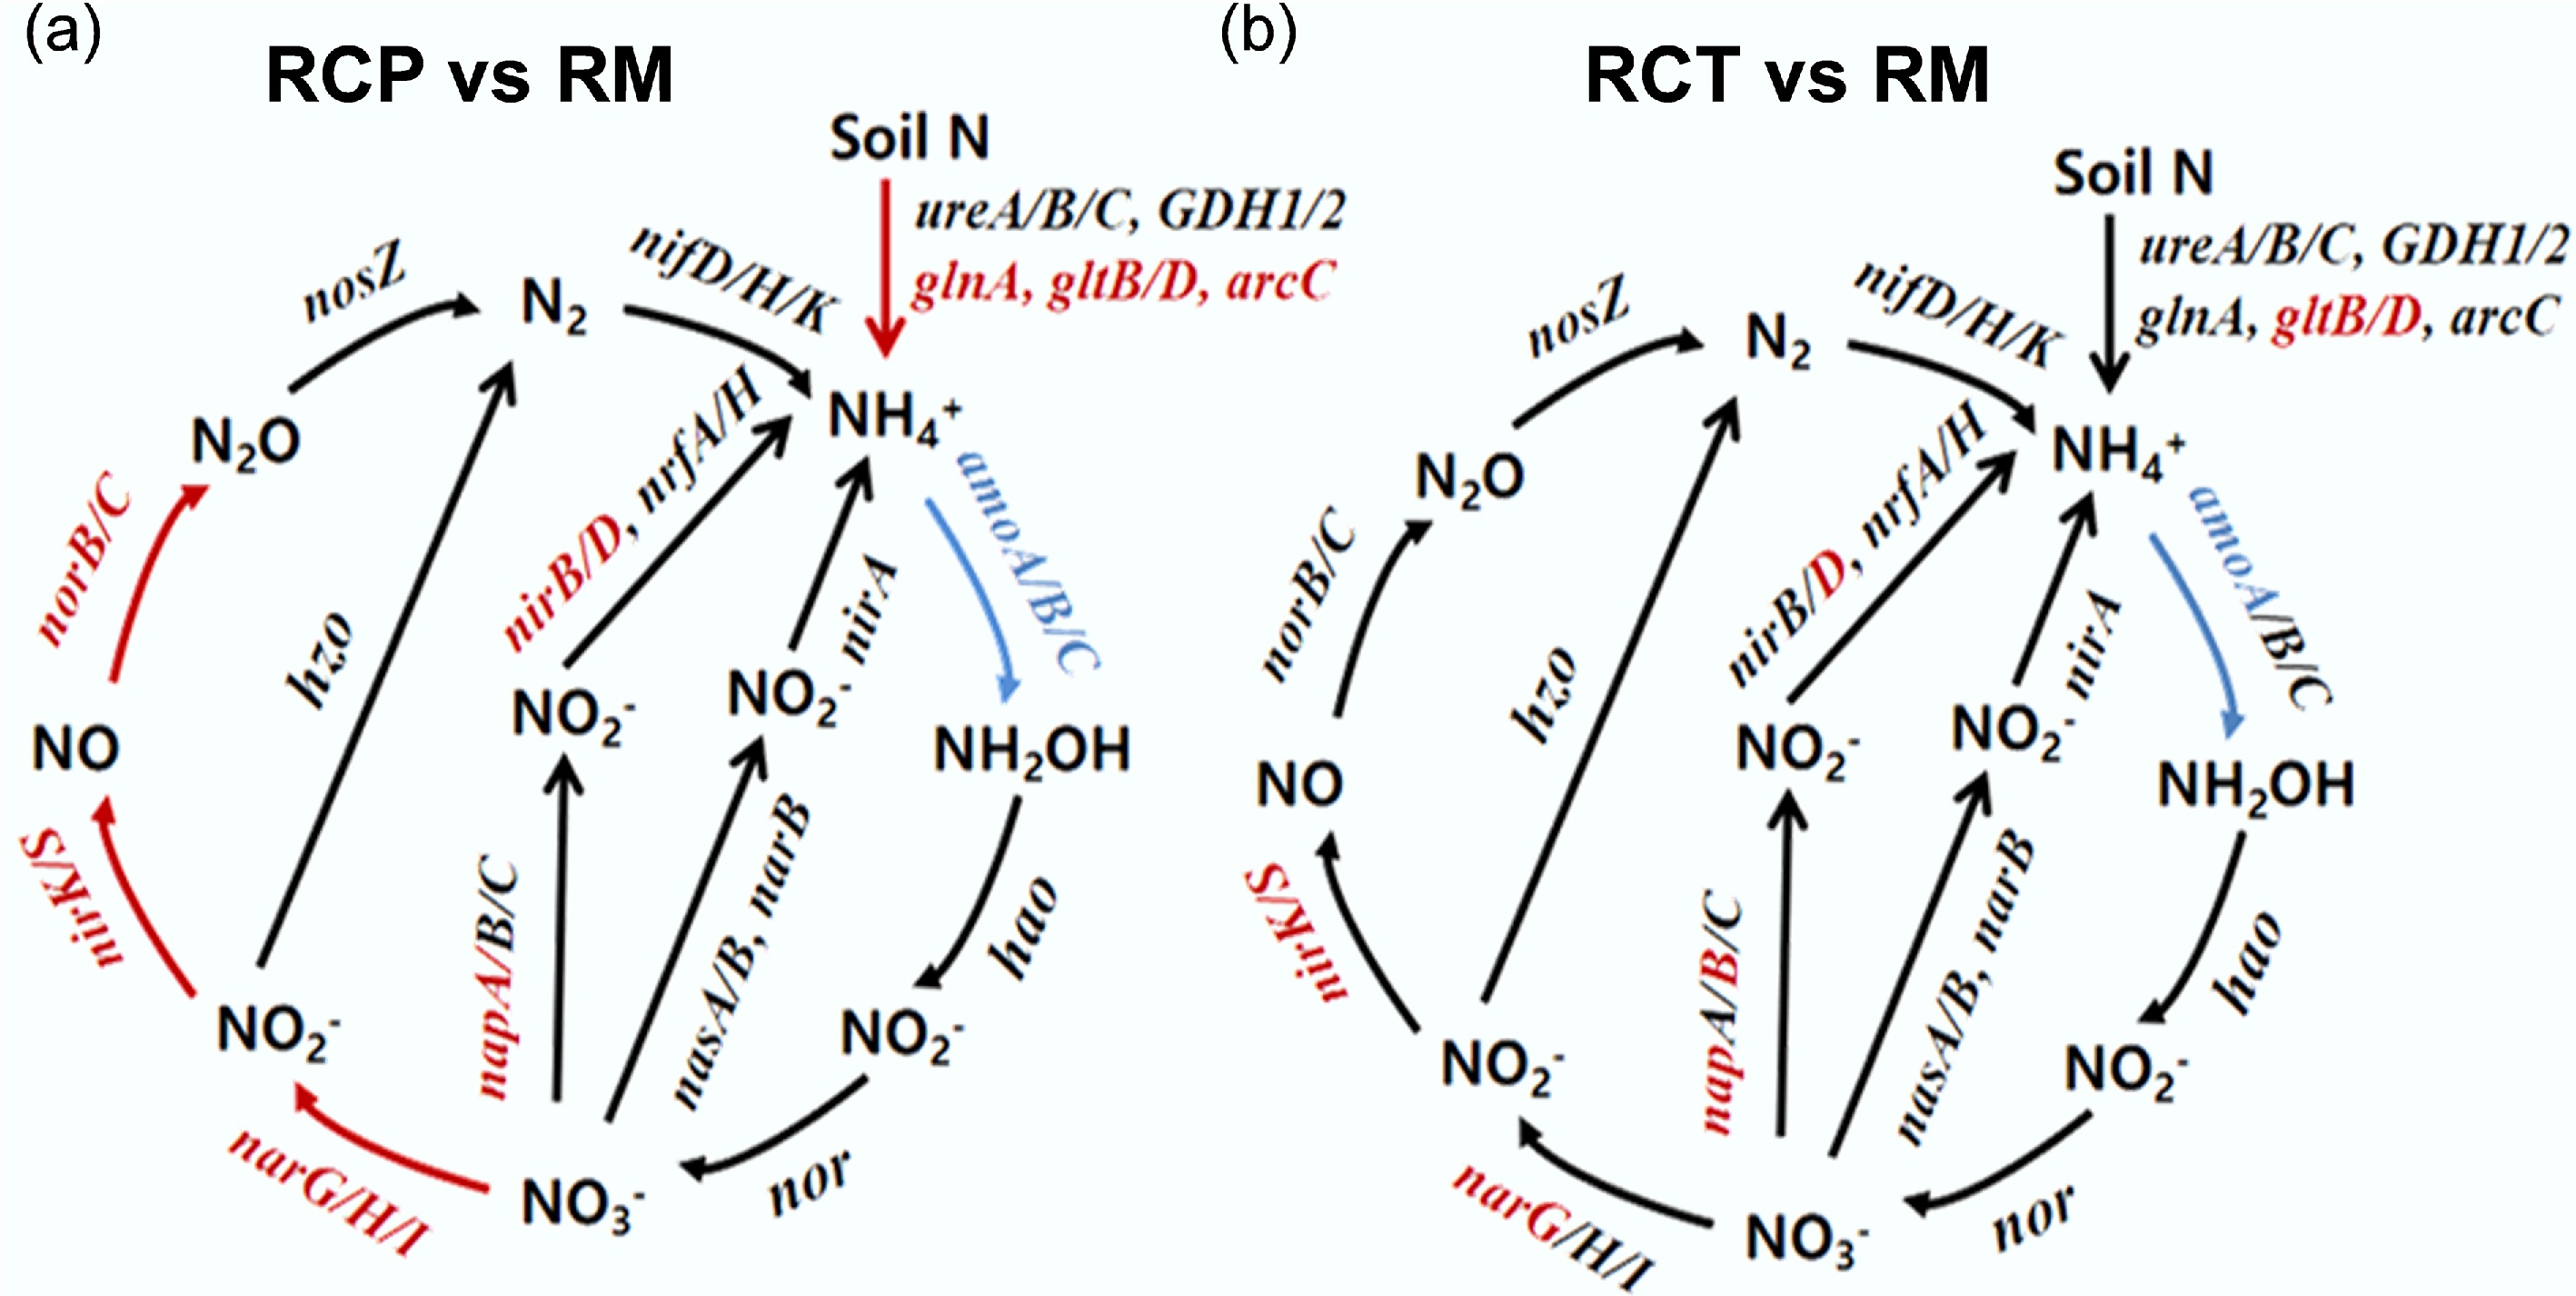
Figure 3.
Diagram depicting the different nitrogen cycling processes based on metagenomic sequencing. Red indicates that the gene abundances were significantly and consistently increased in the former treatment, blue indicates that the gene abundances were significantly and consistently decreased in the former treatment. RM: rice monoculture; RCP: paddy field of rice-crayfish farming system; RCT: the peripheral trench of rice-crayfish farming system.
-
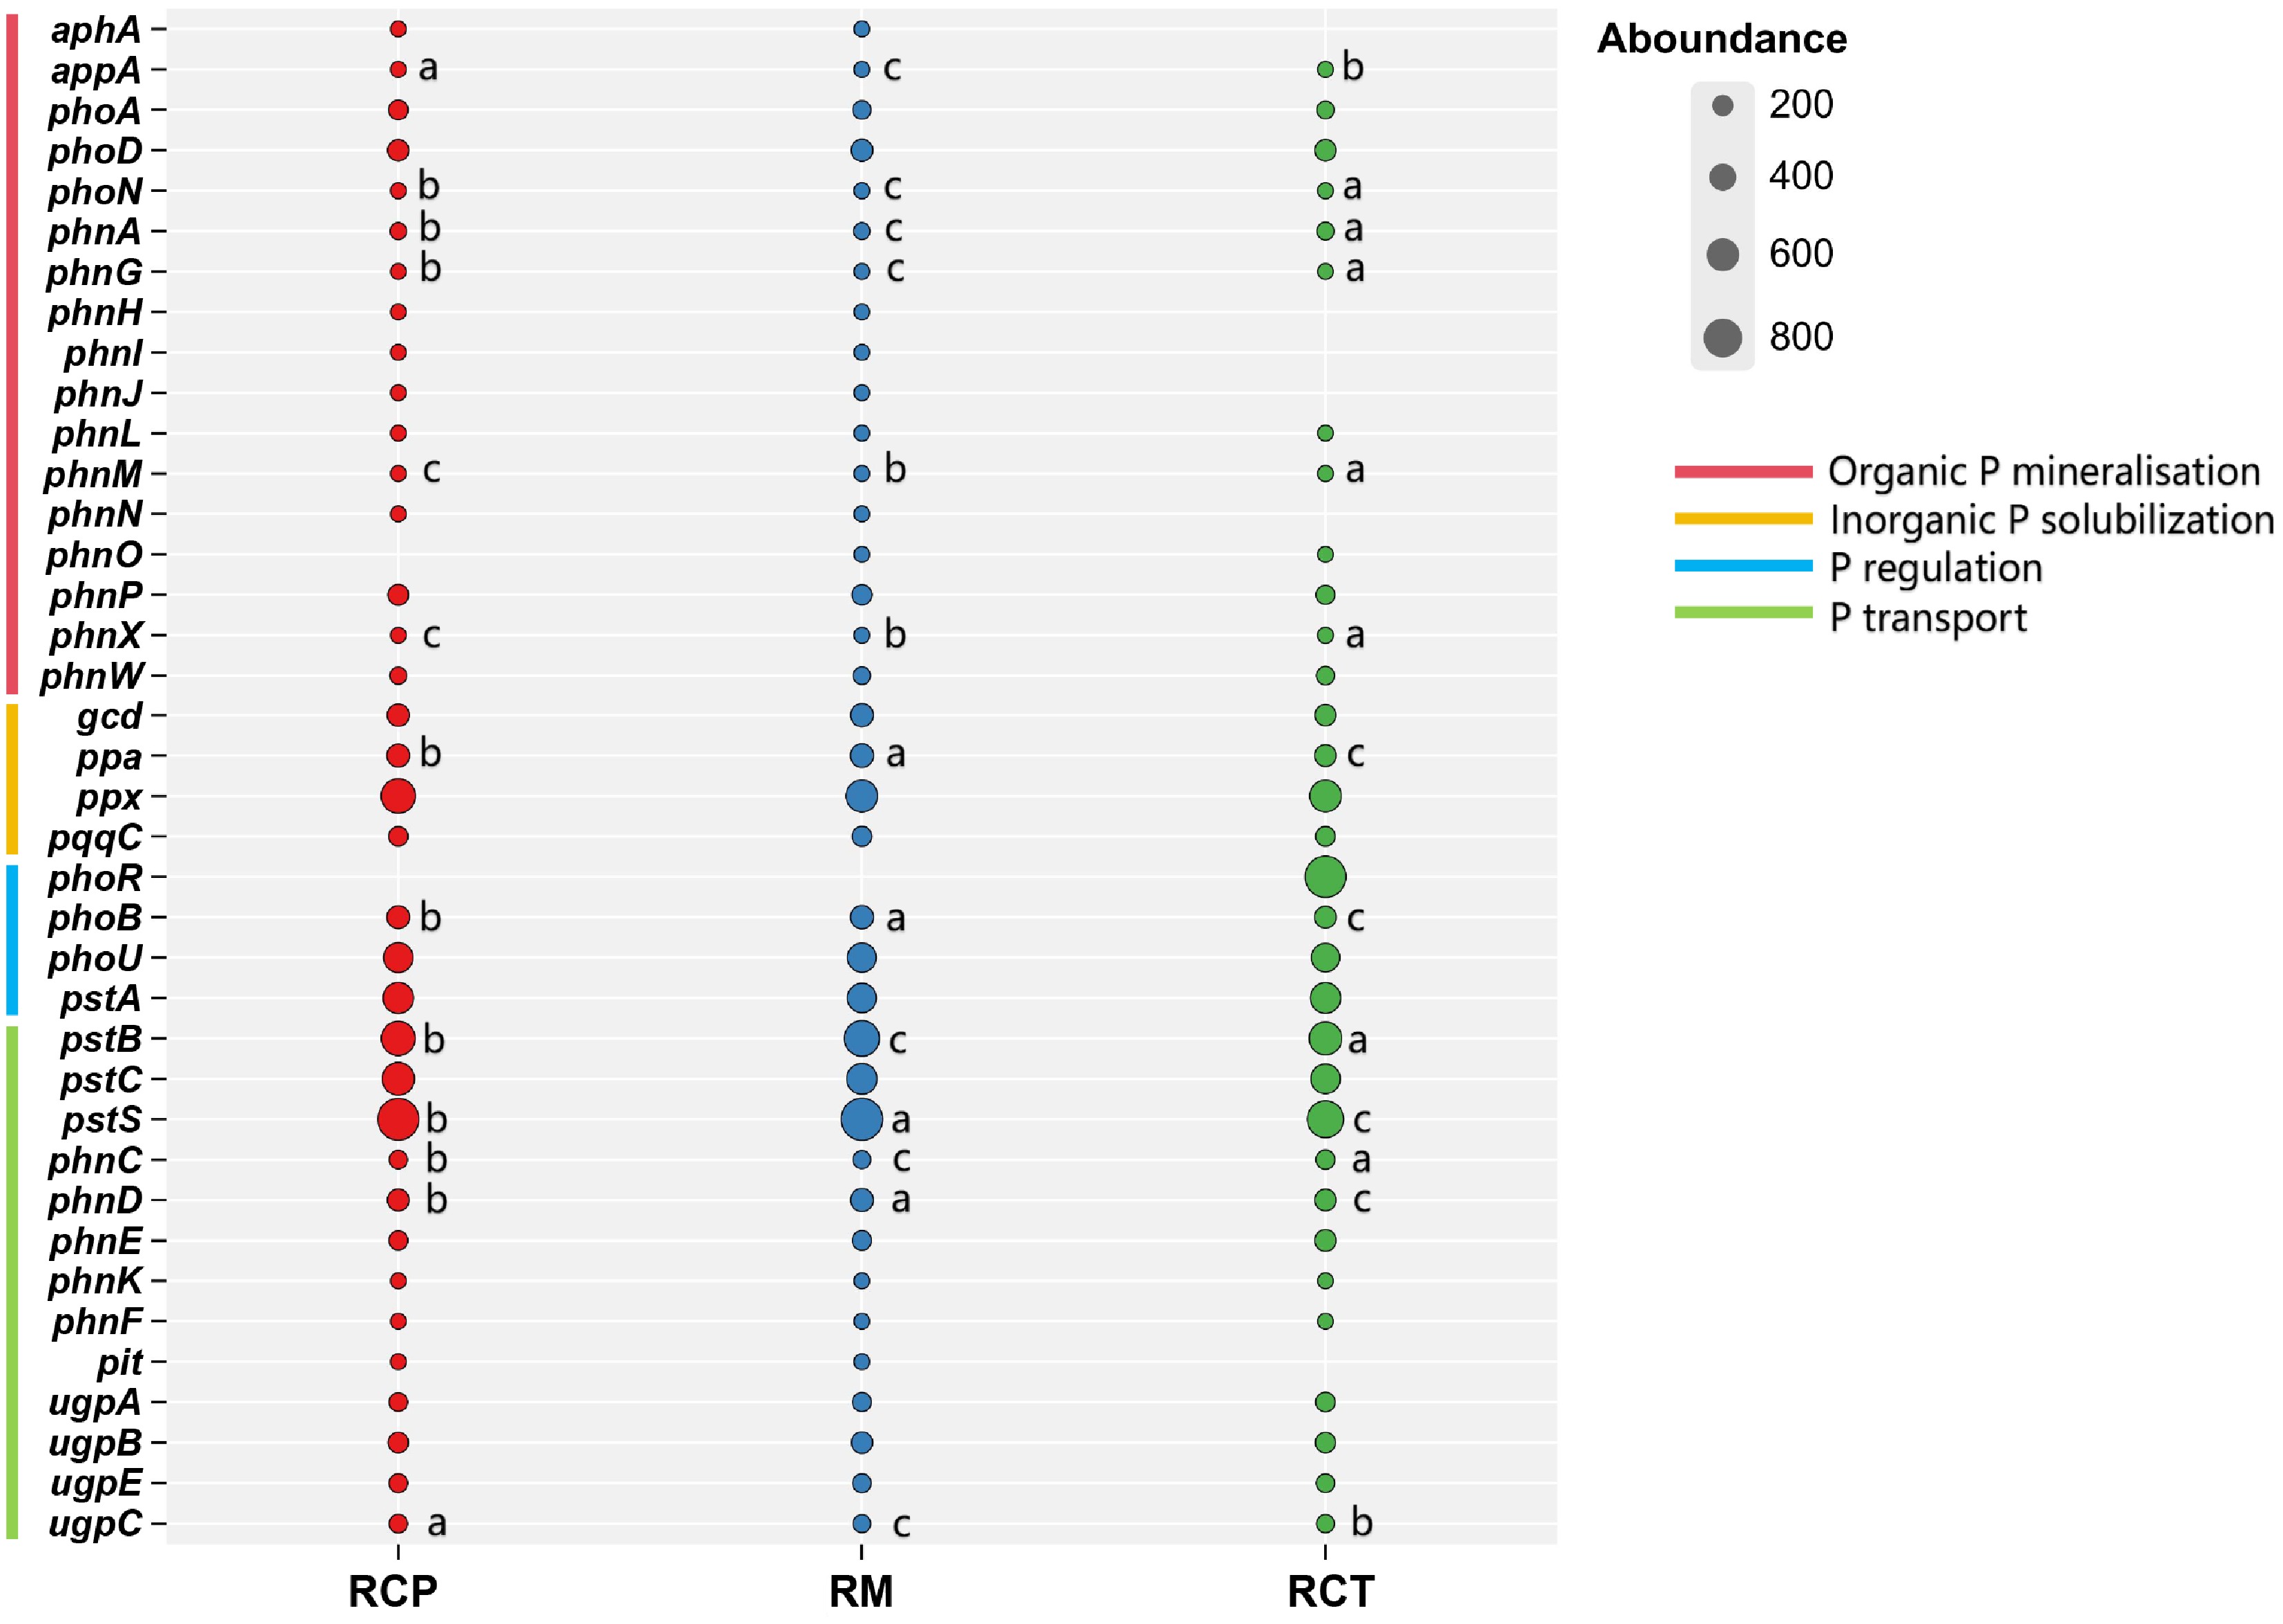
Figure 4.
Difference of soil P cycle gene in different rice farming systems. RM: rice monoculture; RCP: paddy field of rice-crayfish farming system; RCT: the peripheral trench of rice-crayfish farming system.
-
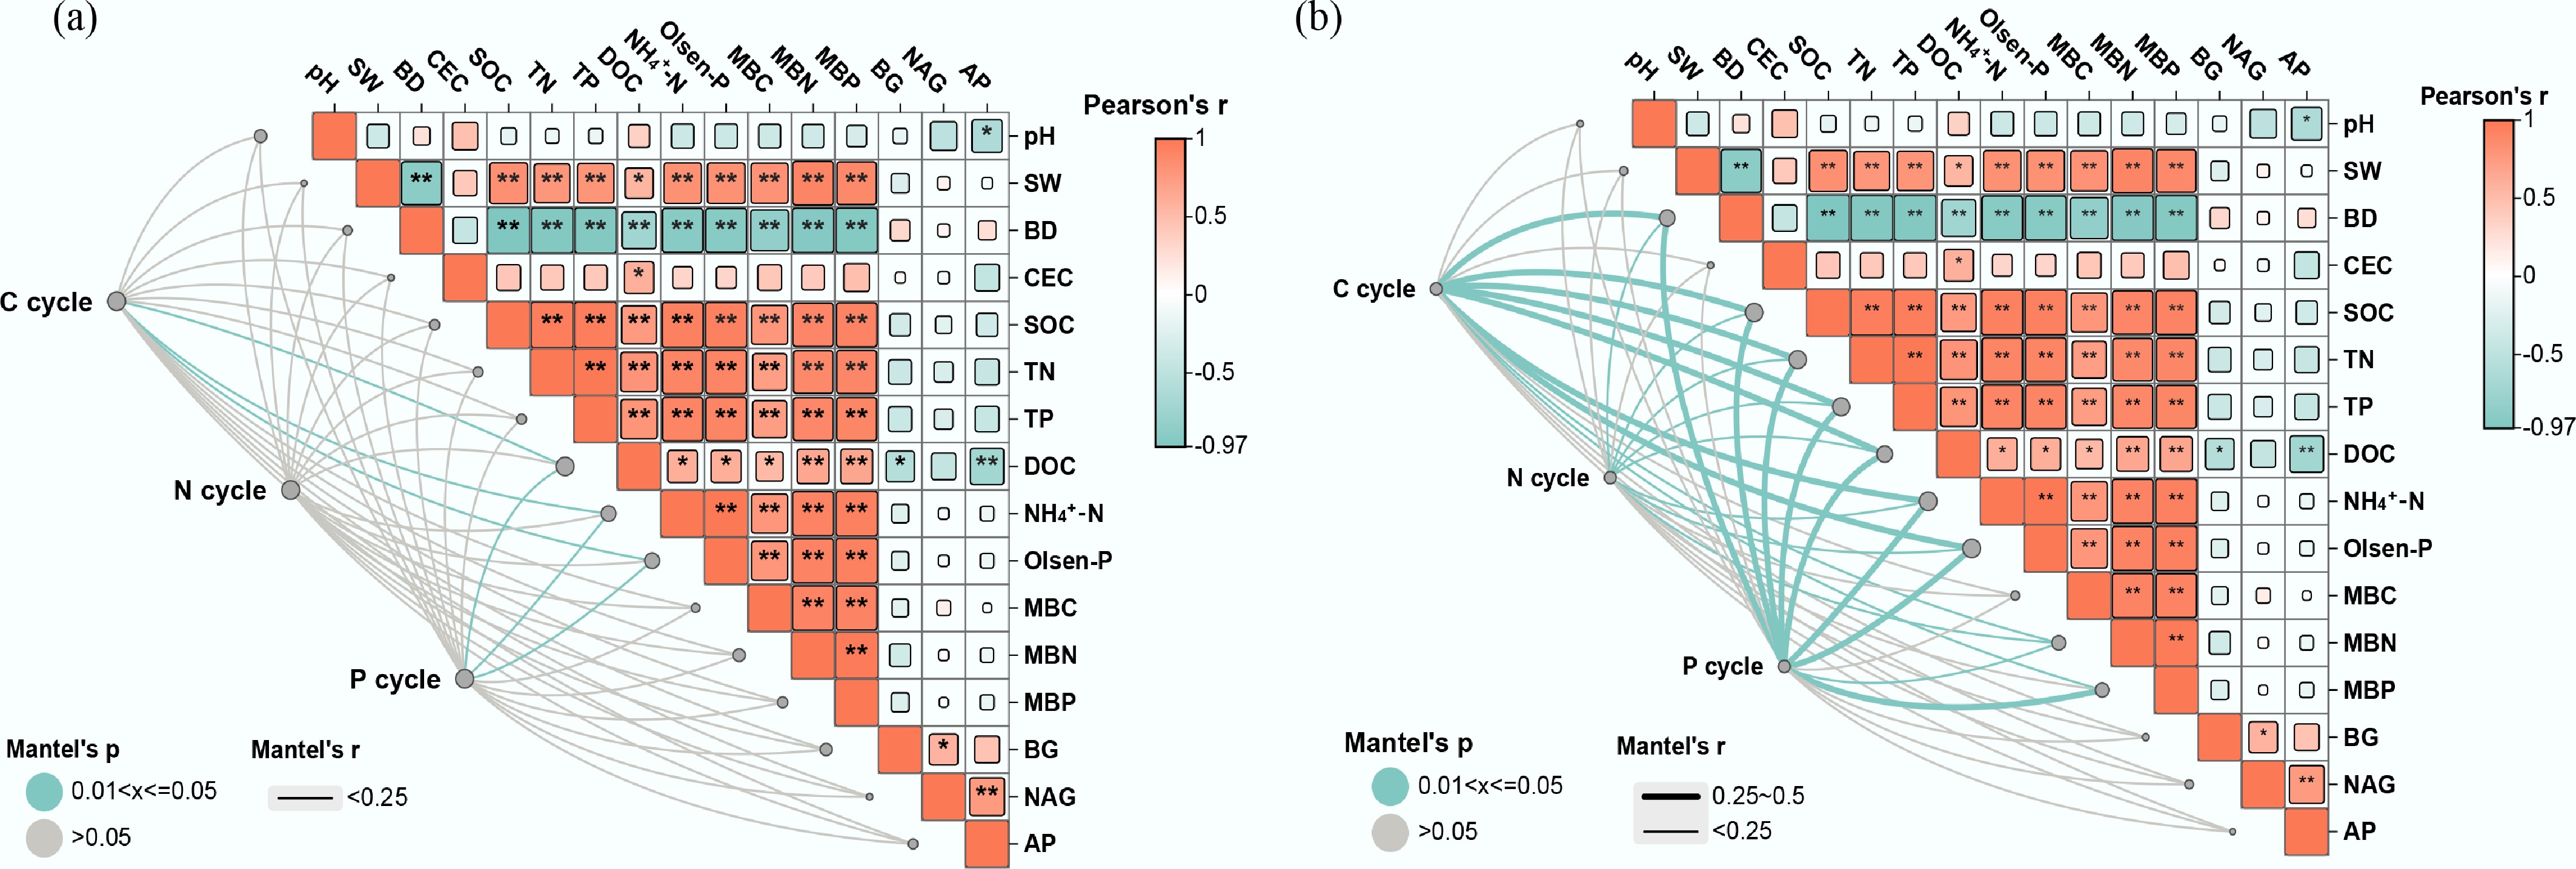
Figure 5.
Environmental drivers of (a) soil microbial functional genes, and (b) taxa in different rice farming systems. RM: rice monoculture; RCP: paddy field of rice-crayfish farming system; RCT: the peripheral trench of rice-crayfish farming system.
-
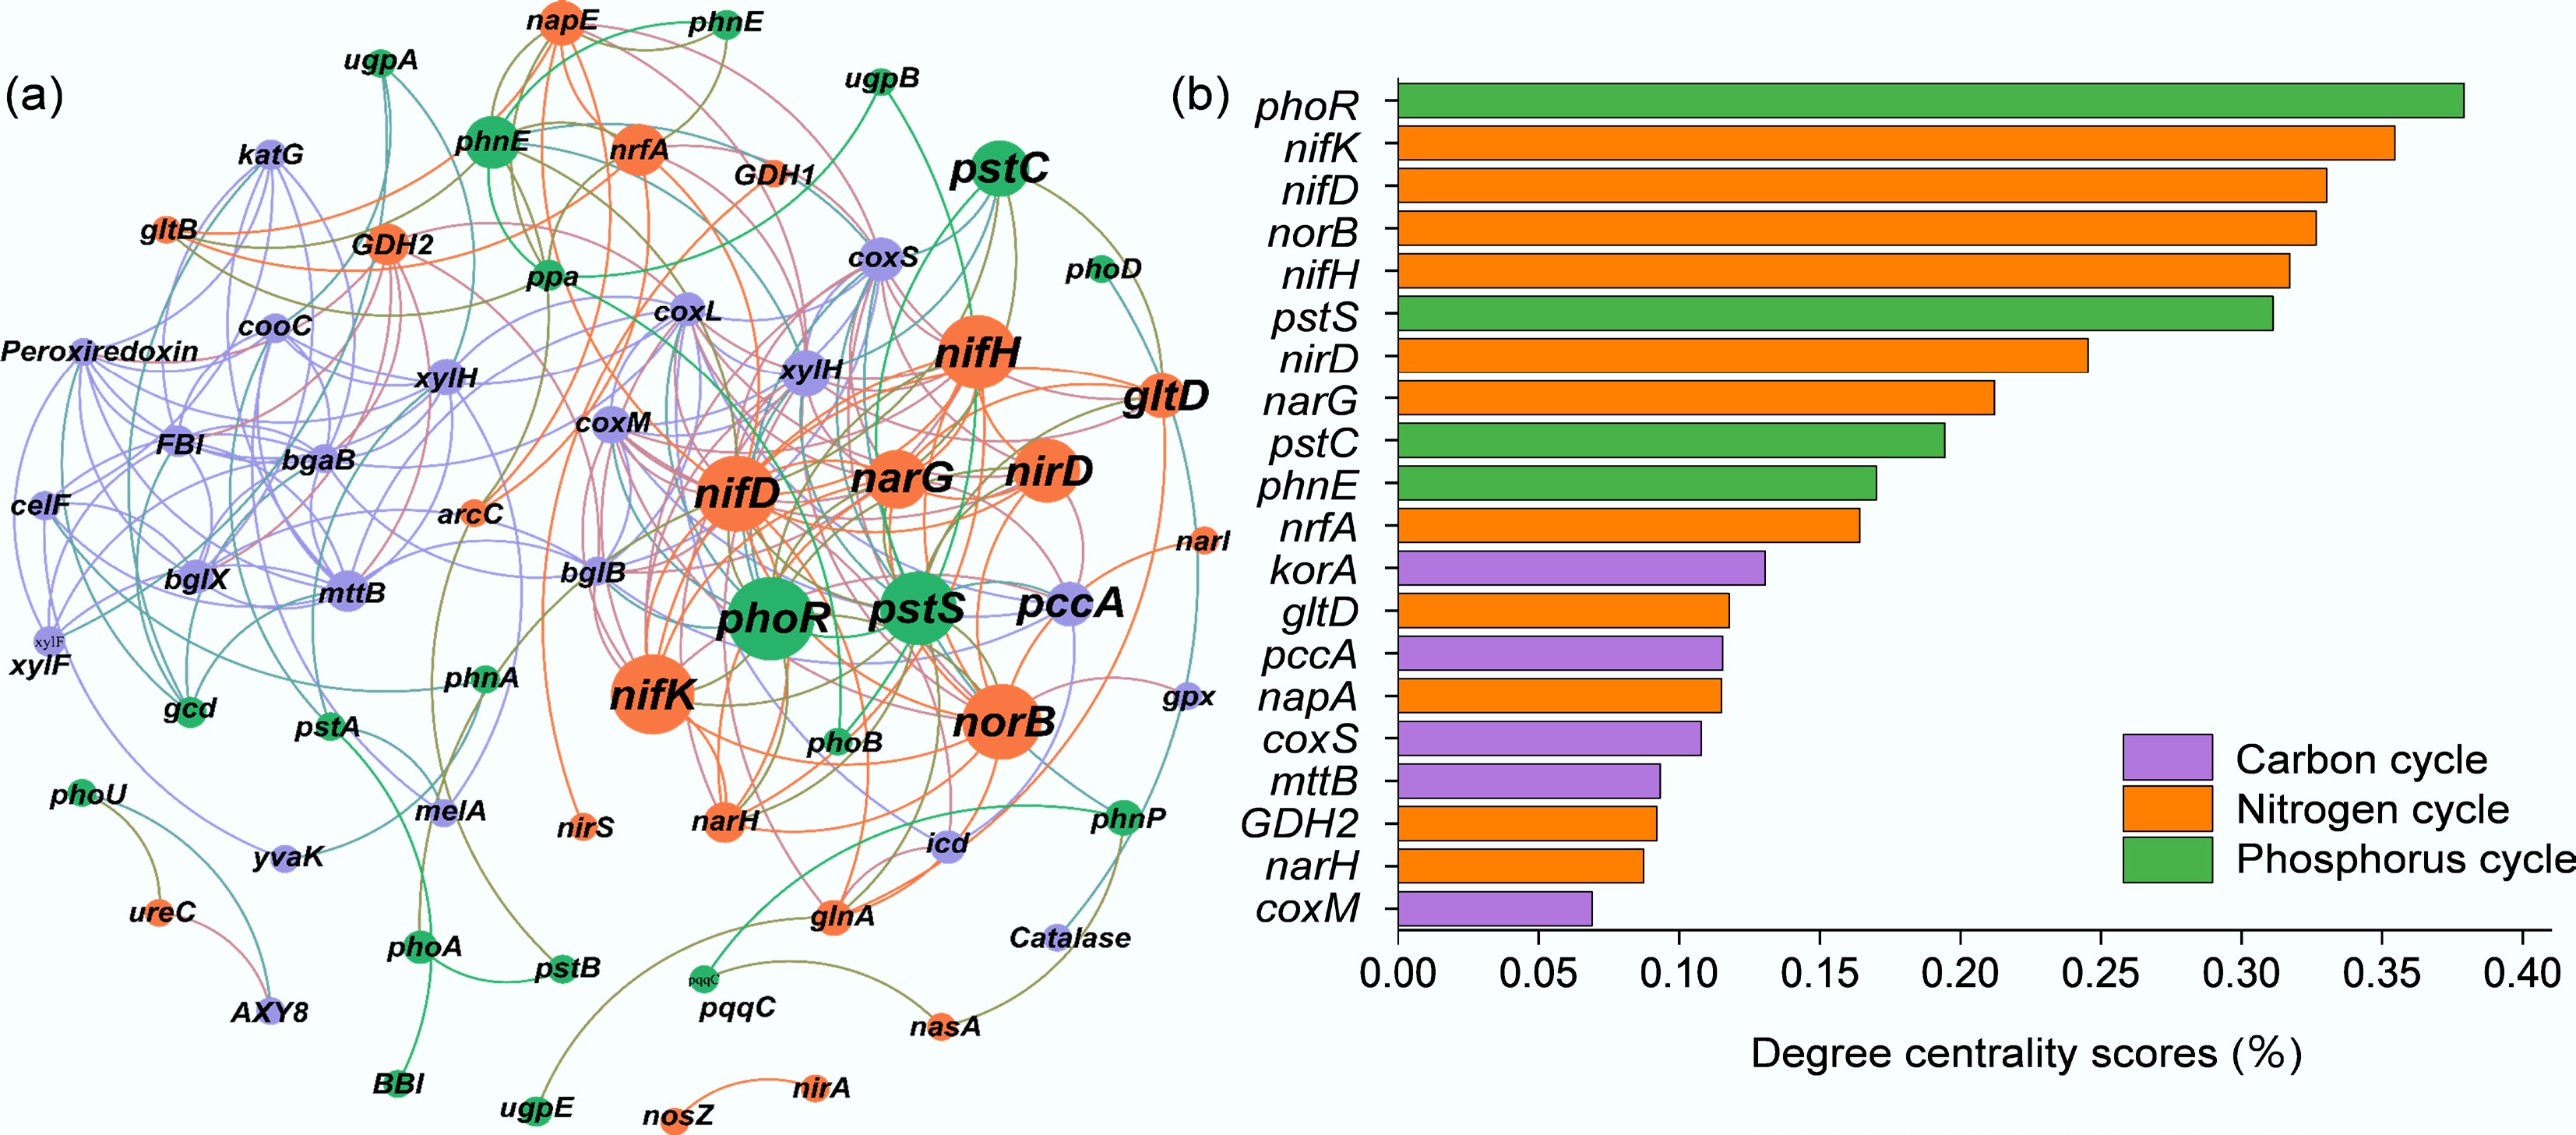
Figure 6.
Network analysis between genes related to (a) carbon, nitrogen, and phosphorus cycling genes, and (b) degree centrality scores for different rice farming systems. RM: rice monoculture; RCP: paddy field of rice-crayfish farming system; RCT: the peripheral trench of rice-crayfish farming system.
Figures
(6)
Tables
(0)