-
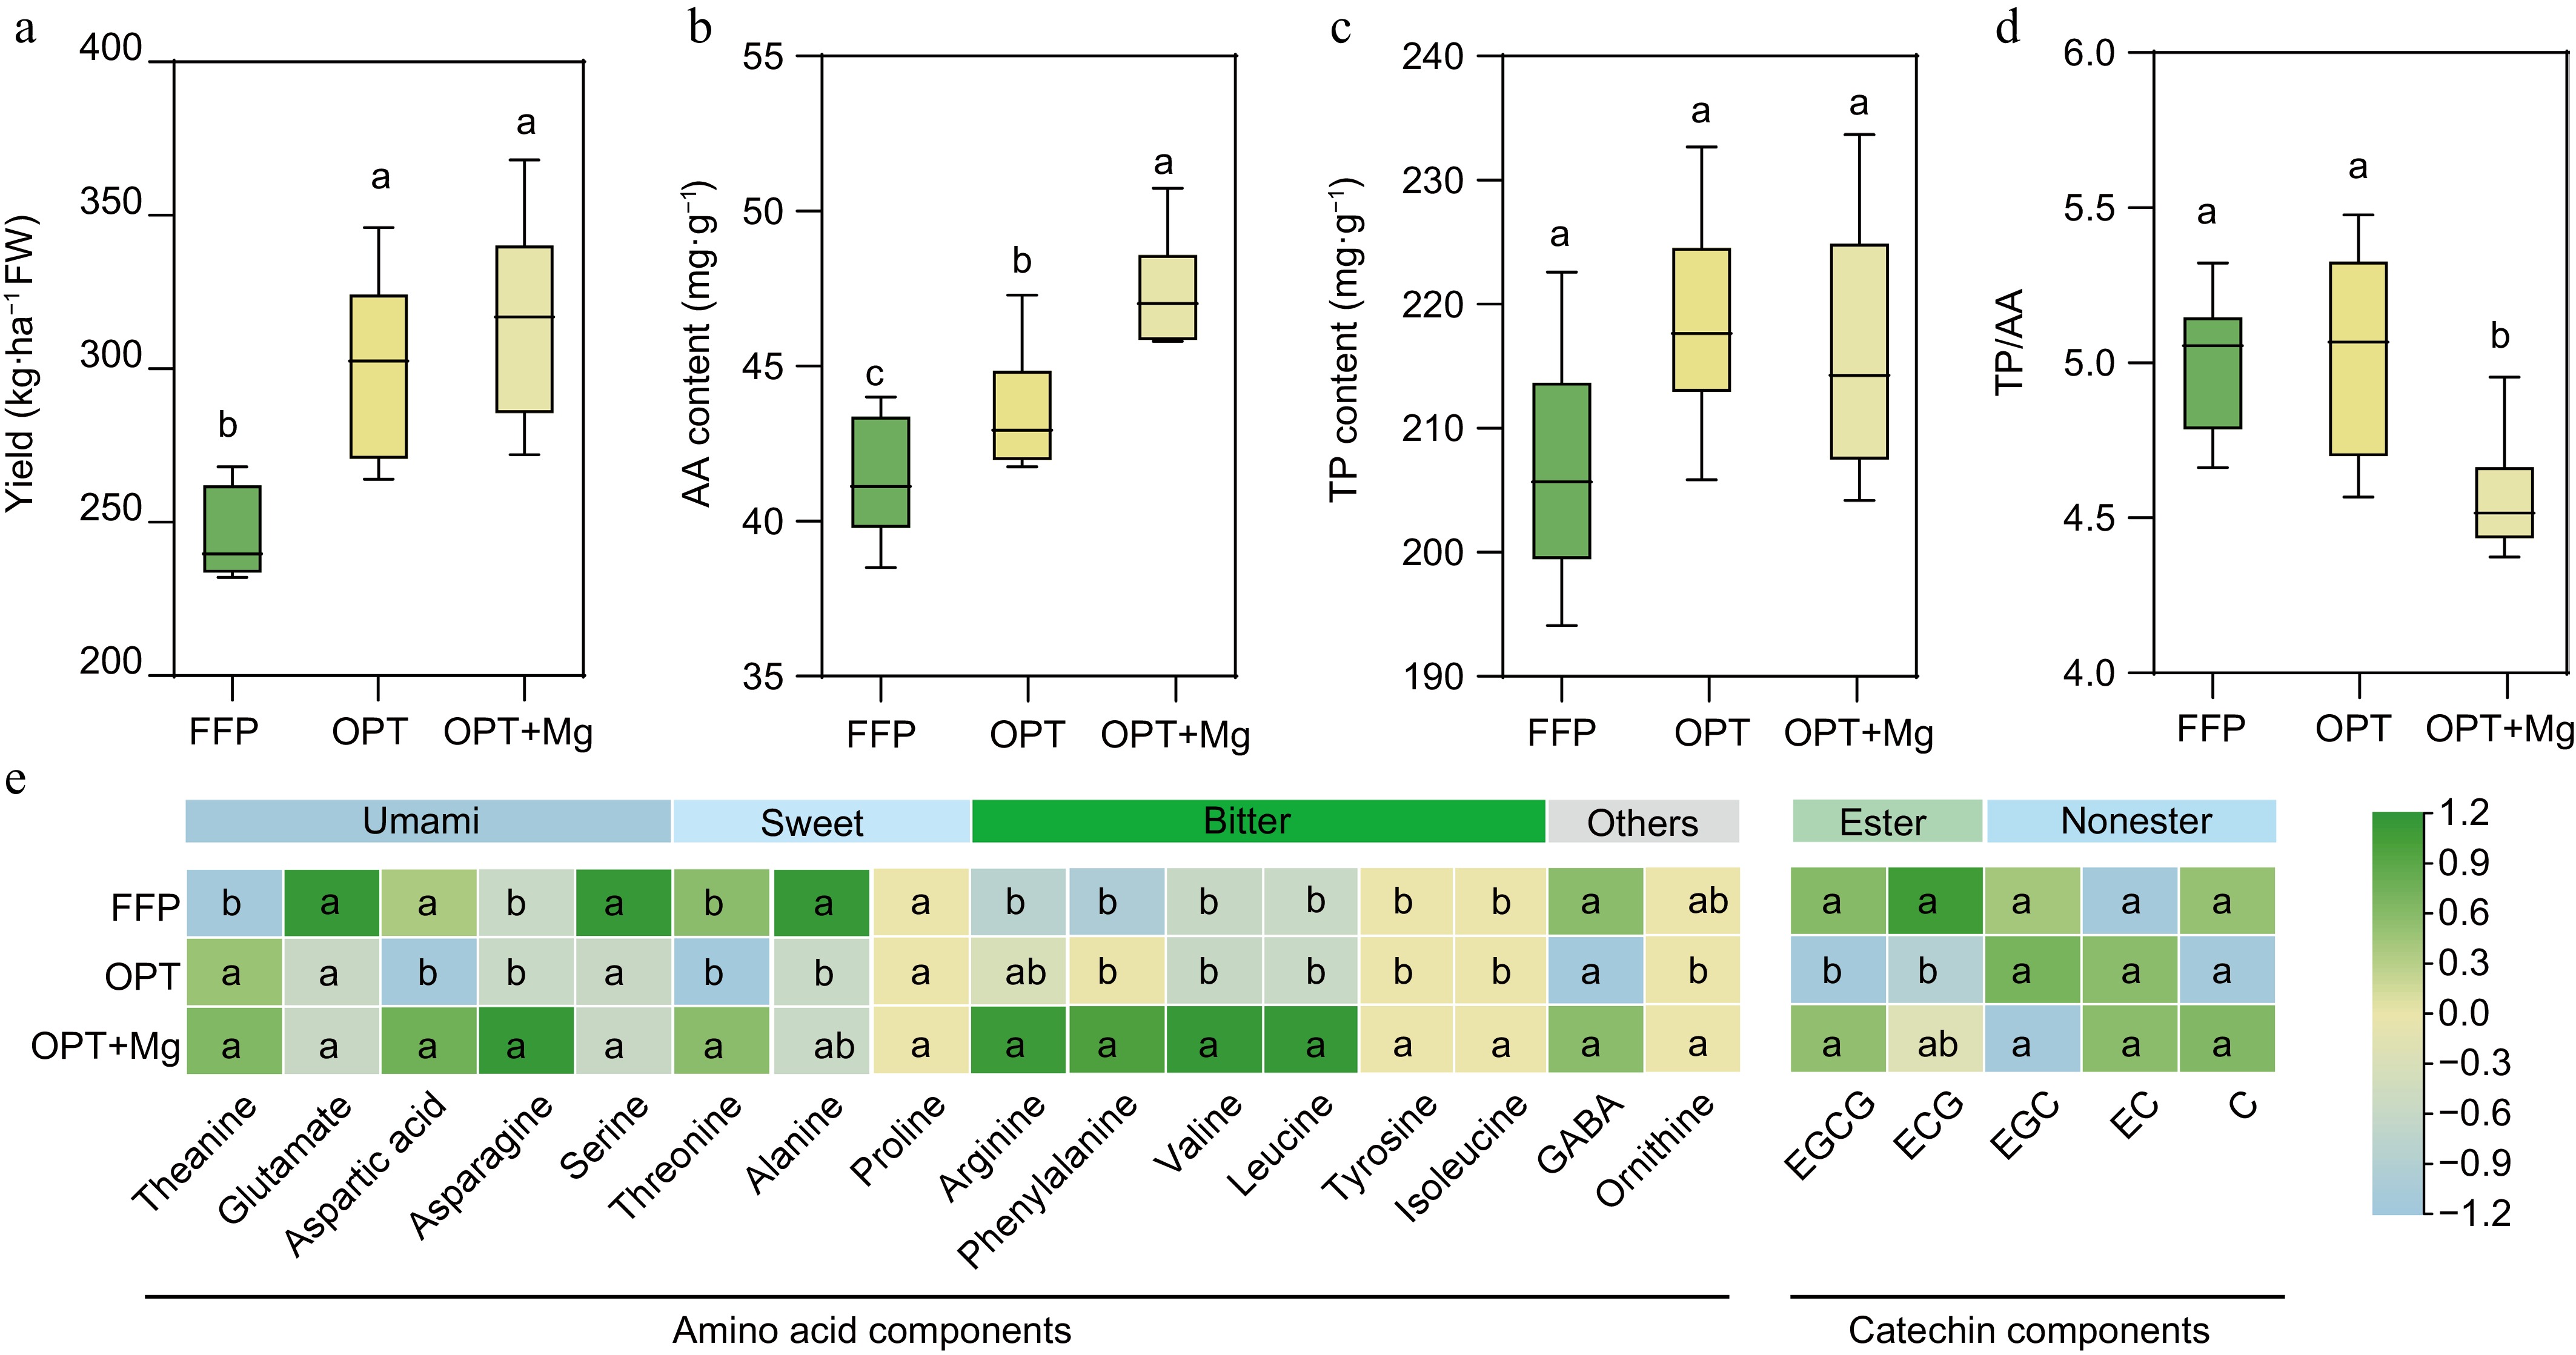
Figure 1.
The yield and quality of Anji Baicha across three soil fertilization regimens. (a) Yield. (b) Total free amino acid (AA) content of the shoots. (c) Total protein (TP) content of the shoots. (d) AA/TP ratio. (e) Heatmap depicting the contents of AA and catechins in the shoots. The heatmap is based on standardized data. ECG: epicatechin gallate, EC: epicatechin, EGC: epicatechin gallate, EGCG: epigallocatechin gallate, and C: catechin.
-
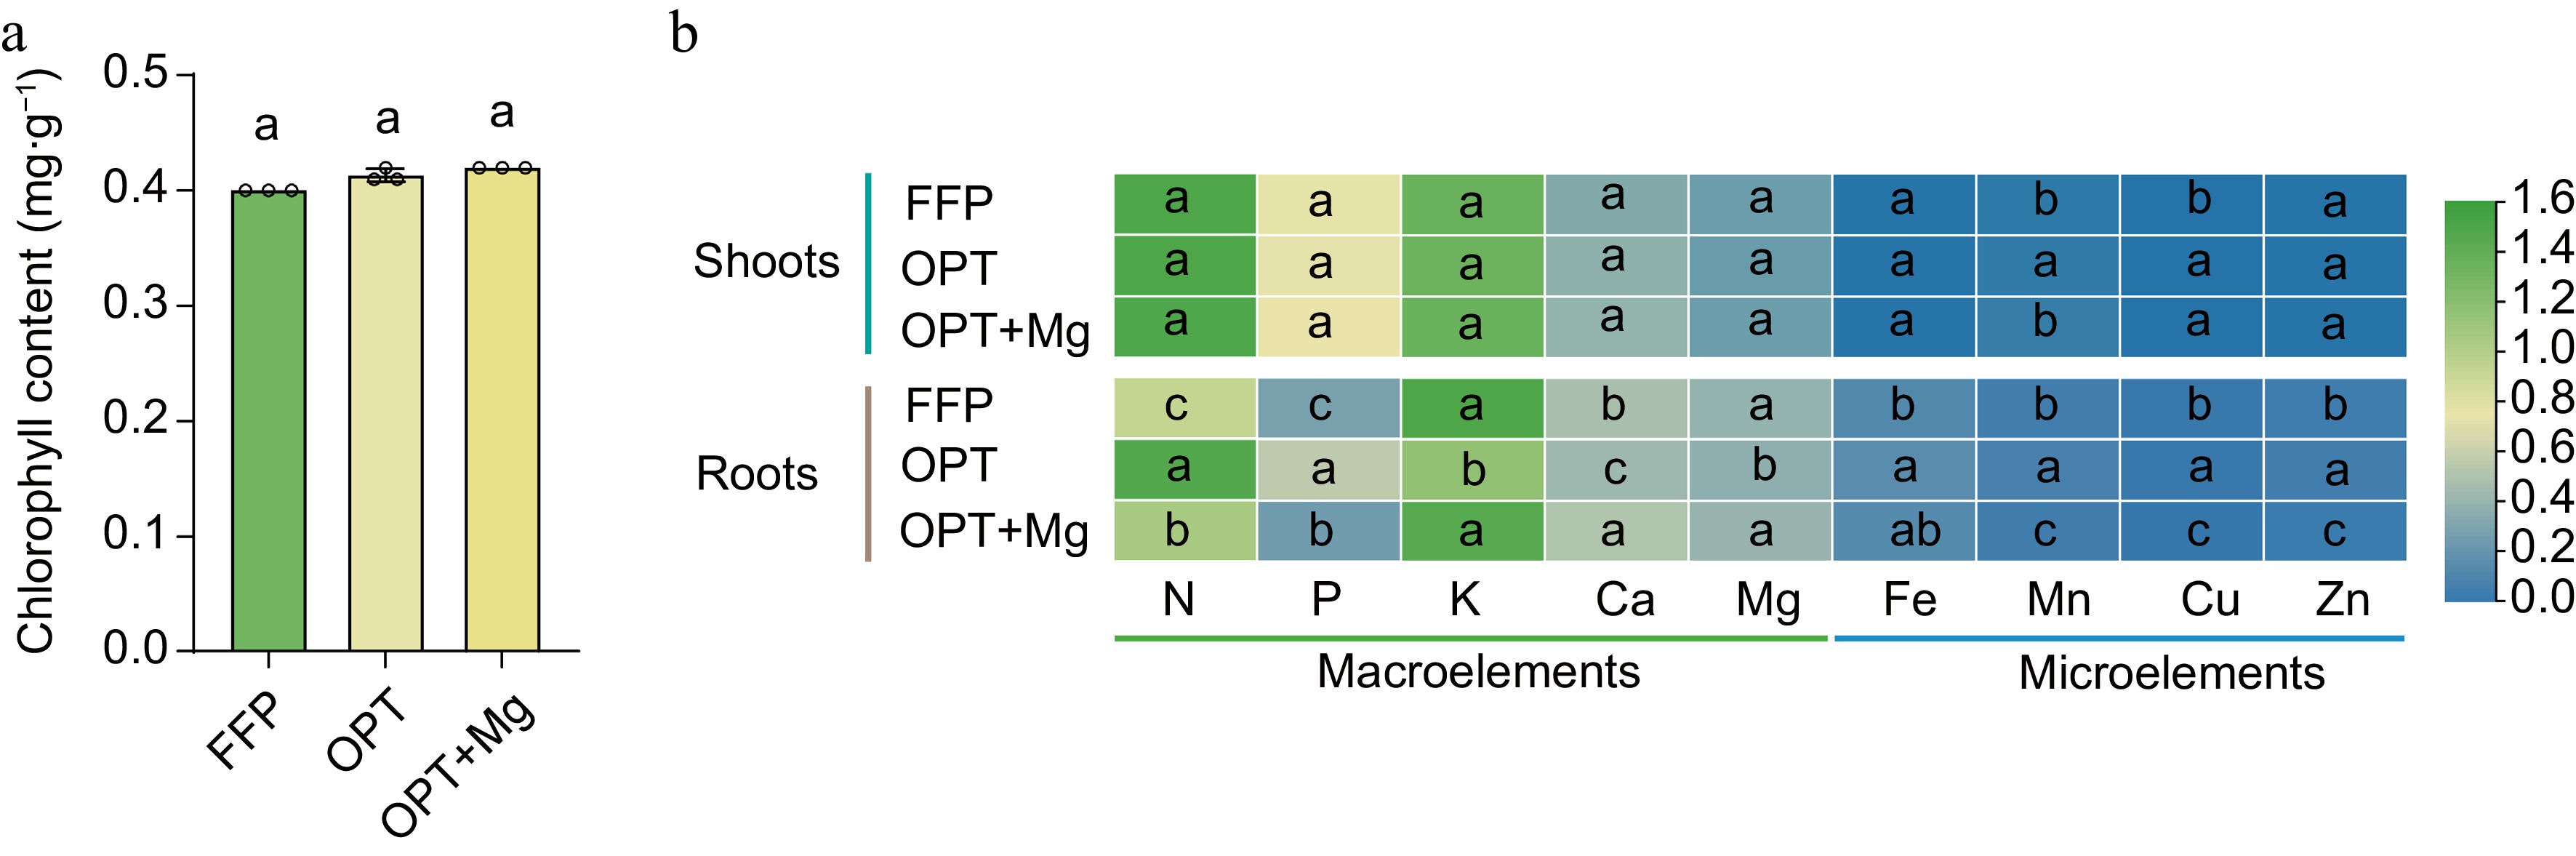
Figure 2.
The content of chlorophyll in the tea shoots and the accumulation patterns of nutrients in the shoots and roots of Anji Baicha across three soil fertilization regimens. (a) Chlorophyll content. (b) Heatmap depicting the content of nutrients in the shoots and roots. The heatmap is based on the log10-transformed data.
-
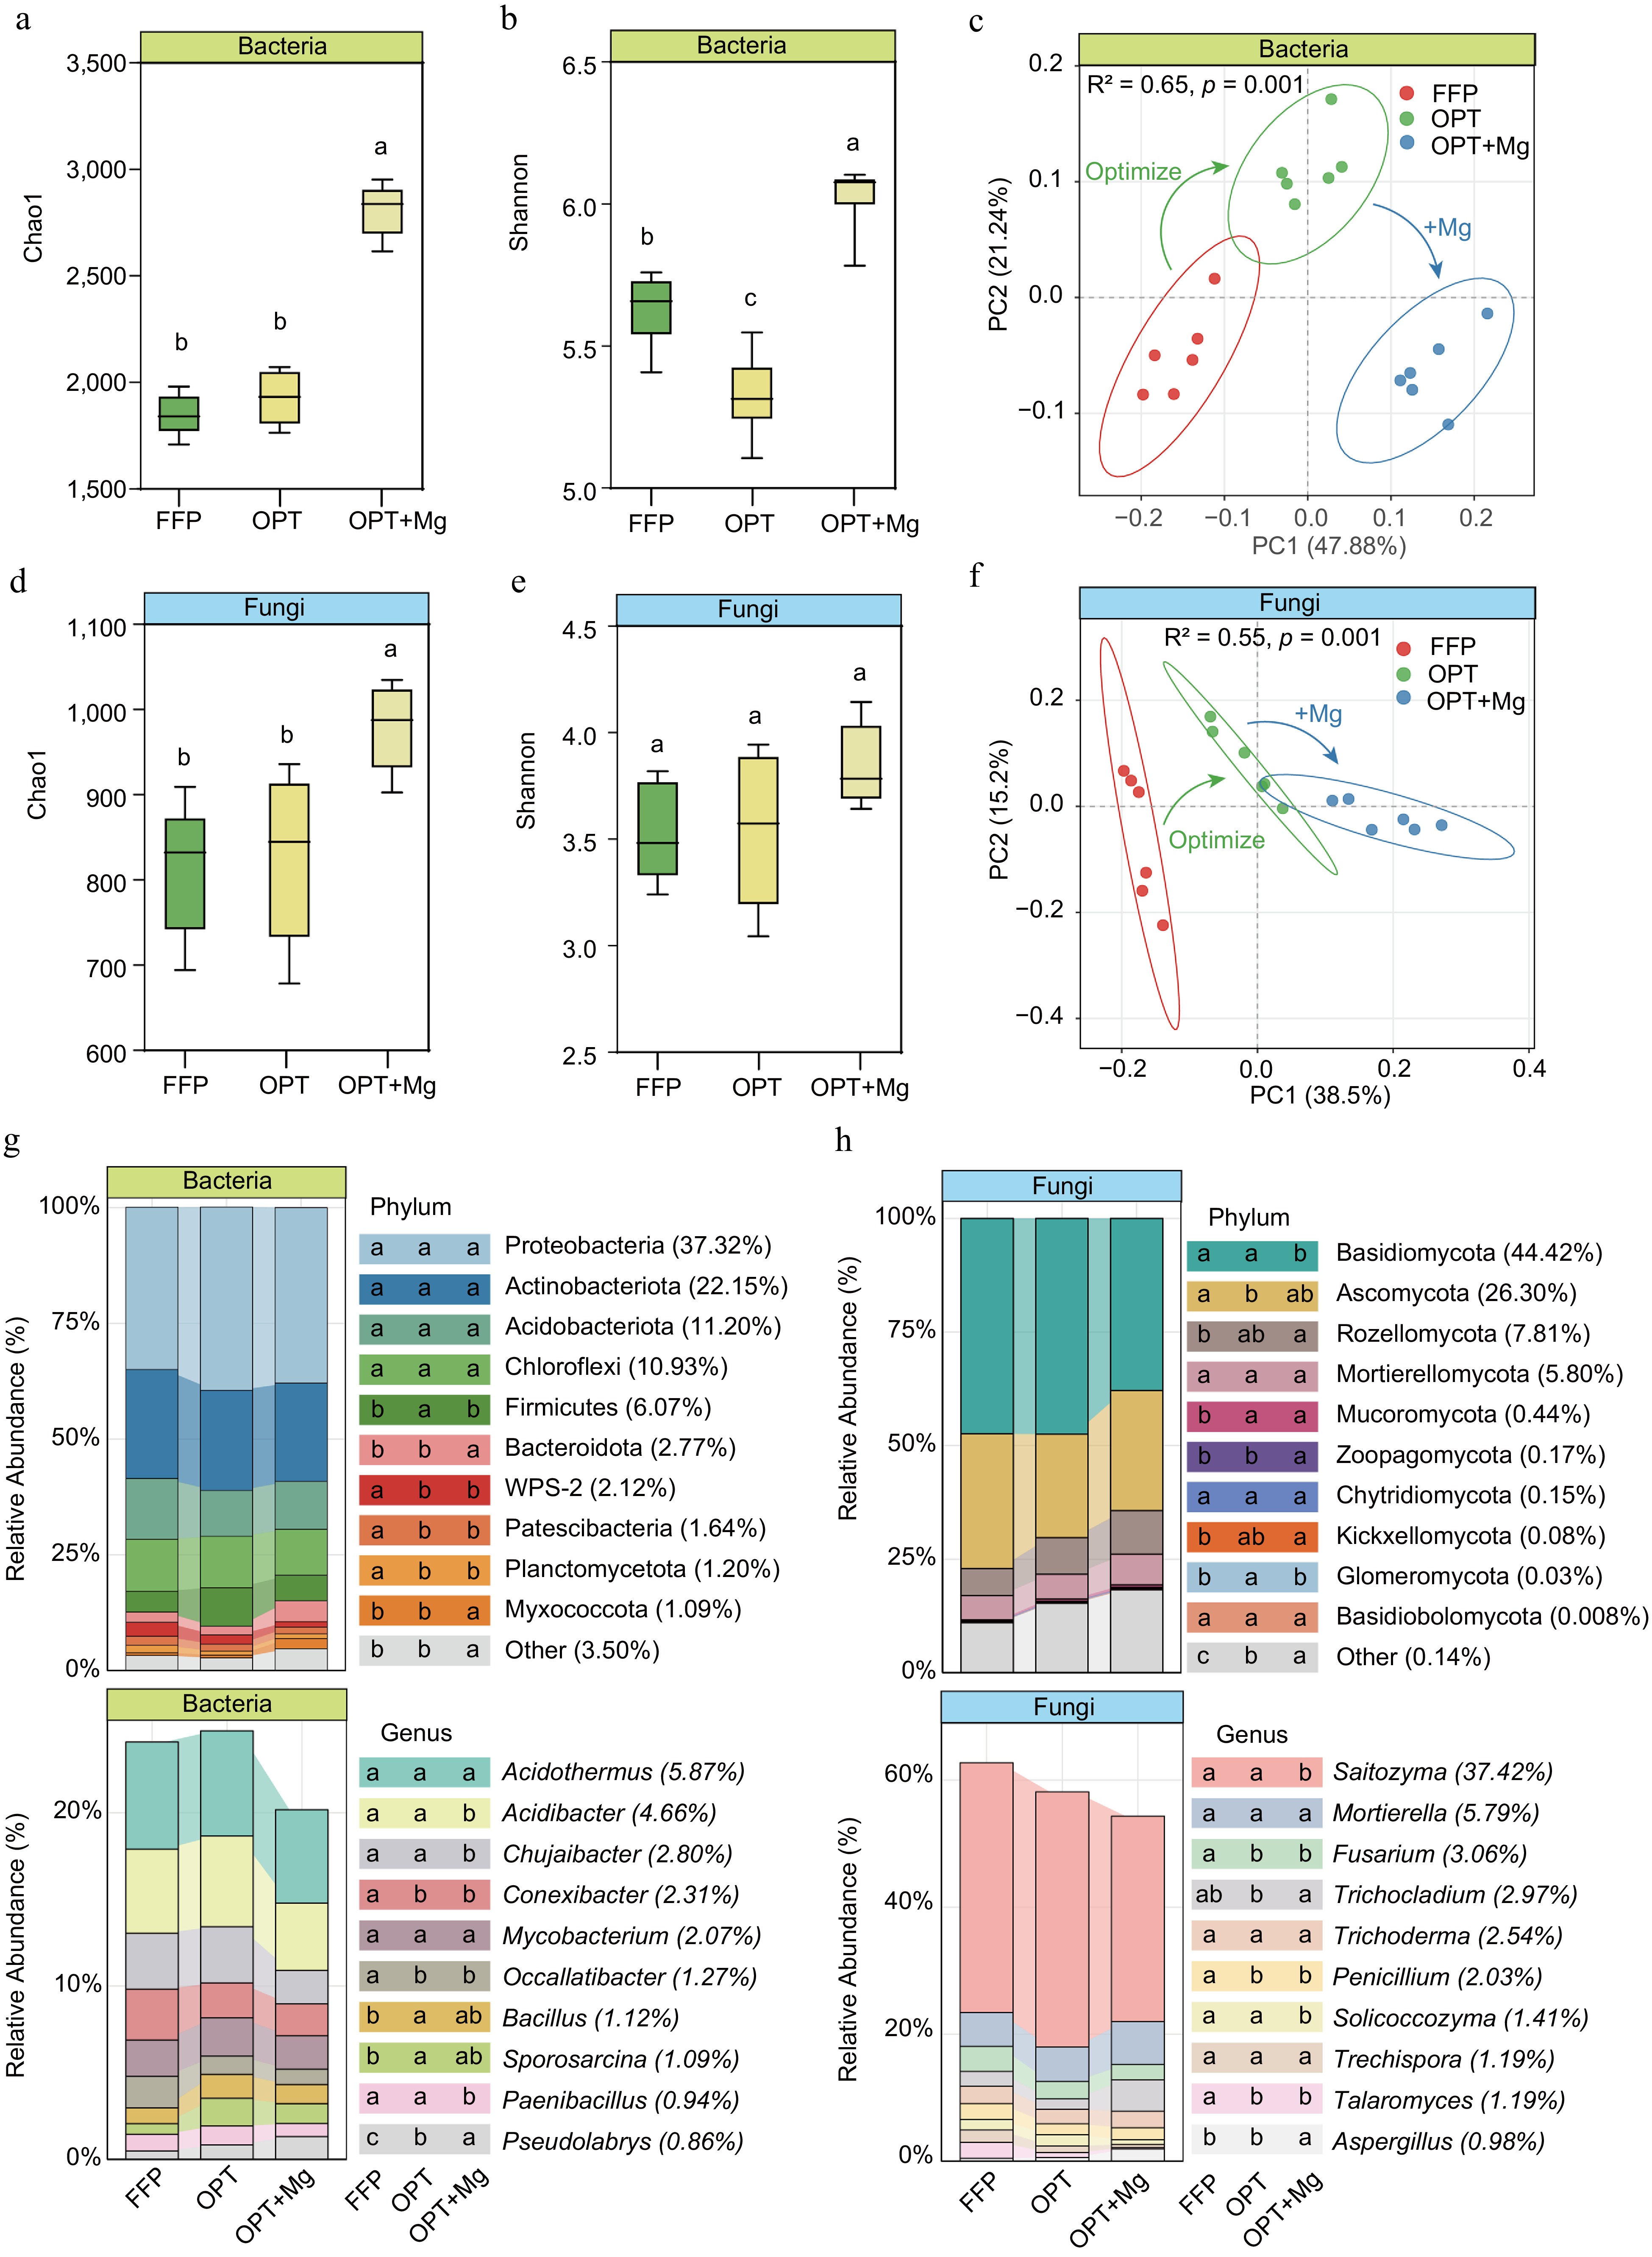
Figure 3.
Soil microbial richness and diversity in Anji Baicha plantations under three fertilization regimens. (a), (d) Chao1 richness estimators. (b), (e) Shannon diversity indices of the bacterial and fungal communities, respectively. (c), (f) PCoA plots (Bray-Curtis distance) showing OTU-level composition of bacterial and fungal communities. (g), (h) The top ten taxonomic groups with the highest relative abundance at the bacterial and fungal phylum and genus levels.
-
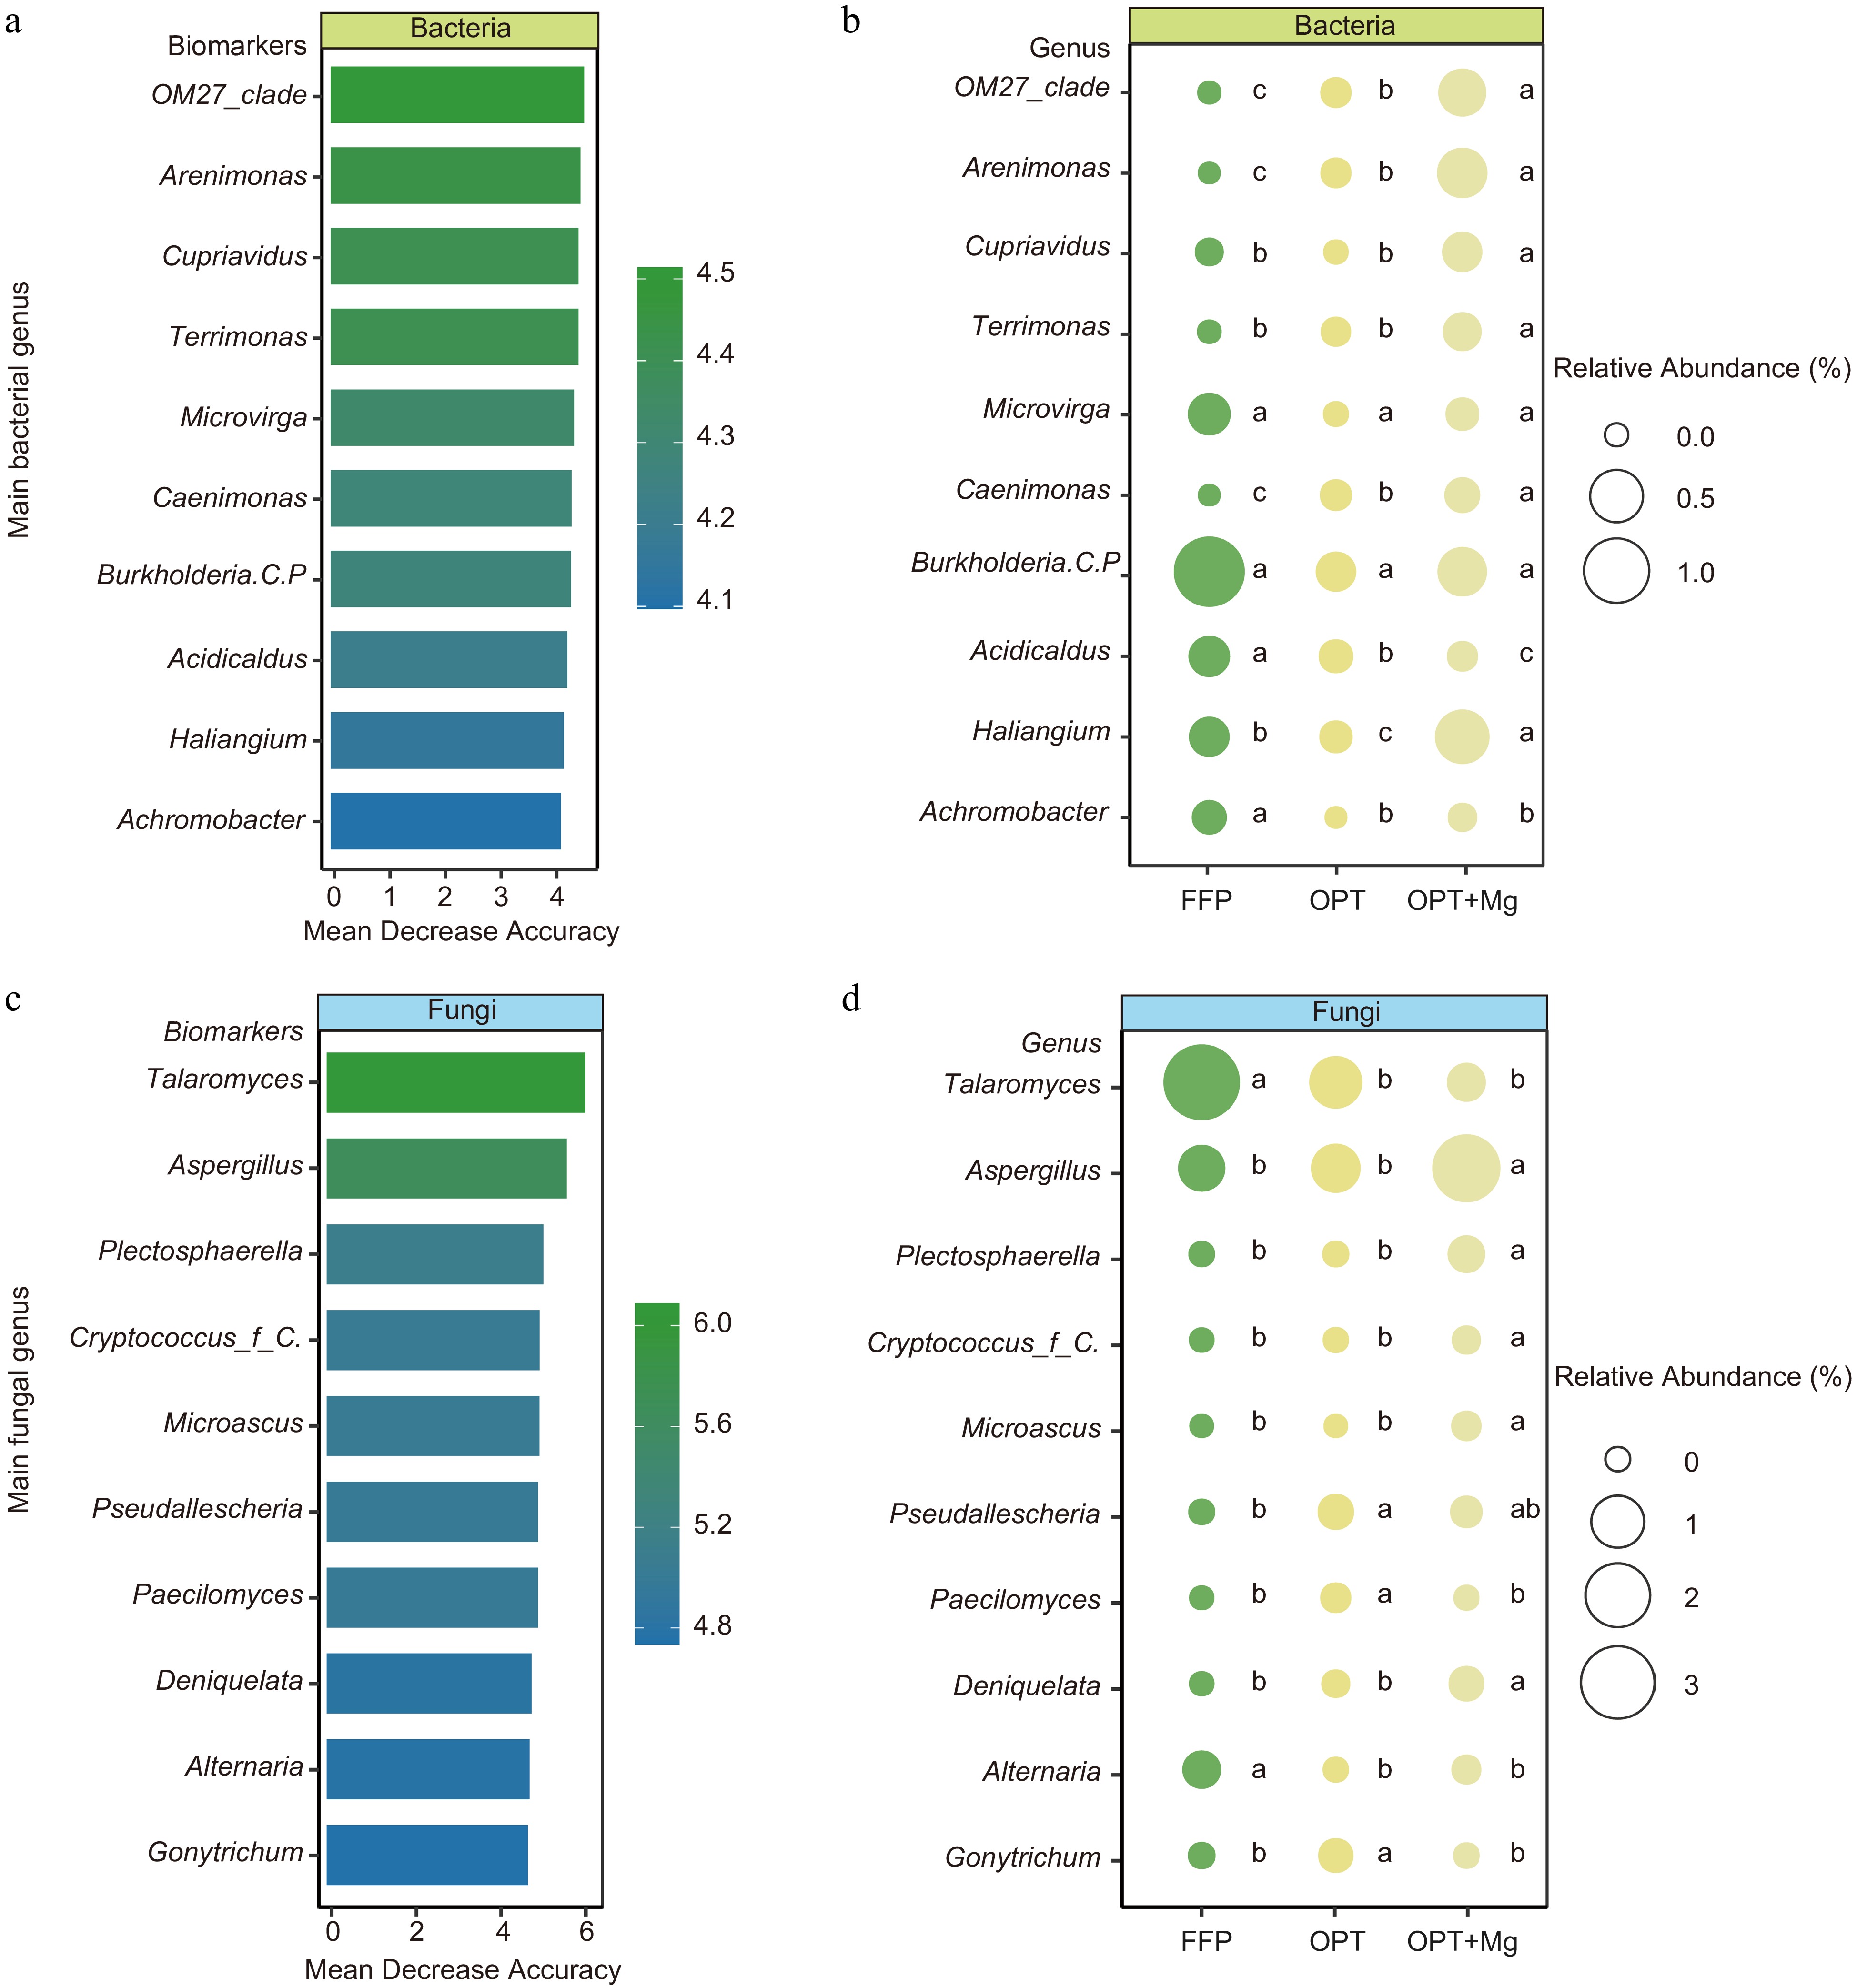
Figure 4.
Identification of microbial biomarkers in Anji Baicha tea plantation soils under different fertilization regimens. The top ten key (a) bacterial, and (c) fungal biomarker genera across the different fertilization regimens. RF regression model based on the relative abundance identified the key microbial genera. The relative abundances of the top ten (b) bacterial, and (d) fungal genera identified as biomarkers in different treatments.
-
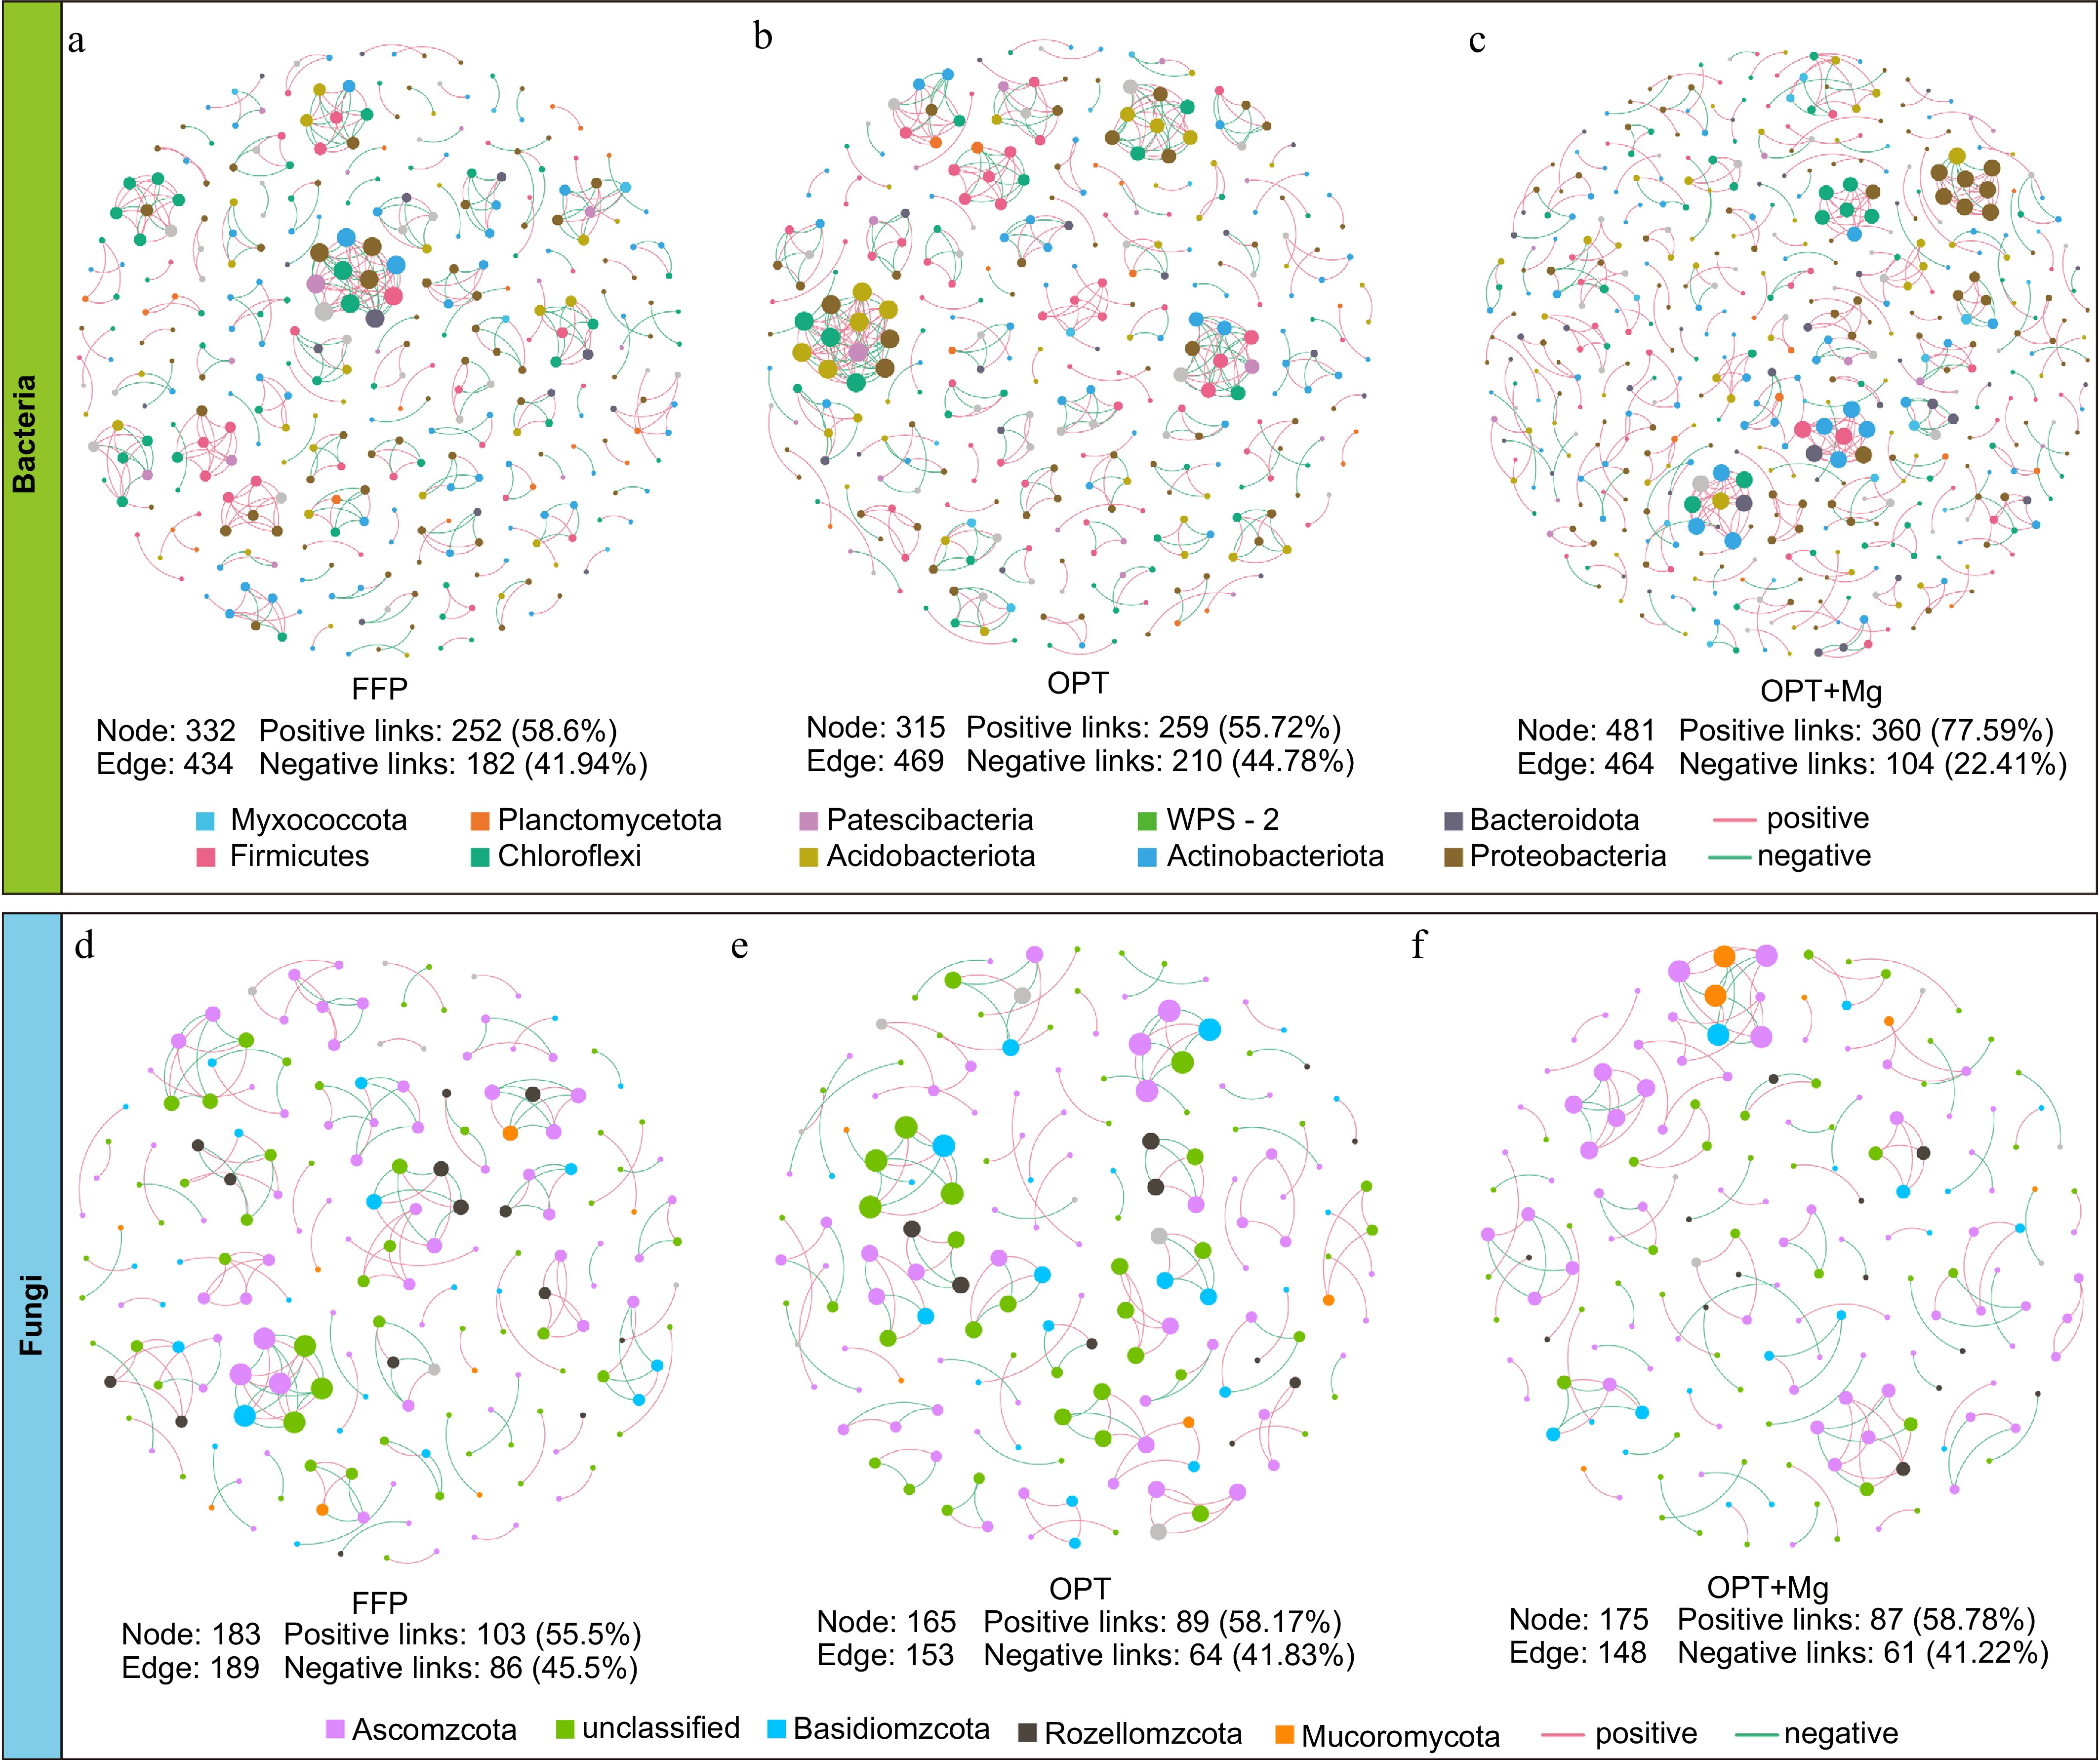
Figure 5.
Soil microbial co-occurrence networks across fertilization regimens in tea plantations. (a)−(c) Bacterial, and (d)−(f) fungal OTU networks. Here, nodes are color-coded based on phylum, and node size is proportional to OTU relative abundance. The edges represent significant correlations (Spearman's |ρ| > 0.6; FDR-adjusted p < 0.05): red indicates the positive correlations, while green indicates the negative correlations. Networks were generated using OTUs with average relative abundance > 0.01% and occurrence frequency > 20%.
-
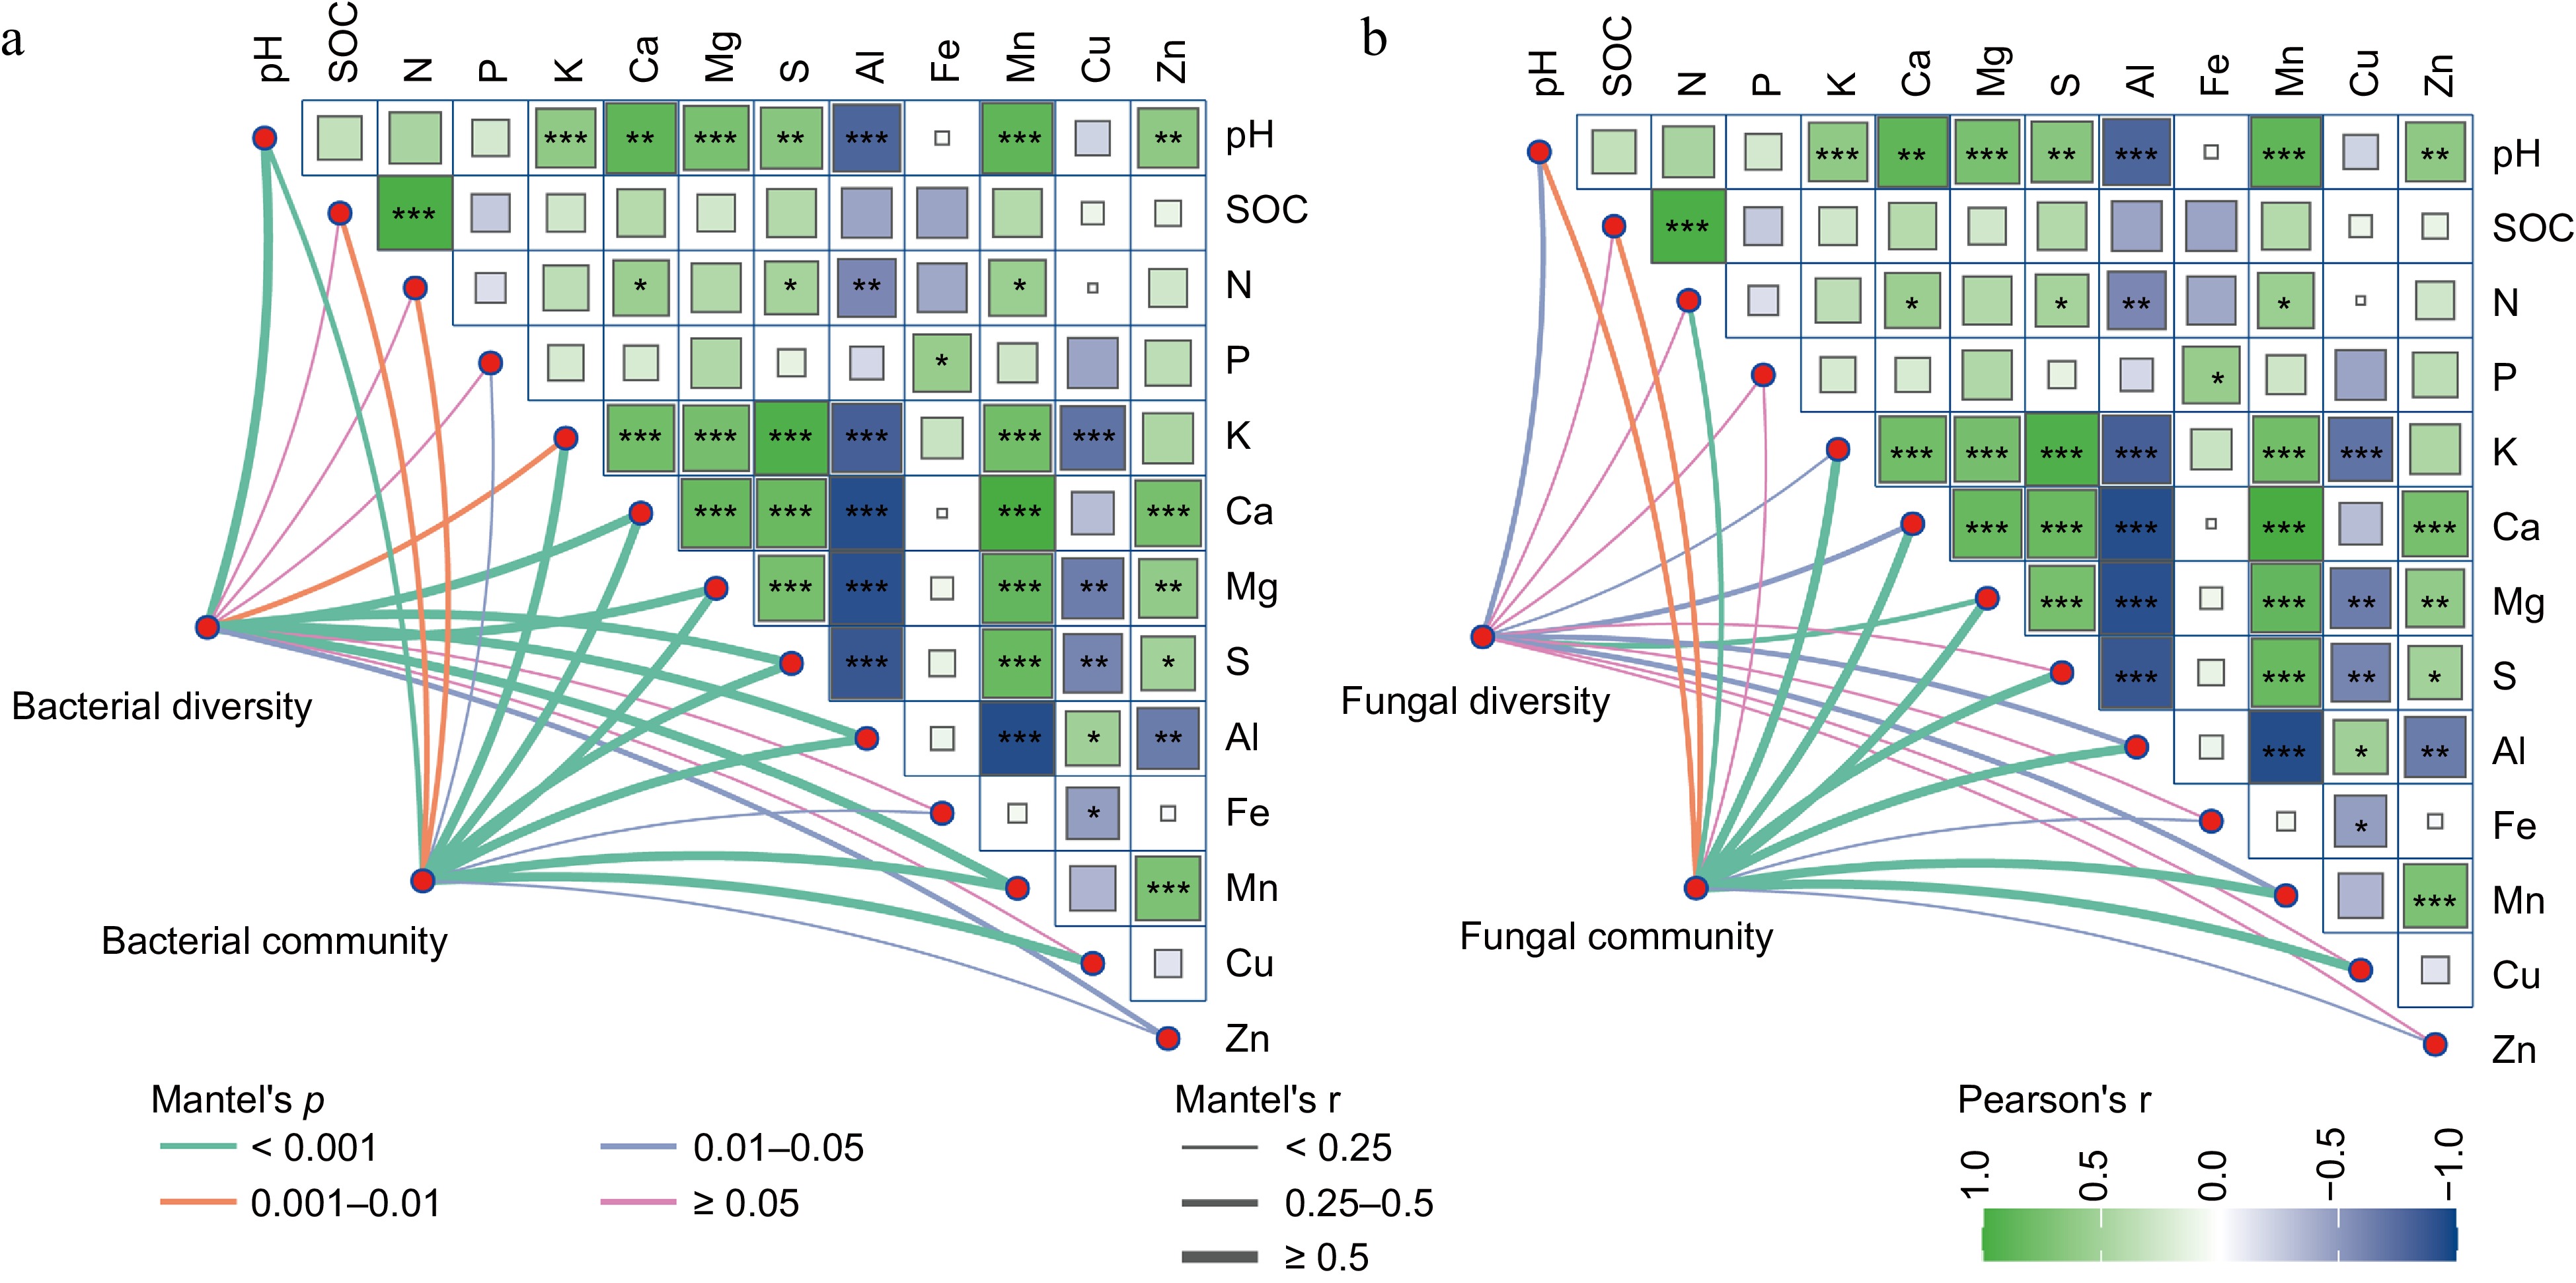
Figure 6.
Pearson correlation heatmap and Mantel test reveal the relationships between soil microbial communities and available nutrients across fertilization treatments. The relations for the (a) bacterial, and (b) fungal communities are shown. In the figure, Pearson correlation coefficients are shown, with green indicating positive correlations and blue indicating negative correlations; * p < 0.05, ** p < 0.01, *** p < 0.001. The Mantel test was used to characterize the correlations; the p-value indicates the strength of the correlation. Green lines represent p < 0.001, orange lines mean 0.001 < p < 0.01, and blue lines mean 0.01 < p < 0.05; the thickness of the lines represents the r values of the Mantel test.
-
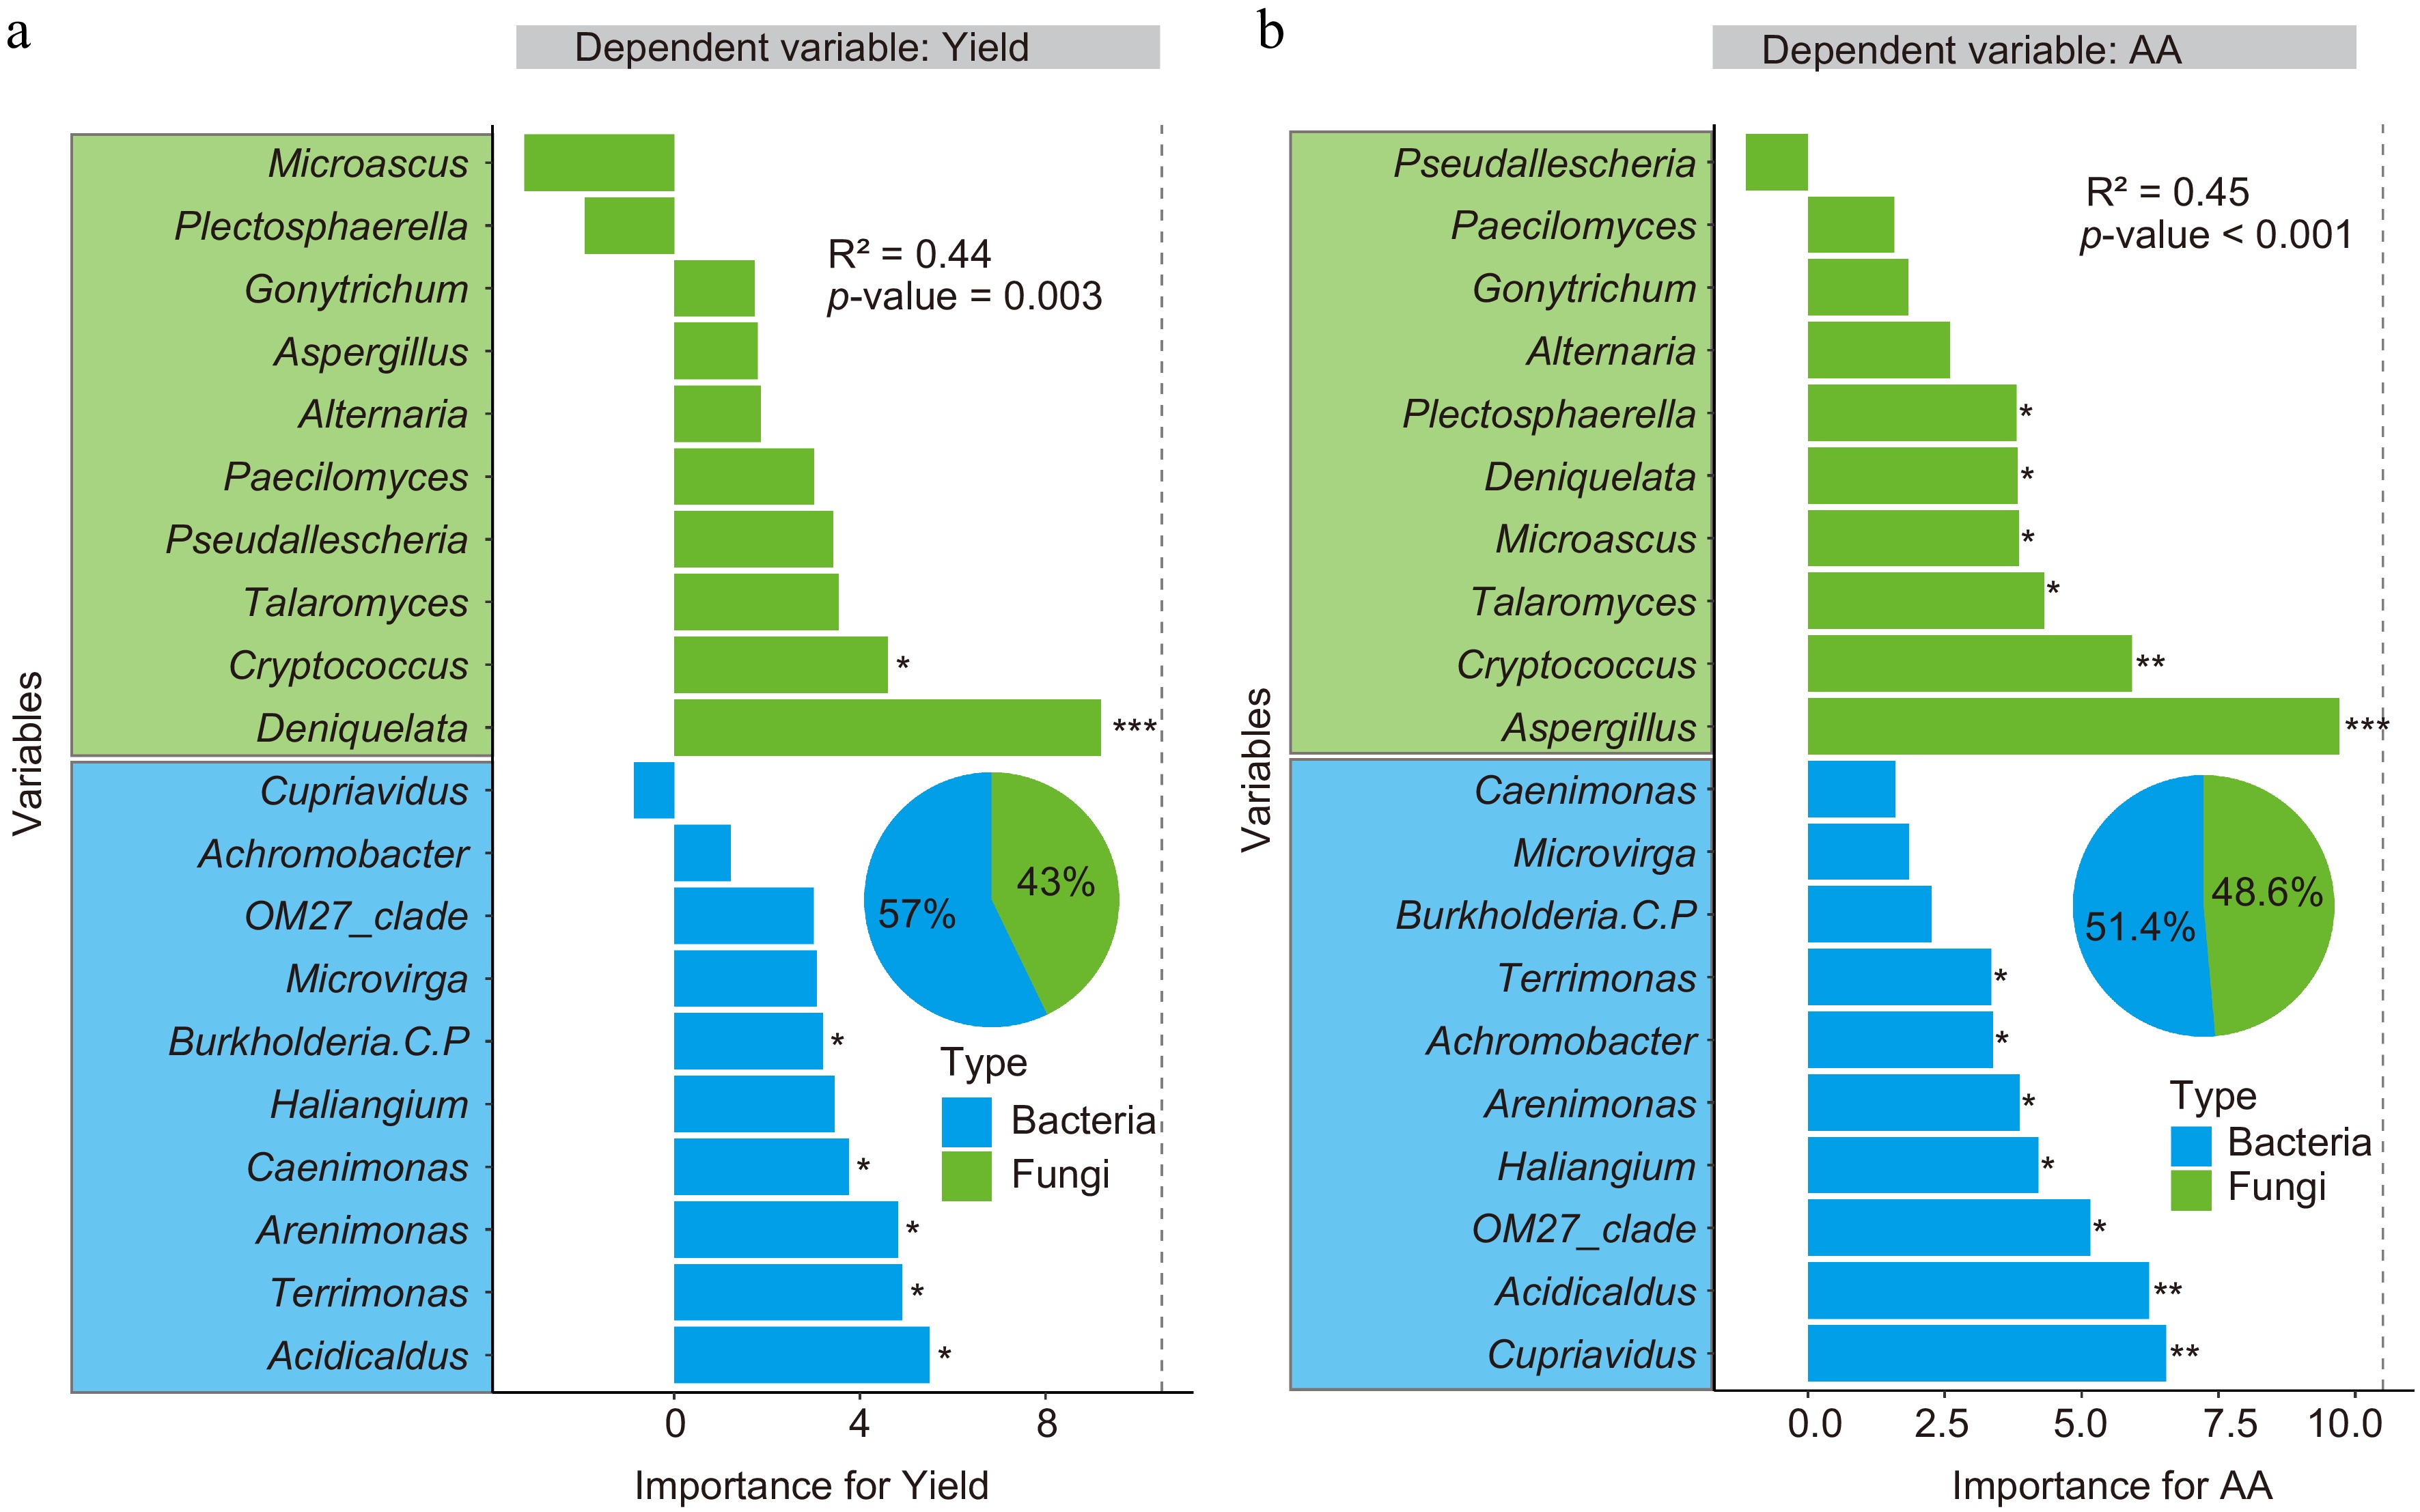
Figure 7.
Random forest analysis identifies the key variables affecting the Anji Baicha (a) yield, and (b) AA content. The genus-level bacteria and fungi are considered biomarkers (Fig. 4). The pie chart shows the relative influence of the bacterial and fungal (genus-level) biomarkers on yield and quality. Here, * p < 0.05, ** p < 0.01, and *** p < 0.001.
-
Parameters Unit Fertilization regimen FFP OPT OPT+Mg pH / 4.31 ± 0.13b 4.26 ± 0.1b 5.66 ± 0.64a SOC g·kg−1 34.06 ± 3.53ns 33.46 ± 0.96 36.25 ± 3.1 N g·kg−1 2.88 ± 0.23b 2.86 ± 0.07b 3.11 ± 0.21a P mg·kg−1 373 ± 43ns 394 ± 28 394 ± 5 K mg·kg−1 173 ± 9c 236 ± 26b 274 ± 5a Ca mg·kg−1 120 ± 16c 26 ± 72b 1852 ± 157a Mg mg·kg−1 28 ± 3c 77 ± 31b 129 ± 4a S mg·kg−1 9.3 ± 0.7c 12.1 ± 1.3b 14.6 ± 0.5a Al mg·kg−1 1746 ± 40a 1633 ± 44b 1418 ± 25c Fe mg·kg−1 536 ± 29ns 551 ± 17 543 ± 3 Mn mg·kg−1 3.17 ± 0.61c 4.2 ± 0.14b 12.39 ± 0.6a Cu mg·kg−1 2.16 ± 0.41a 0.4 ± 0.1c 0.87 ± 0.05b Zn mg·kg−1 3.11 ± 0.42c 2.92 ± 0.55b 5.13 ± 1.81a SQI / 0.36 ± 0.06c 0.43 ± 0.03b 0.63 ± 0.05a The different lowercase letters denote significant differences among treatments, while 'ns' indicates no significant difference. Table 1.
Soil available nutrients and SQI of Anji Baicha plantations under different fertilization regimens.
Figures
(7)
Tables
(1)