-
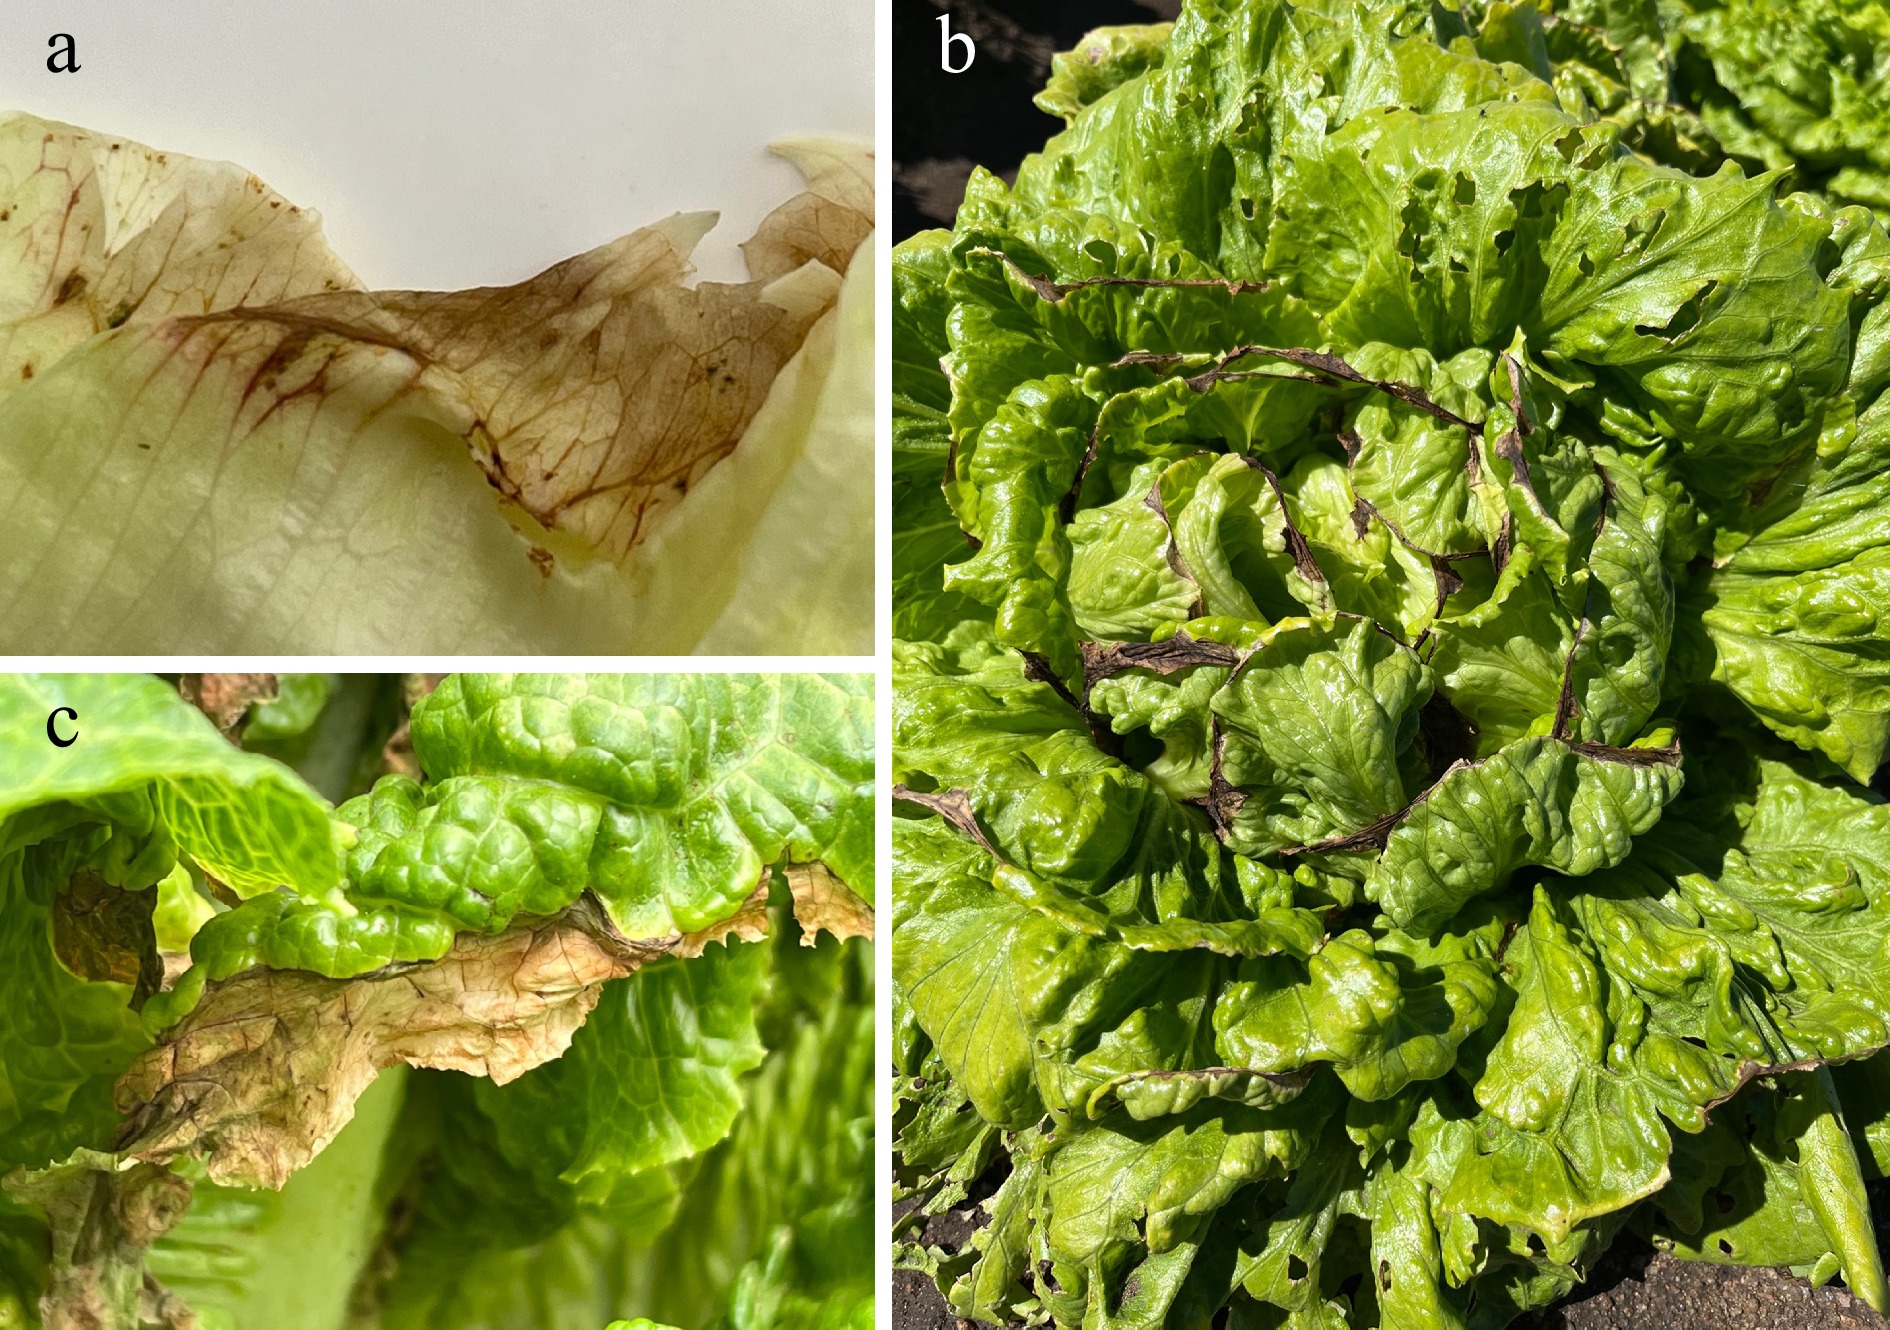
Figure 1.
Tipburn symptoms on lettuce leaves. (a) The initial stage is characterized by the darkening of veins near the leaf margins, which is rapidly followed by the development of (b), (c) necrotic, dark areas. These symptoms can manifest in a very short time under conditions conducive to tipburn development.
-
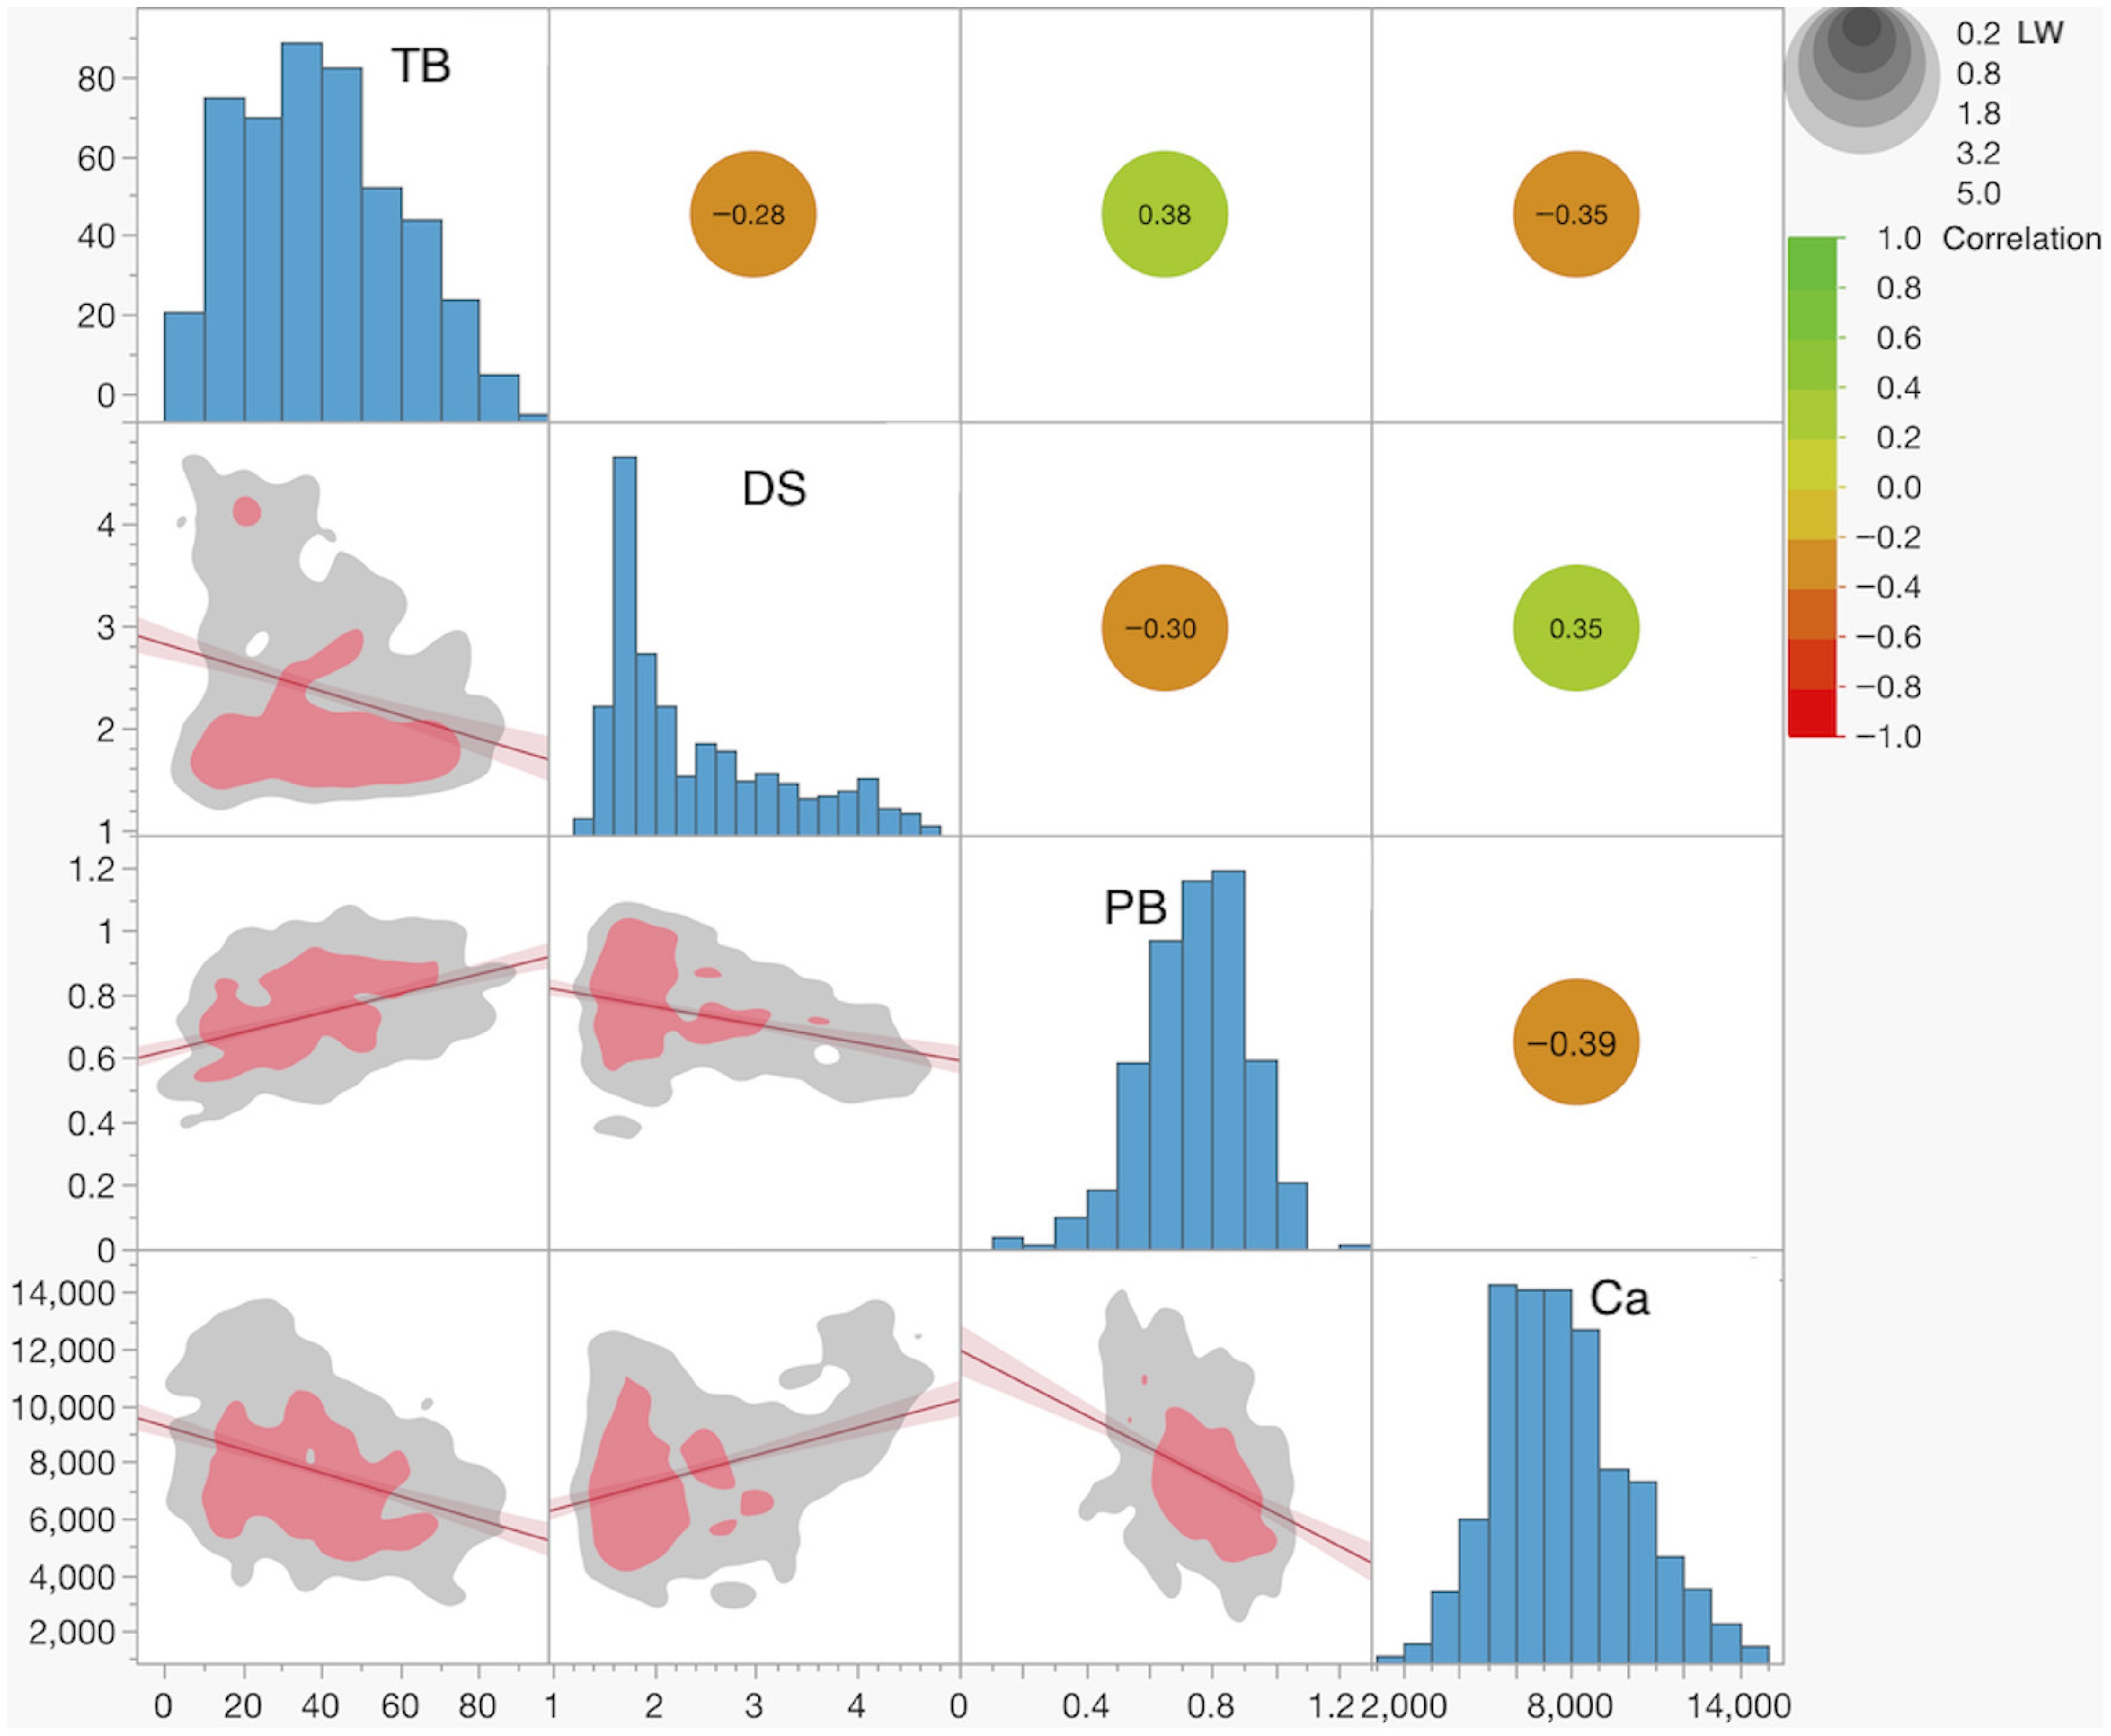
Figure 2.
Distributions of and correlations between traits. Histograms of trait values are shown in the diagonal panels. The plots below the diagonal display the linear fit between trait pairs, with the red line indicating the linear regression and the shaded red area representing the 95% confidence interval. Nonparametric data density is shown by the gray (lower density), and red (higher density) colored areas. Linear correlation coefficients between trait pairs are presented above the diagonal. The color scale indicates the magnitude of the correlation coefficient, while the gray circles represent the significance level in LogWorth (LW), a measure of statistical significance defined as −log10 (p-value).
-
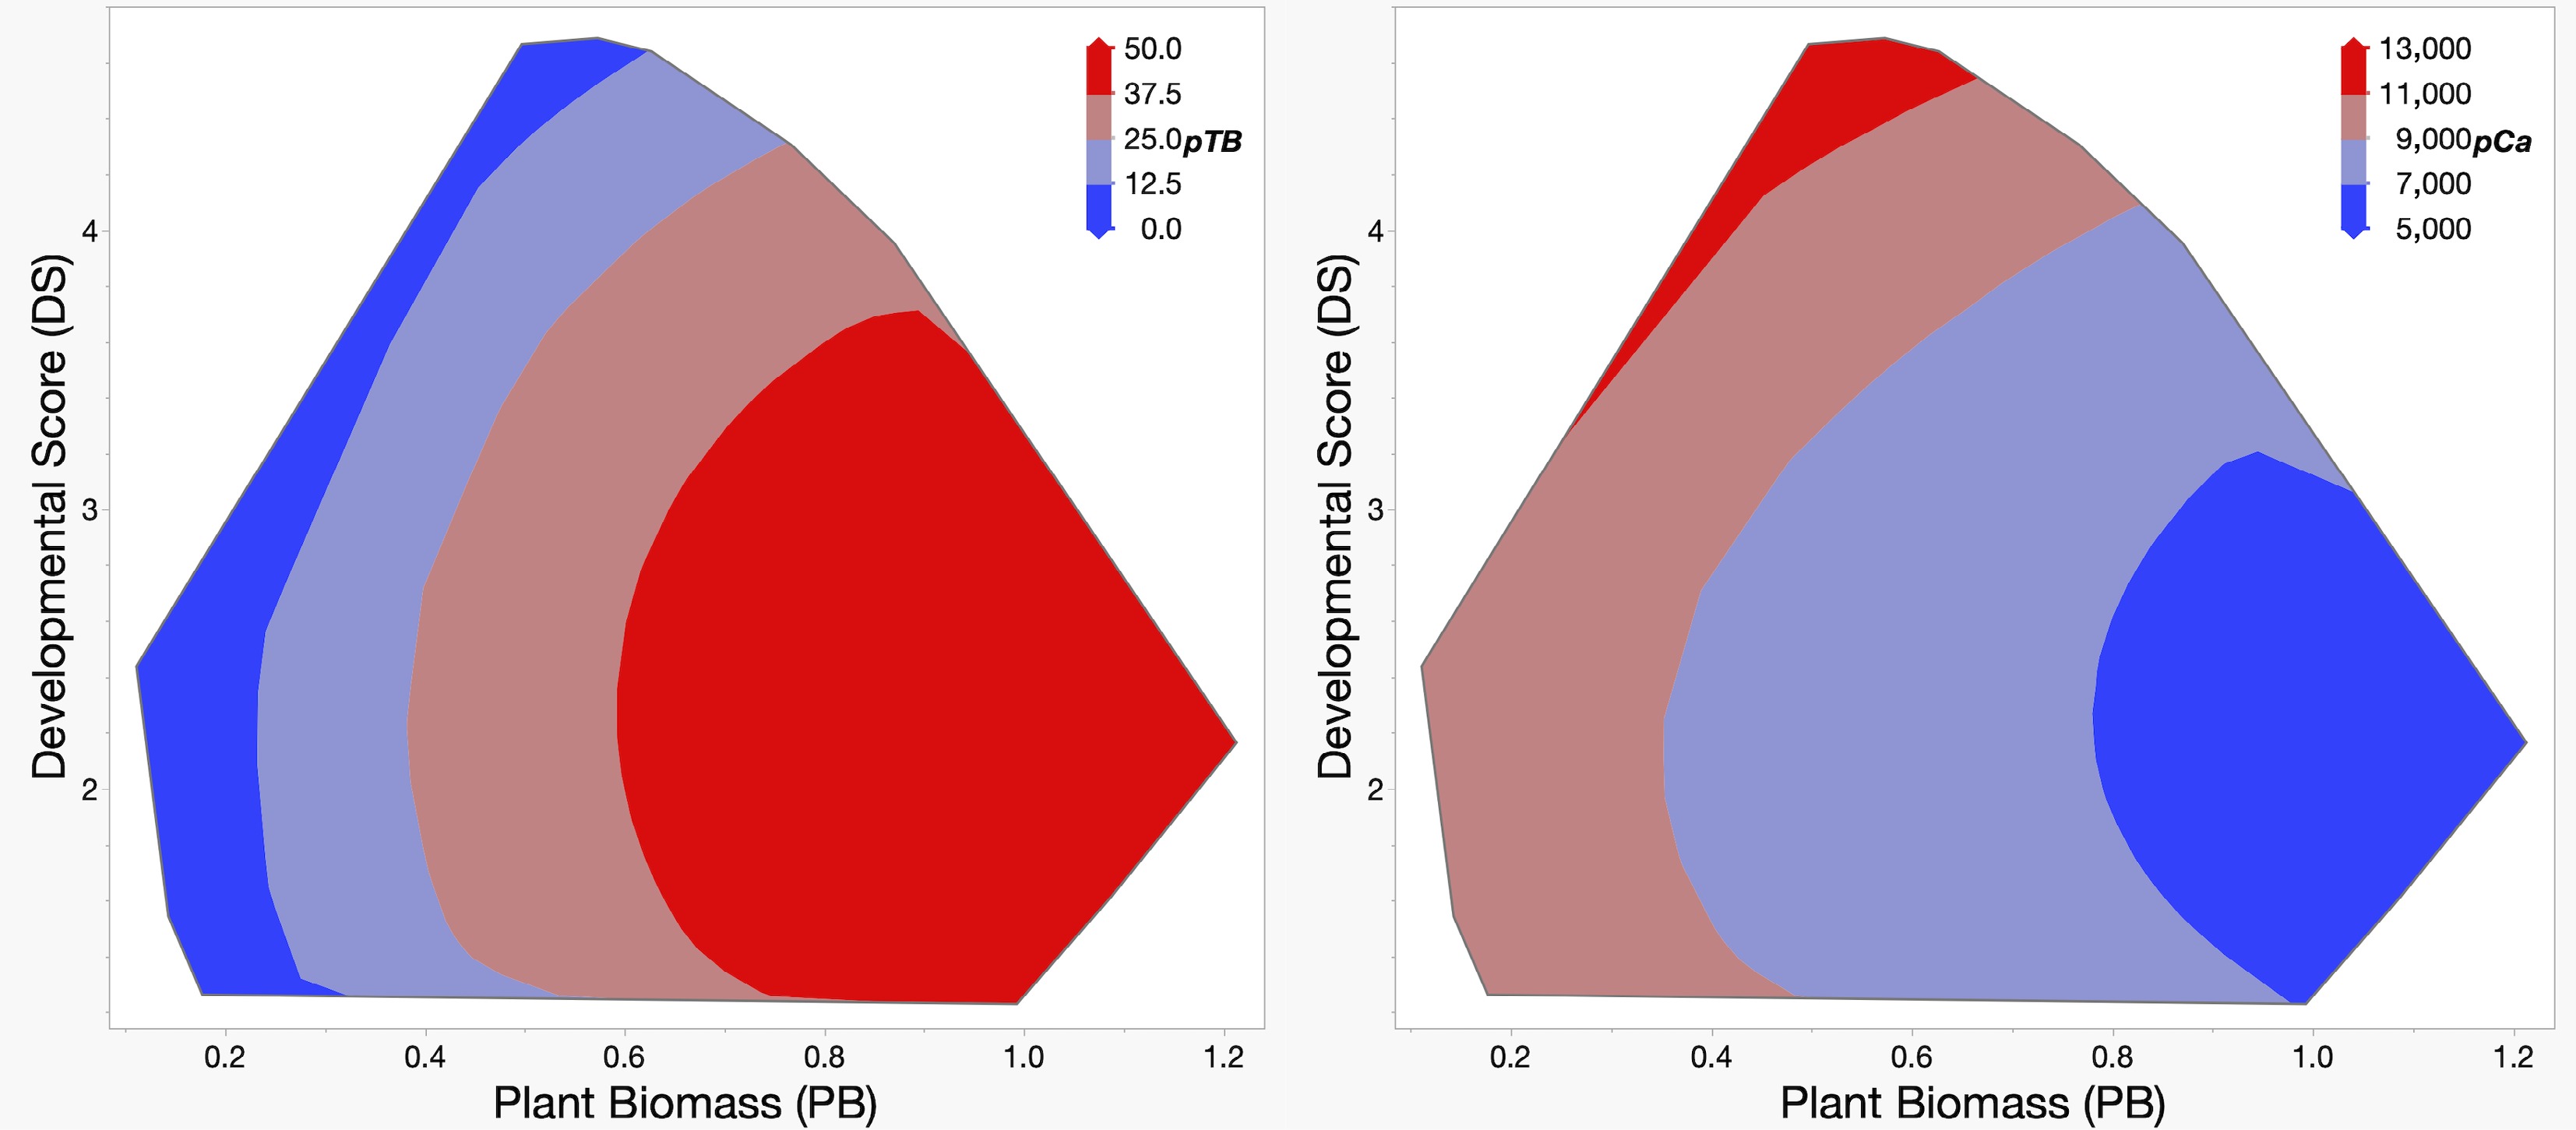
Figure 3.
Predicted values for TB incidence (pTB, left), and leaf bulk calcium content (pCa, right). Predicted values for pTB and pCa were calculated using a response surface model from plant biomass (PB, horizontal axis), and developmental score (DS, vertical axis), the traits that significantly affect both TB and Ca content. The color key in the upper right corner of each panel provides a visual guide to the predicted values.
-
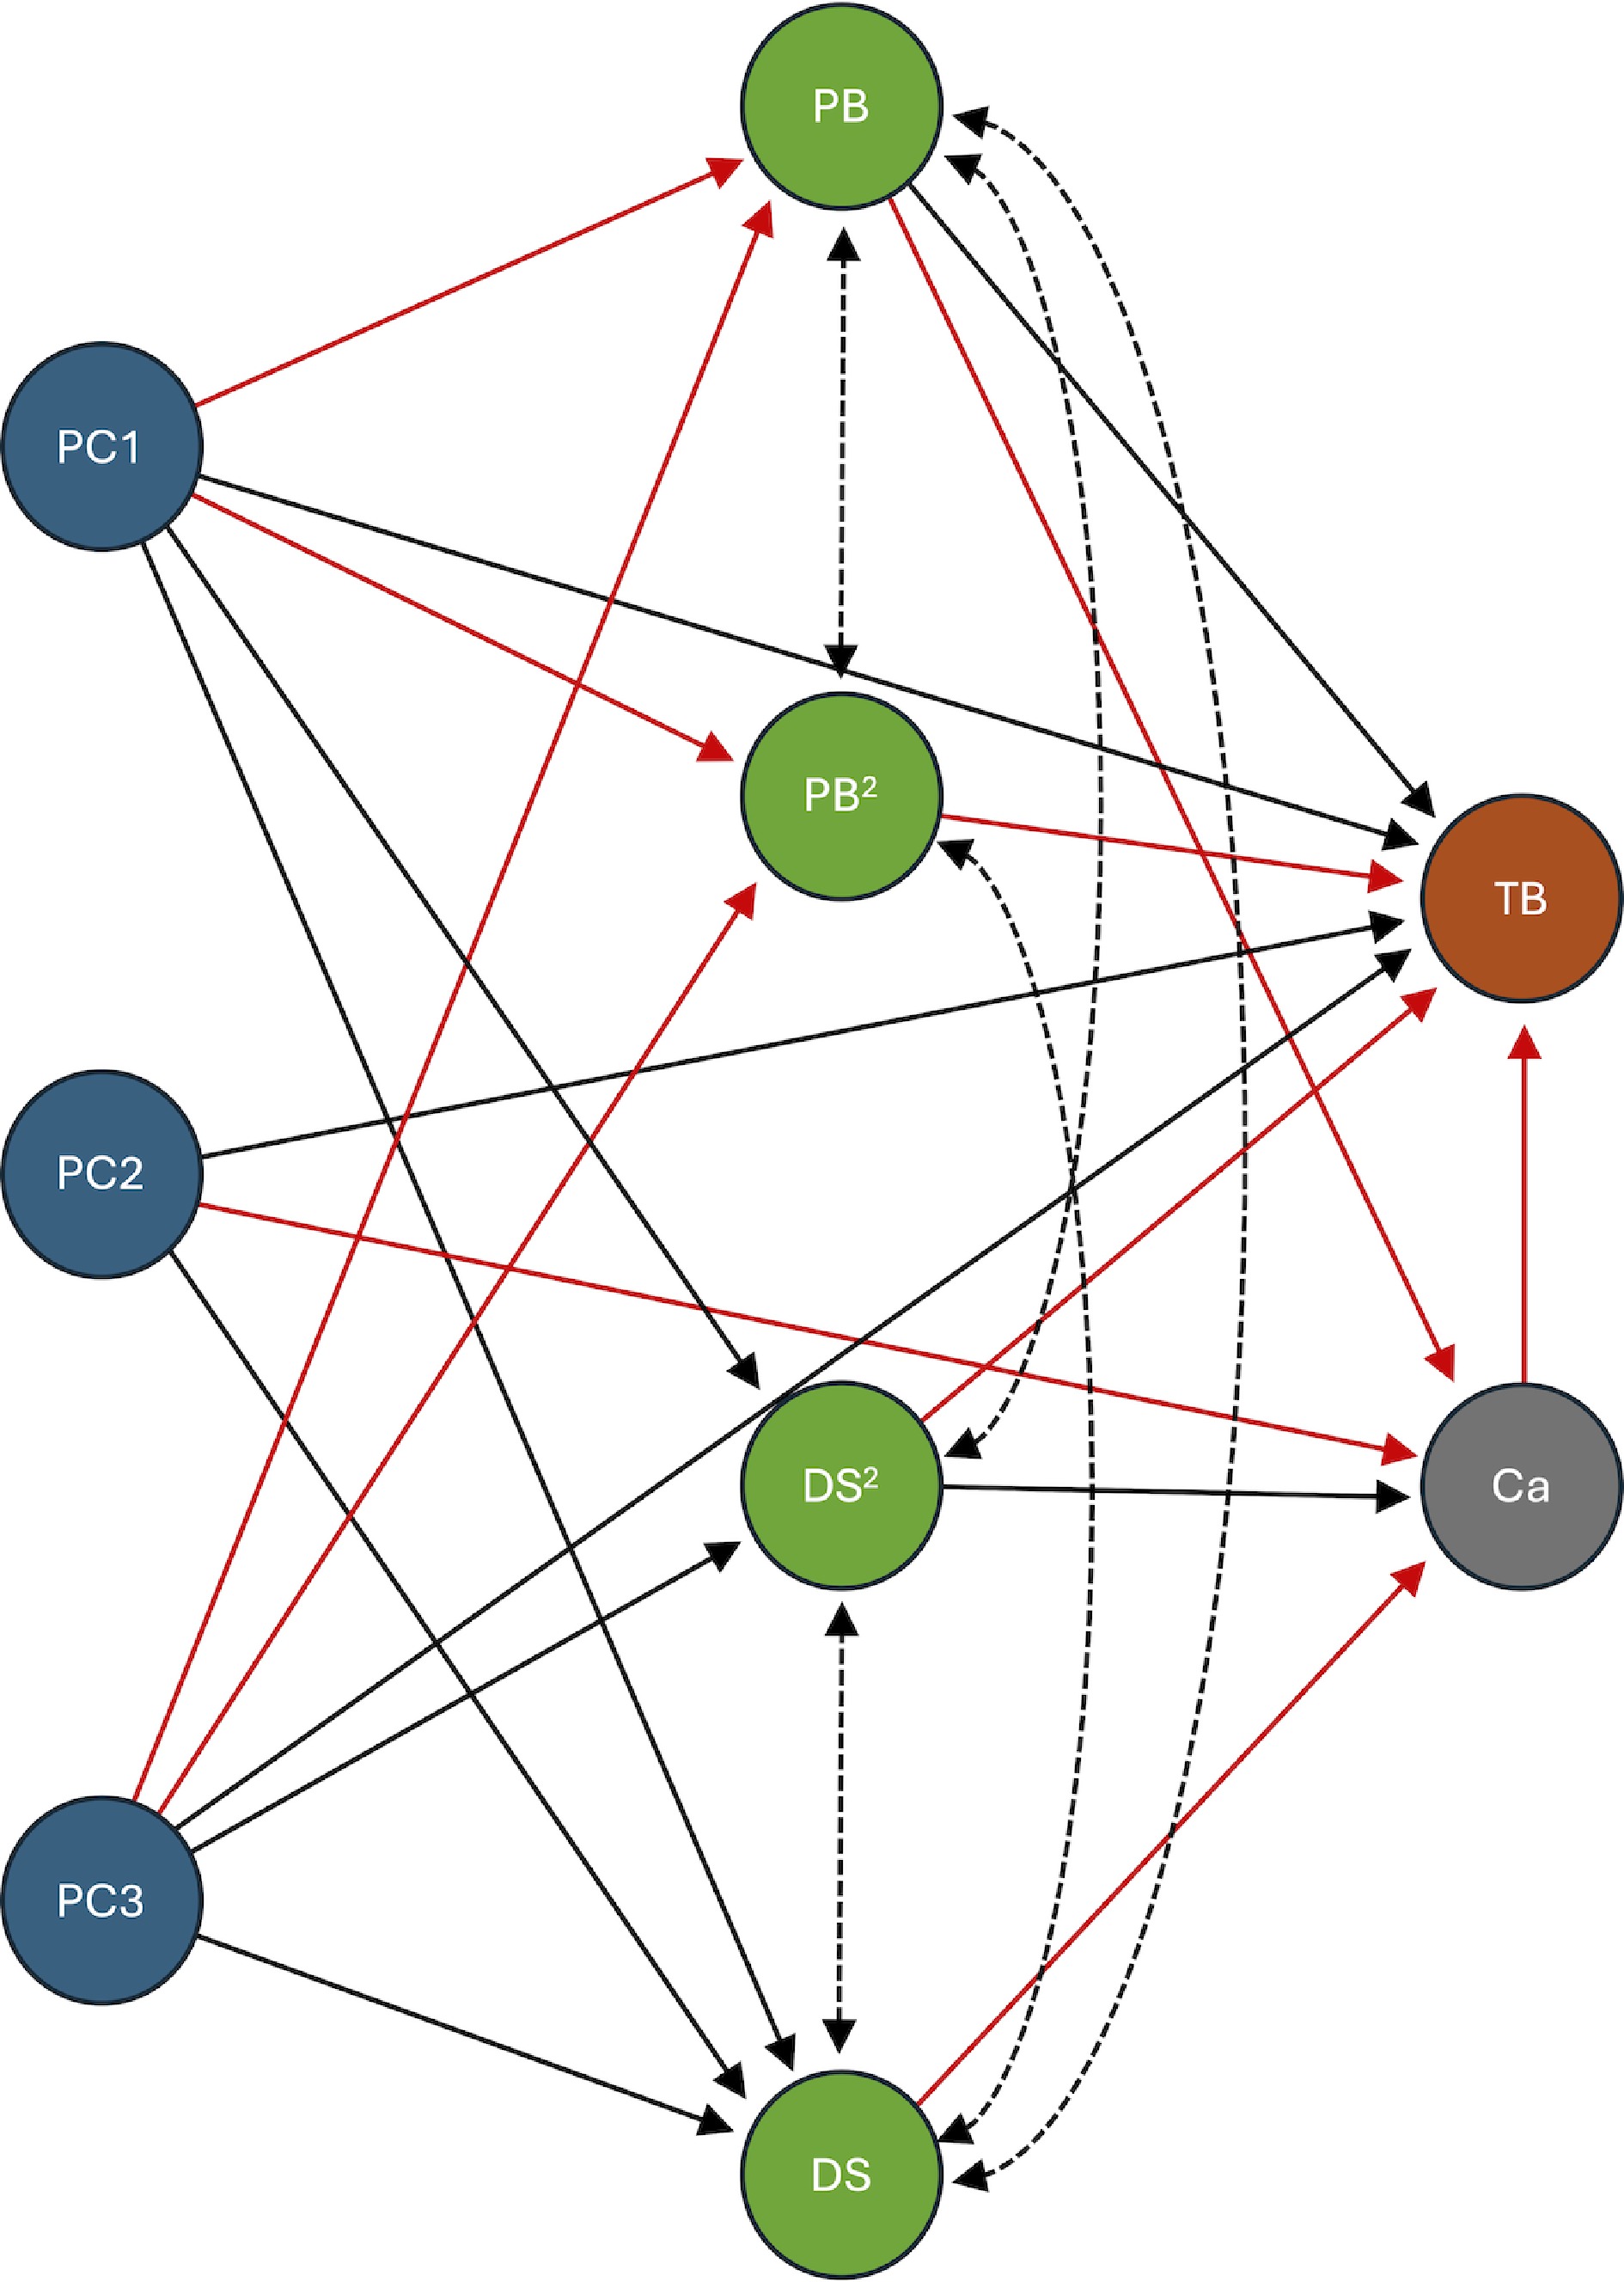
Figure 4.
Structural equation model (SEM) of genetic and physiological determinants of lettuce tipburn. This diagram illustrates the final structural equation model used to analyze the genetic and physiological determinants of lettuce tipburn. The model includes genetic variation estimated from SNP data via principal components (PC1, PC2, and PC3), shown in blue. Physiological traits, including plant biomass (PB), developmental score (DS), and their quadratic terms (PB2 and DS2), are shown in green. Calcium content (Ca) is shown in gray, and tipburn incidence (TB) is shown in brown. A stepwise elimination process was used to refine the model, retaining only the statistically significant paths (p < 0.05). Solid arrows indicate a directional, or predictive, relationship, while dotted lines indicate a non-directional, or covariance, relationship. Black lines represent a positive relationship, and red lines indicate a negative relationship. For detailed statistical results, including standardized estimates and significance values, please refer to Table 1.
-
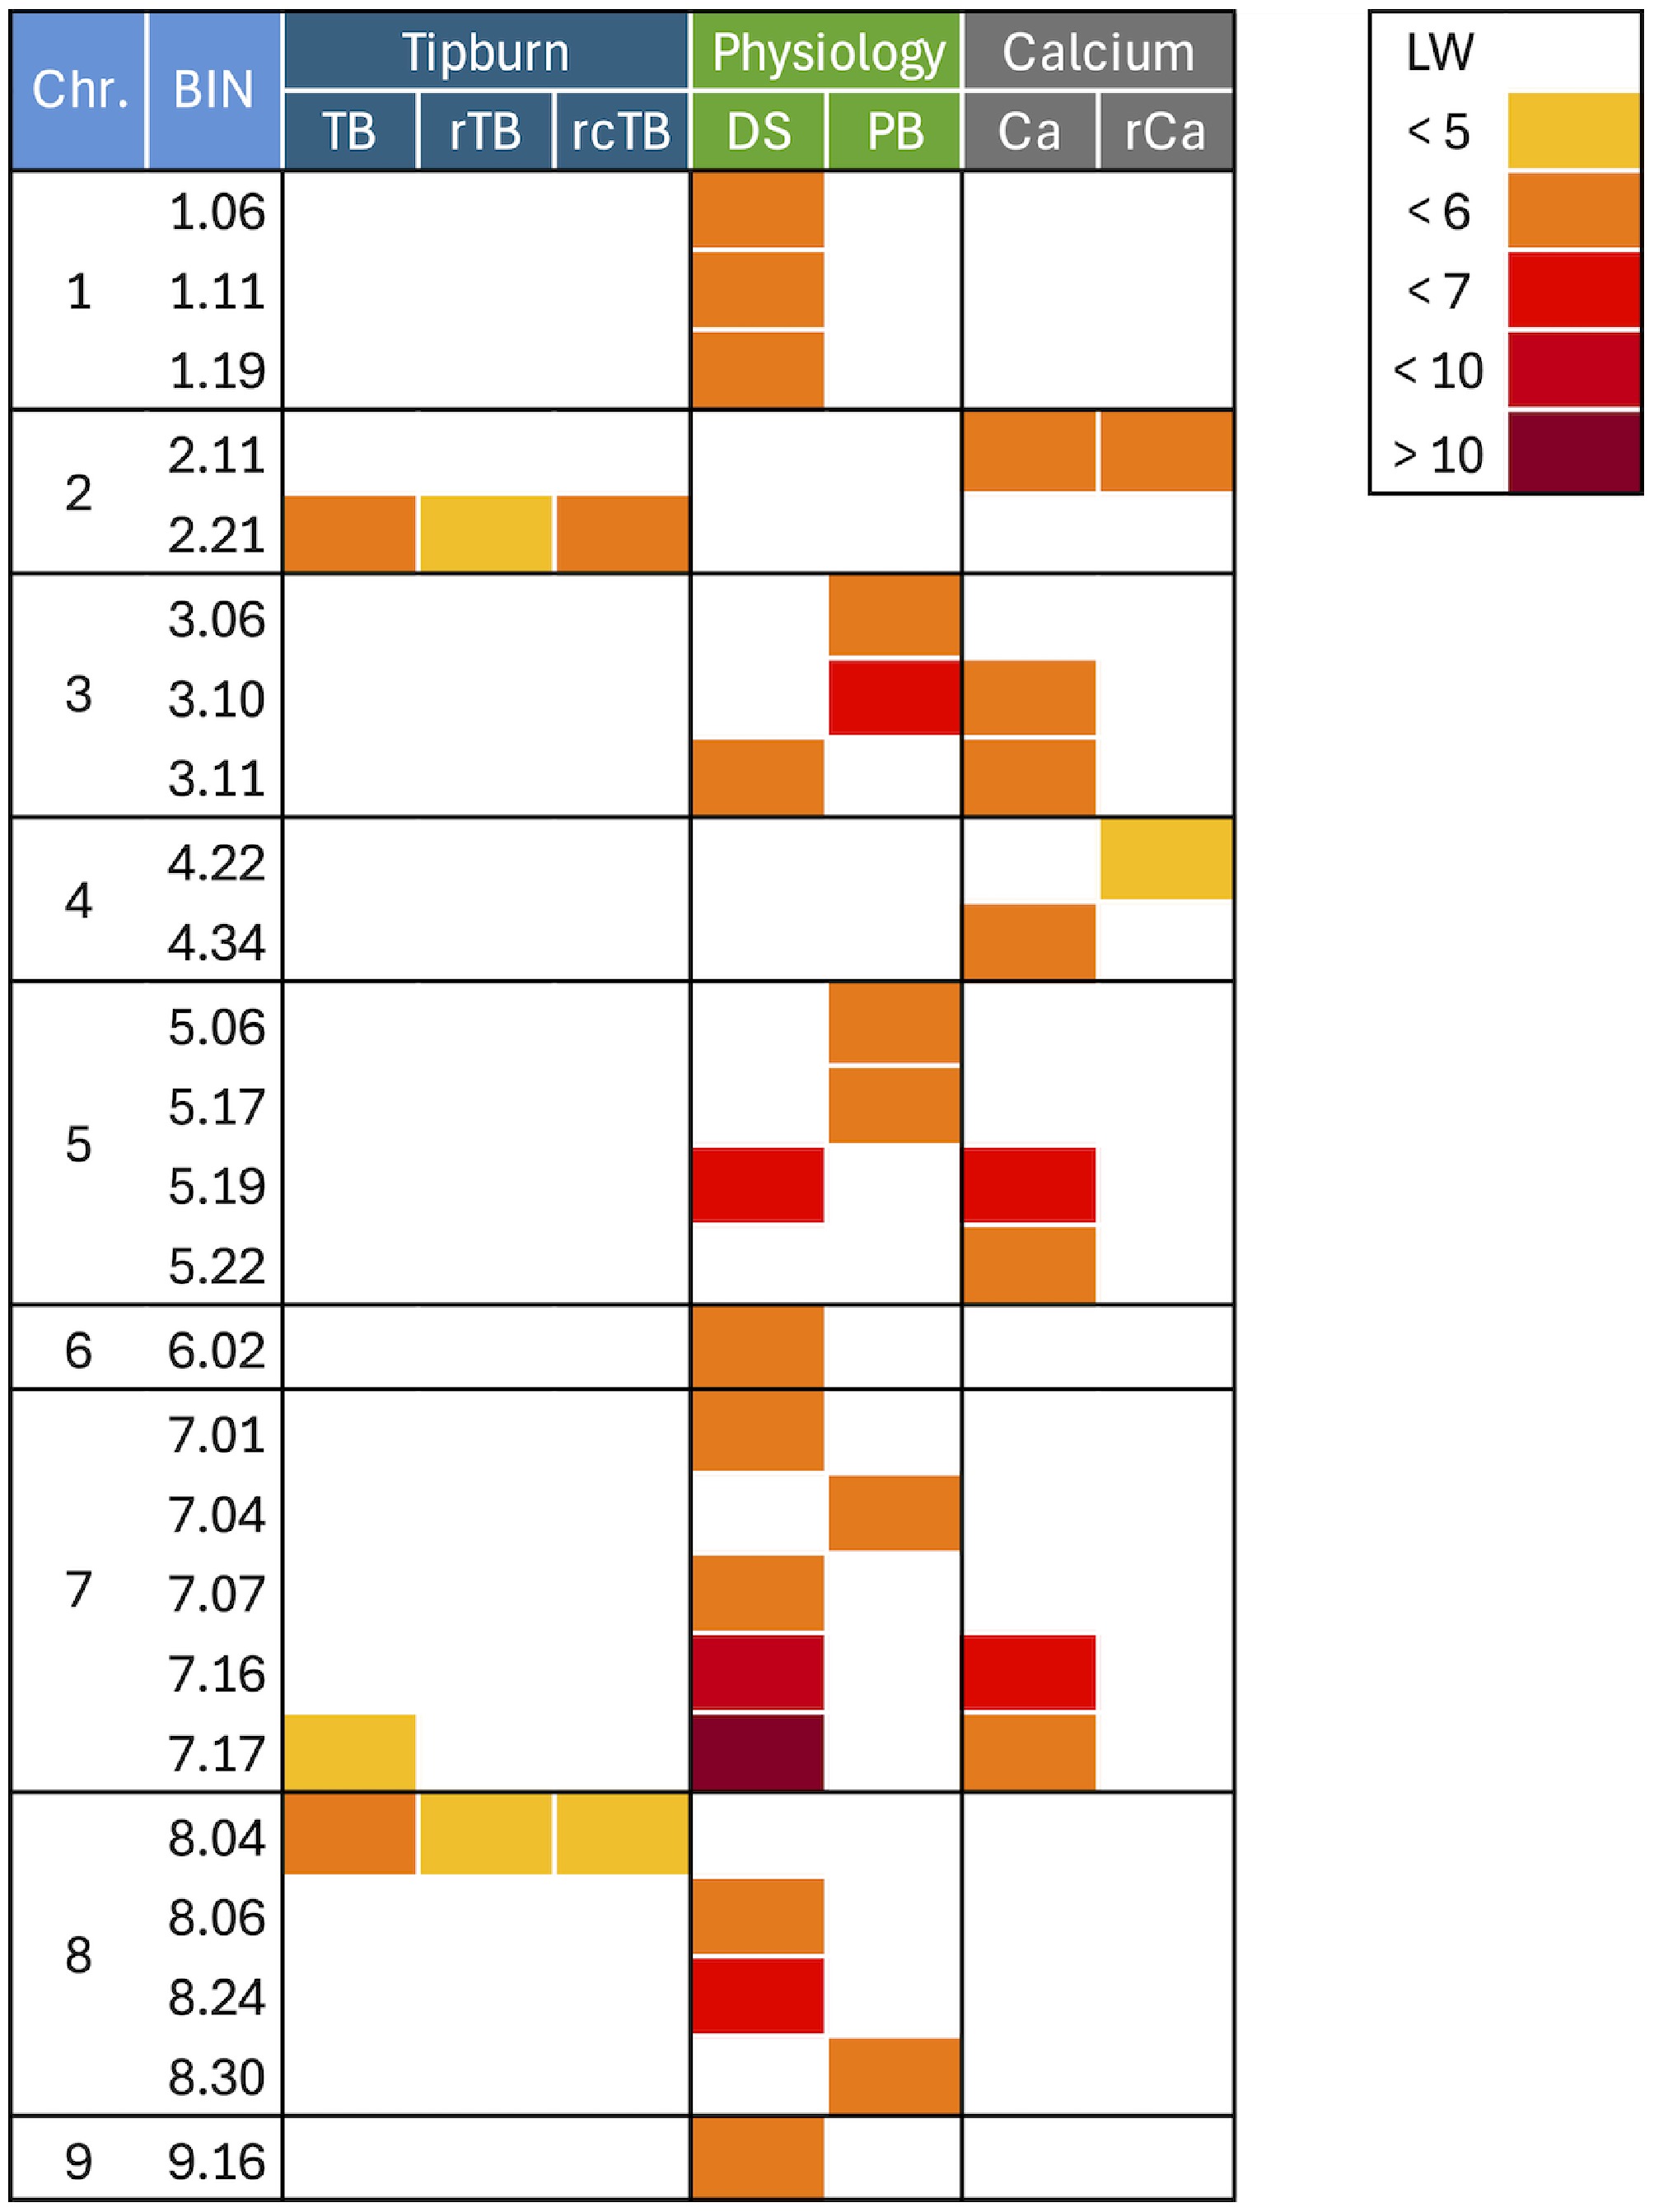
Figure 5.
Heatmap of quantitative trait loci. Visualized are the positions of significant quantitative trait loci (QTLs) across the lettuce genome. The QTLs are placed into BINs, which are identified by their chromosome number and a unique BIN identification number. The lettuce reference genome was partitioned into 10 Mb BINs, and QTLs detected on adjacent BINs are considered a single associated genomic region. The traits analyzed were: plant biomass (PB), developmental score (DS), calcium content (Ca), residual of calcium content after accounting for genetic background, PB, and DS (rCa), tipburn (TB), residual of tipburn after accounting for genetic background, PB, and DS (rTB), residual of tipburn after accounting for genetic background, PB, DS, and Ca (rcTB). The legend in the upper right corner indicates the significance of the QTLs using LogWorth (LW), a measure of statistical significance defined as −log10 (p-value).
-
Group patha Pathb Standardized estimatesc LWd Physiology → Composition DS → Ca −0.823 2.38 Physiology → Composition PB → Ca −0.278 > 4.00 Physiology → Disorder PB → TB 1.016 > 4.00 Genetics → Disorder PC1 → TB 0.105 1.71 Genetics → Physiology PC1 → DS 0.352 > 4.00 Genetics → Physiology PC1 → PB −0.501 > 4.00 Genetics → Physiology PC1 → PB2 −0.503 > 4.00 Genetics → Physiology PC1 → DS2 0.337 > 4.00 Genetics → Disorder PC2 → TB 0.199 > 4.00 Genetics → Composition PC2 → Ca −0.118 2.17 Genetics → Physiology PC2 → DS 0.053 > 4.00 Genetics → Disorder PC3 → TB 0.168 > 4.00 Genetics → Physiology PC3 → DS2 0.114 2.19 Genetics → Physiology PC3 → PB2 −0.179 > 4.00 Genetics → Physiology PC3 → DS 0.093 1.59 Genetics → Physiology PC3 → PB −0.184 > 4.00 Physiology → Disorder PB2 → TB −0.712 2.85 Physiology → Disorder DS2 → TB −0.285 > 4.00 Physiology → Composition DS2 → Ca 1.161 > 4.00 Composition → Disorder Ca → TB −0.169 > 4.00 Physiology ↔ Physiology DS ↔ PB 0.039 > 4.00 Physiology ↔ Physiology DS ↔ PB2 0.013 2.05 Physiology ↔ Physiology DS ↔ DS2 0.860 > 4.00 Physiology ↔ Physiology PB ↔ PB2 0.701 > 4.00 Physiology ↔ Physiology PB ↔ DS2 0.023 2.74 a The groupings of paths based on the variable types (genetics, physiology, composition, disorder). b The relationship between two variables, where '→' indicates a directional, or predictive, relationship and '↔' indicates a non-directional, or covariance, relationship. c The standardized path coefficients representing the strength and direction of the relationship between variables. d LogWorth, a measure of statistical significance '−log10 (p-value)'. LW values of 1.301, 2, 3, 4, indicate p-values of 0.05, 0.01, 0.001, and 0.001. PC1, PC2, PC3: Principal components 1, 2, and 3, representing the major axes of genetic variation within the diversity panel. PB, PB2, DS, DS2, TB, Ca: Plant biomass and its quadratic term (PB, PB2), developmental stage and its quadratic term (DS, DS2), tipburn, and calcium content. Table 1.
Structural equation modeling (SEM) analysis of genetic and physiological determinants of lettuce tipburn.
-
QTL Traita Chr.b Positionc BINd LWe Other traitsf qDS1.1 DS 1 56,082,040 1.06 5.22 − qDS1.2 DS 1 109,861,146 1.11 5.49 − qDS1.3 DS 1 187,627,615 1.19 5.55 − qCa2.1 Ca 2 107,766,218 2.11 5.77 rCa qrCa2.1 rCa 2 107,766,218 2.11 5.41 Ca qTB2.1 TB 2 202,474,259 2.21 5.66 rTB, rcTB qrTB2.1 rTB 2 202,474,259 2.21 4.99 TB, rcTB qrcTB2.1 rcTB 2 202,474,259 2.21 5.25 TB, rTB qPB3.1 PB 3 52,159,558 3.06 5.40 − qPB3.2 PB 3 99,083,545 3.10 6.07 Ca, DS qCa3.1 Ca 3 99,083,545 3.10 5.49 PB, DS qDS3.1 DS 3 107,109,727 3.11 5.60 PB, Ca qCa3.1 Ca 3 107,109,727 3.11 5.98 PB, DS qrCa4.1 rCa 4 219,238,112 4.22 4.97 − qCa4.1 Ca 4 334,262,257 4.34 5.04 − qPB5.1 PB 5 53,264,256 5.06 5.23 − qPB5.2 PB 5 162,067,126 5.17 5.26 − qDS5.1 DS 5 188,494,426 5.19 6.57 Ca qCa5.1 Ca 5 180,142,680 5.19 6.24 DS qCa5.2 Ca 5 210,996,408 5.22 5.33 − qDS6.1 DS 6 14,650,416 6.02 5.54 − qDS7.1 DS 7 7,686,305 7.01 5.06 − qPB7.1 PB 7 32,958,813 7.04 5.45 − qDS7.2 DS 7 63,420,944 7.07 5.83 − qDS7.3 DS 7 159,938,623 7.16 7.02 Ca, TB qCa7.1 Ca 7 159,938,623 7.16 6.68 DS, TB qTB7.1 TB 7 161,895,764 7.17 4.97 DS, Ca qDS7.3 DS 7 161,895,696 7.17 15.58 Ca, TB qCa7.1 Ca 7 161,895,709 7.17 5.95 DS, TB qTB8.1 TB 8 32,085,668 8.04 5.78 rTB, rcTB qrTB8.1 rTB 8 32,085,668 8.04 4.96 TB, rcTB qrcTB rcTB 8 32,085,668 8.04 4.98 TB, rTB qDS8.1 DS 8 56,390,912 8.06 5.16 − qDS8.2 DS 8 237,867,381 8.24 6.61 − qPB8.1 PB 8 292,702,418 8.30 5.45 − qDS9.1 DS 9 151,974,797 9.16 5.41 − a Traits: PB (plant biomass), DS (developmental score), Ca (calcium content), rCa (residual of calcium content accounting for genetic background and two physiological traits – PB and DS), TB (tibpurn), rTB (residual of tipburn accounting for genetic background and two physiological traits – PB and DS), rcTB (residual of tipburn accounting for genetic background, two physiological traits, and calcium content – PB, DS, and Ca). b Chromosome number. c The position of the significant SNP on the chromosome, in base pairs, based on the lettuce reference genome. d BIN identification (the lettuce reference genome was partitioned into 10 Mb BINs). QTLs detected on adjacent BINs are considered a single associated genomic region. e LogWorth, a measure of statistical significance '−log10 (p-value)'. LW values of 1.301, 2, 3, 4, indicate p-values of 0.05, 0.01, 0.001, and 0.0001. f Other traits for which a significant QTL was detected at the same genomic location, indicating a possible pleiotropic effect or closely linked genes. Table 2.
Genome-wide association study (GWAS) QTLs for tipburn, calcium Content, and physiological traits in a lettuce diversity panel.
Figures
(5)
Tables
(2)