-
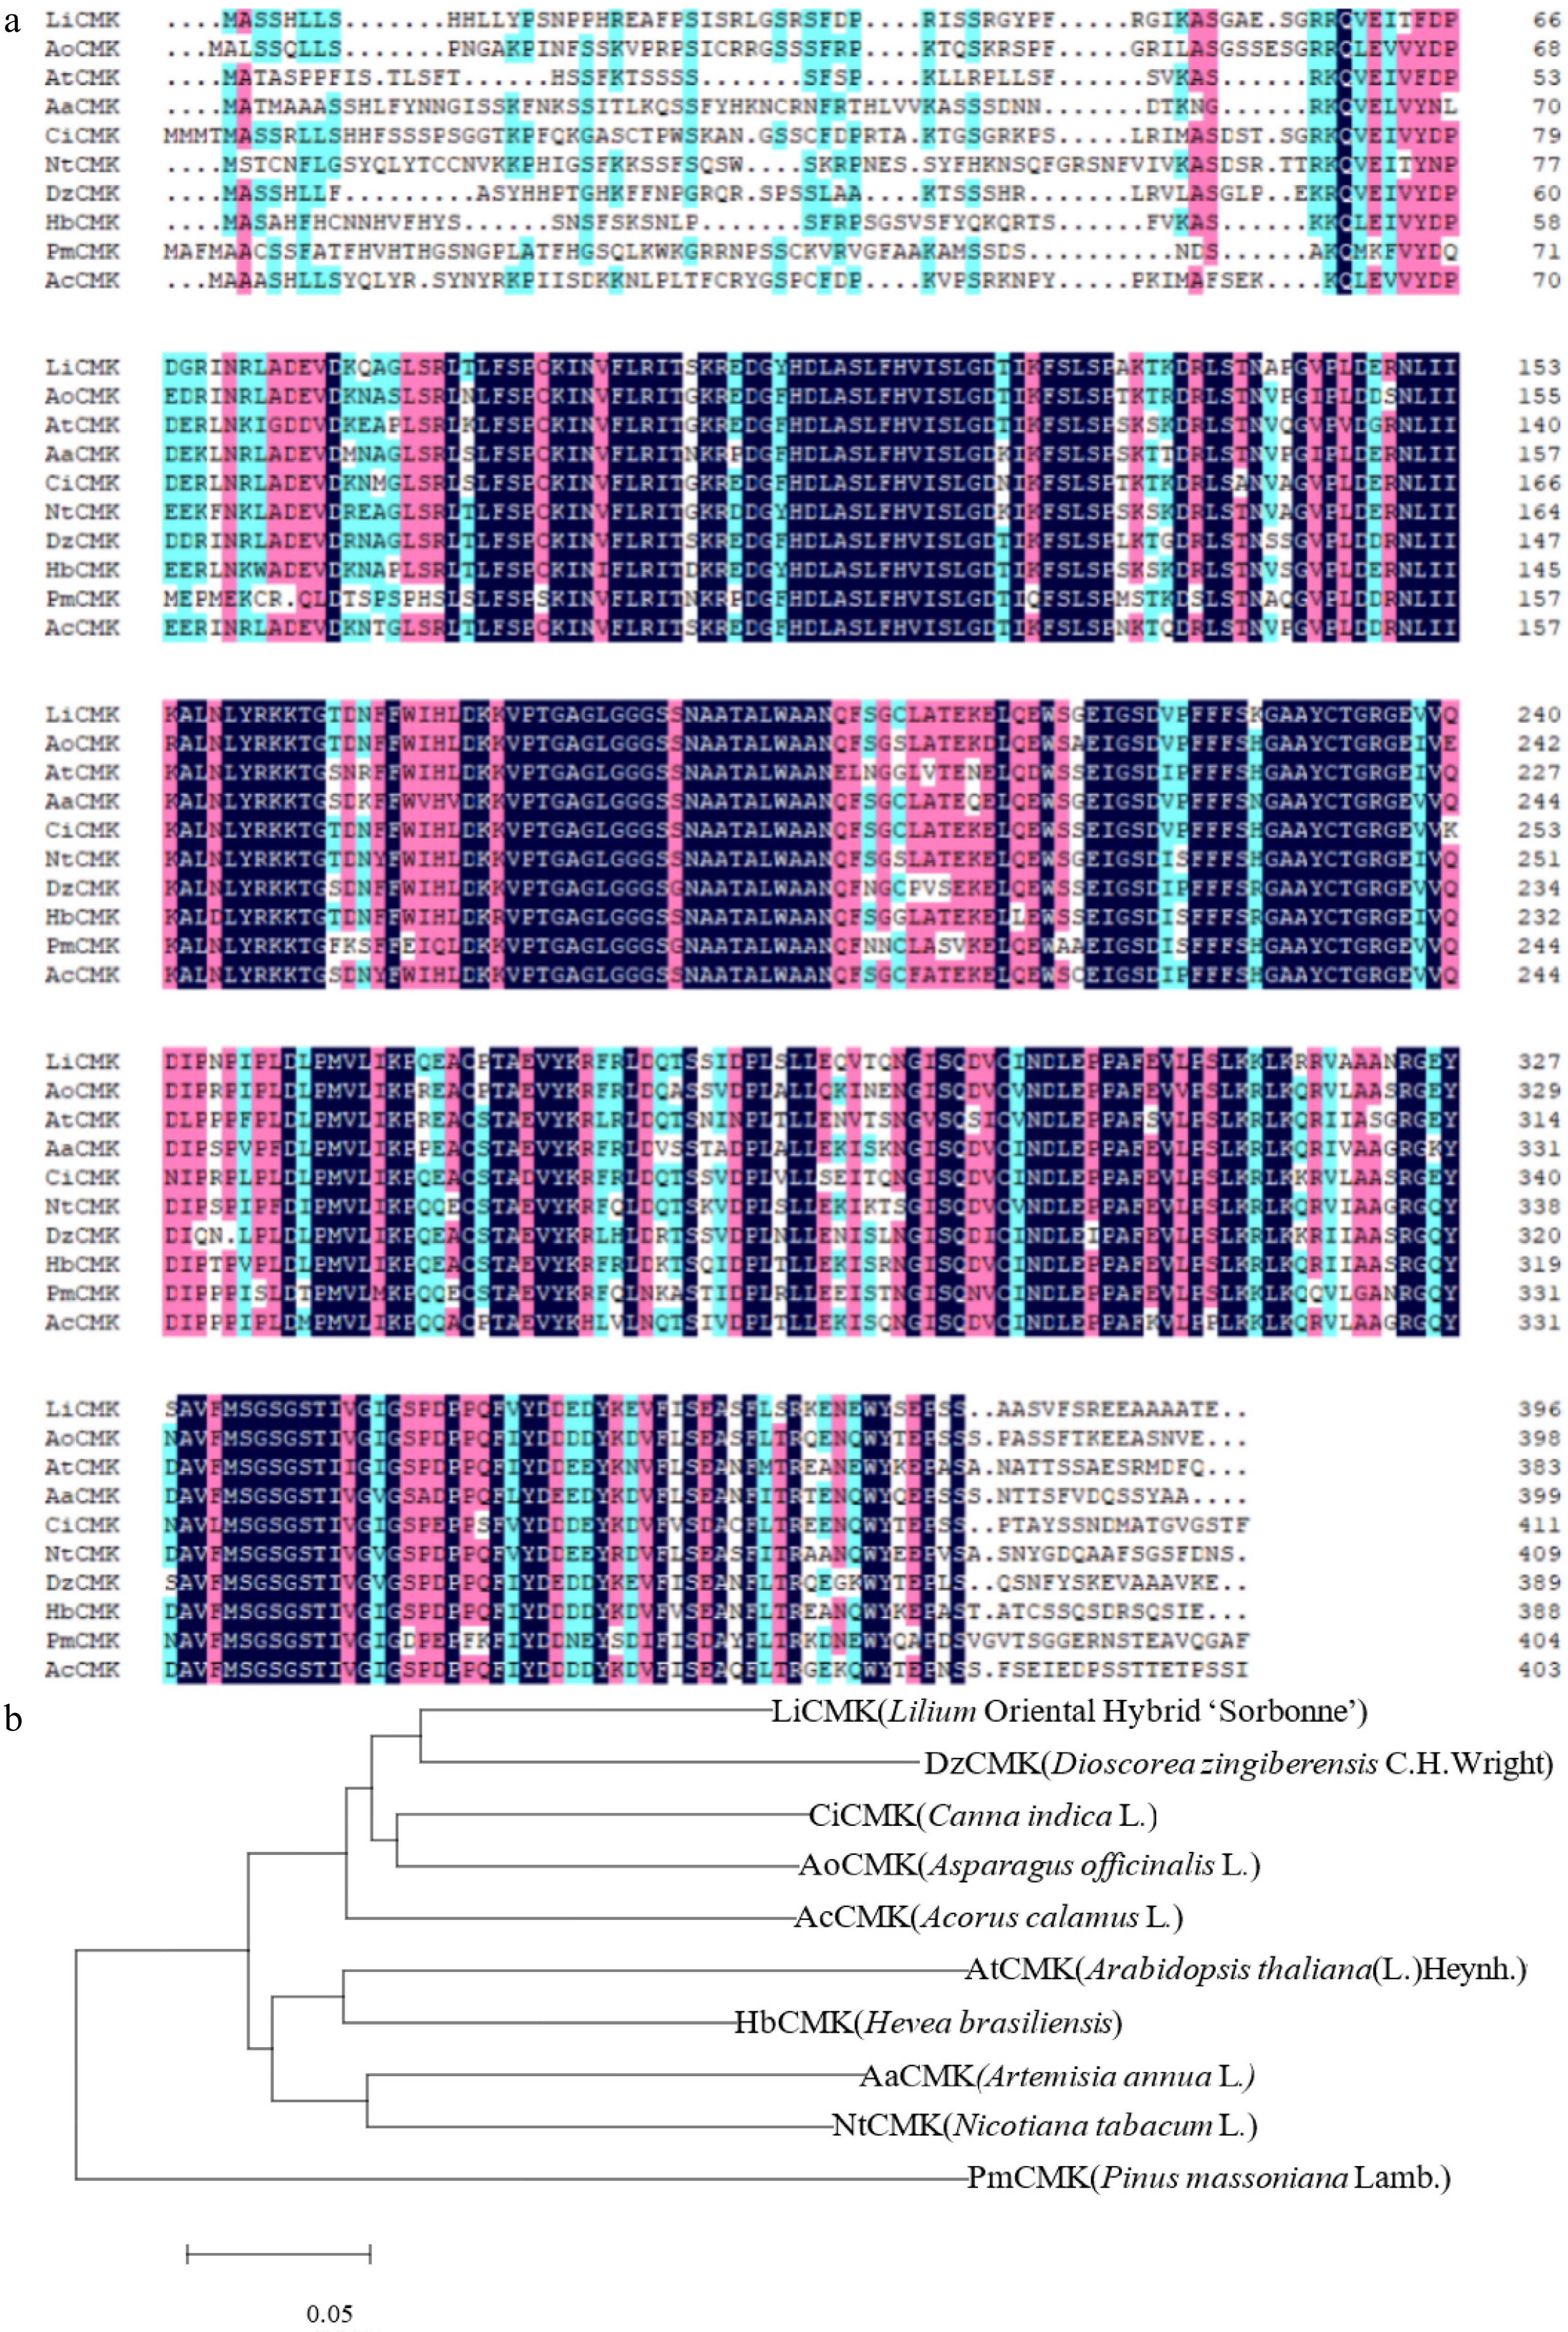
Figure 1.
Phylogenetic analysis and multiple sequence alignment of LiCMK with known homologs. (a) Multiple sequence alignment of the amino acid sequences of LiCMK and CMK proteins from other plant species. (b) Phylogenetic analysis of LiCMK from Lilium 'Sorbonne' and CMK homologs from other species.
-
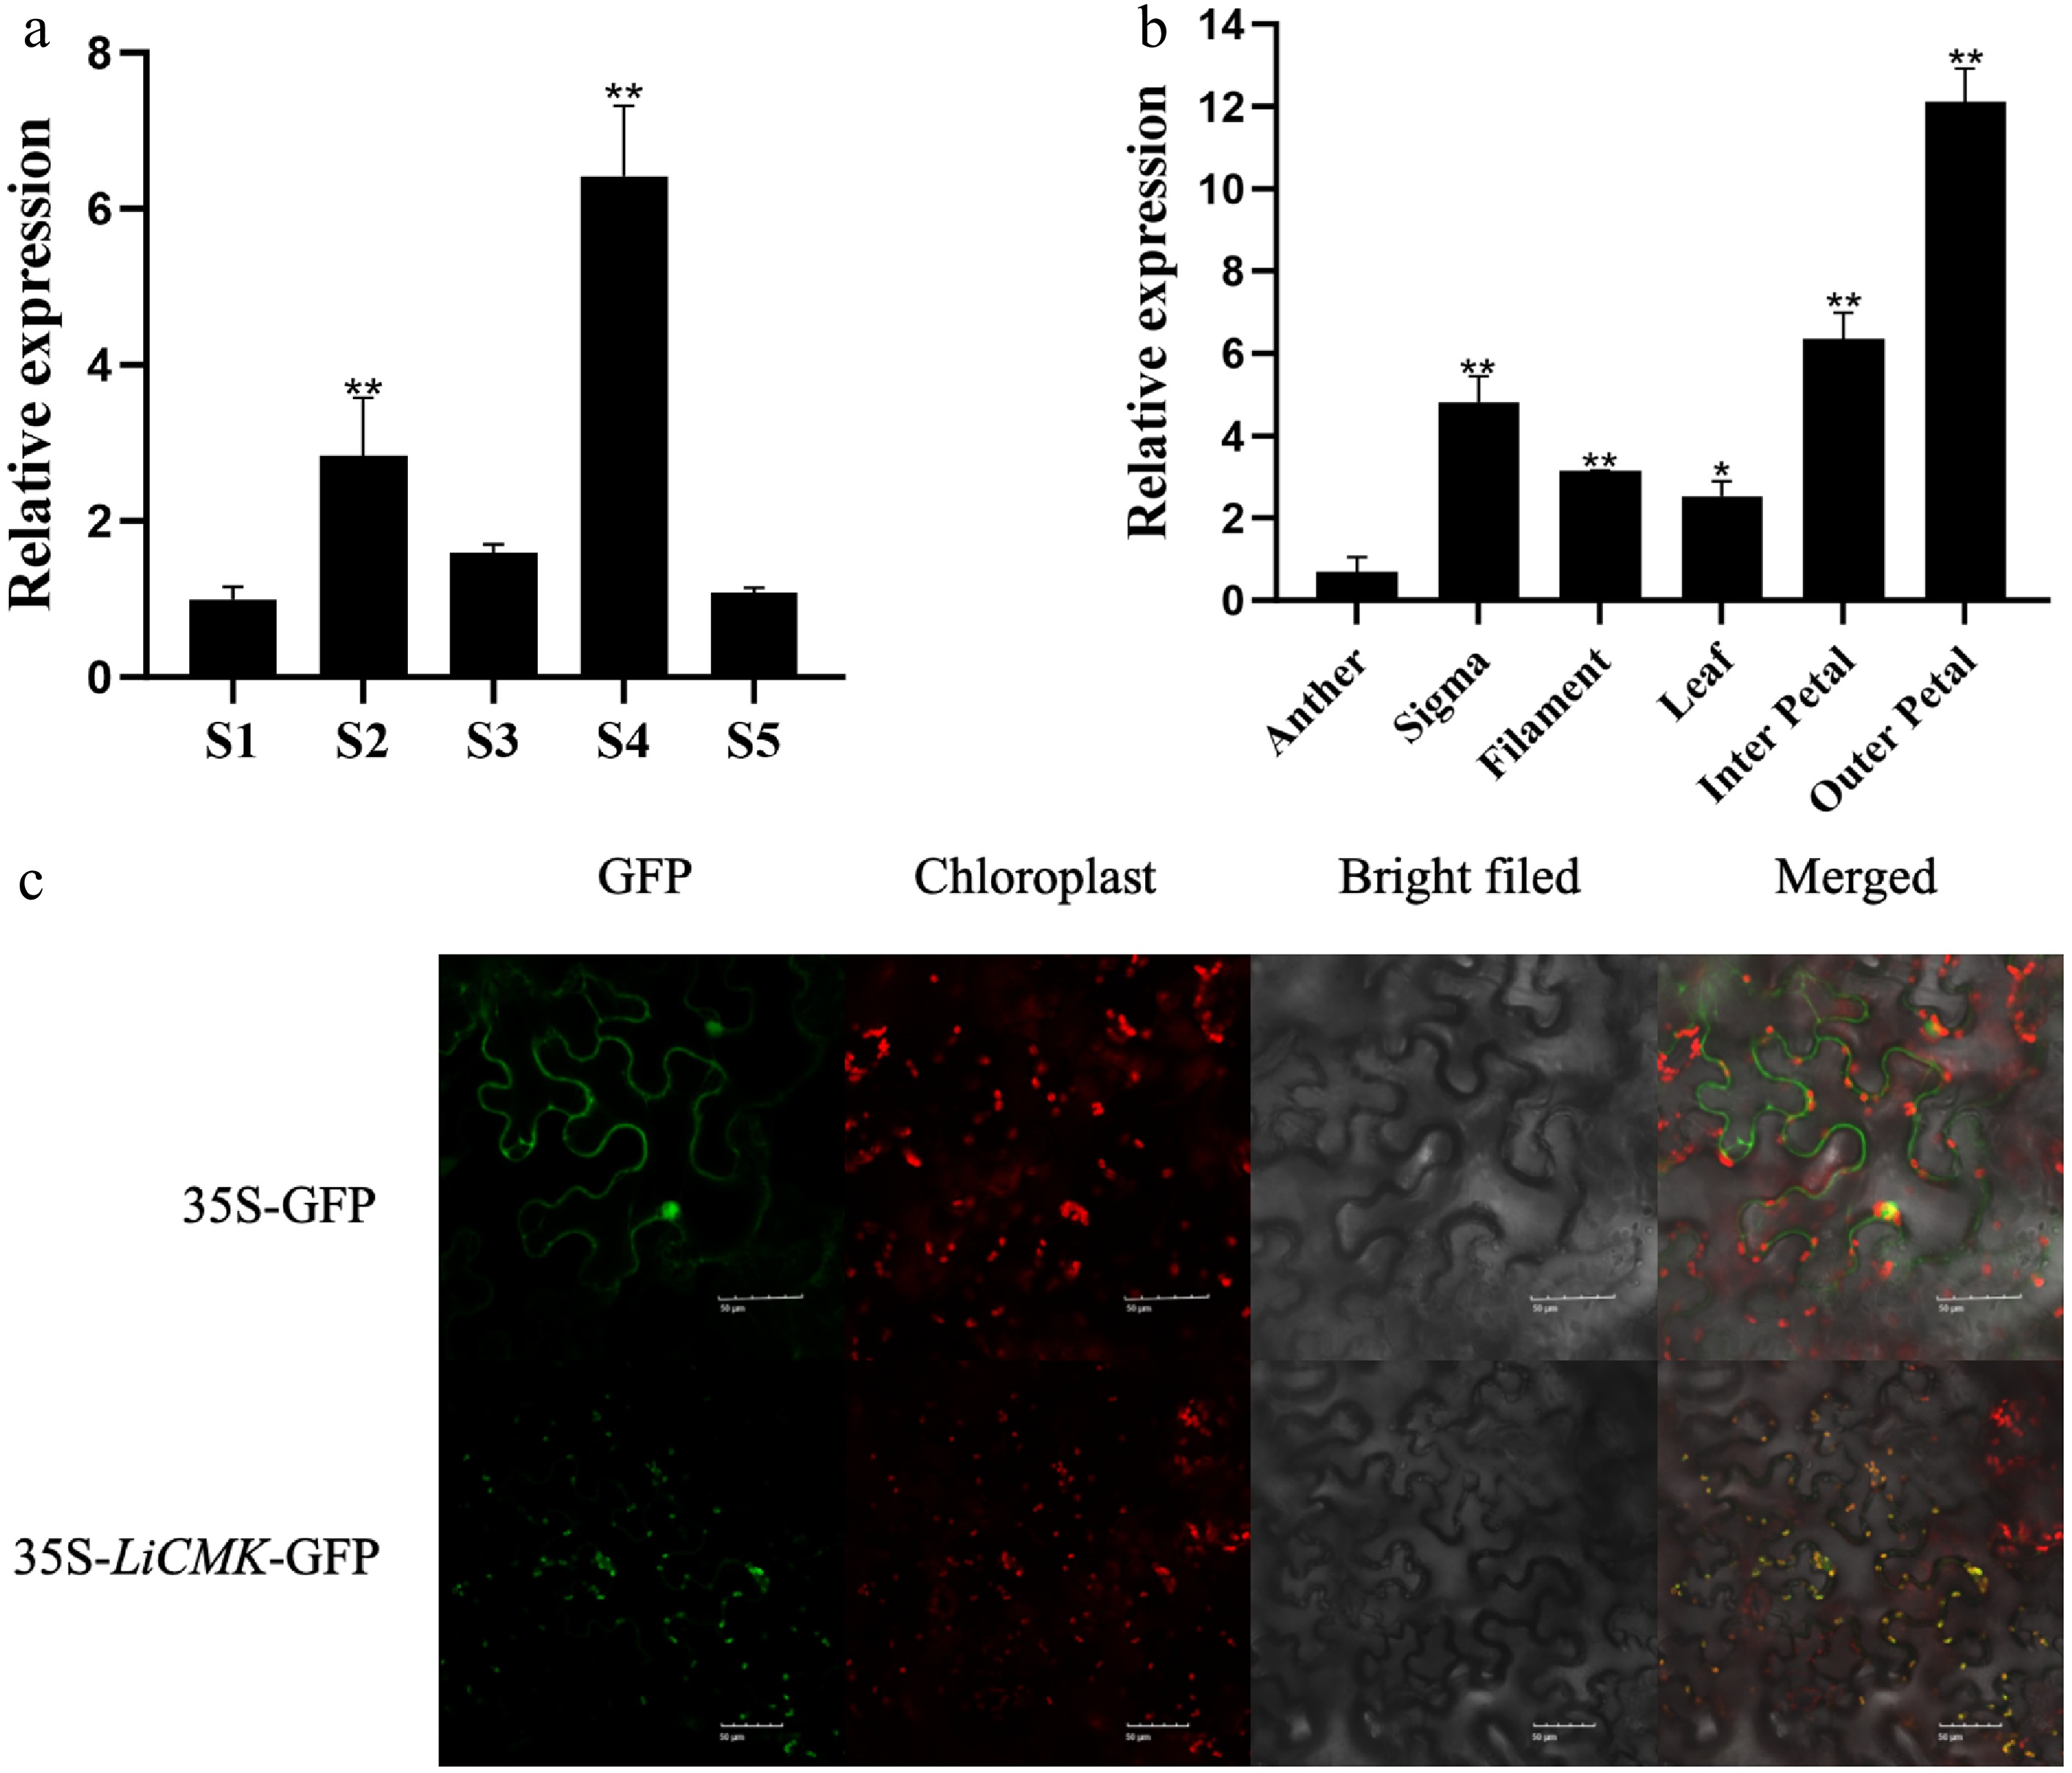
Figure 2.
Temporal-spatial characterization and subcellular localization of LiCMK in Lilium 'Sorbonne'. (a) Expression analysis of LiCMK at different developmental stages in Lilium 'Sorbonne'. (b) Tissue-specific expression analysis of LiCMK in Lilium 'Sorbonne'. (c) Subcellular localization of LiCMK. Asterisks denote statistically significant difference, * p < 0.05, ** p < 0.01.
-
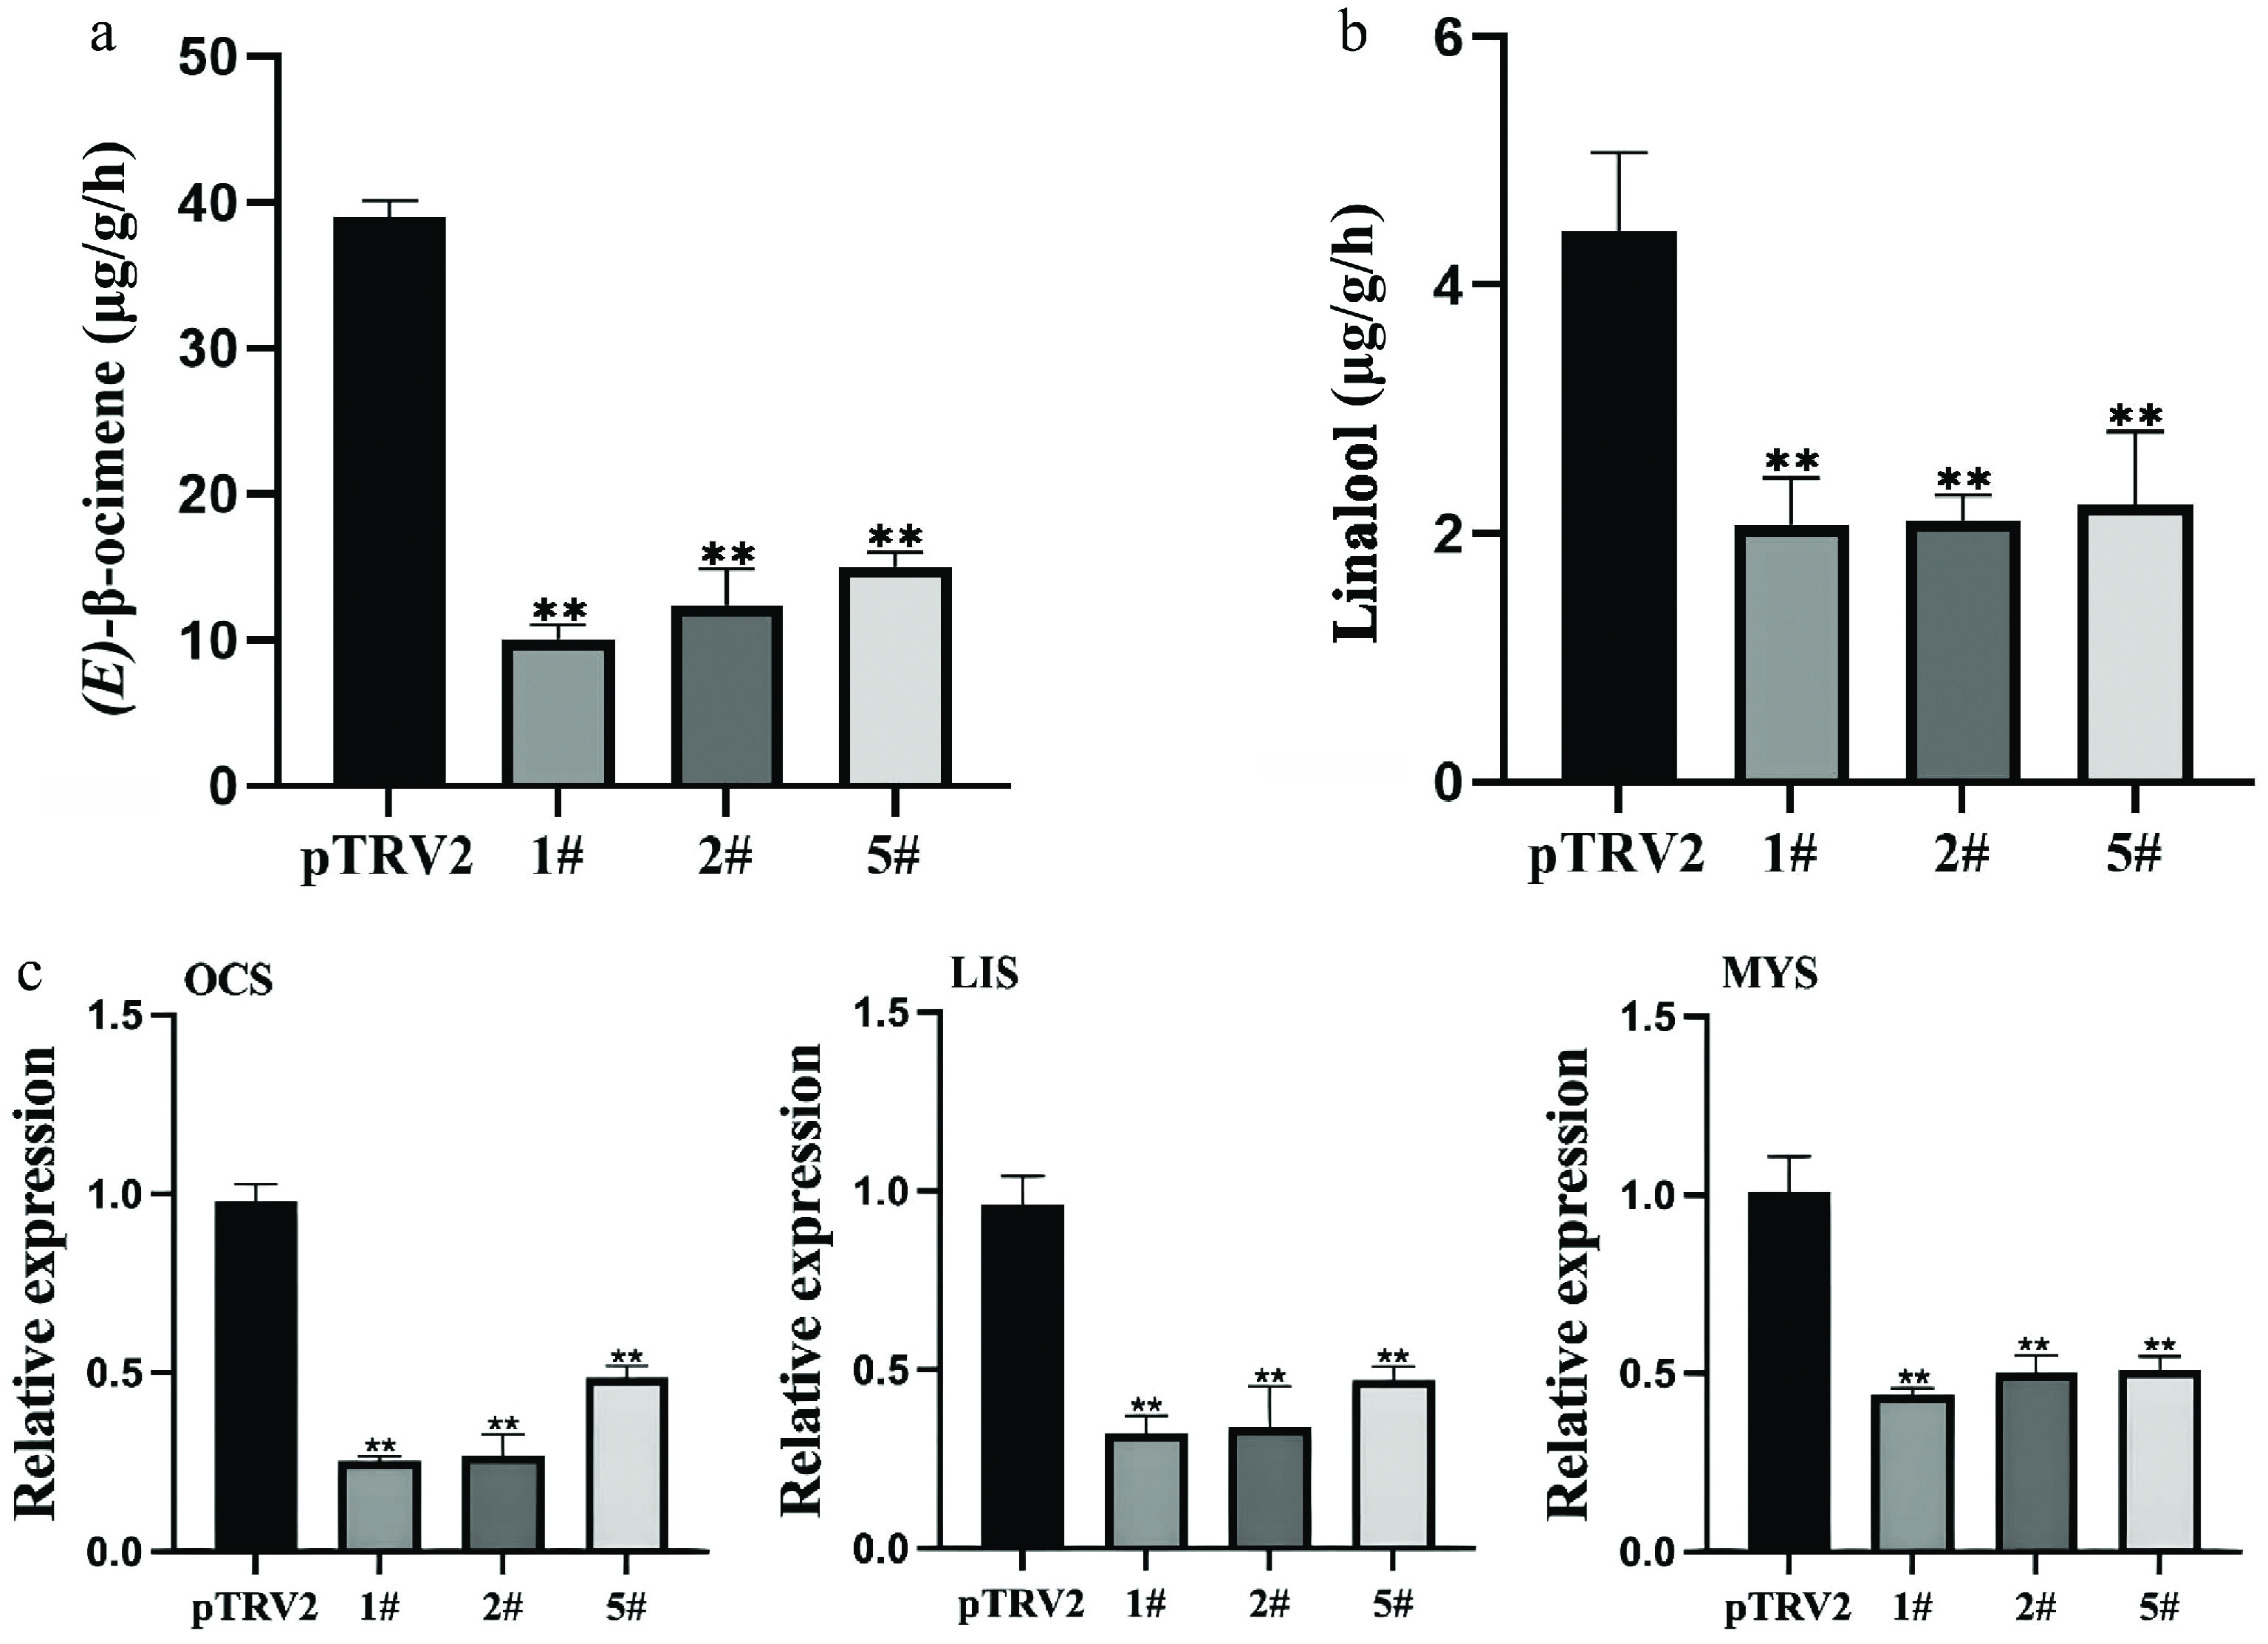
Figure 3.
Effects of LiCMK silencing on monoterpene accumulation and synthase gene expression in Lilium 'Sorbonne'. (a), (b) Contents of (E)-β-ocimene and linalool in petals after LiCMK silencing. (c) Relative expression levels of monoterpene synthase genes in response to LiCMK silencing. pTRV2: empty vector control; 1#, 2#, and 5#: LiCMK-silenced lines; OCS: (E)-β-ocimene synthase; LIS: linalool synthase; MYS: myrcene synthase. Data are presented as mean ± SD (n = 3). Asterisks indicate significant differences compared to the pTRV2 control group (one-way ANOVA followed by Duncan's test, * p < 0.05, ** p < 0.01).
-
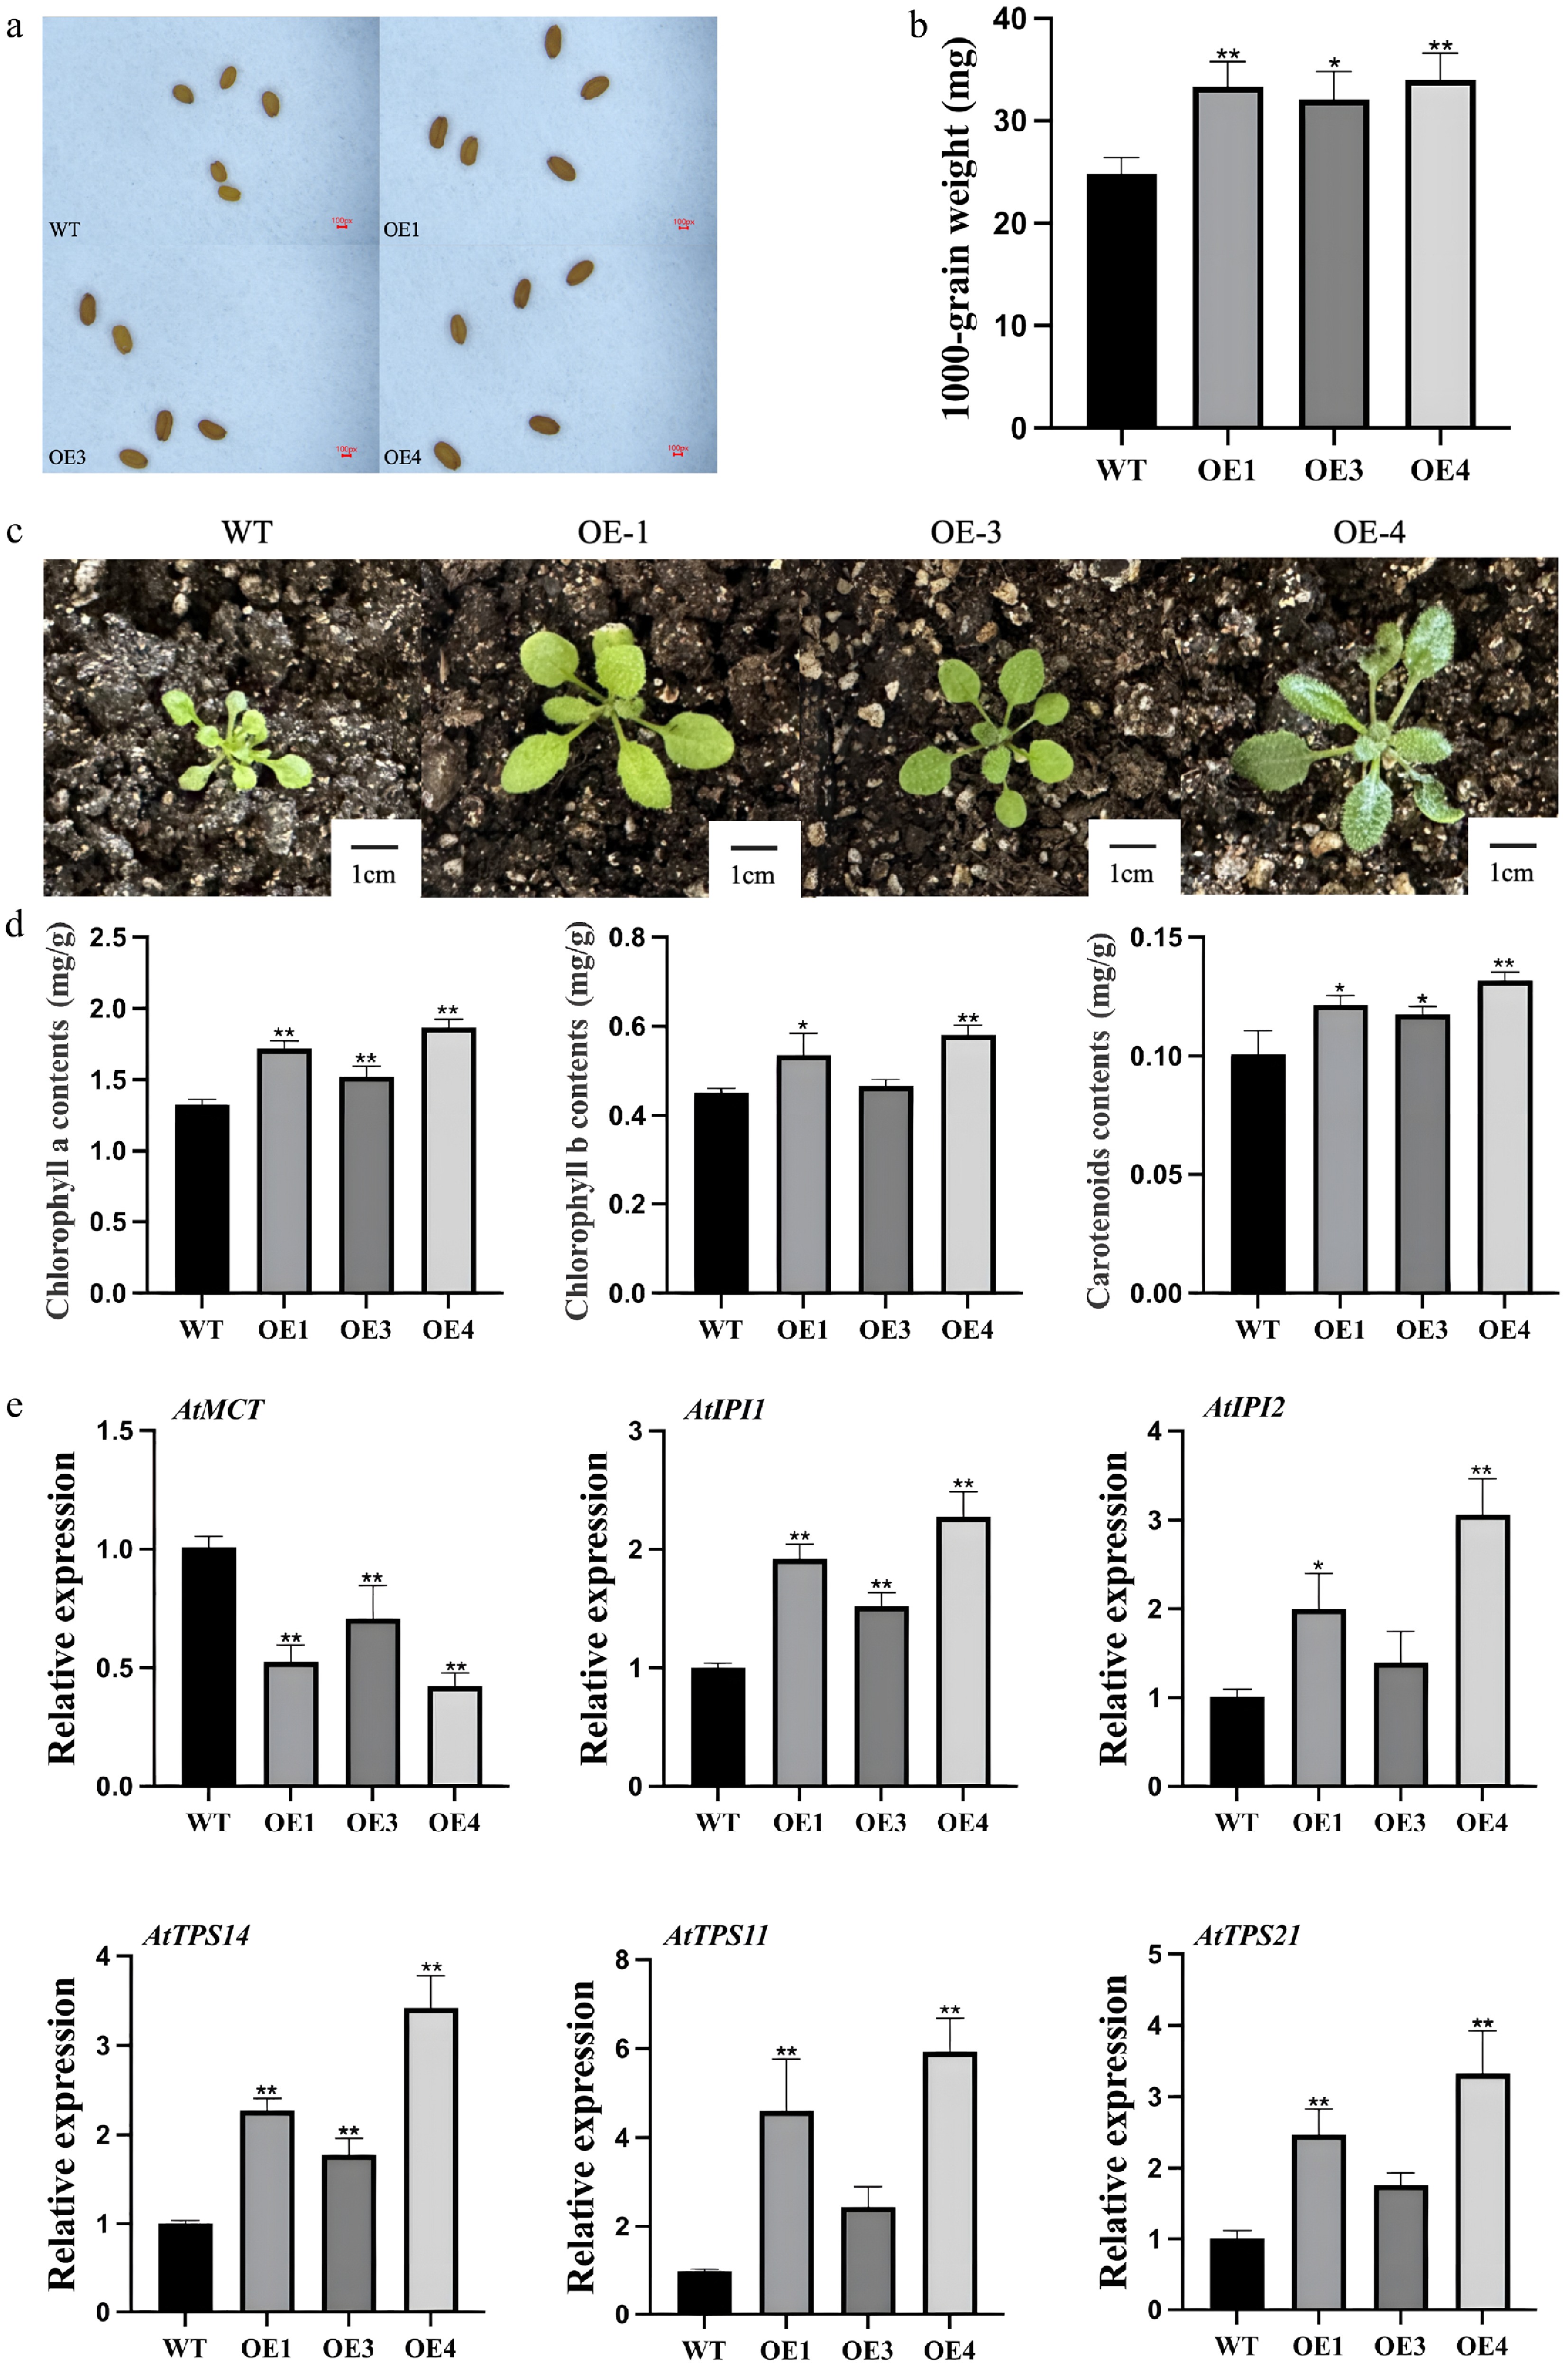
Figure 4.
Phenotypic and gene expression analysis of transgenic and mutant Arabidopsis thaliana. (a) Comparison of seed size between wild-type and transgenic Arabidopsis plants. (b) Thousand-seed weight analysis of wild-type and transgenic lines. (c) Leaf size comparison among different genotypes. (d) Photosynthetic pigment content in leaves of LiCMK-overexpressing Arabidopsis plants. (e) Expression levels of terpenoid biosynthesis-related genes in Arabidopsis. WT, wild-type; OE1, OE3, OE4, LiCMK-overexpression transgenic lines. Data are shown as mean ± SD (n = 3). Asterisks indicate significant differences between each transgenic line (OE), and the wild-type (WT) control (one-way ANOVA followed by Duncan's test, * p < 0.05, ** p < 0.01).
-
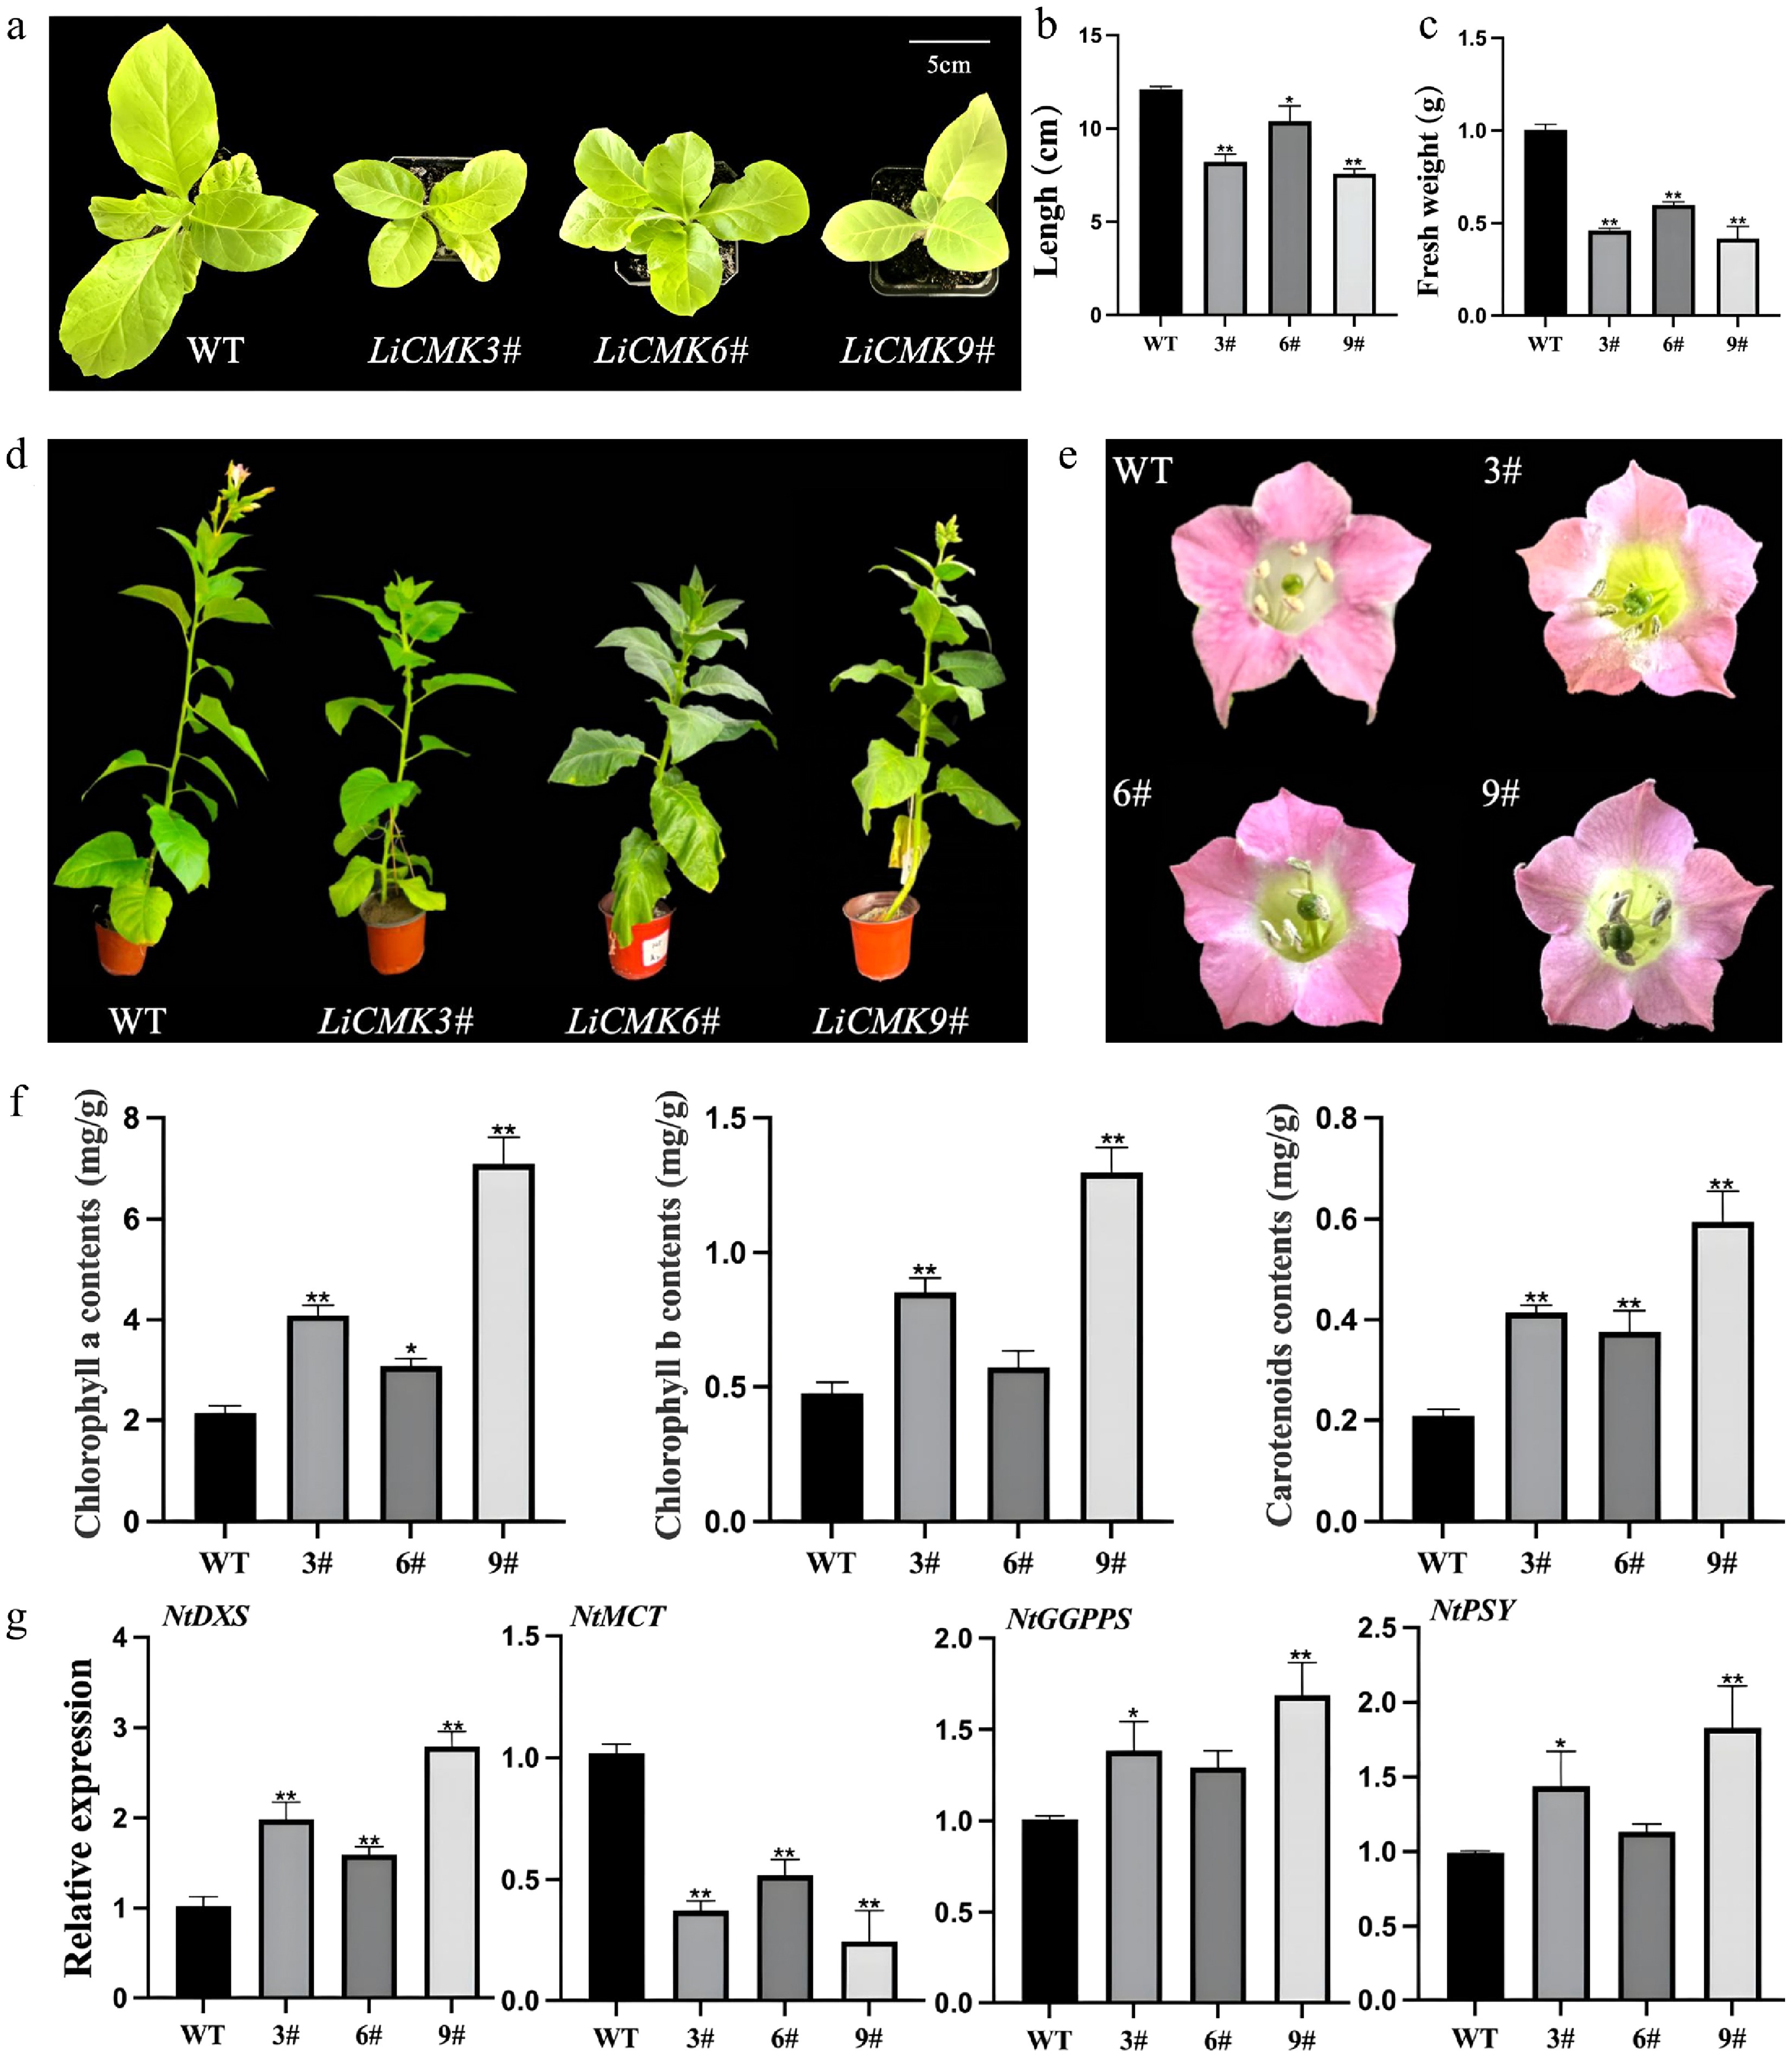
Figure 5.
Phenotypic and gene expression analysis of transgenic tobacco. Comparison of (a) one-month-old seedling phenotype, (b) leaf length, and (c) fresh weight between wild-type and transgenic lines. (d) Comparison of the phenotypes of wild type (WT) and LiCMK transgenic lines of tobacco. (e) Phenotypic comparison of flowers between wild-type and transgenic tobacco plants. (f) Analysis of photosynthetic pigments in leaves of transgenic tobacco plants. (g) Relative expression levels of genes involved in the terpenoid biosynthesis pathway in transgenic tobacco. WT, wild-type; 3#, 6#, 9#, transgenic tobacco lines. Data are presented as mean ± SD (n = 3). Asterisks indicate significant differences between the wild-type (WT) and transgenic lines (one-way ANOVA followed by Duncan's test, * p < 0.05, ** p < 0.01).
-
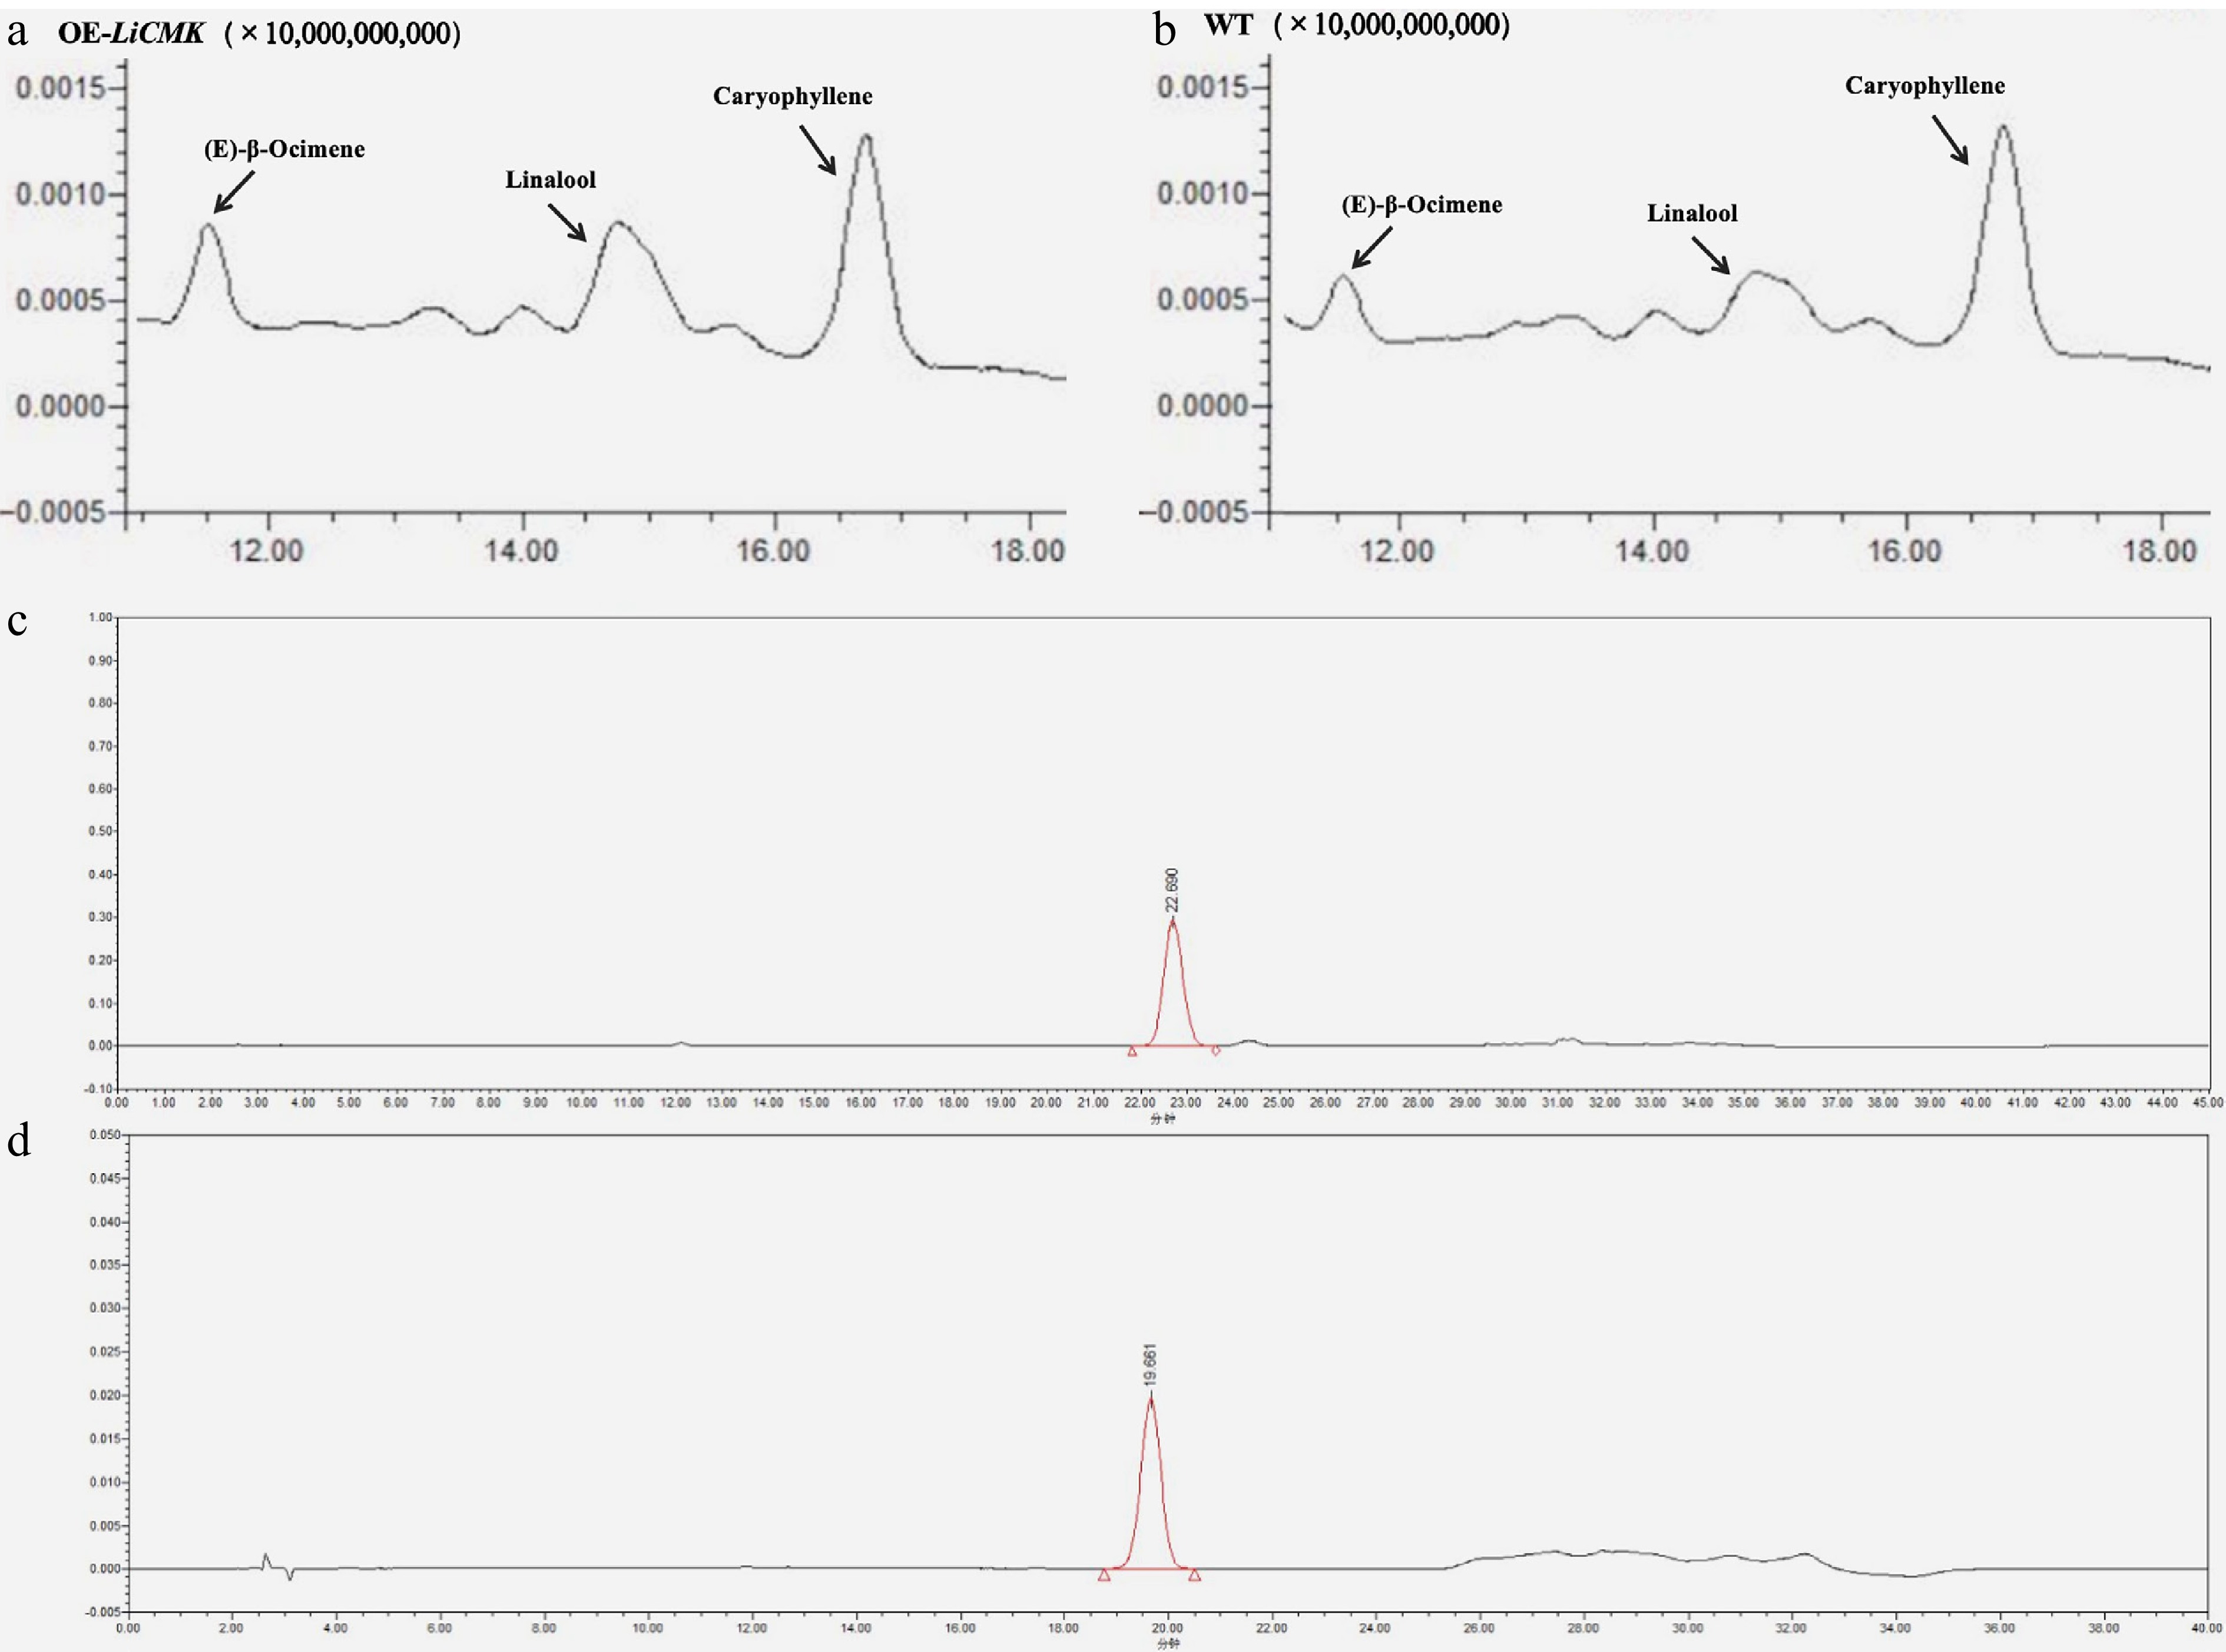
Figure 6.
Total ion chromatograms (TIC). (a) TIC of major volatile compounds in transgenic tobacco hybrid samples. (b) TIC of major volatile compounds in wild-type (WT) tobacco. (c) Chromatogram of GA3 standard. (d) Chromatogram of ABA standard.
-
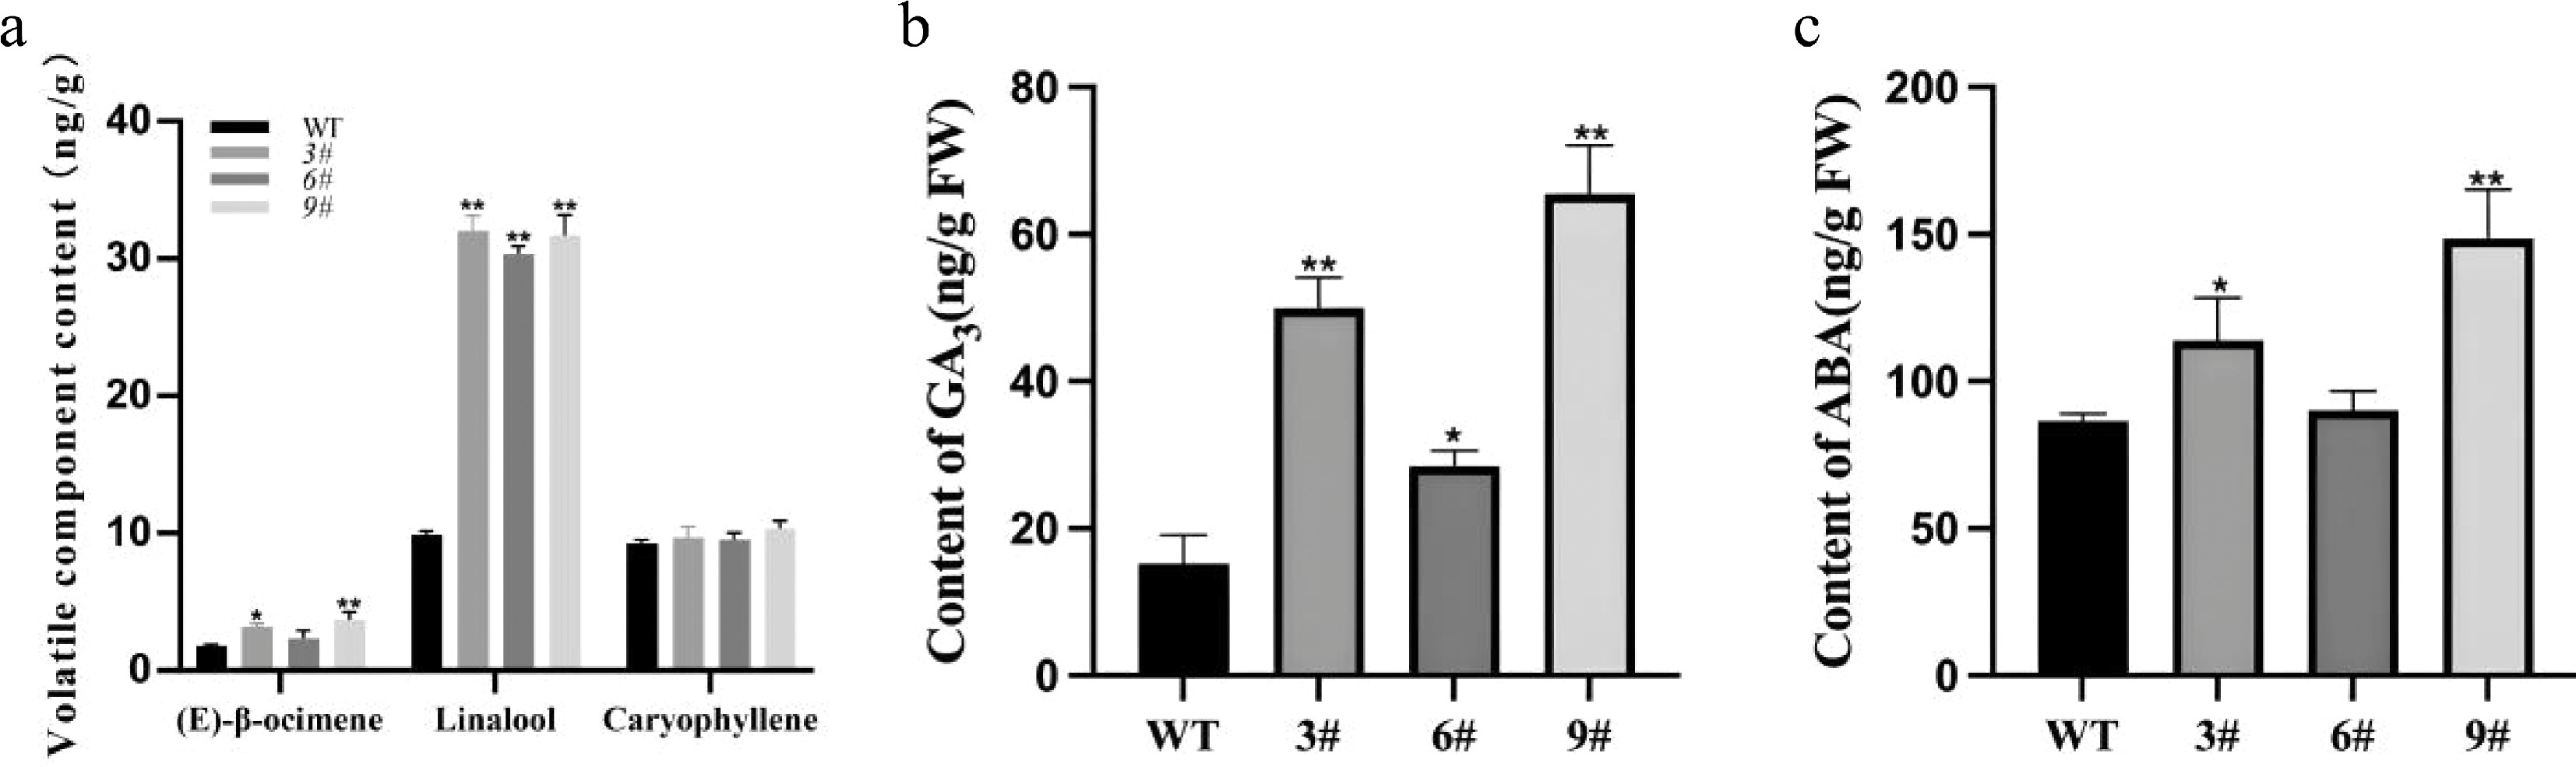
Figure 7.
Analysis of volatile compounds and phytohormones in transgenic tobacco. (a) Contents of major terpenes in flowers of wild-type and transgenic tobacco plants. (b),(c) Endogenous GA3 and ABA contents in LiCMK-overexpressing transgenic tobacco lines. WT, wild-type; 3#, 6#, 9#, independent transgenic lines. Data are shown as mean ± SD (n = 3). Asterisks indicate significant differences between the wild-type (WT) and transgenic lines (one-way ANOVA followed by Duncan's test, * p < 0.05, ** p < 0.01).
Figures
(7)
Tables
(0)