-
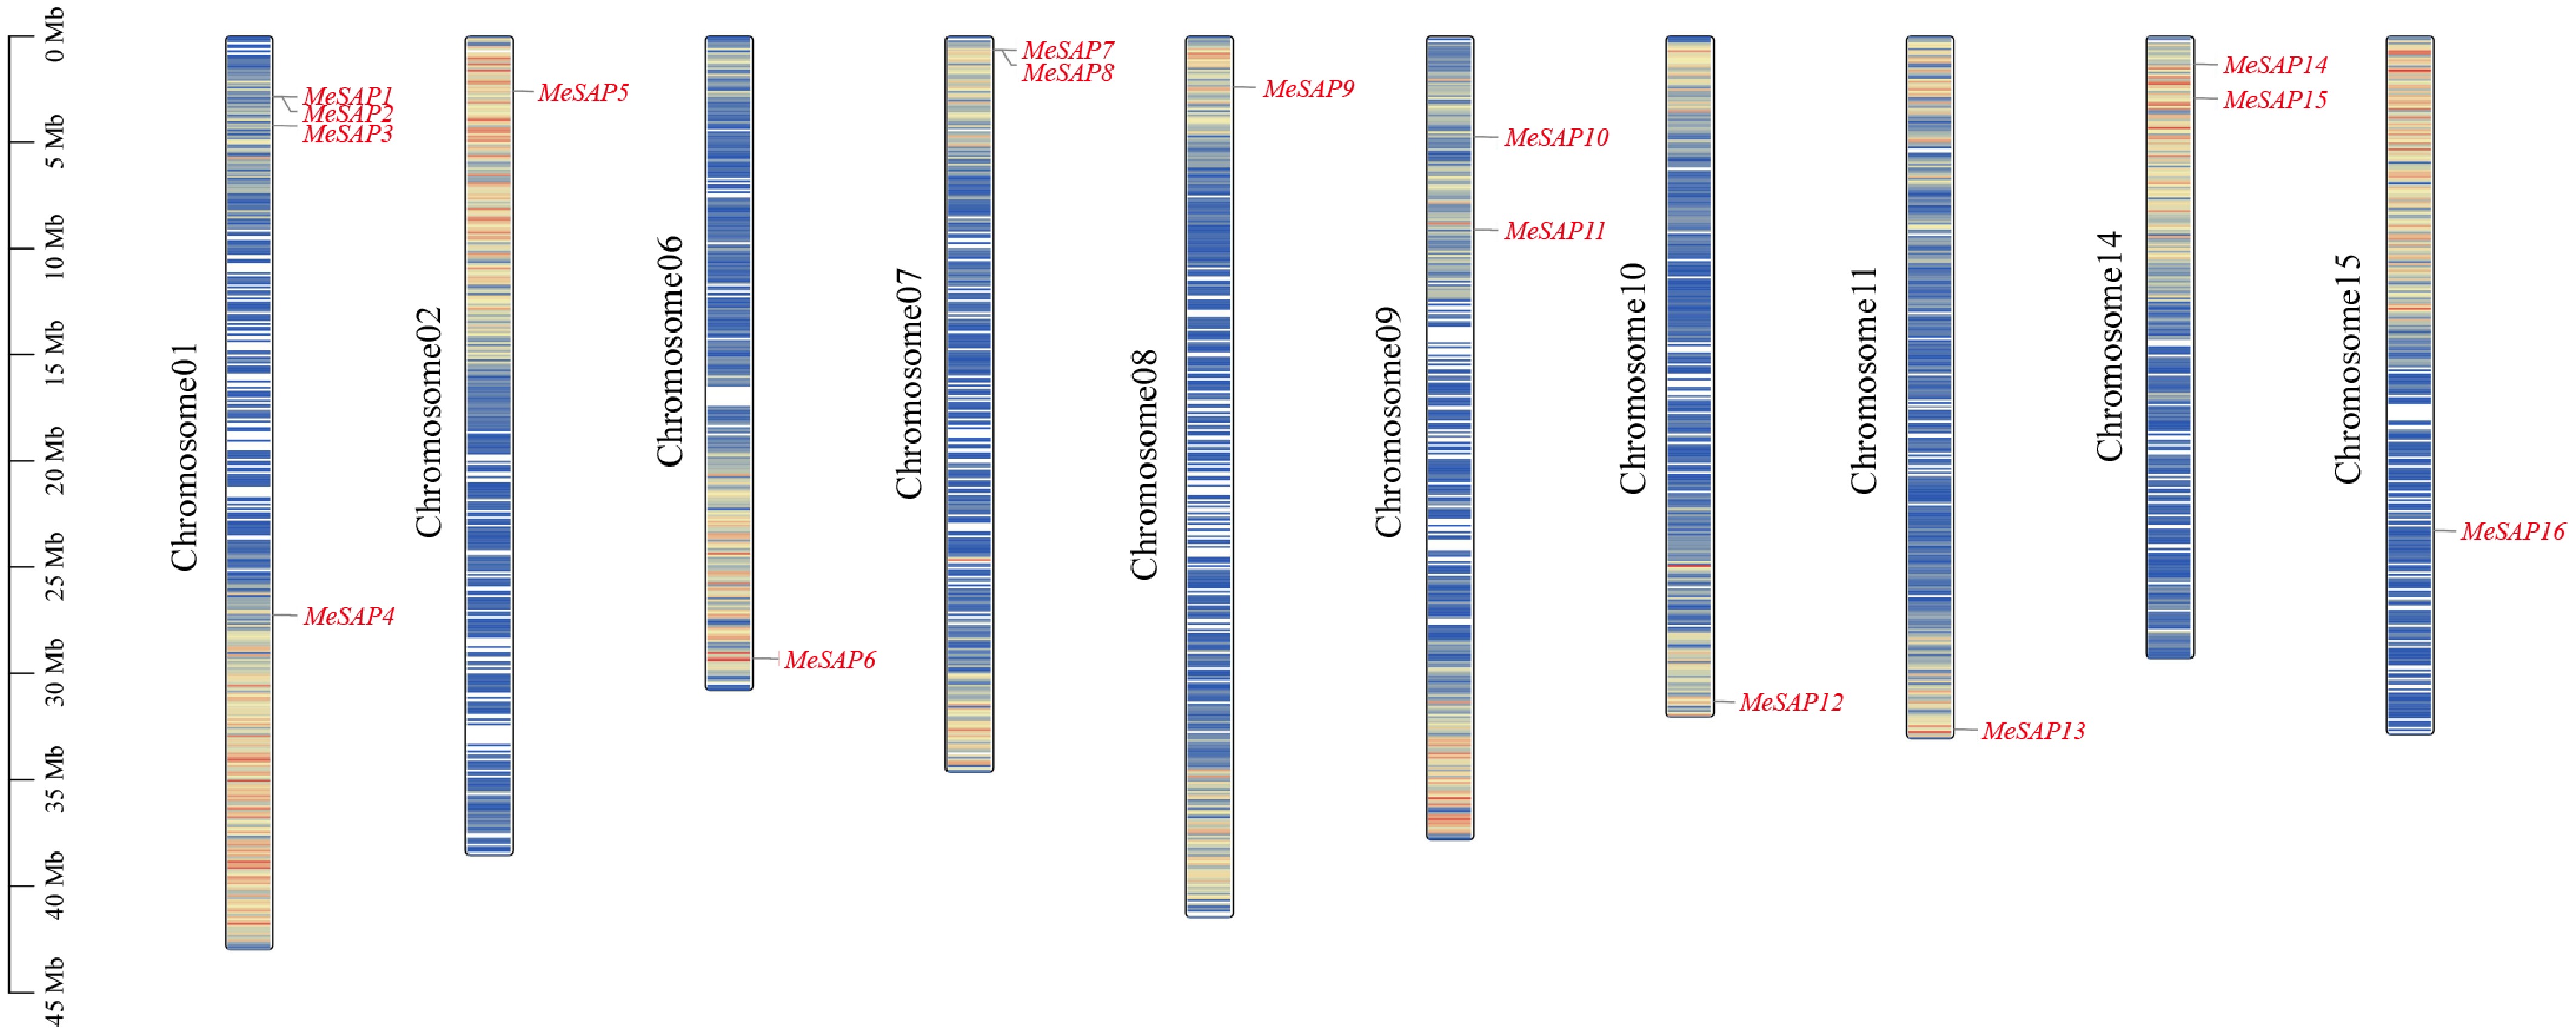
Figure 1.
Distribution of the SAP genes among 10 cassava chromosomes. The scale of the left side represents the length of chromosome displayed in megabase (Mb).
-
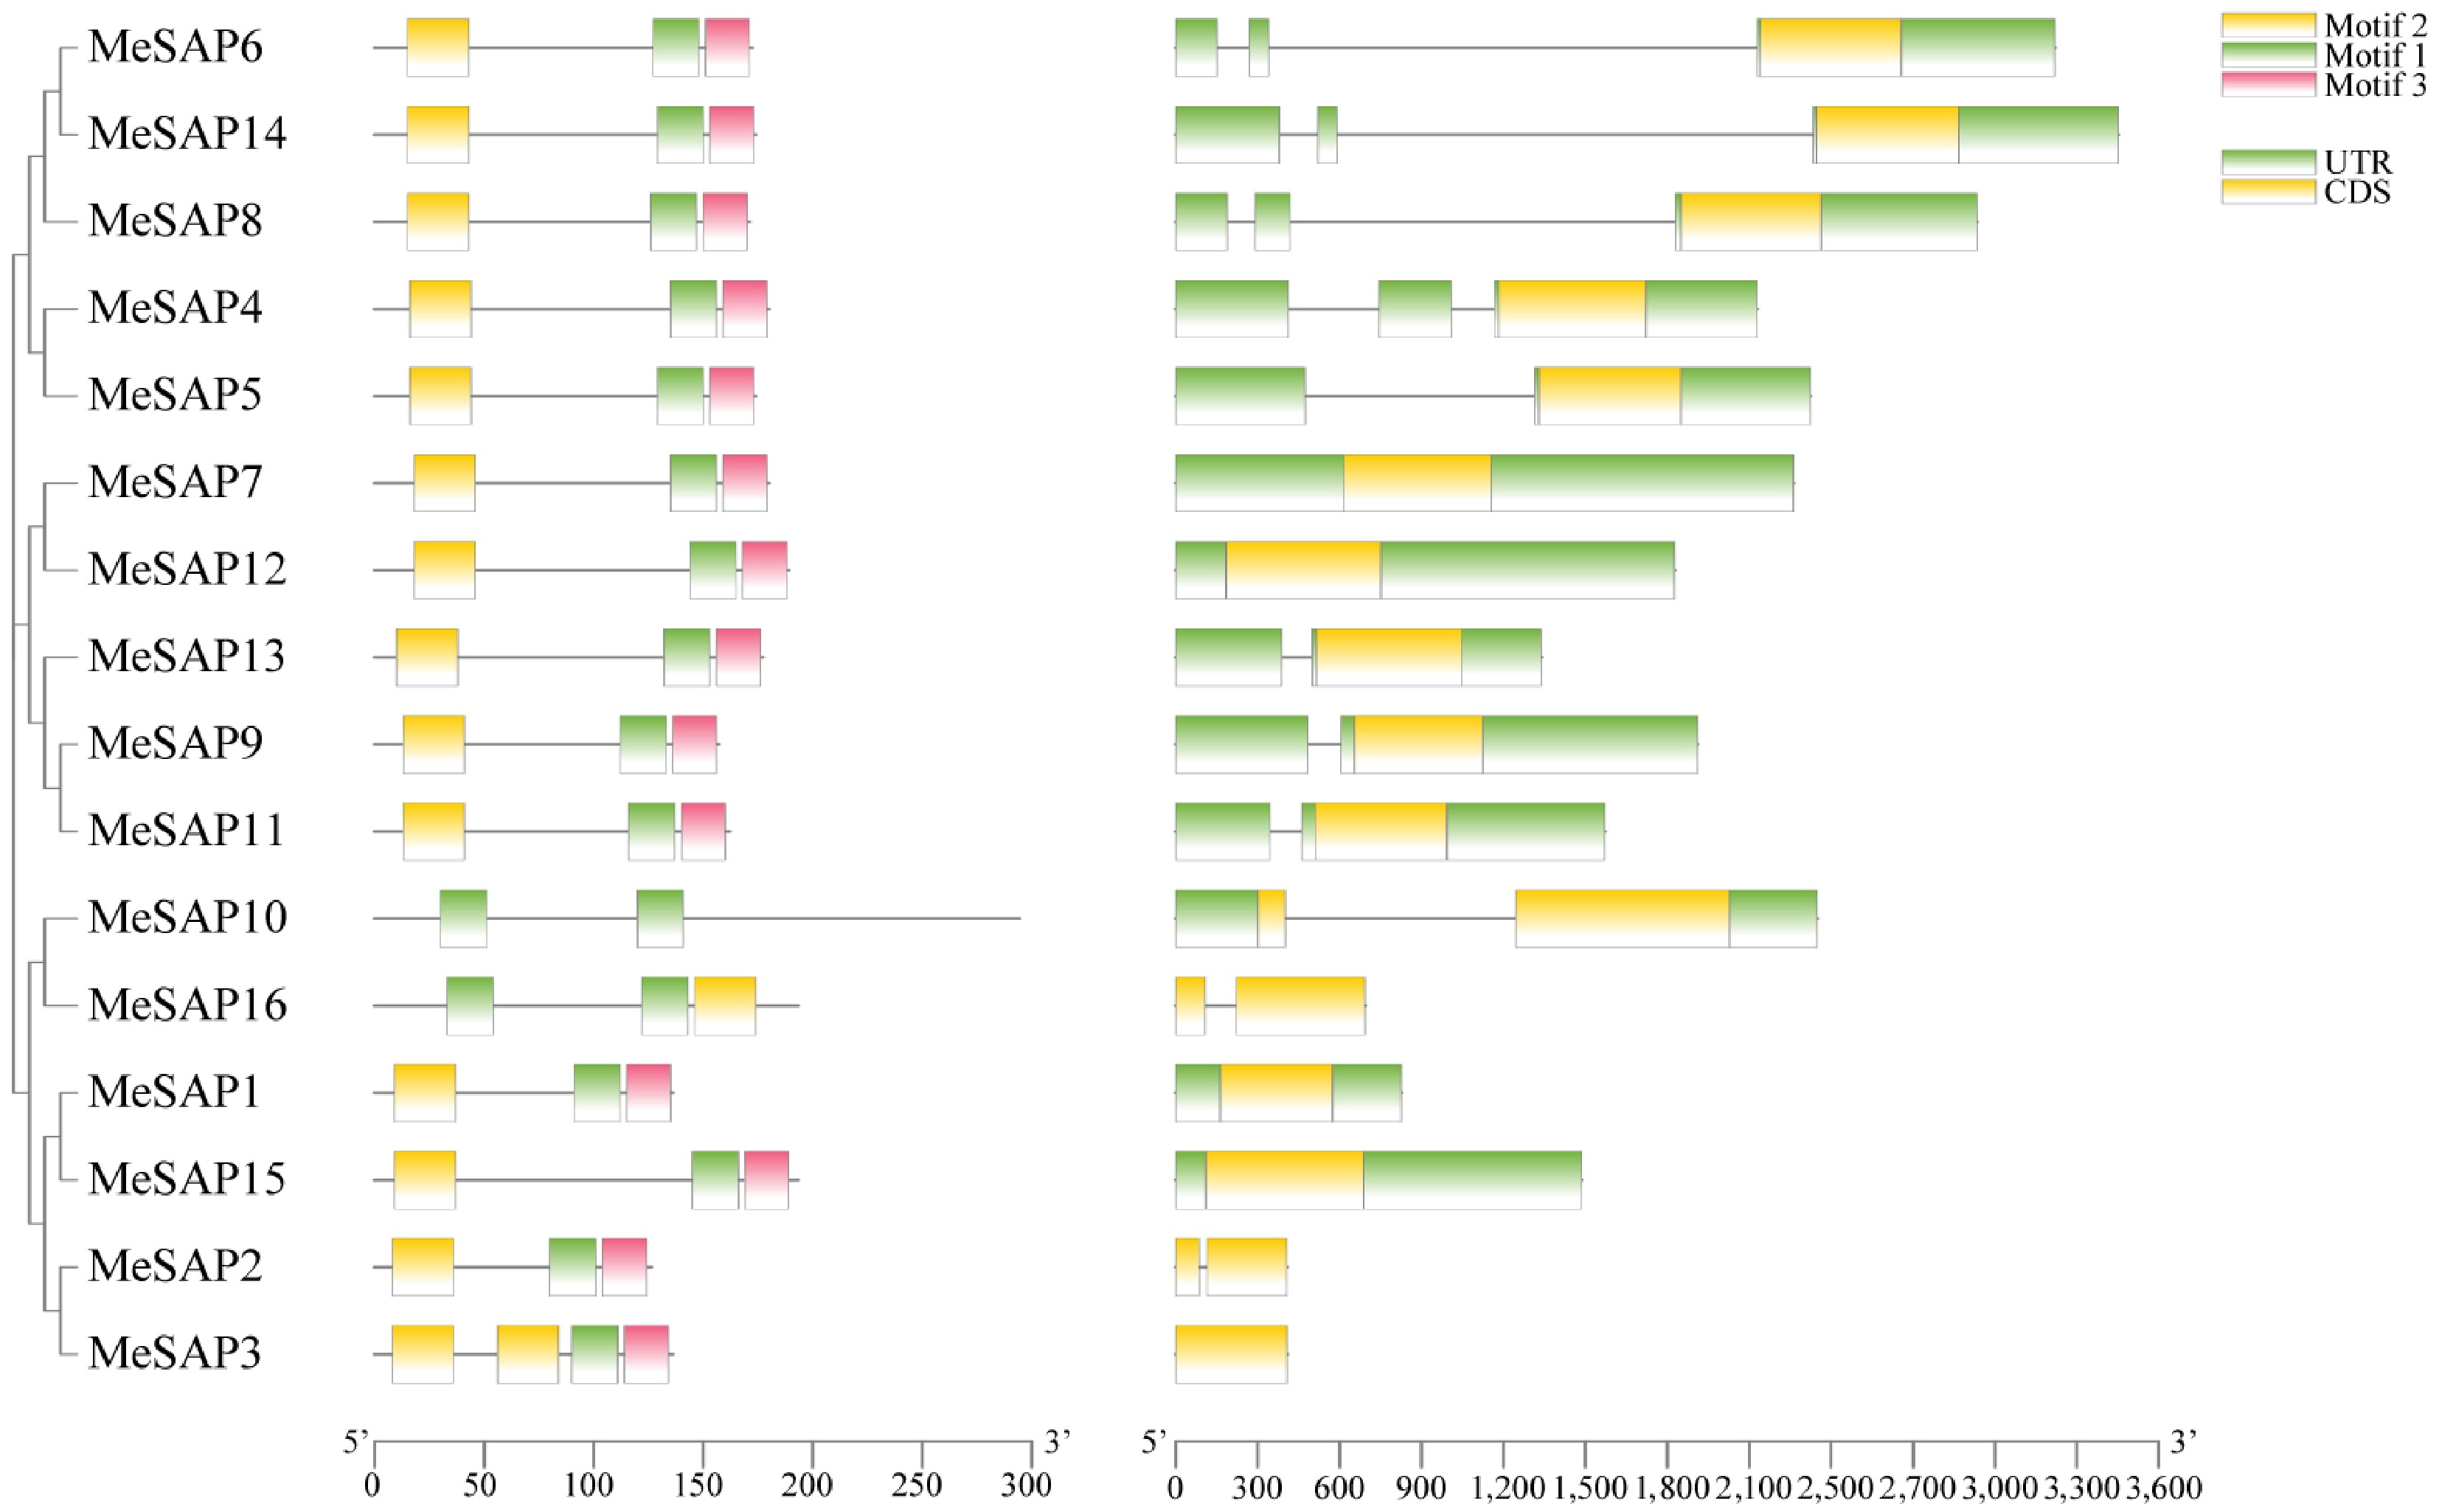
Figure 2.
The structure, clustering, and conserved motif analysis of cassava MeSAP proteins. The left side illustrates the gene structure of the cassava MeSAP gene family. The right side displays the conserved motifs of cassava MeSAP proteins.
-
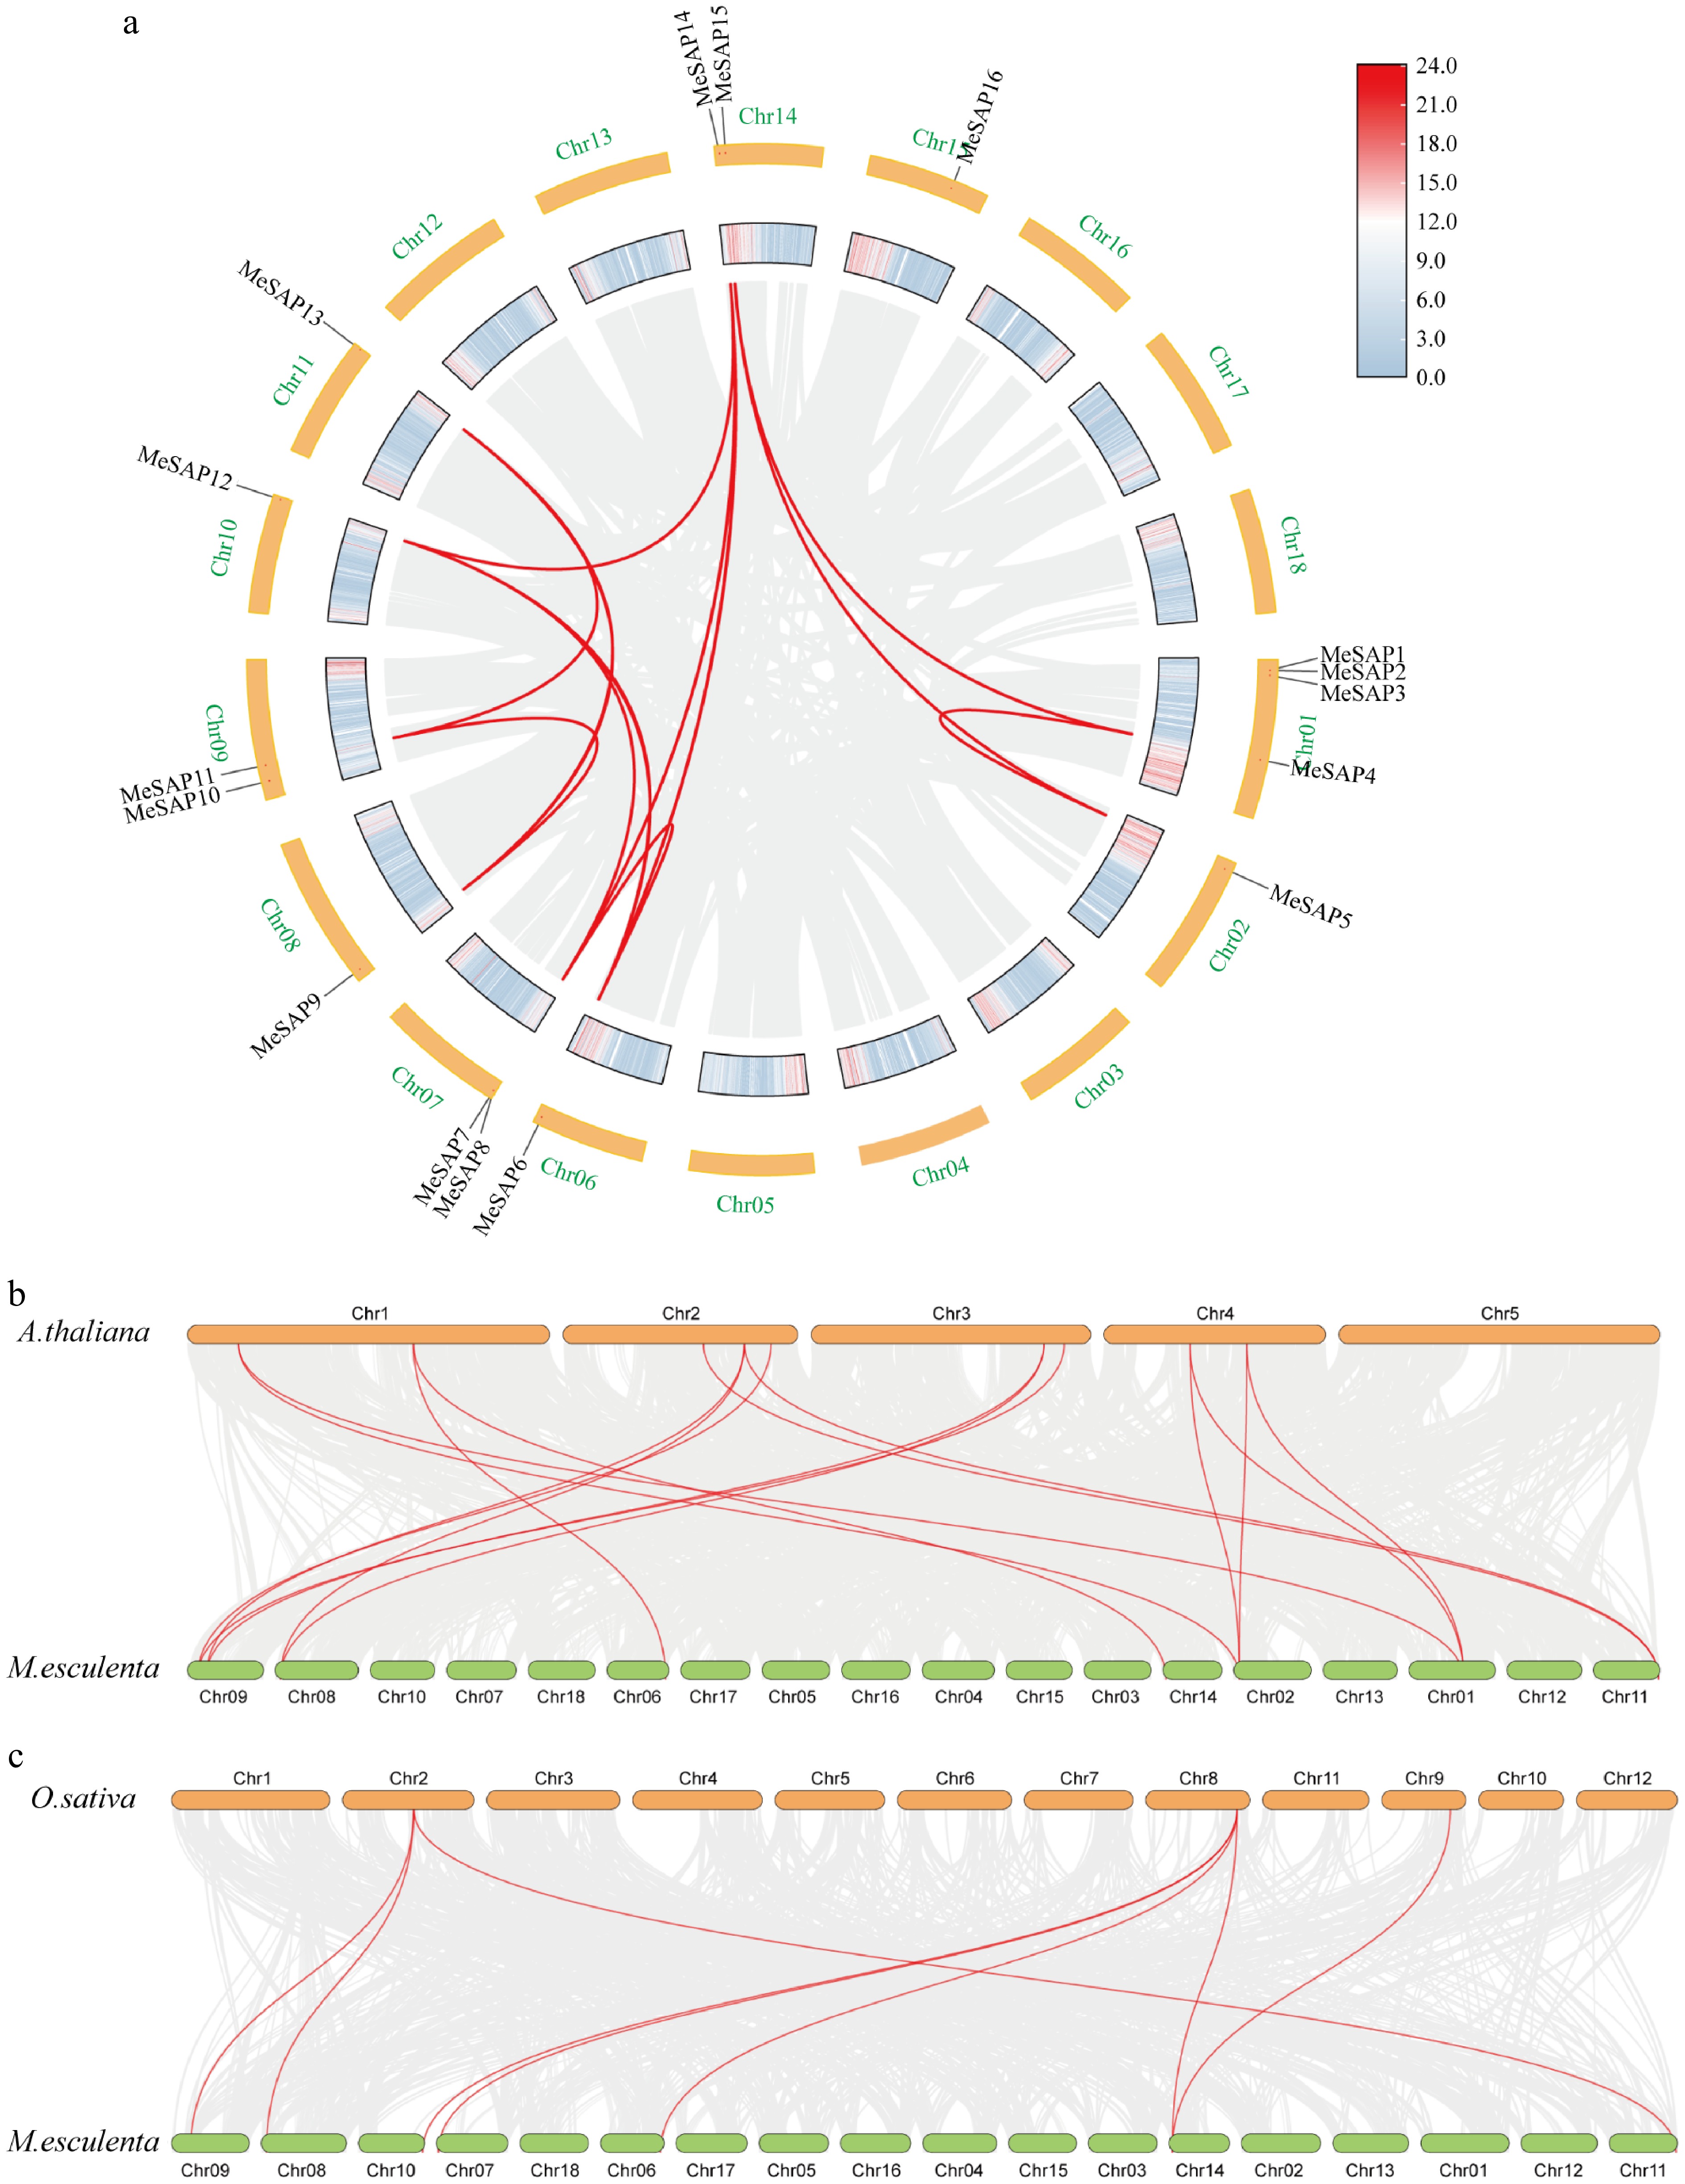
Figure 3.
Duplication and collinearity analysis of SAP genes between cassava, Arabidopsis, and rice. (a) Duplicated MeSAP genes on the cassava chromosomes. (b) Duplicated SAP genes on the cassava and rice chromosomes. (c) Duplicated SAP genes on the cassava and Arabidopsis chromosomes. Gray lines indicate all synteny blocks in the cassava genome, and the red lines indicate duplicated SAP gene pairs.
-
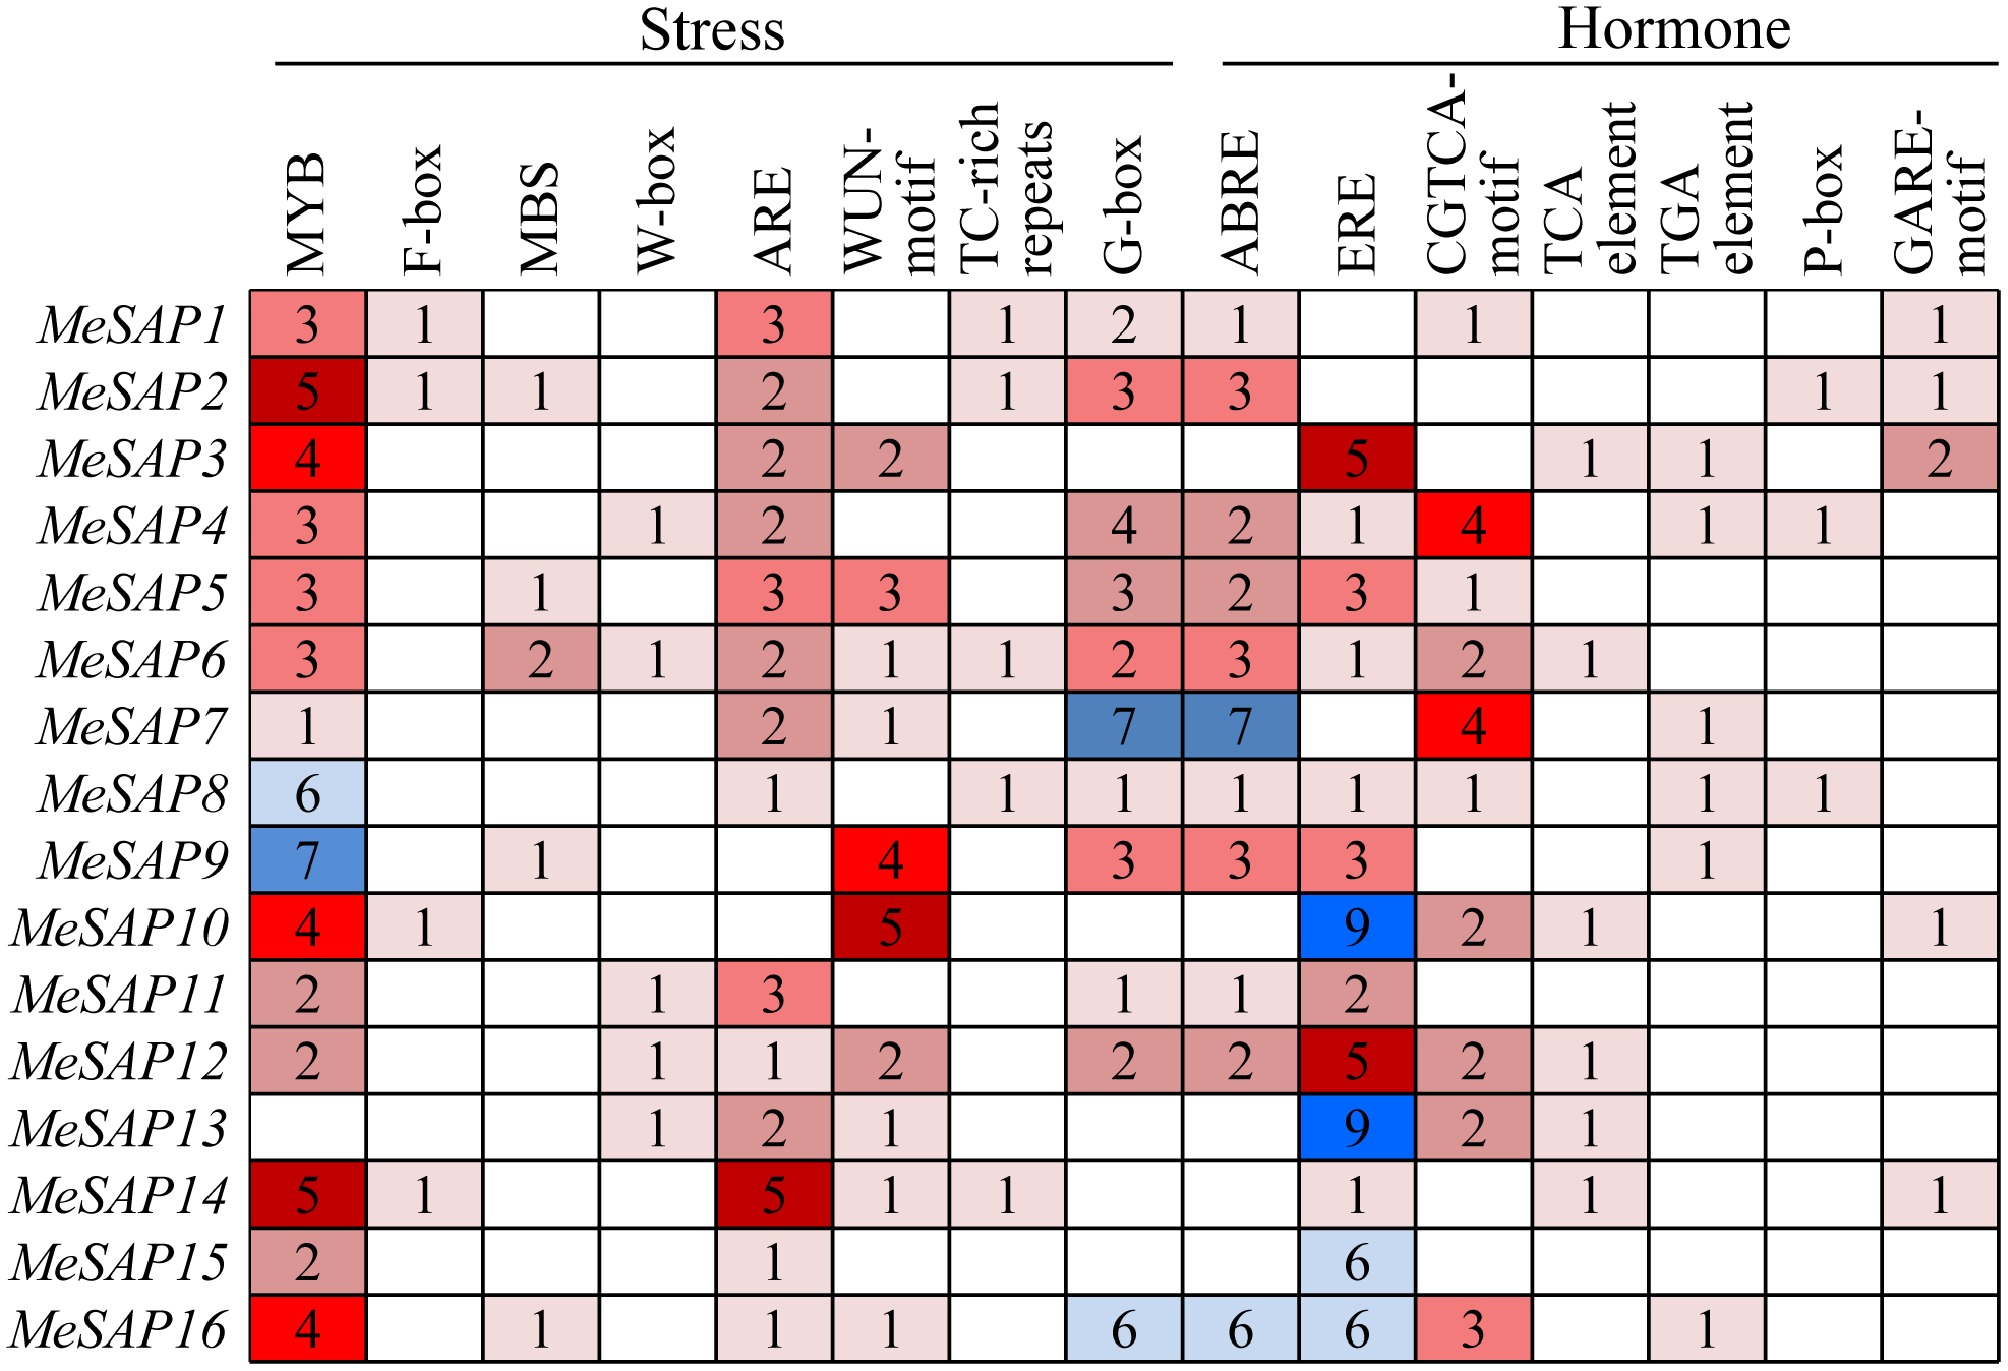
Figure 4.
The cis-elements type and numbers distribution in the promoter regions of cassava MeSAP genes.
-
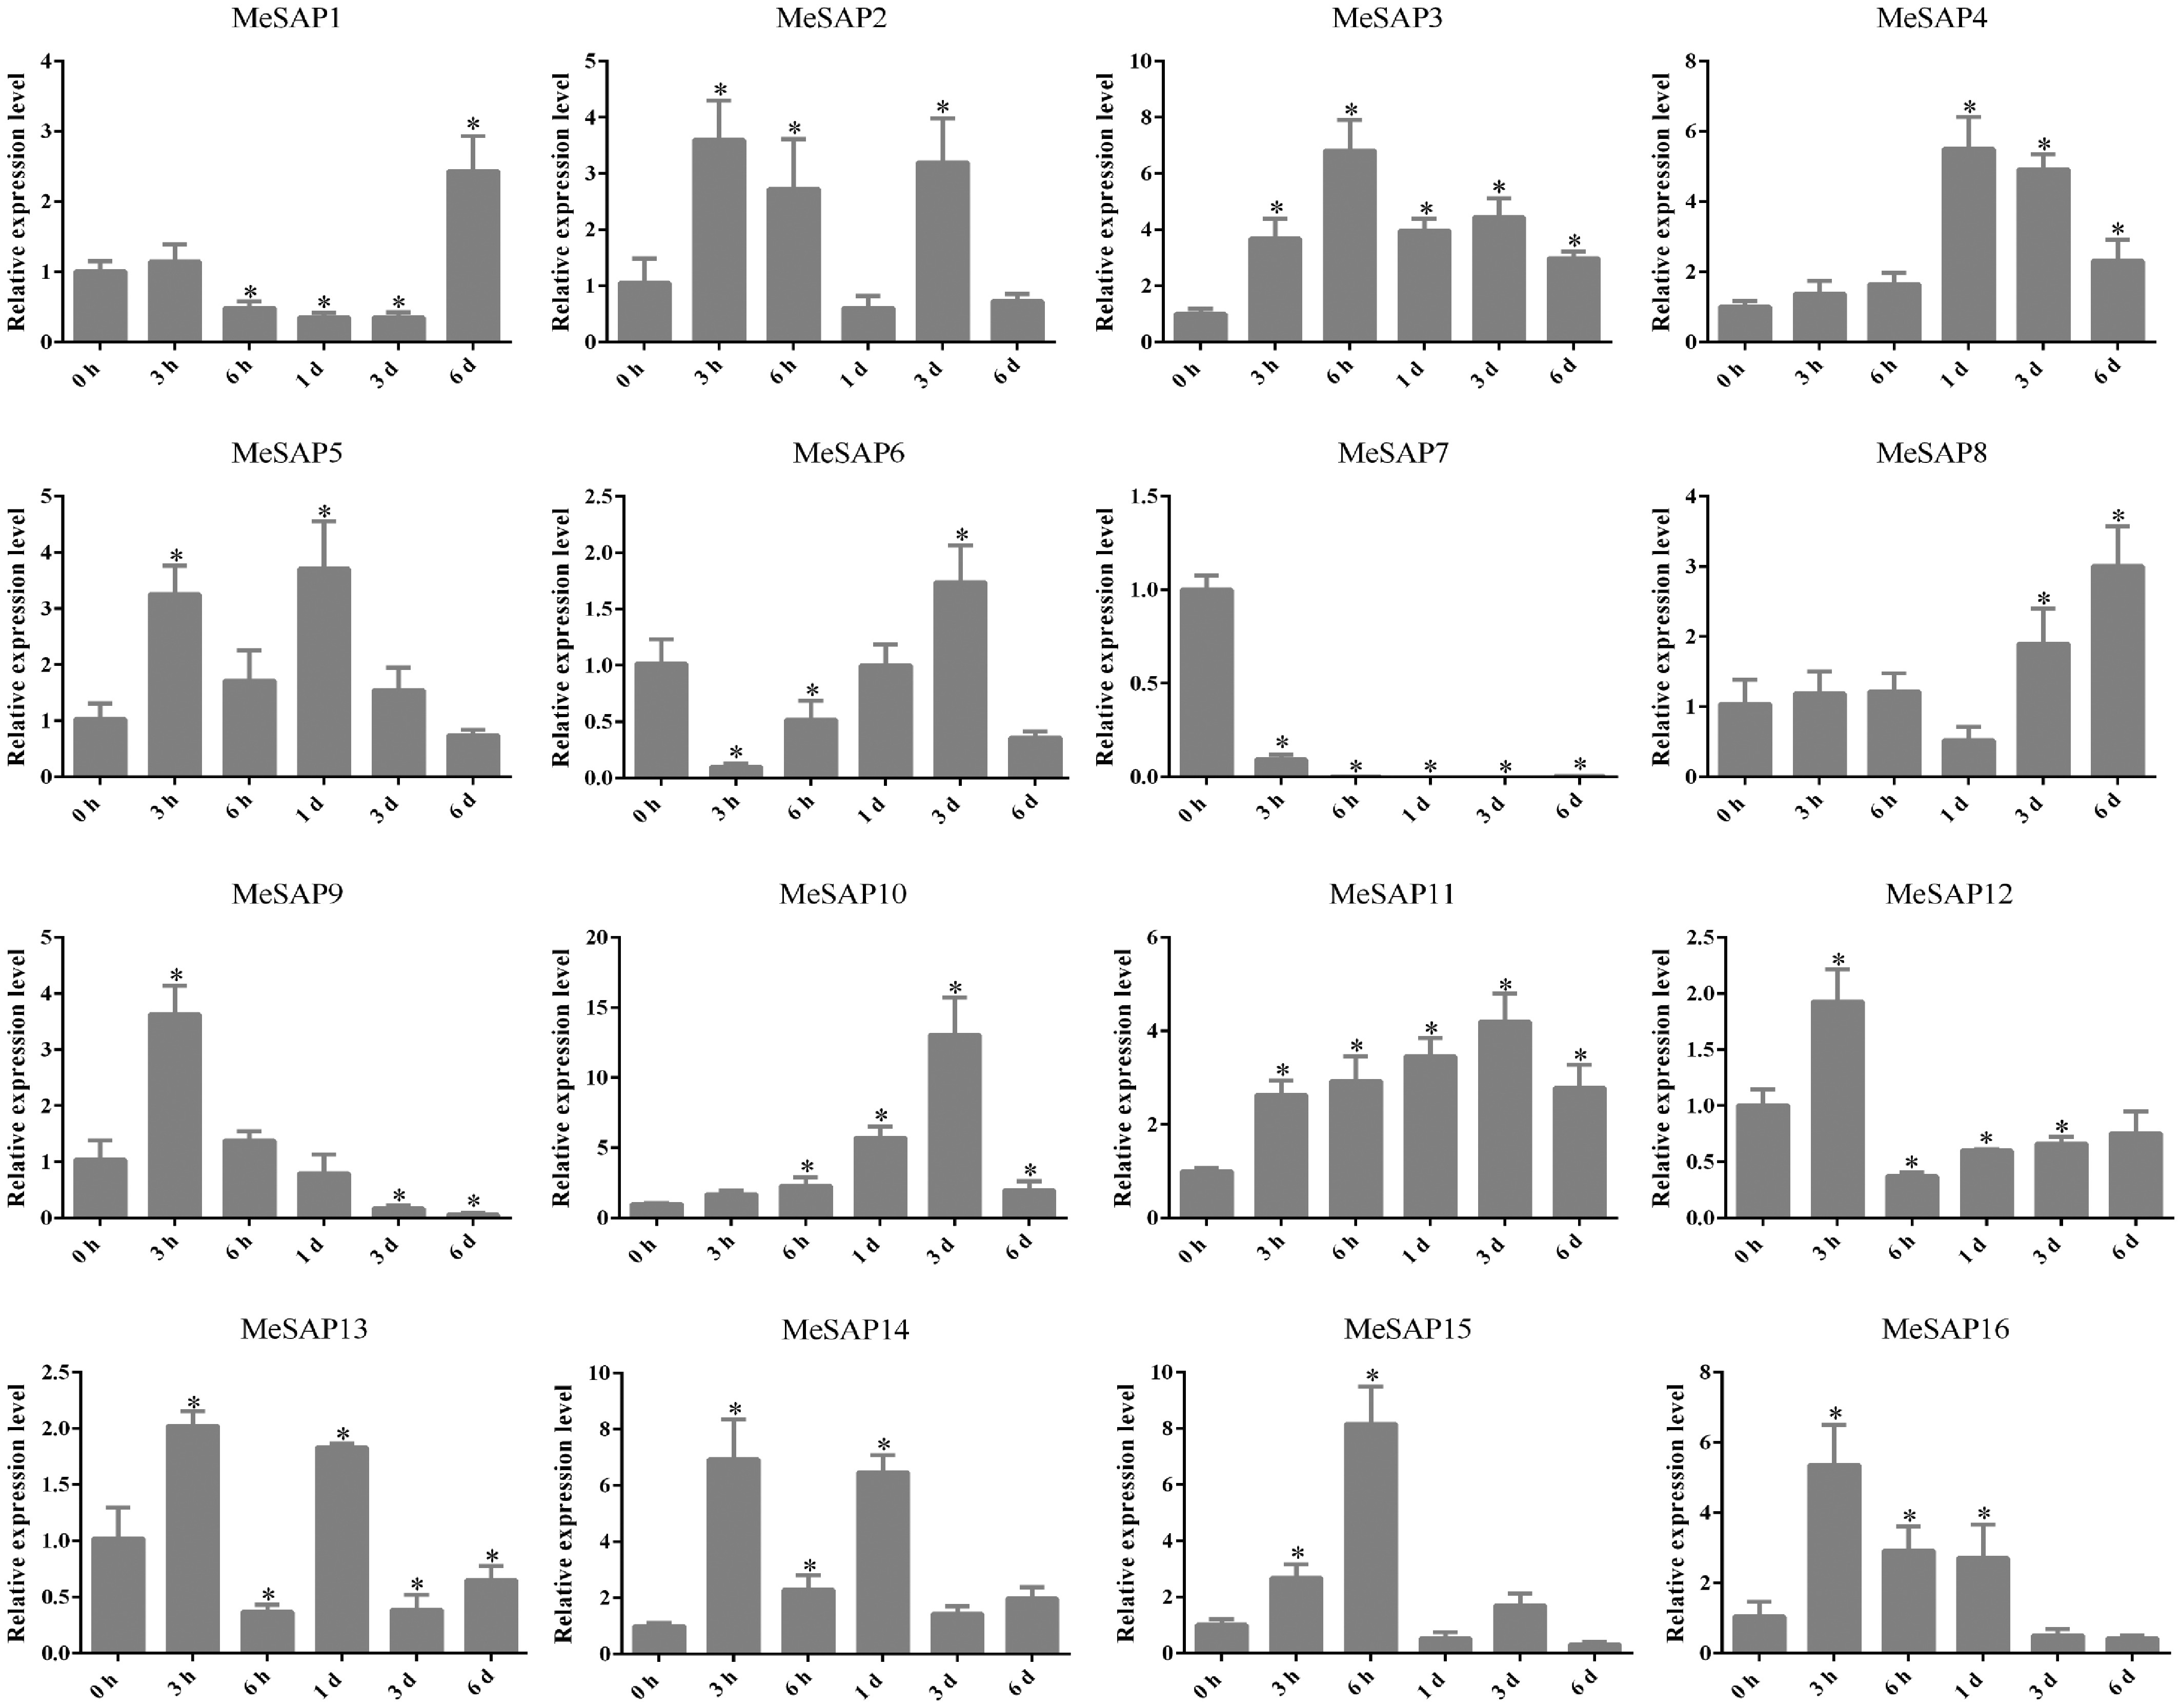
Figure 5.
Expression of cassava SAP genes induced with XpmCHN11. Data is mean ± SE pooling from three biological replicates. * Indicates a significant difference (p < 0.05) between the control and treatments.
-
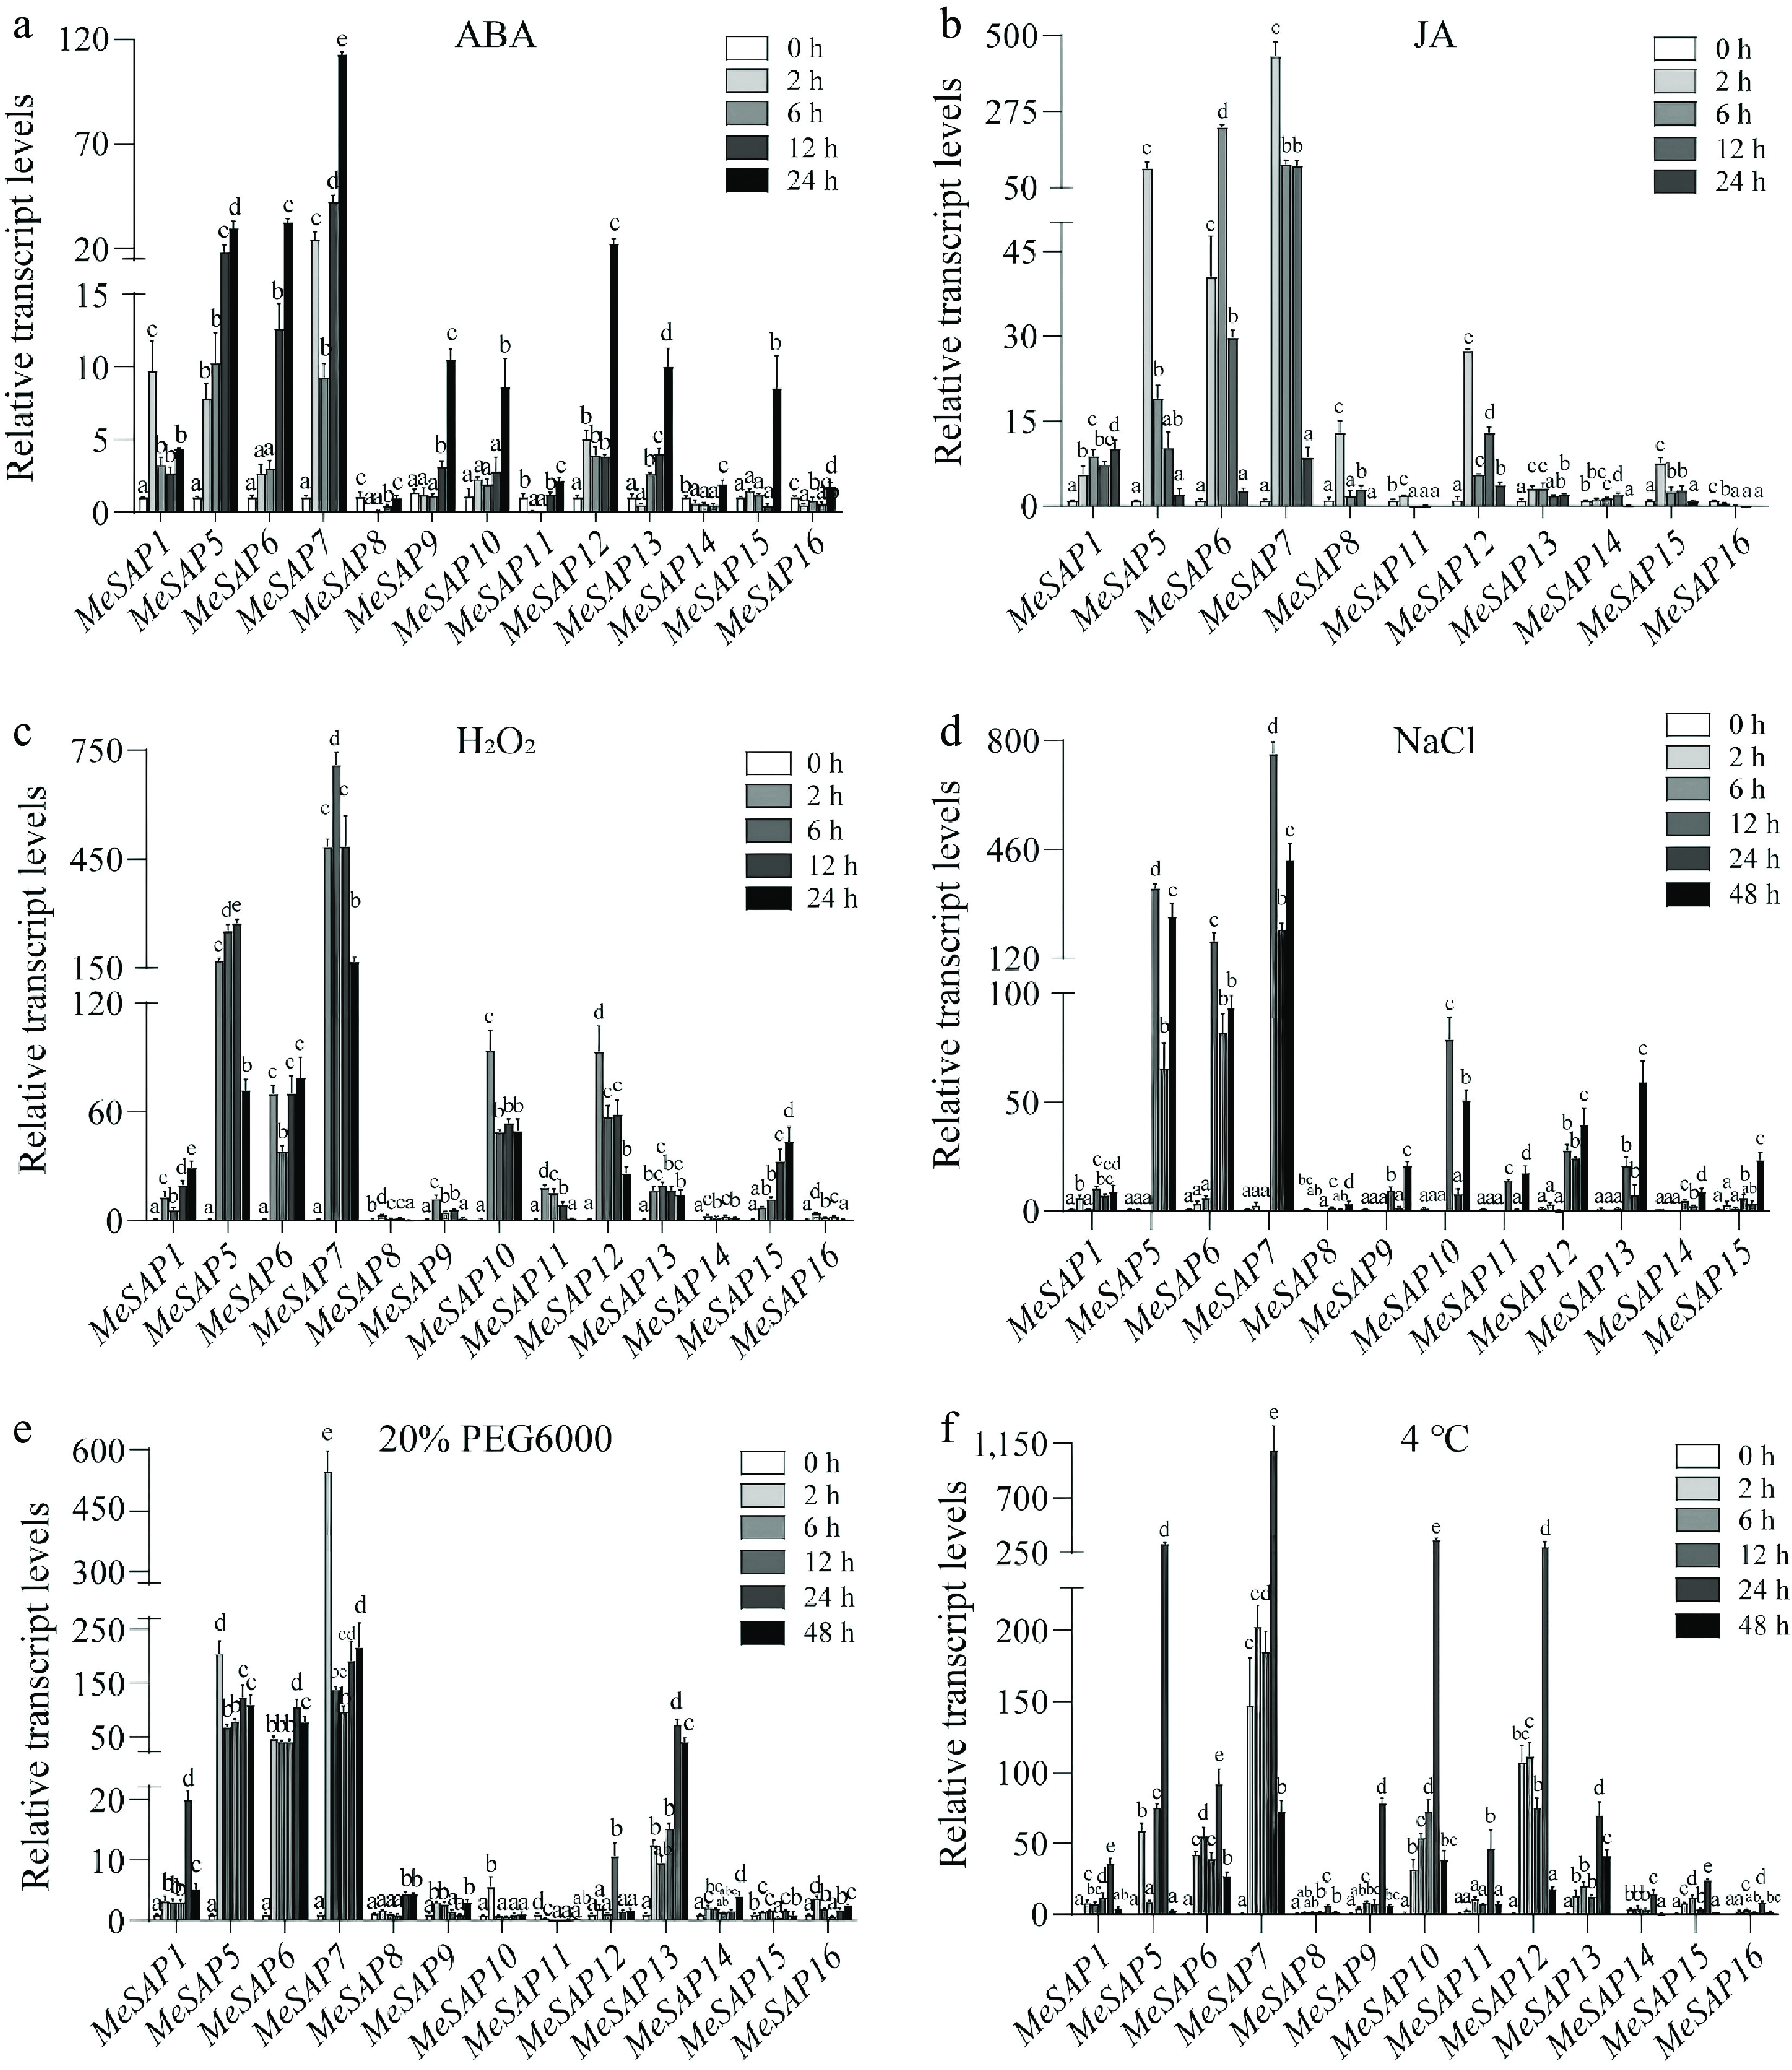
Figure 6.
Expression profiles of the MeSAP gene family under abiotic stresses. Expression patterns of the MeSAP gene family under (a) ABA treatment, (b) JA treatment, (c) H2O2 treatment, (d) NaCl treatment, (e) 20% PEG6000 treatment, (f) 4 °C treatment. Data is mean ± SE pooling from three biological replicates. Statistical significance was assessed by One-way ANOVA. Letters indicate significant differences between groups (p < 0.05).
-
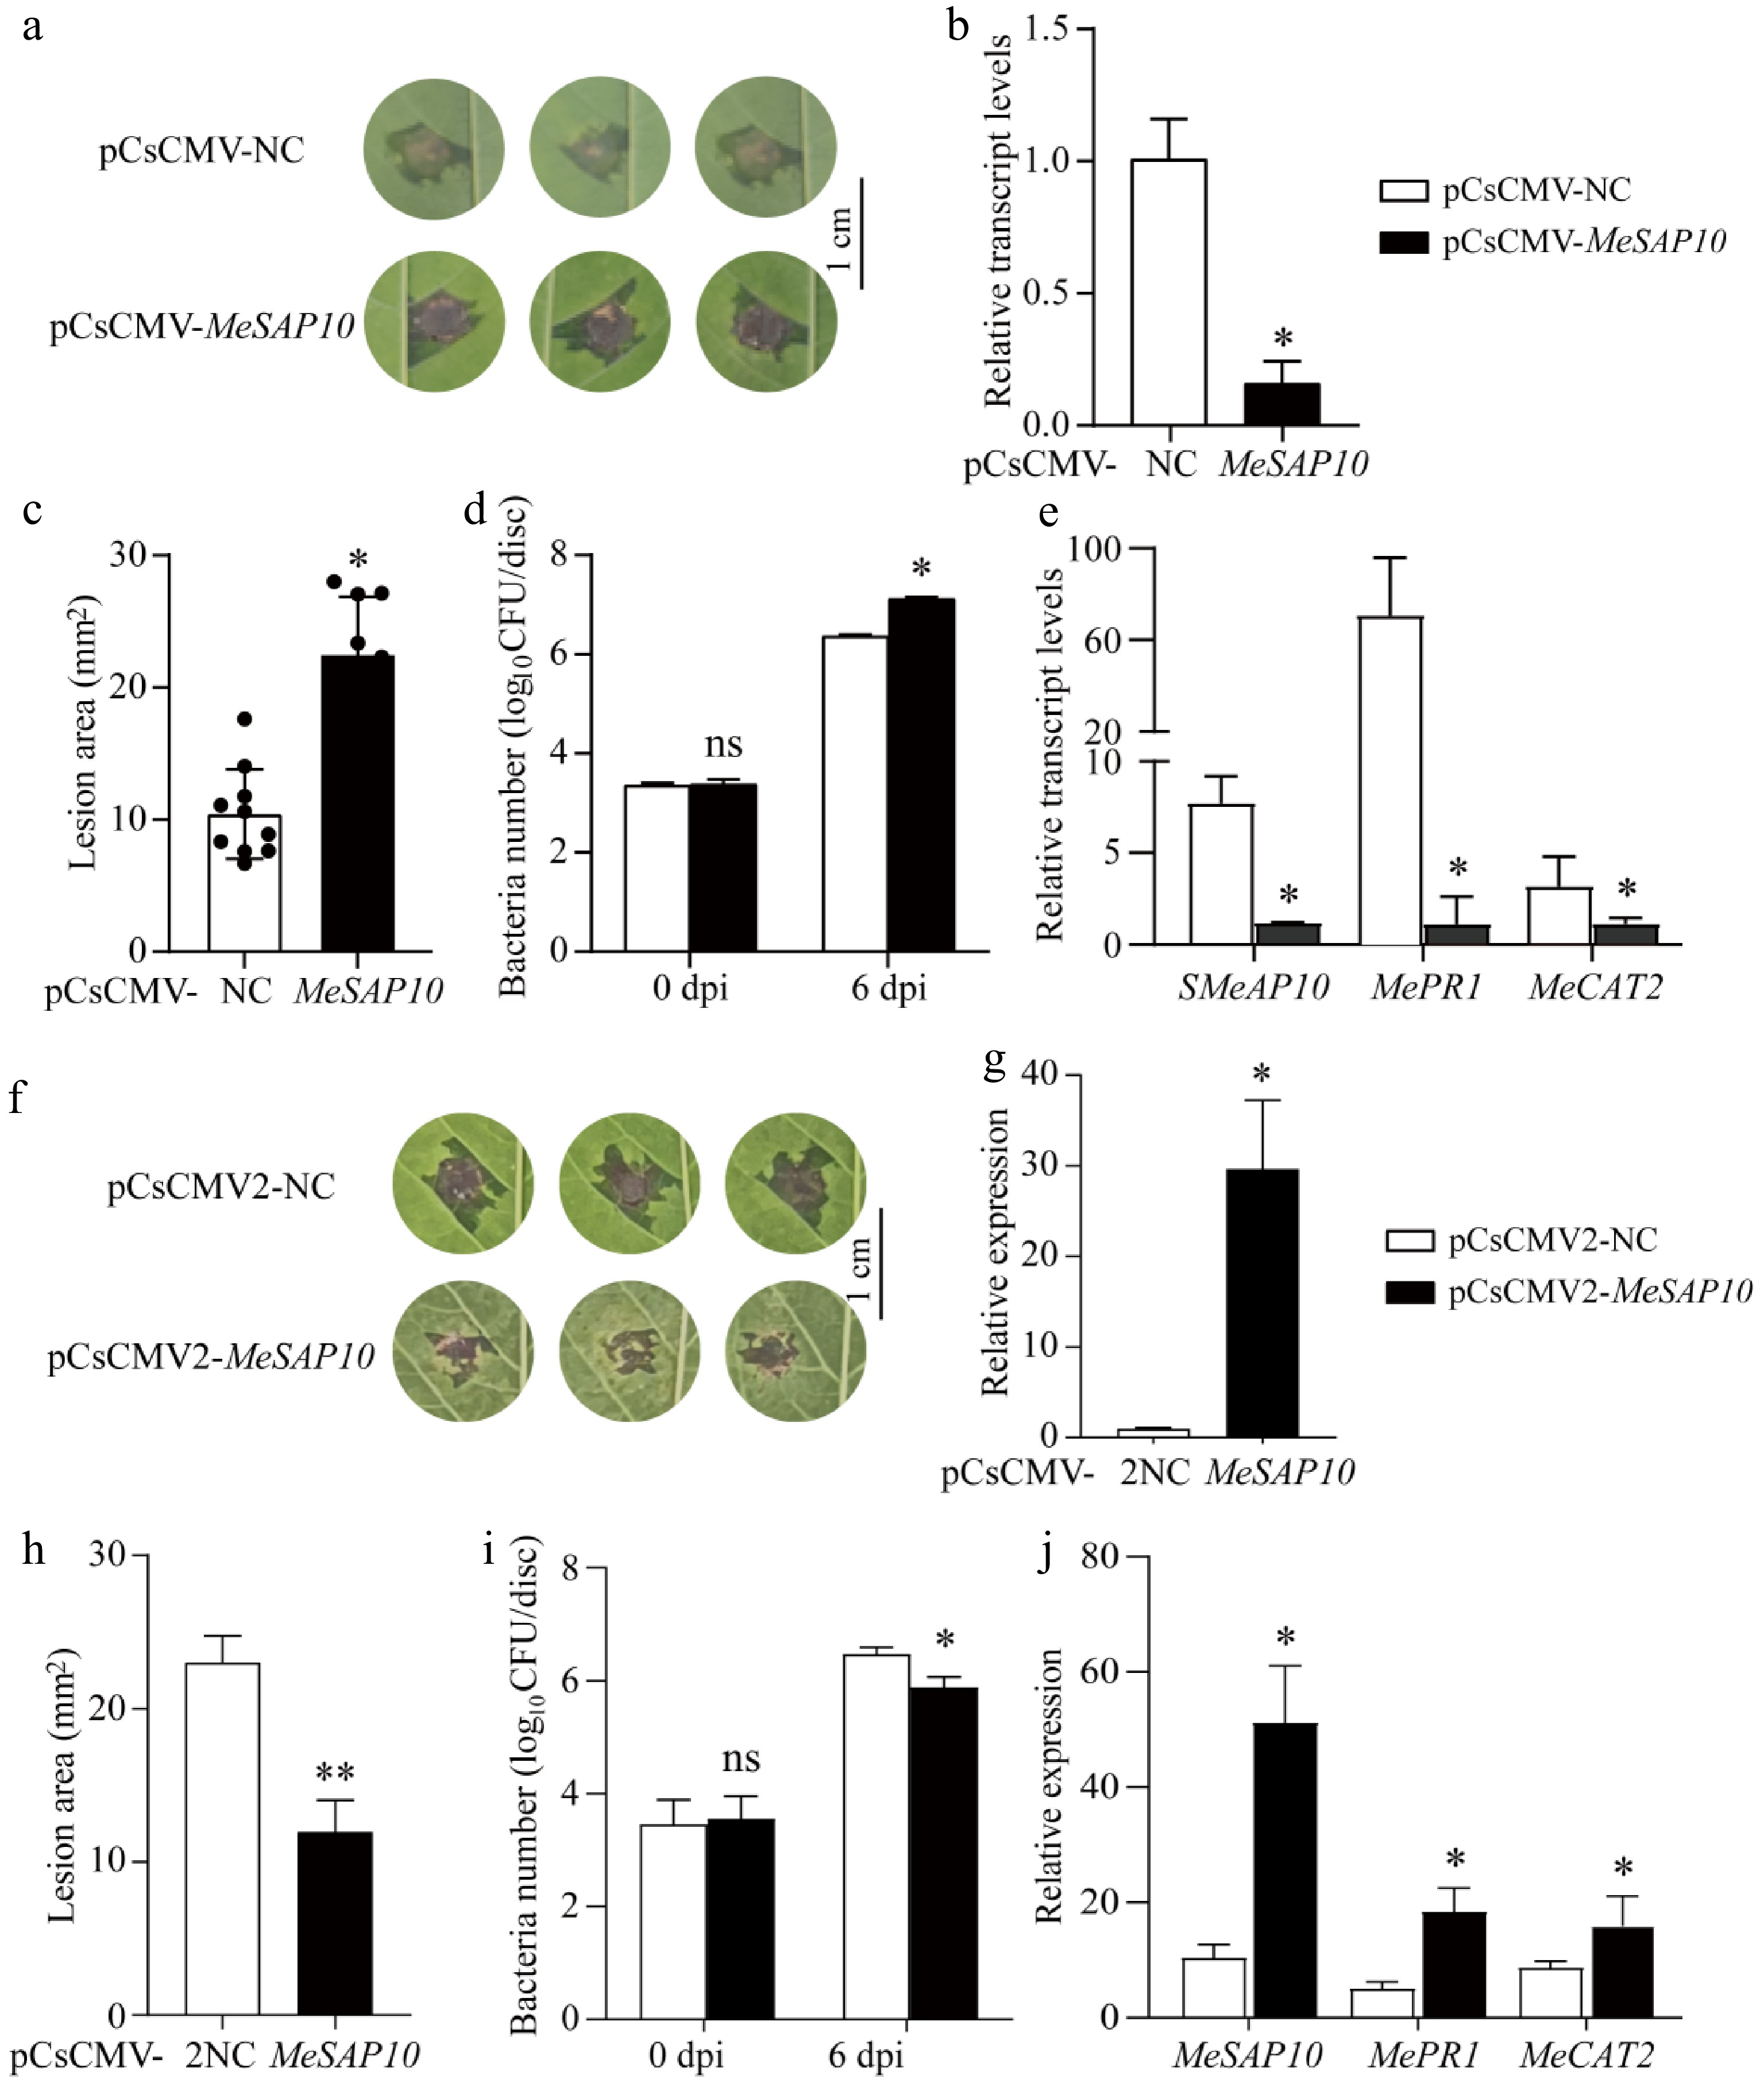
Figure 7.
Functional analysis of MeSAP10 in response to XpmCHN11. (a) Lesion phenotypes of pCsCMV-NC and pCsCMV-MeSAP10 plants after inoculation with XpmCHN11 at 6 d post-inoculation (dpi), scale bar = 1 cm. (b) Silencing efficiency of SAP10 in pCsCMV-NC and pCsCMV-MeSAP10 plants. (c) Lesion area of pCsCMV-NC and pCsCMV-MeSAP10 plants after inoculation with XpmCHN11 at 6 dpi. (d) Bacteria number in leaves of pCsCMV-NC and pCsCMV-MeSAP10 plants after inoculation with XpmCHN11 at 6 dpi. (e) Expression levels of MeSAP10, MePR1, and MeCAT2 in leaves of pCsCMV-NC and pCsCMV-MeSAP10 plants at 3 dpi. (f) Lesion phenotypes of pCsCMV2-NC and pCsCMV2-MeSAP10 plants after inoculation with XpmCHN11 at 6 d post-inoculation (dpi), scale bar = 1 cm. (g) Expression levels of MeSAP10 in pCsCMV2-NC and pCsCMV2-MeSAP10 plants. (h) Lesion area of pCsCMV2-NC and pCsCMV2-SAP10 plants after inoculation with XpmCHN11 at 6 dpi. (i) Bacteria number in leaves of pCsCMV2-NC and pCsCMV2-MeSAP10 plants after inoculation with XpmCHN11 at 6 dpi. (j) Expression levels of MeSAP10, MePR1, and MeCAT2 in leaves of pCsCMV2-NC and pCsCMV2-MeSAP10 plants at 3 dpi. Statistical significance was assessed by Student's t-tests. * Represents significant differences between pCsCMV-NC and pCsCMV-MeSAP10 plants, and between pCsCMV2-NC and pCsCMV2-MeSAP10 plants (* p < 0.05, ** 0.001 ≤ p < 0.01).
Figures
(7)
Tables
(0)