-
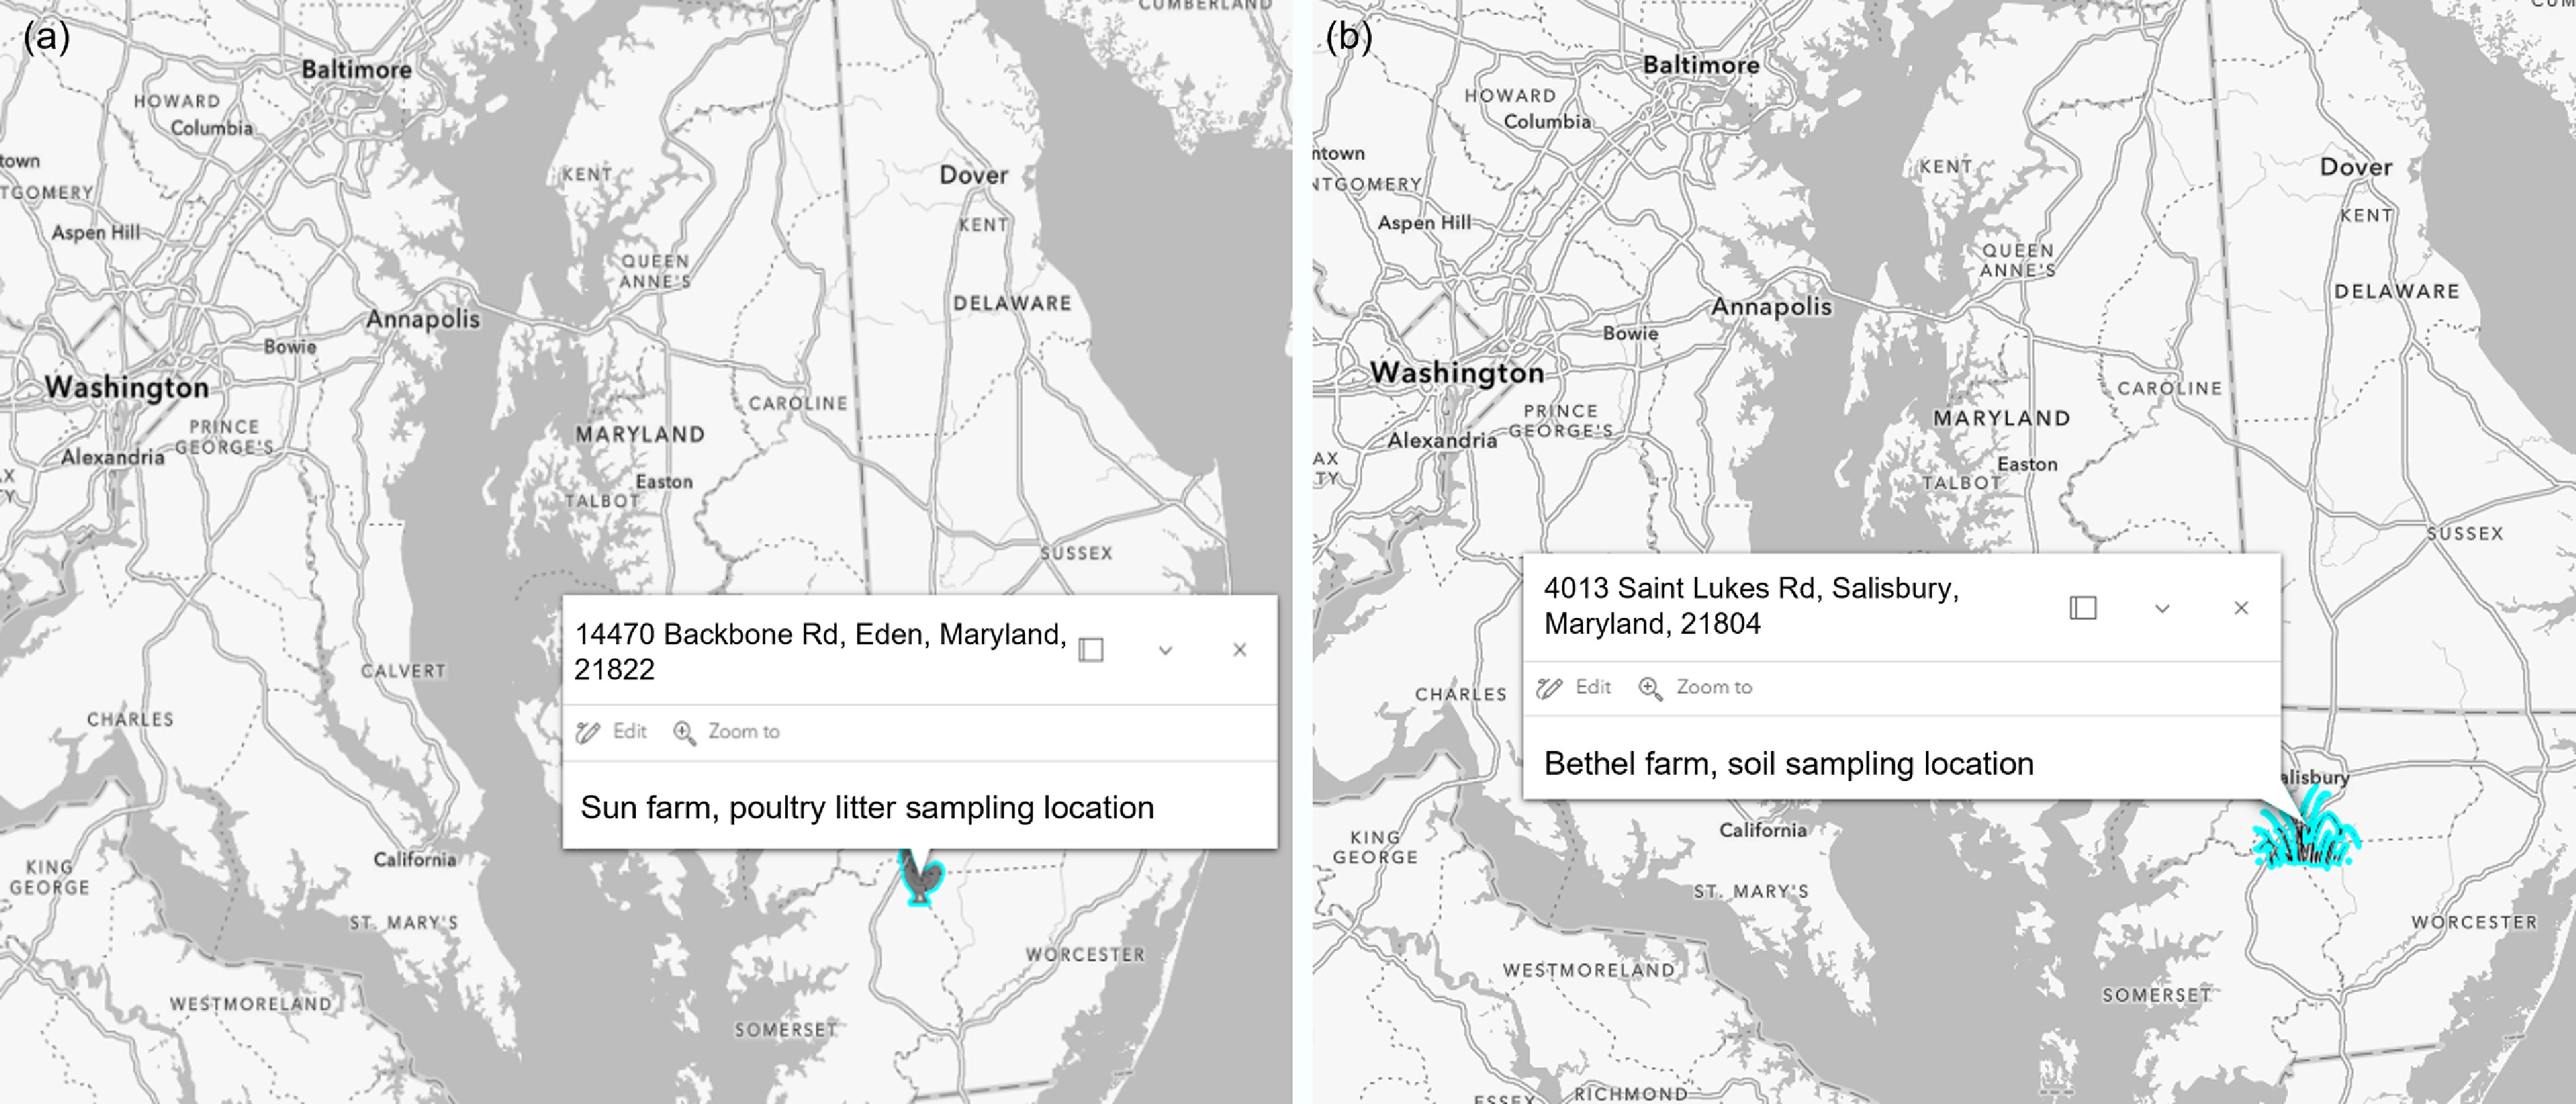
Figure 1.
Location of (a) poultry litter, and (b) soil sampling site on the Delmarva Peninsula, Maryland. Source from ArcGIS Map Viewer
www.arcgis.com/apps/mapviewer/index.html -
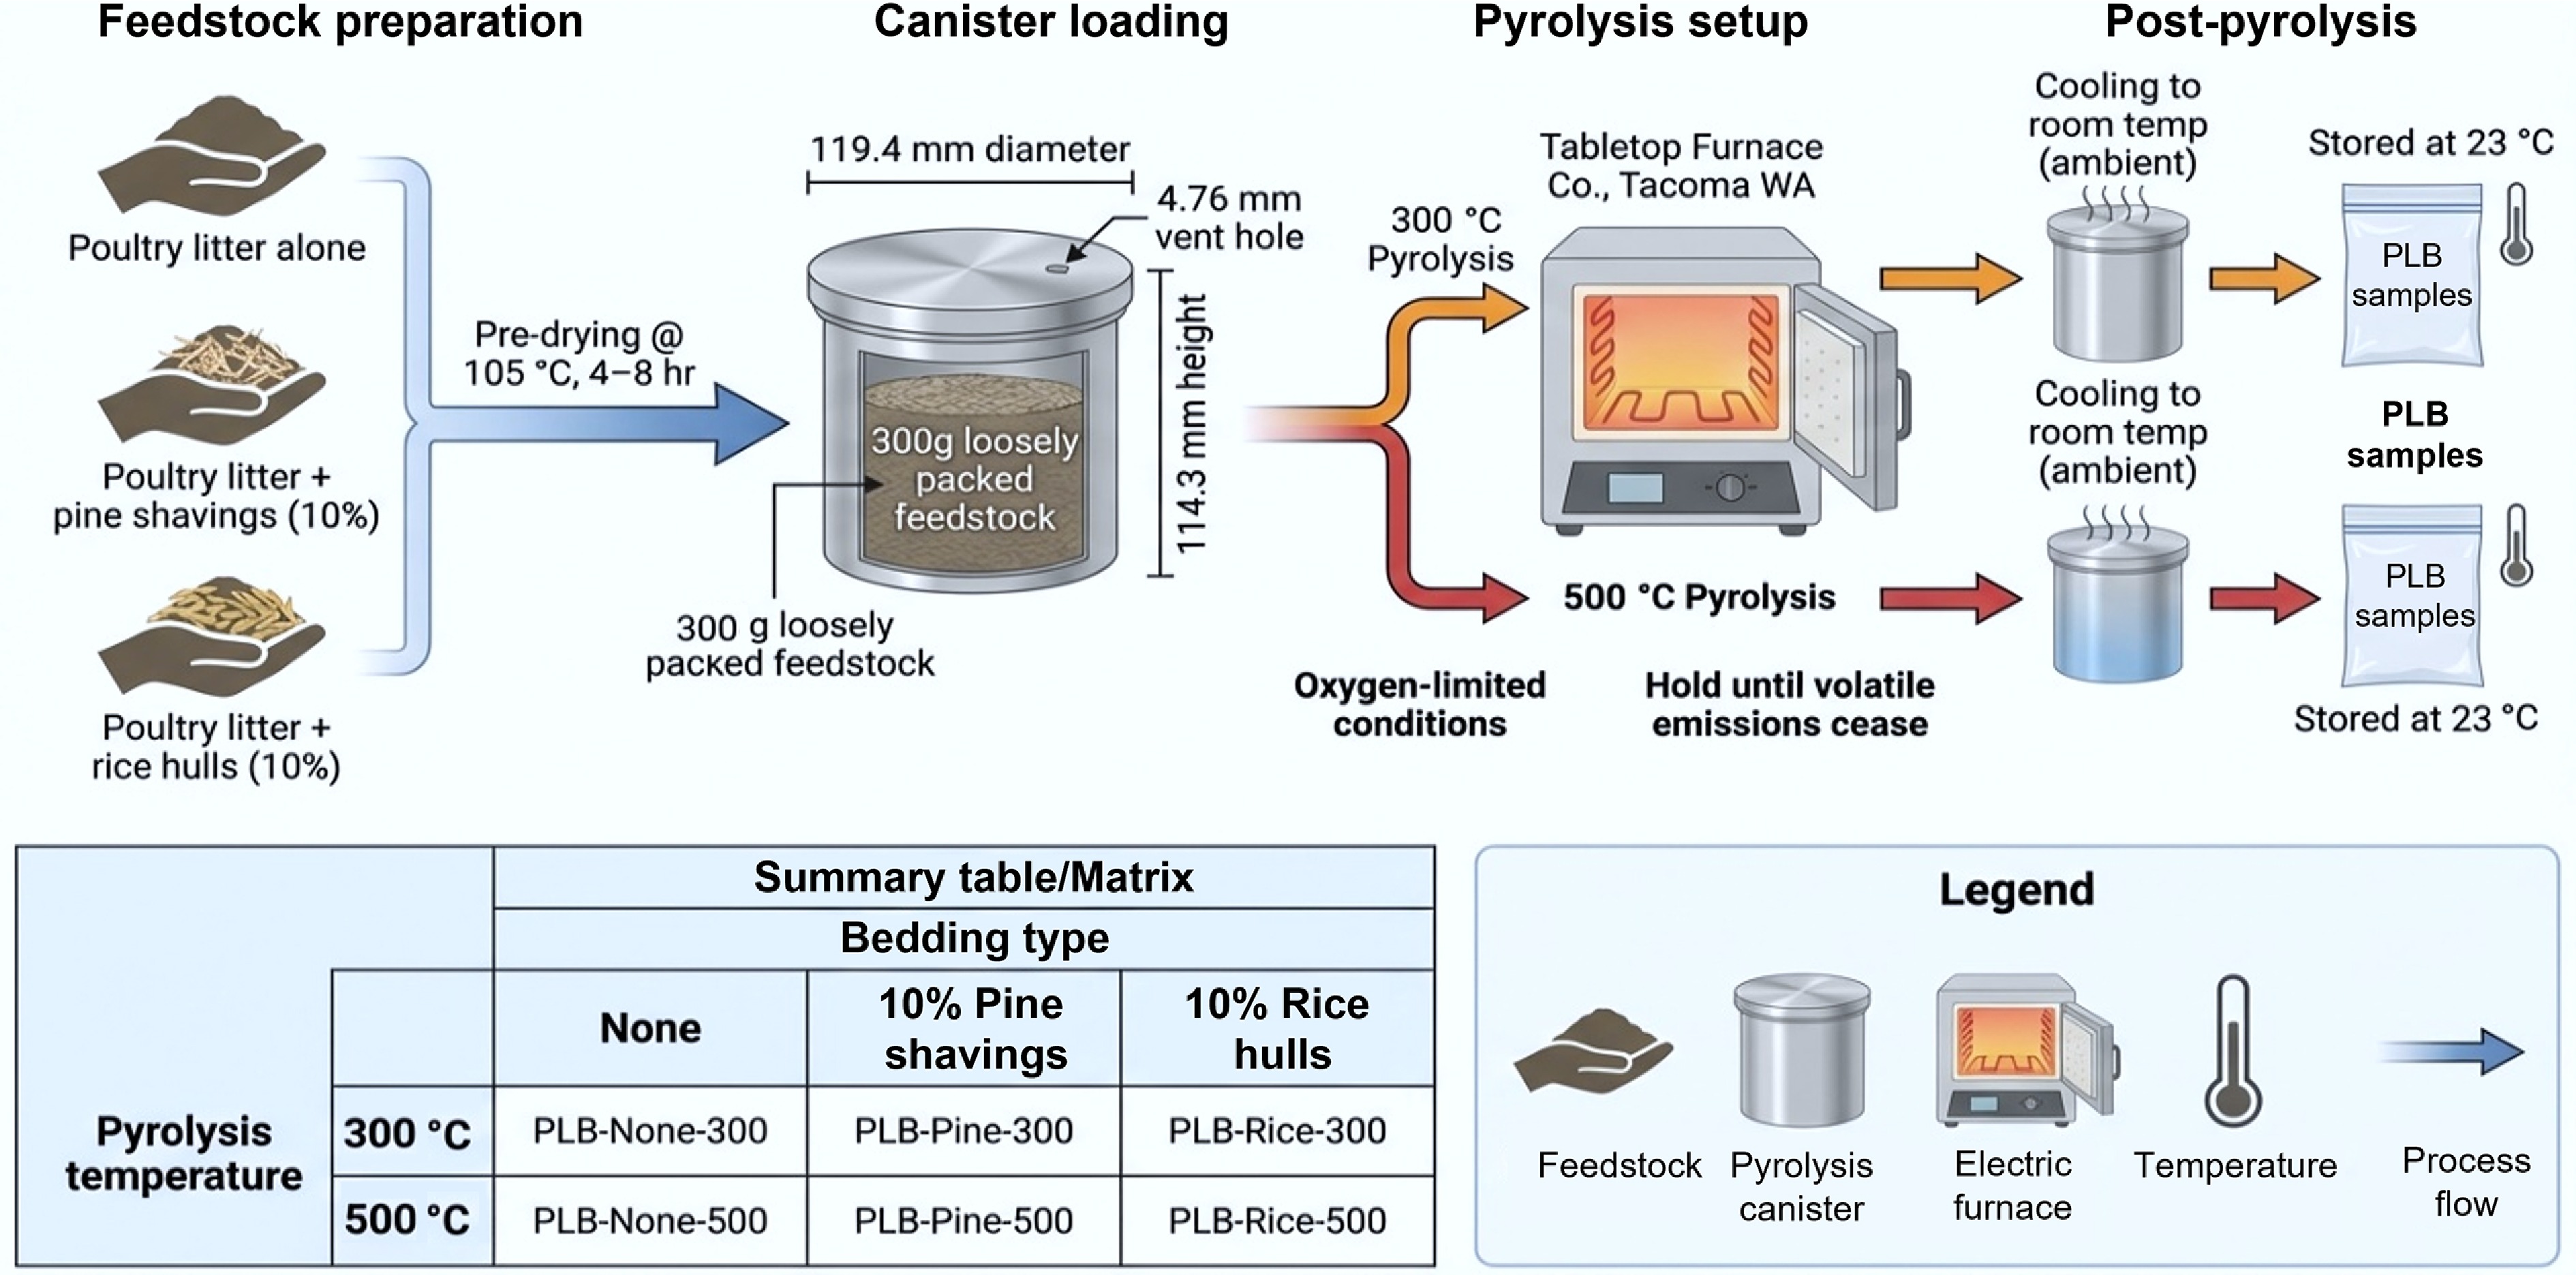
Figure 2.
Benchtop pyrolysis system used for poultry litter biochar production under controlled temperatures.
-
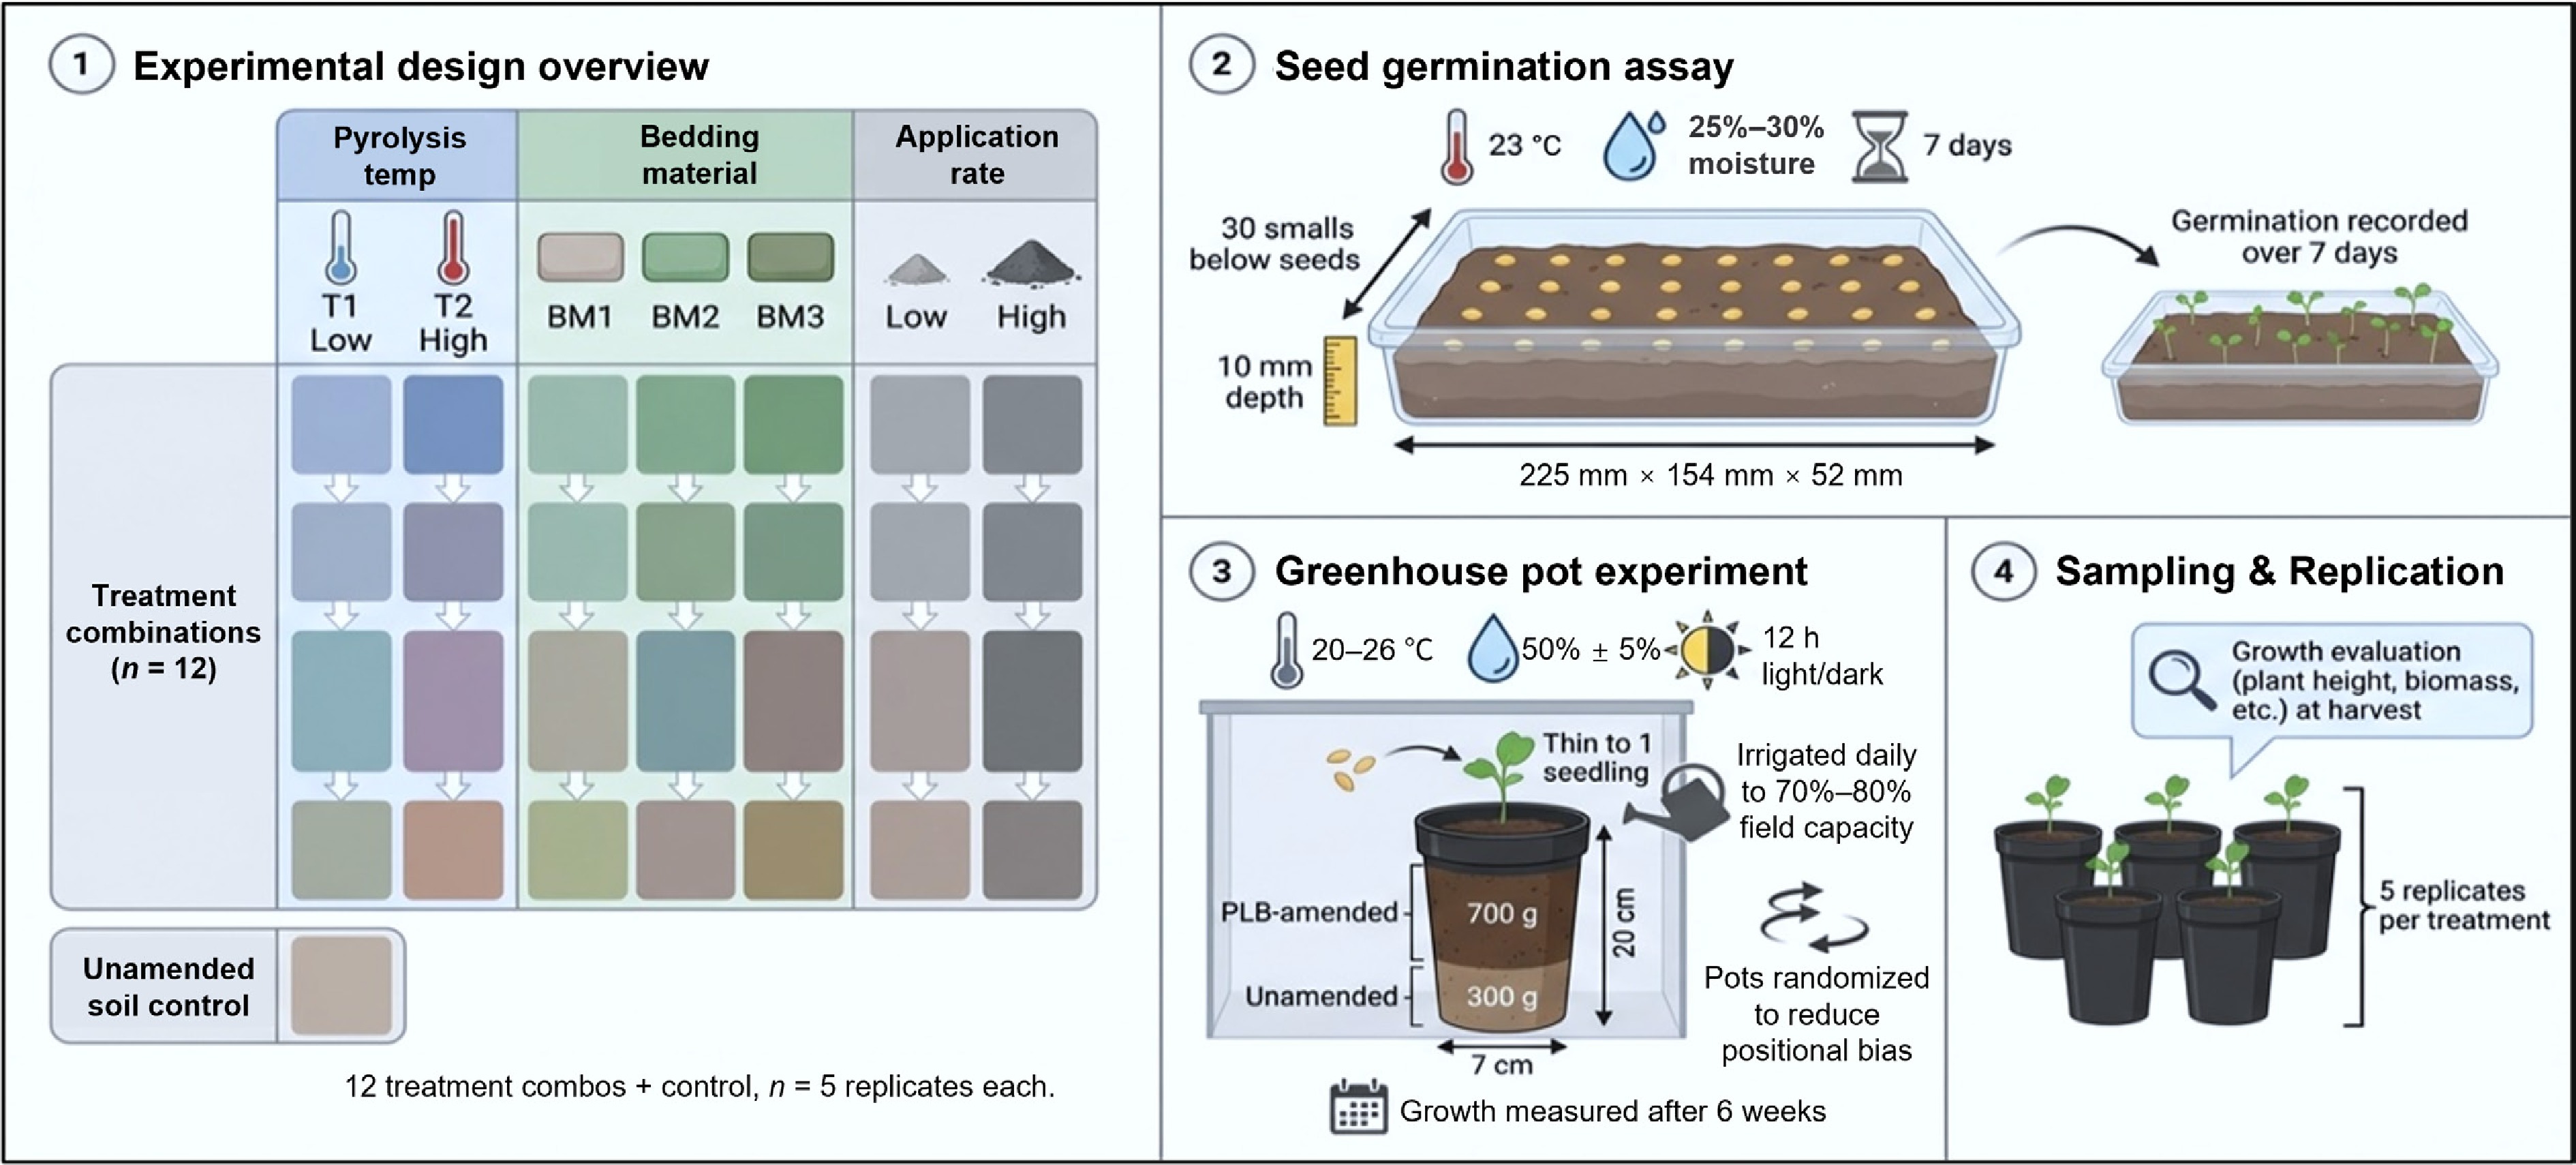
Figure 3.
Schematic of experimental design for seed germination and greenhouse pot testing of PLB treatments.
-
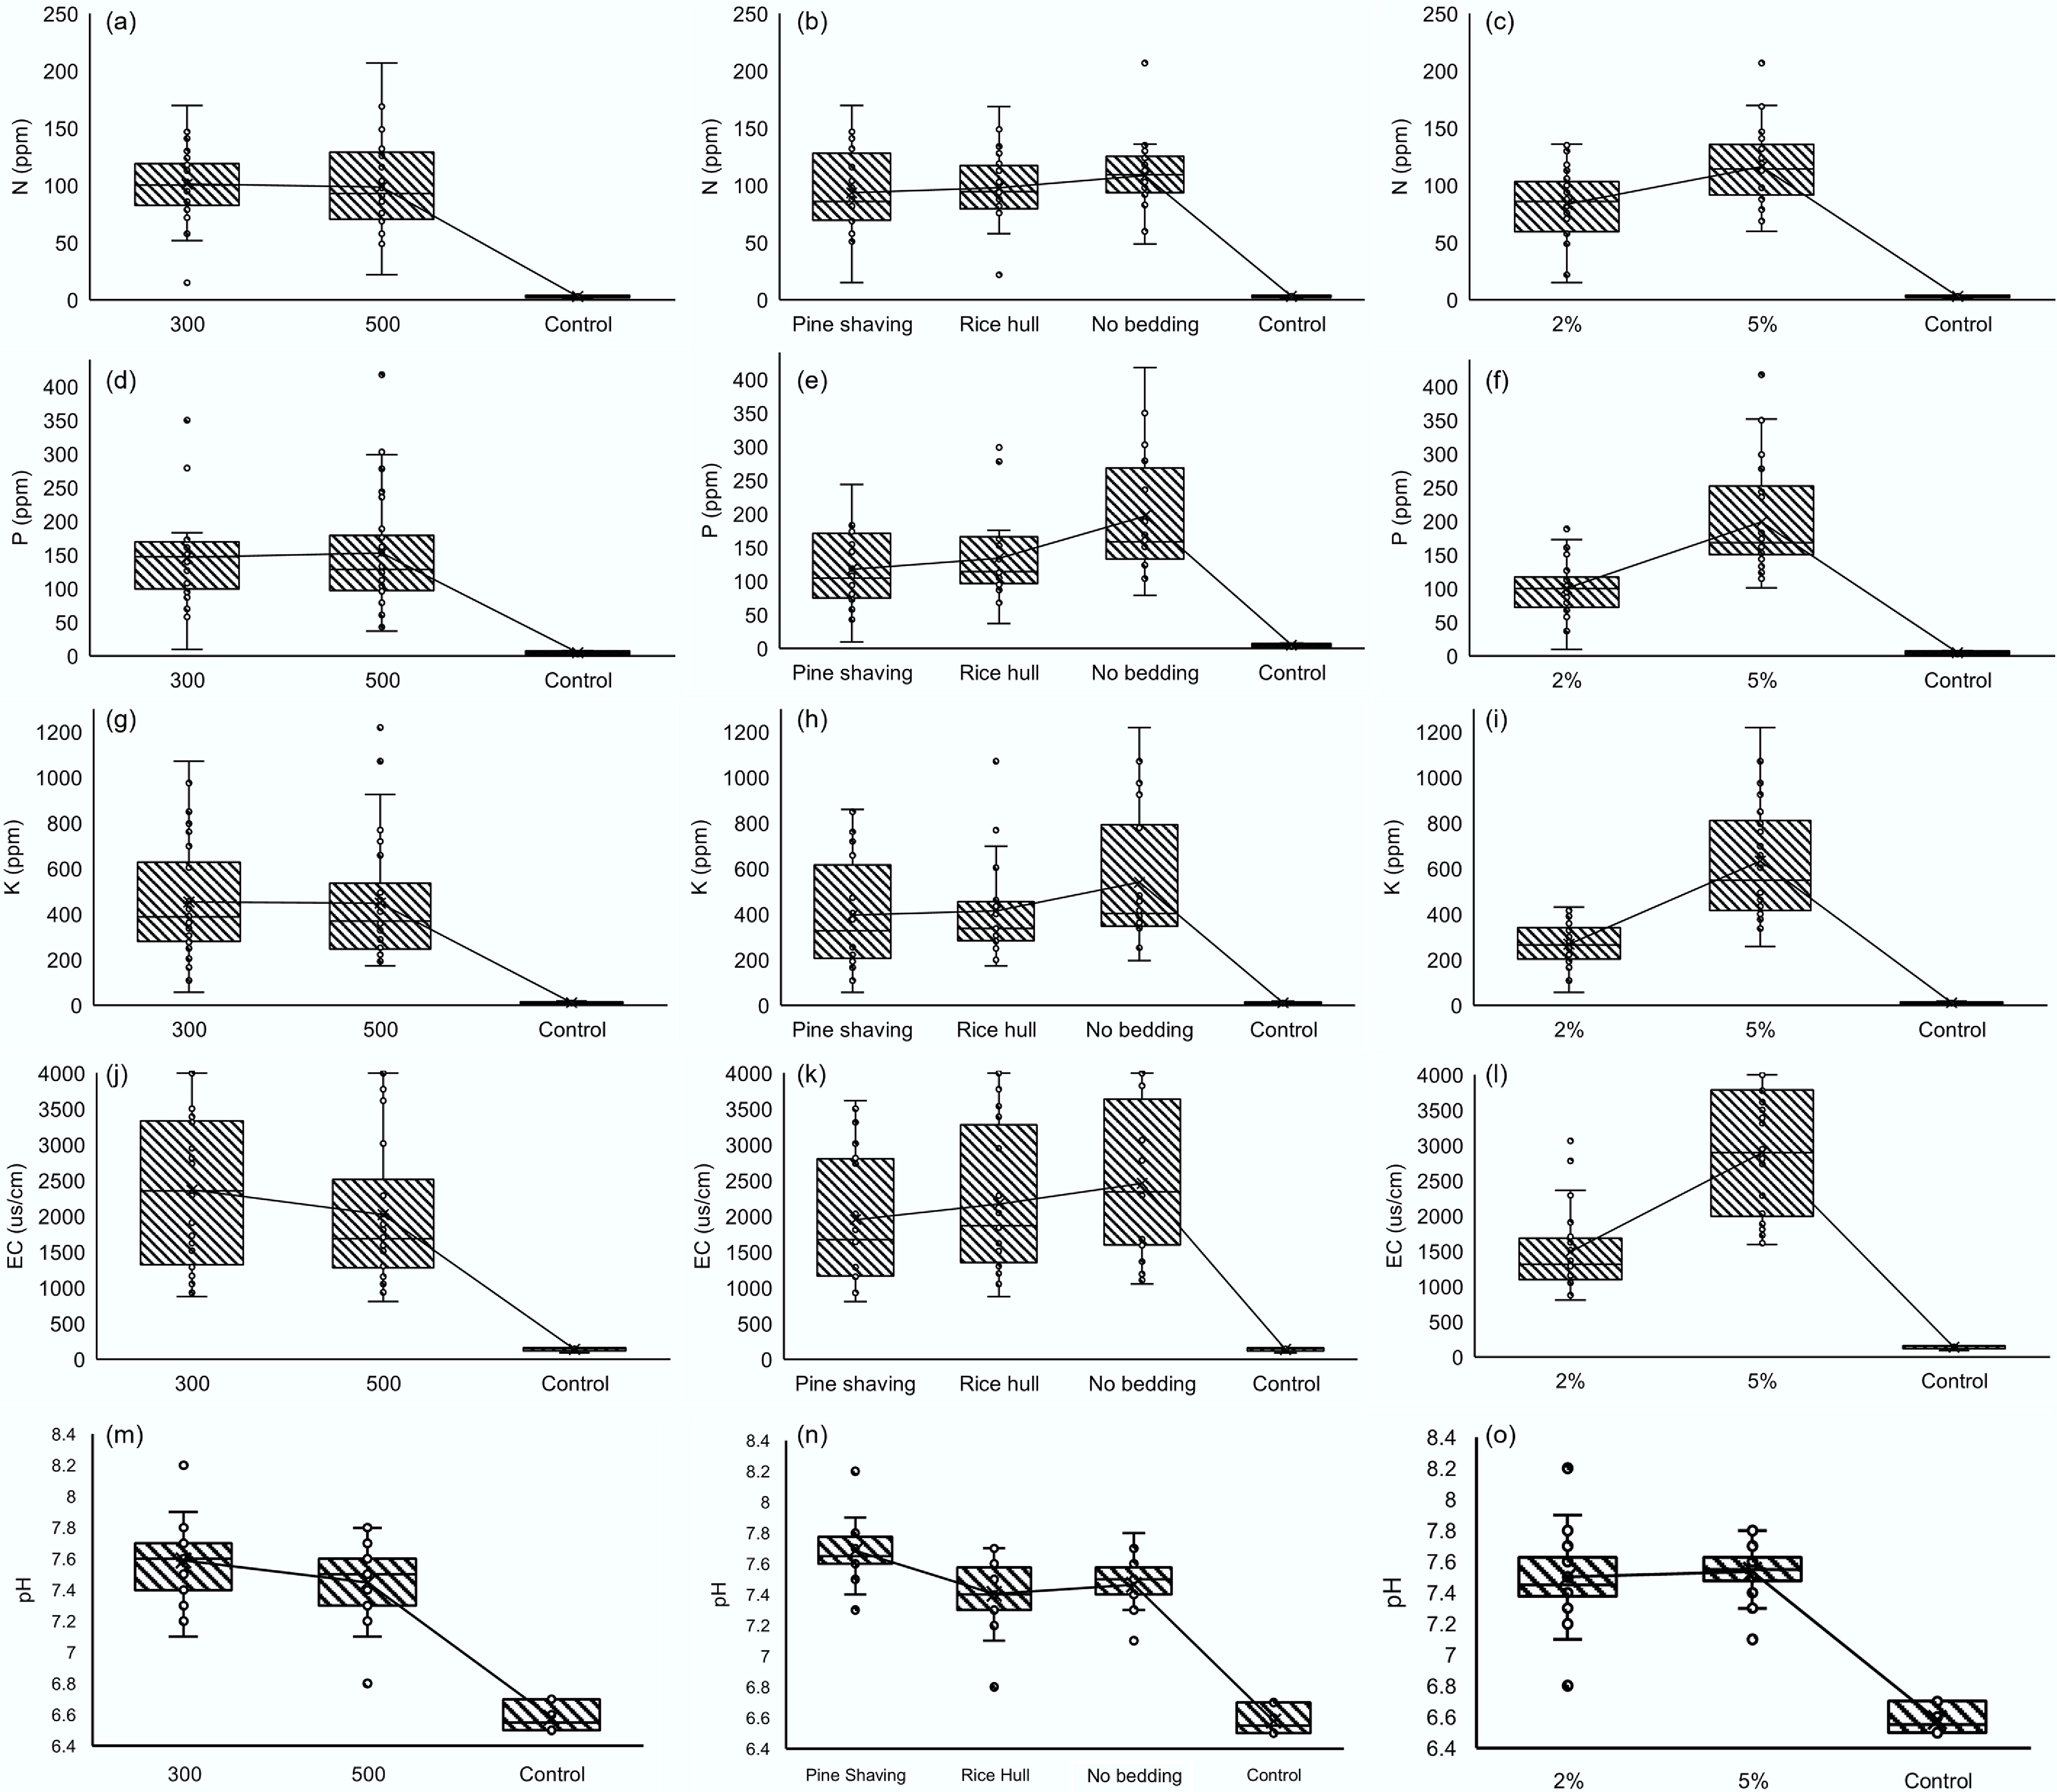
Figure 4.
Effects of poultry litter biochar application rate, pyrolysis temperature, and bedding material type on (a)–(i) soil NPK concentrations, (j)–(l) electrical conductivity (EC), and (m)–(o) pH.
-
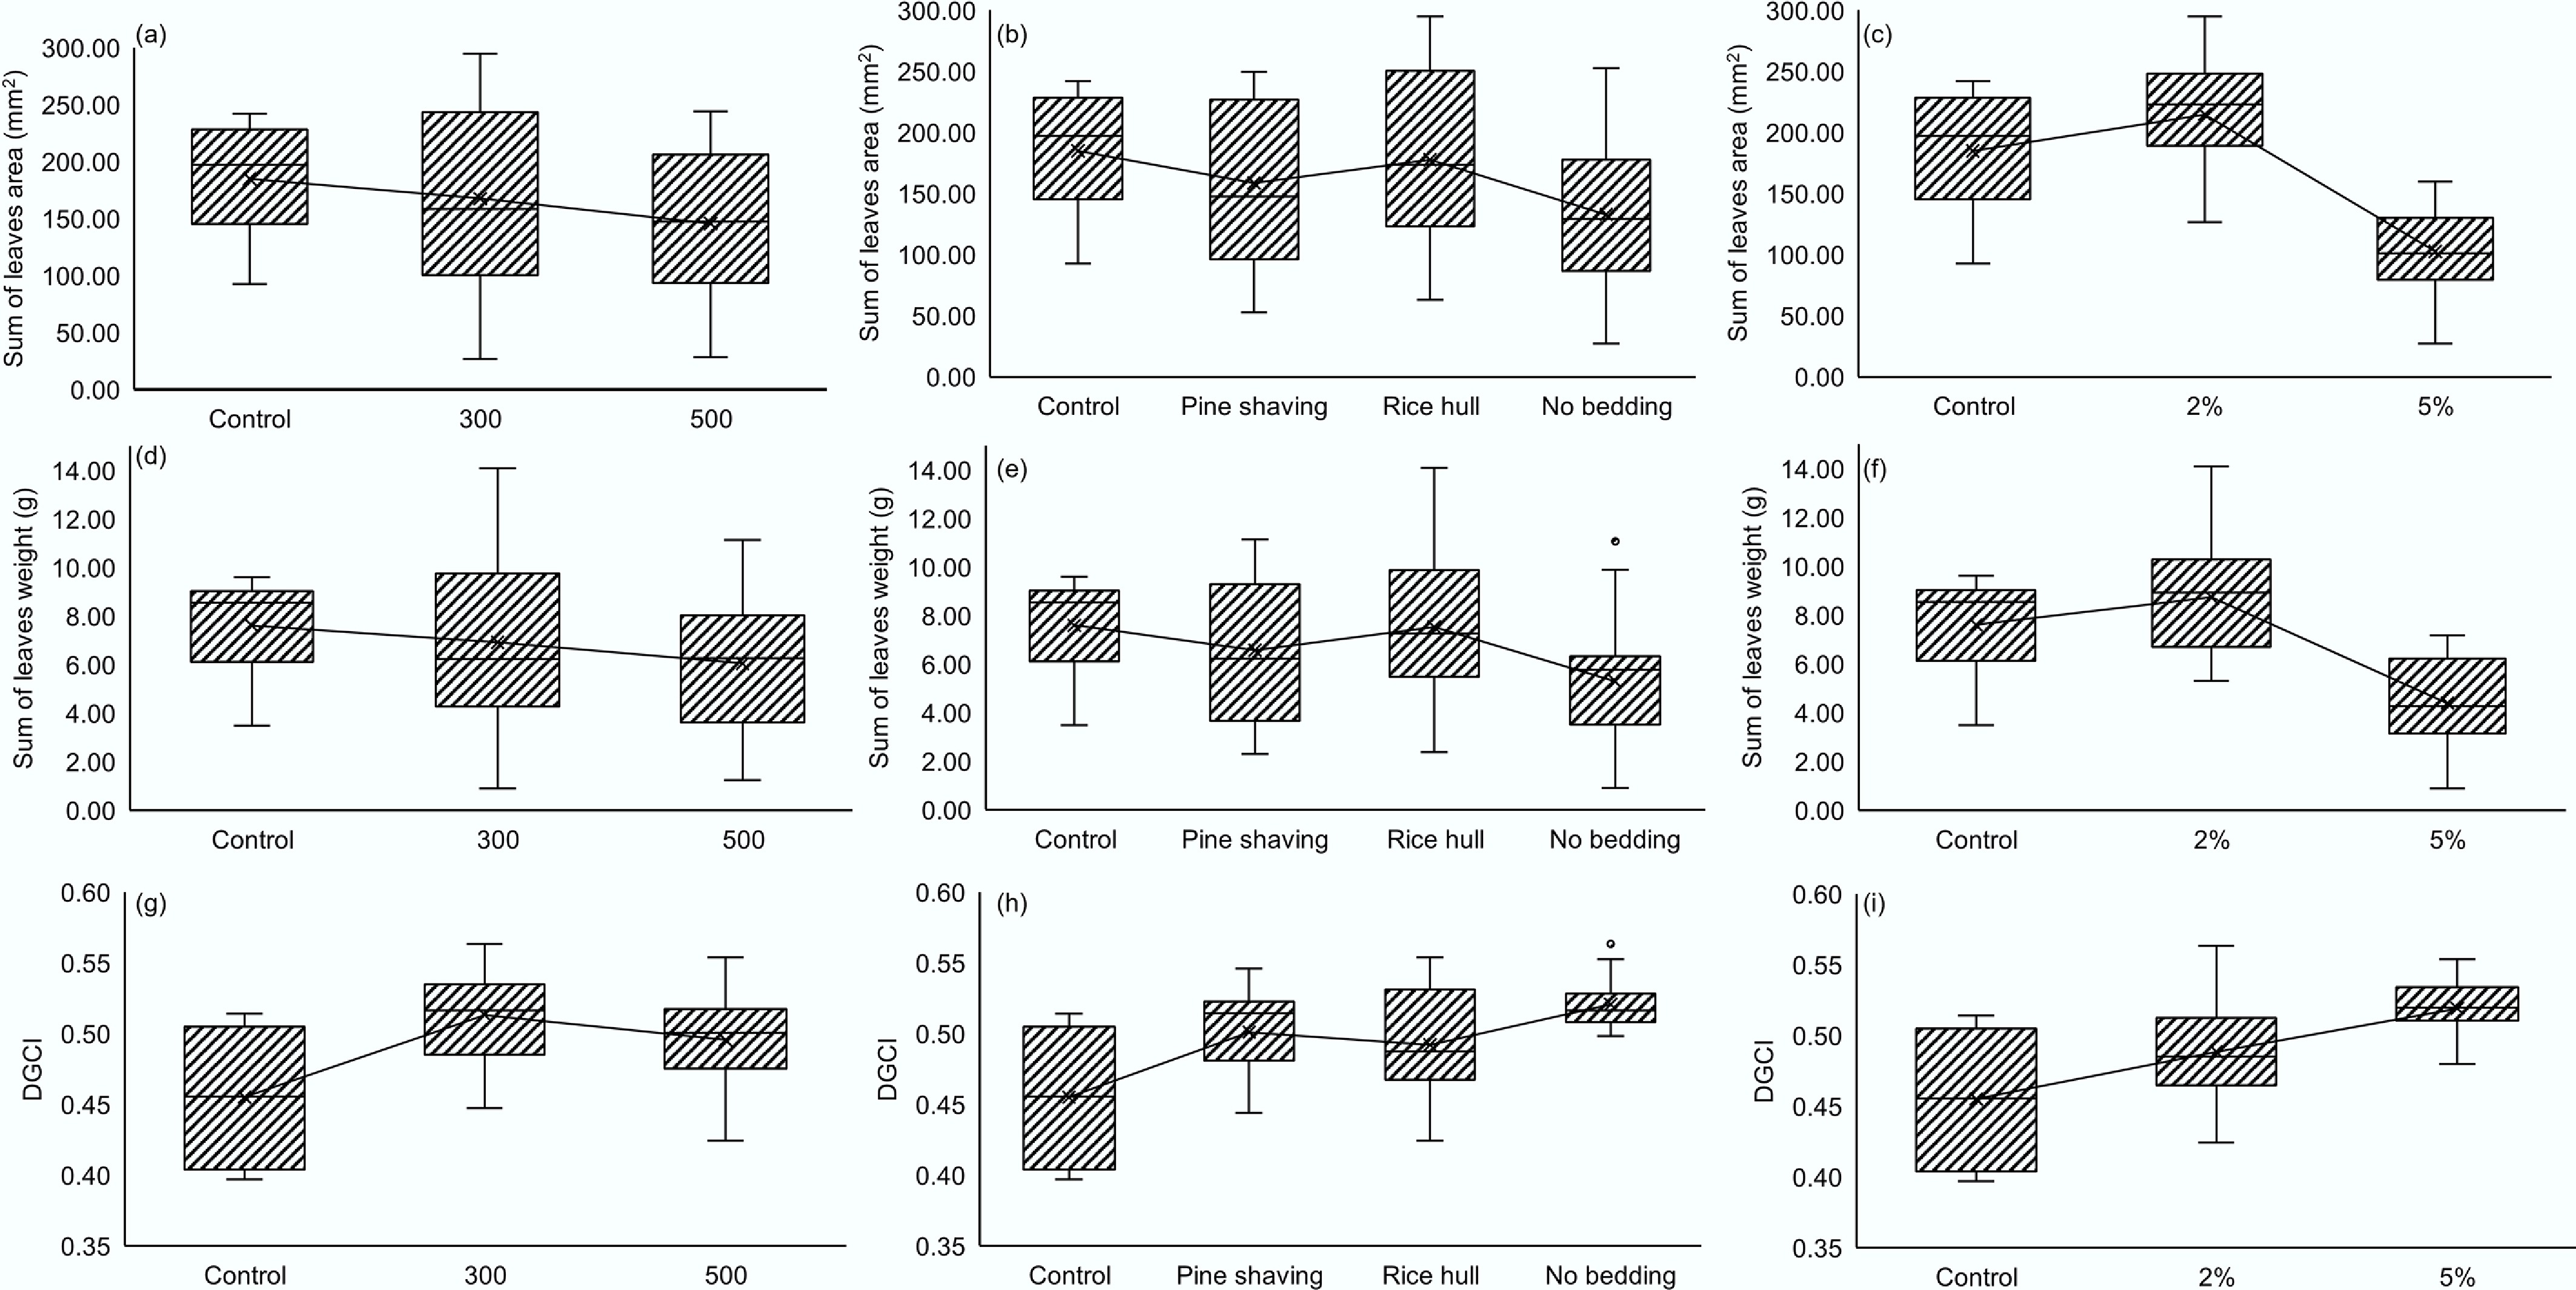
Figure 5.
Effects of poultry litter biochar pyrolysis temperature, bedding material, and application rate on (a)–(c) radish leaf area, (d)–(f) leaf biomass, and (g)–(i) Dark Green Color Index (DGCI).
-
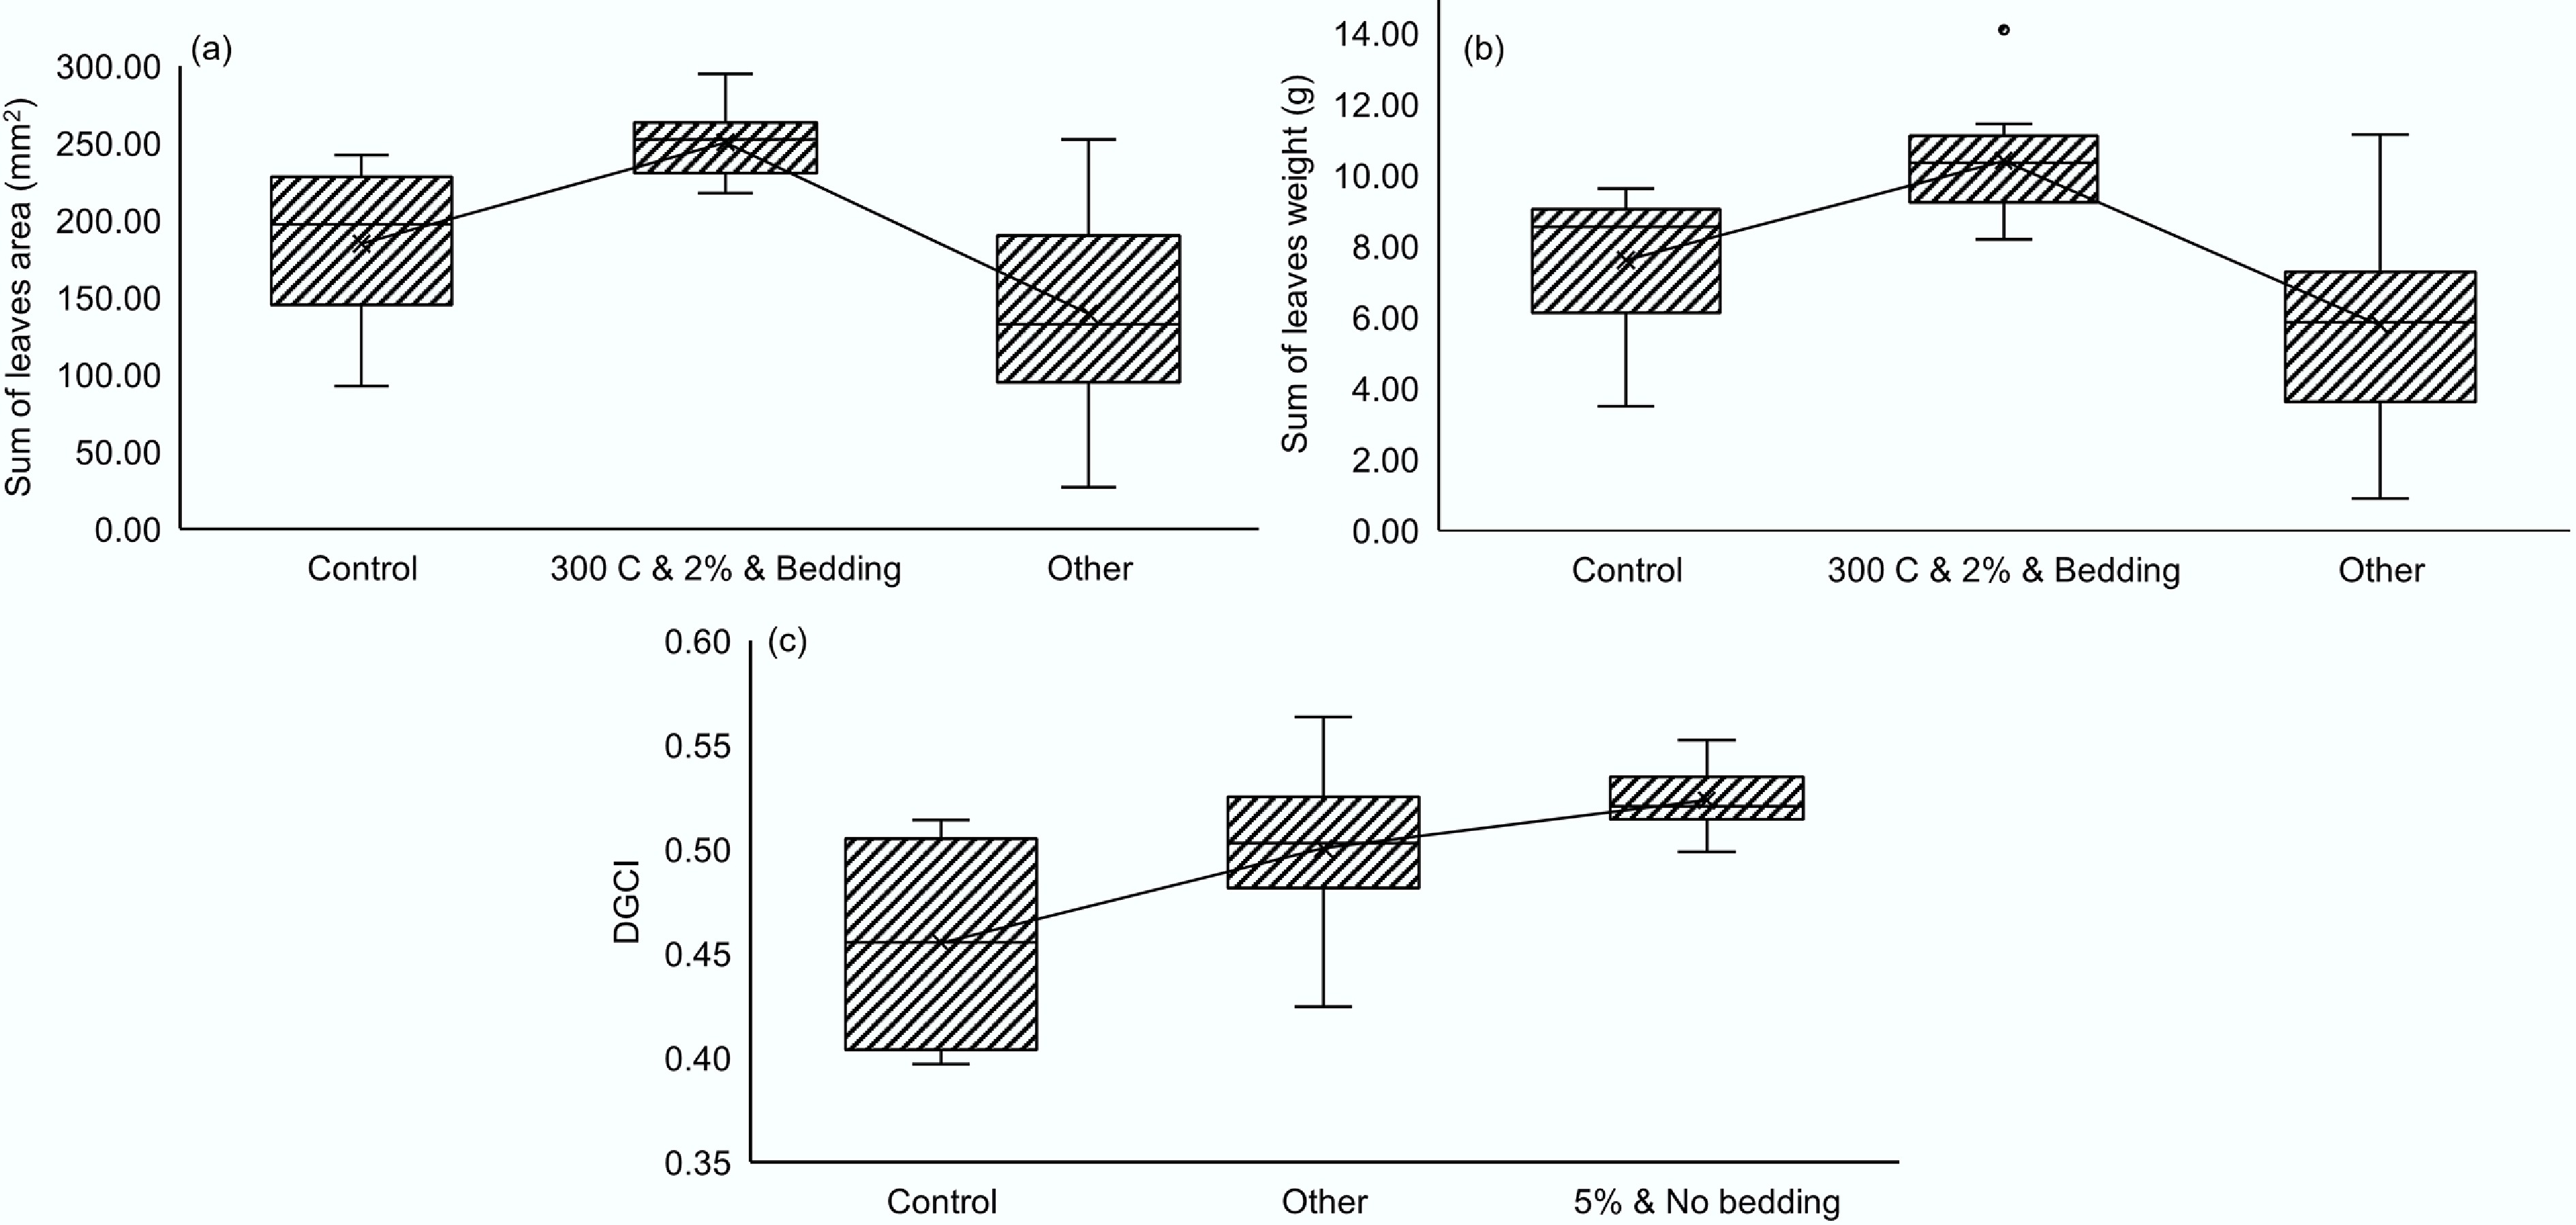
Figure 6.
(a)–(c) Optimization plots derived from multi-factor regression analysis showing conditions for maximum radish leaf growth and DGCI.
-
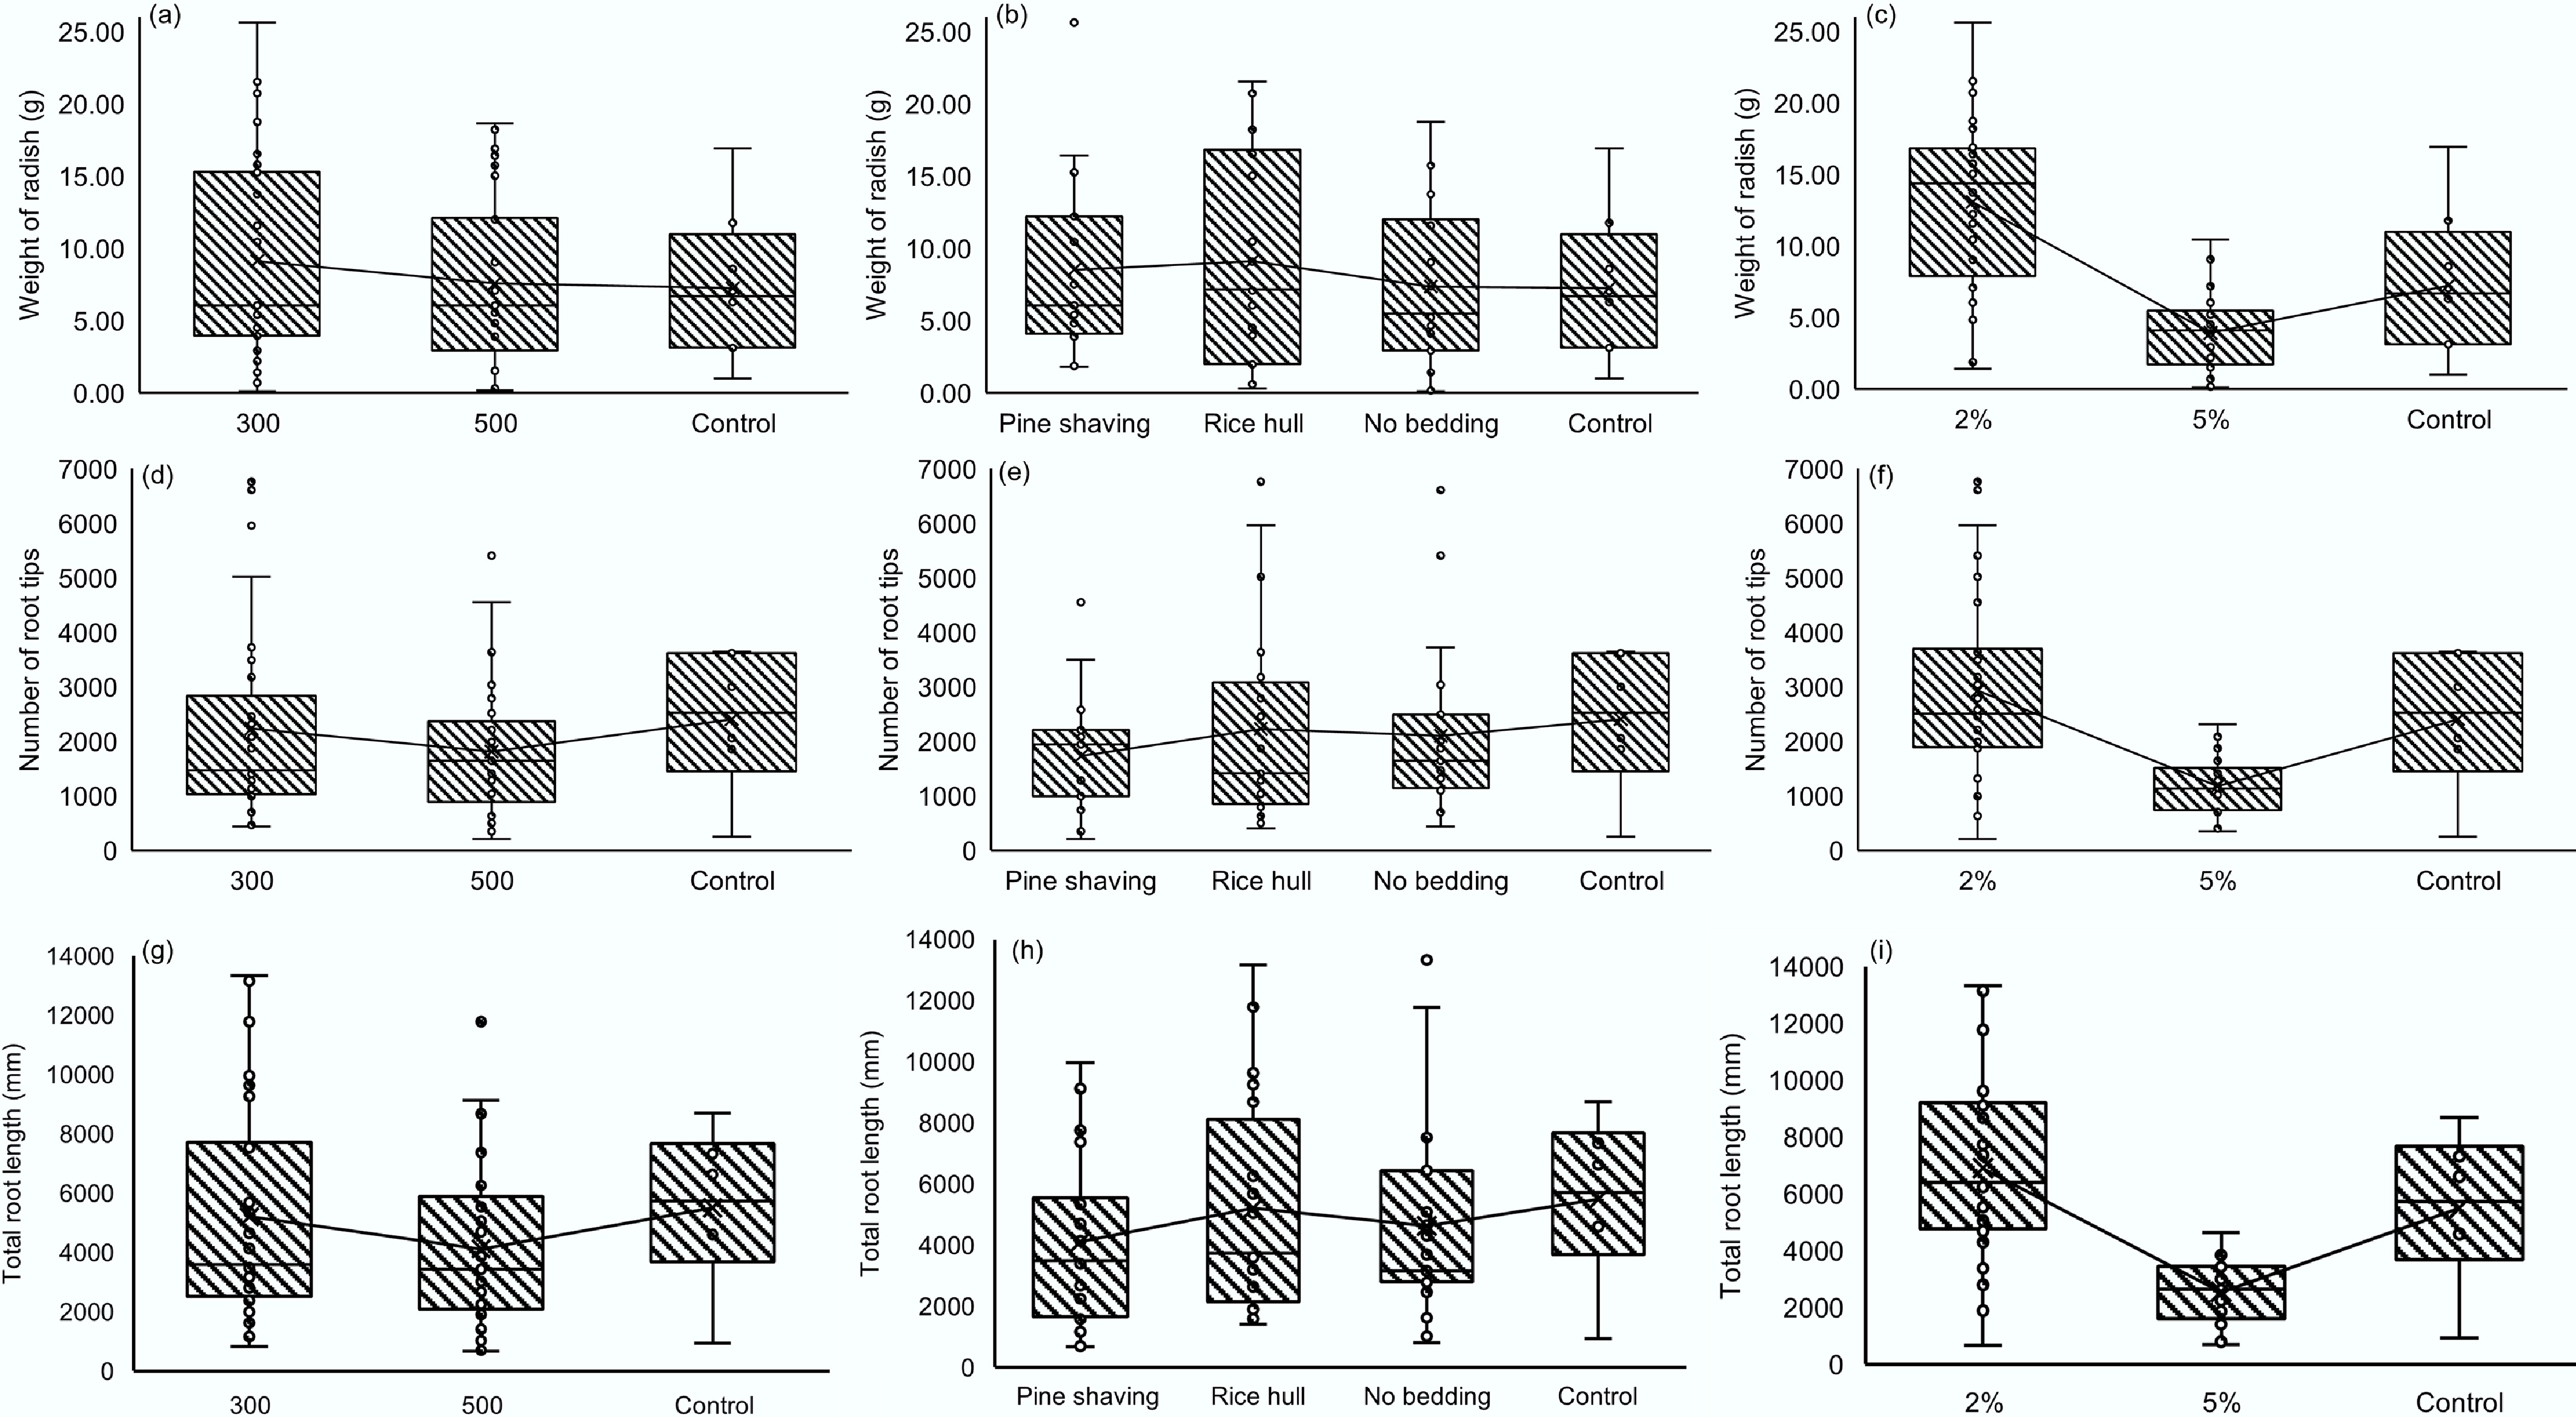
Figure 7.
Effects of poultry litter biochar application rate and pyrolysis temperature on (a)–(c) radish root biomass, (d)–(f) total root length, and (g)–(i) root tip number.
-
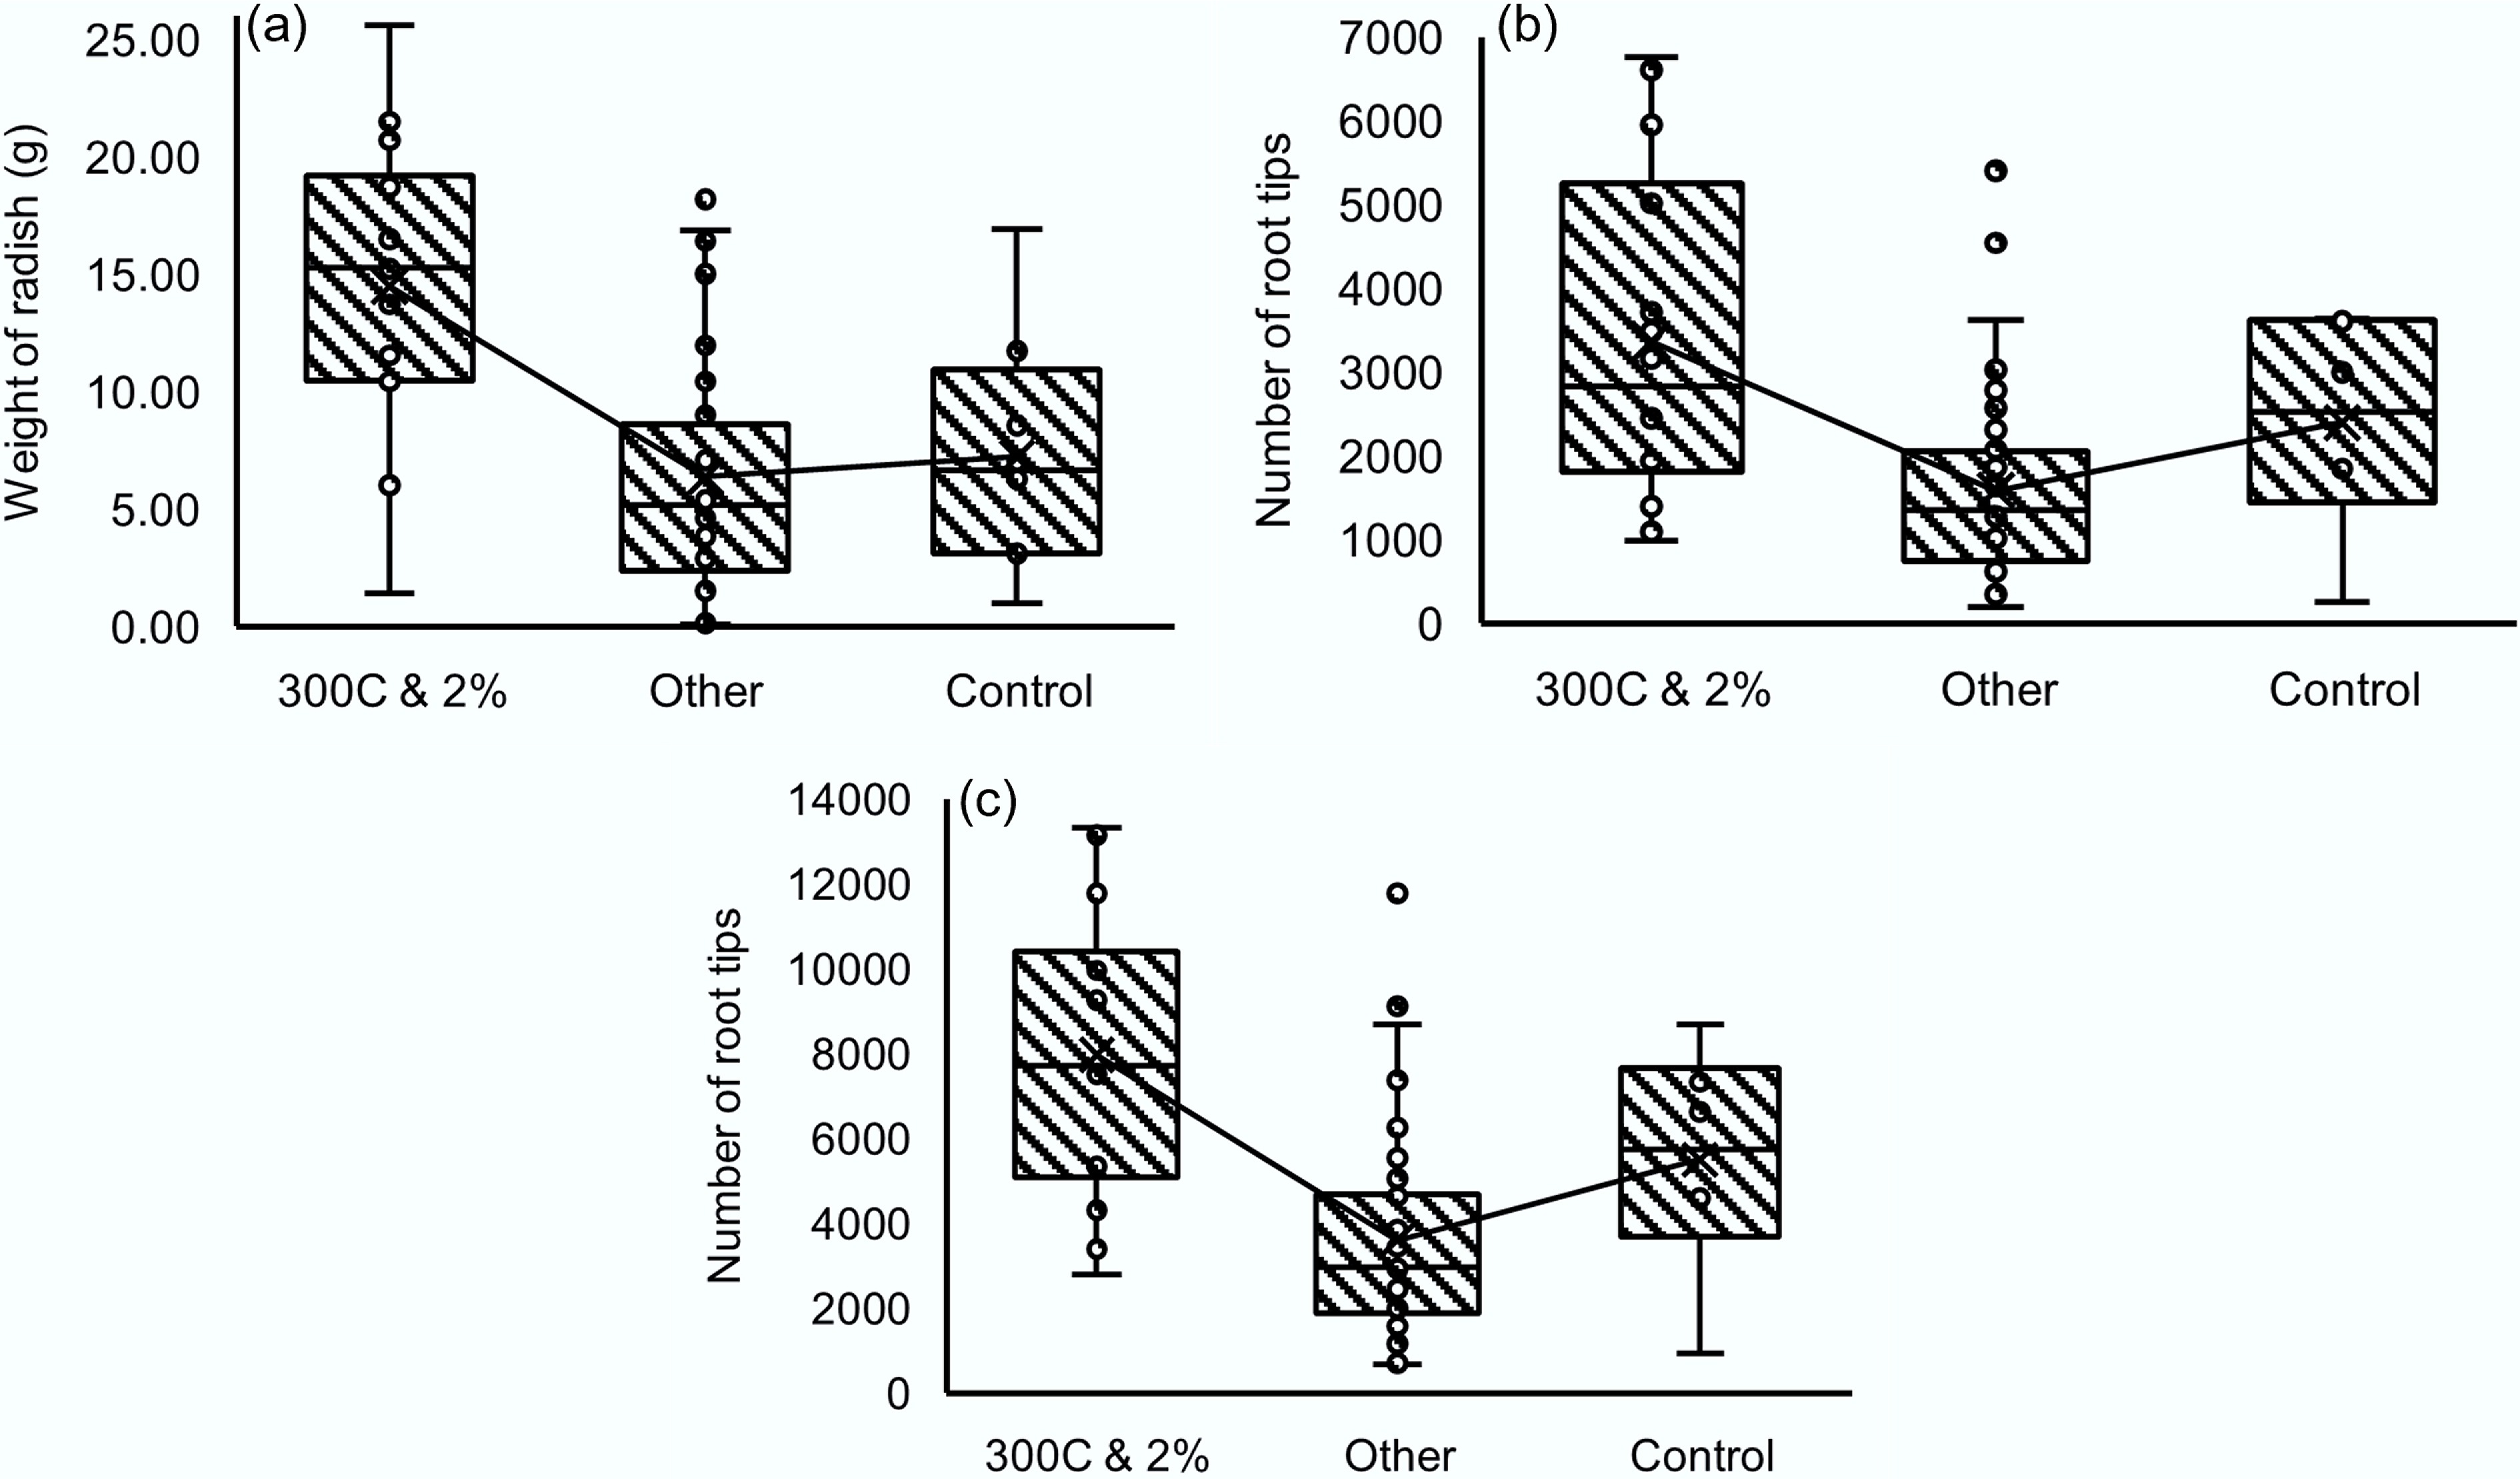
Figure 8.
(a)–(c) Root architecture responses of radish plants to poultry litter biochar amendment under different pyrolysis temperatures and application rates.
-
Serial No. Reaction temperature Bedding marterial PLB 1 300 °C 10 % Pine shavings PLB 2 500 °C 10 % Pine shavings PLB 3 300 °C 10% Rice hulls PLB 4 500 °C 10% Rice hulls PLB 5 300 °C No bedding PLB 6 500 °C No bedding Table 1.
Production conditions of poultry litter biochars prepared under varying pyrolysis temperatures and bedding material compositions
-
PL RH1 PS2 PLB Ultimate analysis
(Dry-based, wt.%)C 27.86 32.20 43.42 34.48 H 6.28 6.41 8.39 1.77 O 33.49 38.87 < 25.54 4.99 N 4.02 0.34 < 0.2 4.28 S 1.72 0.06 0.06 2.06 Proximate analysis
(Dry-based, wt.%)VM3 65.31 62.40 69.6 23.36 FC4 8.06 15.48 8.01 24.23 A5 26.63 22.12 22.39 52.42 HHV6 13,782 15,521 19,745 14,596 1 Rice hulls. 2 Pine shavings. 3 Volatile matter. 4 Fixed carbon. 5 Ash content. 6 High heat value (kJ/kg). Table 2.
Proximate and ultimate analyses of poultry litter feedstock, bedding materials, and derived biochars[14]
-
Test item Soil PL PLB 1 PLB 2 PLB 3 PLB 4 PLB 5 PLB 6 Optimal range pH 6.84 6.7 8.04 9.13 8.03 9.26 7.88 9.11 5.8–7.0 Total nitrogen (N) 9.14 69.13 1.61 1.61 1.61 1.61 3.97 13.79 32.0–60.0 Phosphorus (P) 137.32 55.74 8.47 4.9 10.39 5.35 19.95 25.87 8.0–20.0 Potassium (K) 19.32 1,260.61 1,021.24 1,329.36 996.6 922.46 1,610.11 1,715.16 38.0–80.0 Sulfur (S) 8.37 577.86 302.09 308.07 303.51 257.38 499.23 571.96 7.0–22.0 Calcium (Ca) 676.3 100.64 17.34 12.43 15.51 13.95 22.04 46.38 80.0–320.0 Magnesium (Mg) 42.25 122.01 43.25 23.64 49.54 15.39 63.6 48 27.0–70.0 Sodium (Na) 6.78 446.81 244.42 260.96 256.18 169.49 569.4 499.39 0.5–30.0 Iron (Fe) 20.6 0.75 0.22 0.12 0.42 0.07 0.91 0.46 3.0–10.0 Manganese (Mn) 8.15 2.92 0.19 0.2 0.21 0.24 0.46 1.04 4.0–10.0 Zinc (Zn) 1.71 0.59 0.04 0.02 0.06 0.03 0.13 0.12 0.1–0.25 Copper (Cu) 0.53 2.01 0.66 0.21 0.81 0.21 2.15 0.63 0.06–0.3 Boron (B) 0.05 0.29 0.08 0.11 0.12 0.05 0.13 0.18 0.2–0.6 K: Na 2.8:1 2.8:1 4.2:1 5.1:1 3.9:1 5.4:1 2.8:1 3.4:1 Results are provided in parts per million (ppm) except for the pH and K : Na ratio. The 'optimal range' list in the table is advised by the tester. Table 3.
Soil and poultry litter biochar chemical properties compared with agronomic reference ranges[14]
-
Soil unit Bulk density
(g/cm3)Porosity
(%)Gravimetric
moisture for
saturated soil (%)Gravimetric WHC (%) Soil + 5% PLB1 1.239 46.4 37.4 36.5 Soil + 5% PLB2 1.224 43.9 35.8 34.5 Soil + 5% PLB3 1.177 41.9 35.6 34.3 Soil + 5% PLB4 1.205 44.2 36.7 36.0 Soil + 5% PLB5 1.221 45.2 37.0 35.7 Soil + 5% PLB6 1.197 45.2 37.7 36.7 Average 1.211 44.454 36.712 35.601 Pure soil 1.226 43.4 35.4 33.5 Increment (%) −1.24 2.37 3.64 6.20 Table 4.
Effects of poultry litter biochar amendment on soil physical properties and water retention
-
Series No. Pyrolysis
temperature (°C)Bedding
materialLand application
ratio by weight (%)1 300 Pine shavings 2 2 500 Pine shavings 2 3 300 Rice hulls 2 4 500 Rice hulls 2 5 300 Pine shavings 5 6 500 Pine shavings 5 7 300 Rice hulls 5 8 500 Rice hulls 5 9 300 No bedding 2 10 500 No bedding 2 11 300 No bedding 5 12 500 No bedding 5 Table 5.
Factorial experimental design for seed germination and greenhouse pot trials
-
Soil sample S/N 1 2 3 4 5 6 7 8 9 10 11 12 13 Germination rate 0.97 1 0.97 1 0.97 1 1 1 0.93 0.97 1 1 0.8 Table 6.
Seed germination response of radish to poultry litter biochar amendments
Figures
(8)
Tables
(6)