-
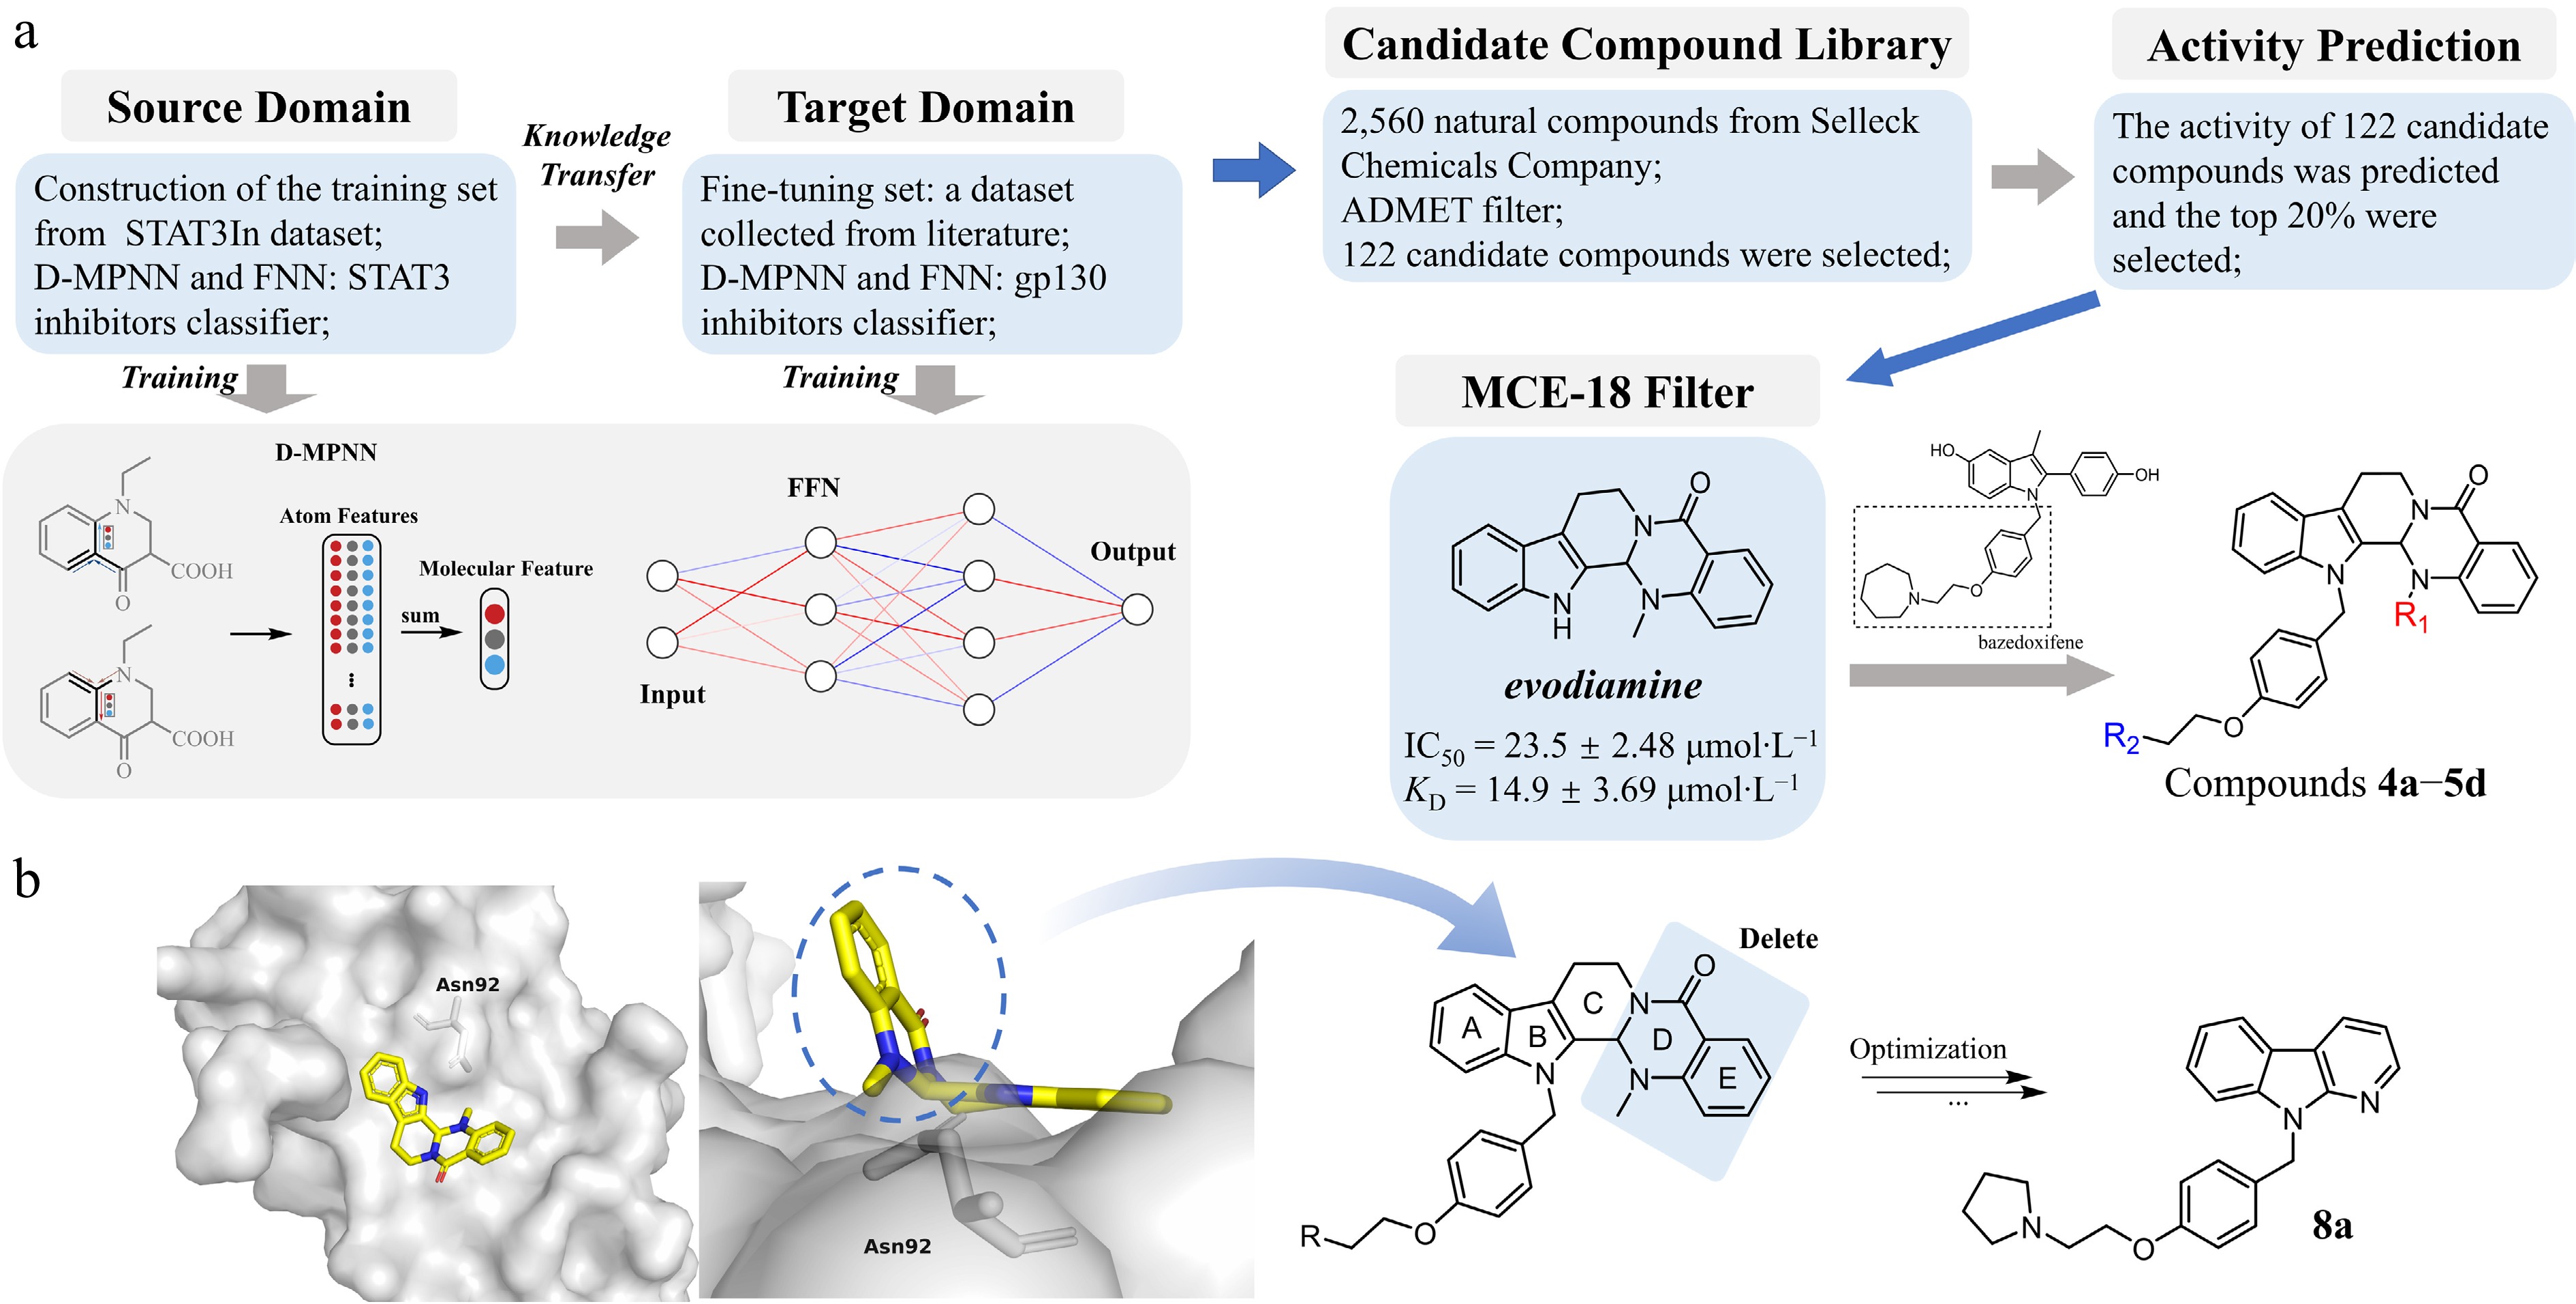
Figure 1.
Design strategy and structure optimization of novel gp130-targeting compounds. (a) Preliminary identification of lead compounds. A transfer learning strategy was adopted to construct a gp130 inhibitor classification model integrating a Directed Message Passing Neural Network (D-MPNN) and a Feedforward Neural Network (FNN). After pretraining on the known STAT3 inhibitor (source Domain), the pretrained model was fine-tuned using the gp130-related compounds (Target Domain) to create the final gp130 inhibitor classifier. This classifier was then used to screen a library of 2,560 natural compounds. After ADMET screening, 122 candidate drugs with relatively high activity scores were obtained. These candidate drugs were further evaluated through the MCE-18 index, and ultimately evodiamine was selected as the primary hit. It shows weak anti-tumor activity and binding affinity with gp130 against colorectal cancer HT-29 cells (with the IC50 of 23.5 ± 2.48 µmol·L−1, and the KD of 14.9 ± 3.69 µmol·L−1). A hybridization strategy combining the evodiamine scaffold with the linker moiety from bazedoxifene led to the synthesis of derivative series 4a−5d. (b) Structural optimization based on anti-tumor activity at the cellular level. Left panel (front and top view): Molecular docking of evodiamine with the gp130 D1 domain reveals its binding pose and key interactions, providing a structural basis for modification. Based on the docking analysis (right panel) and supported by in vitro antitumor activity data, iterative structural modifications were performed on the evodiamine-bazedoxifene hybrid scaffold. This rational design process ultimately yielded the optimized candidate compound 8a.
-
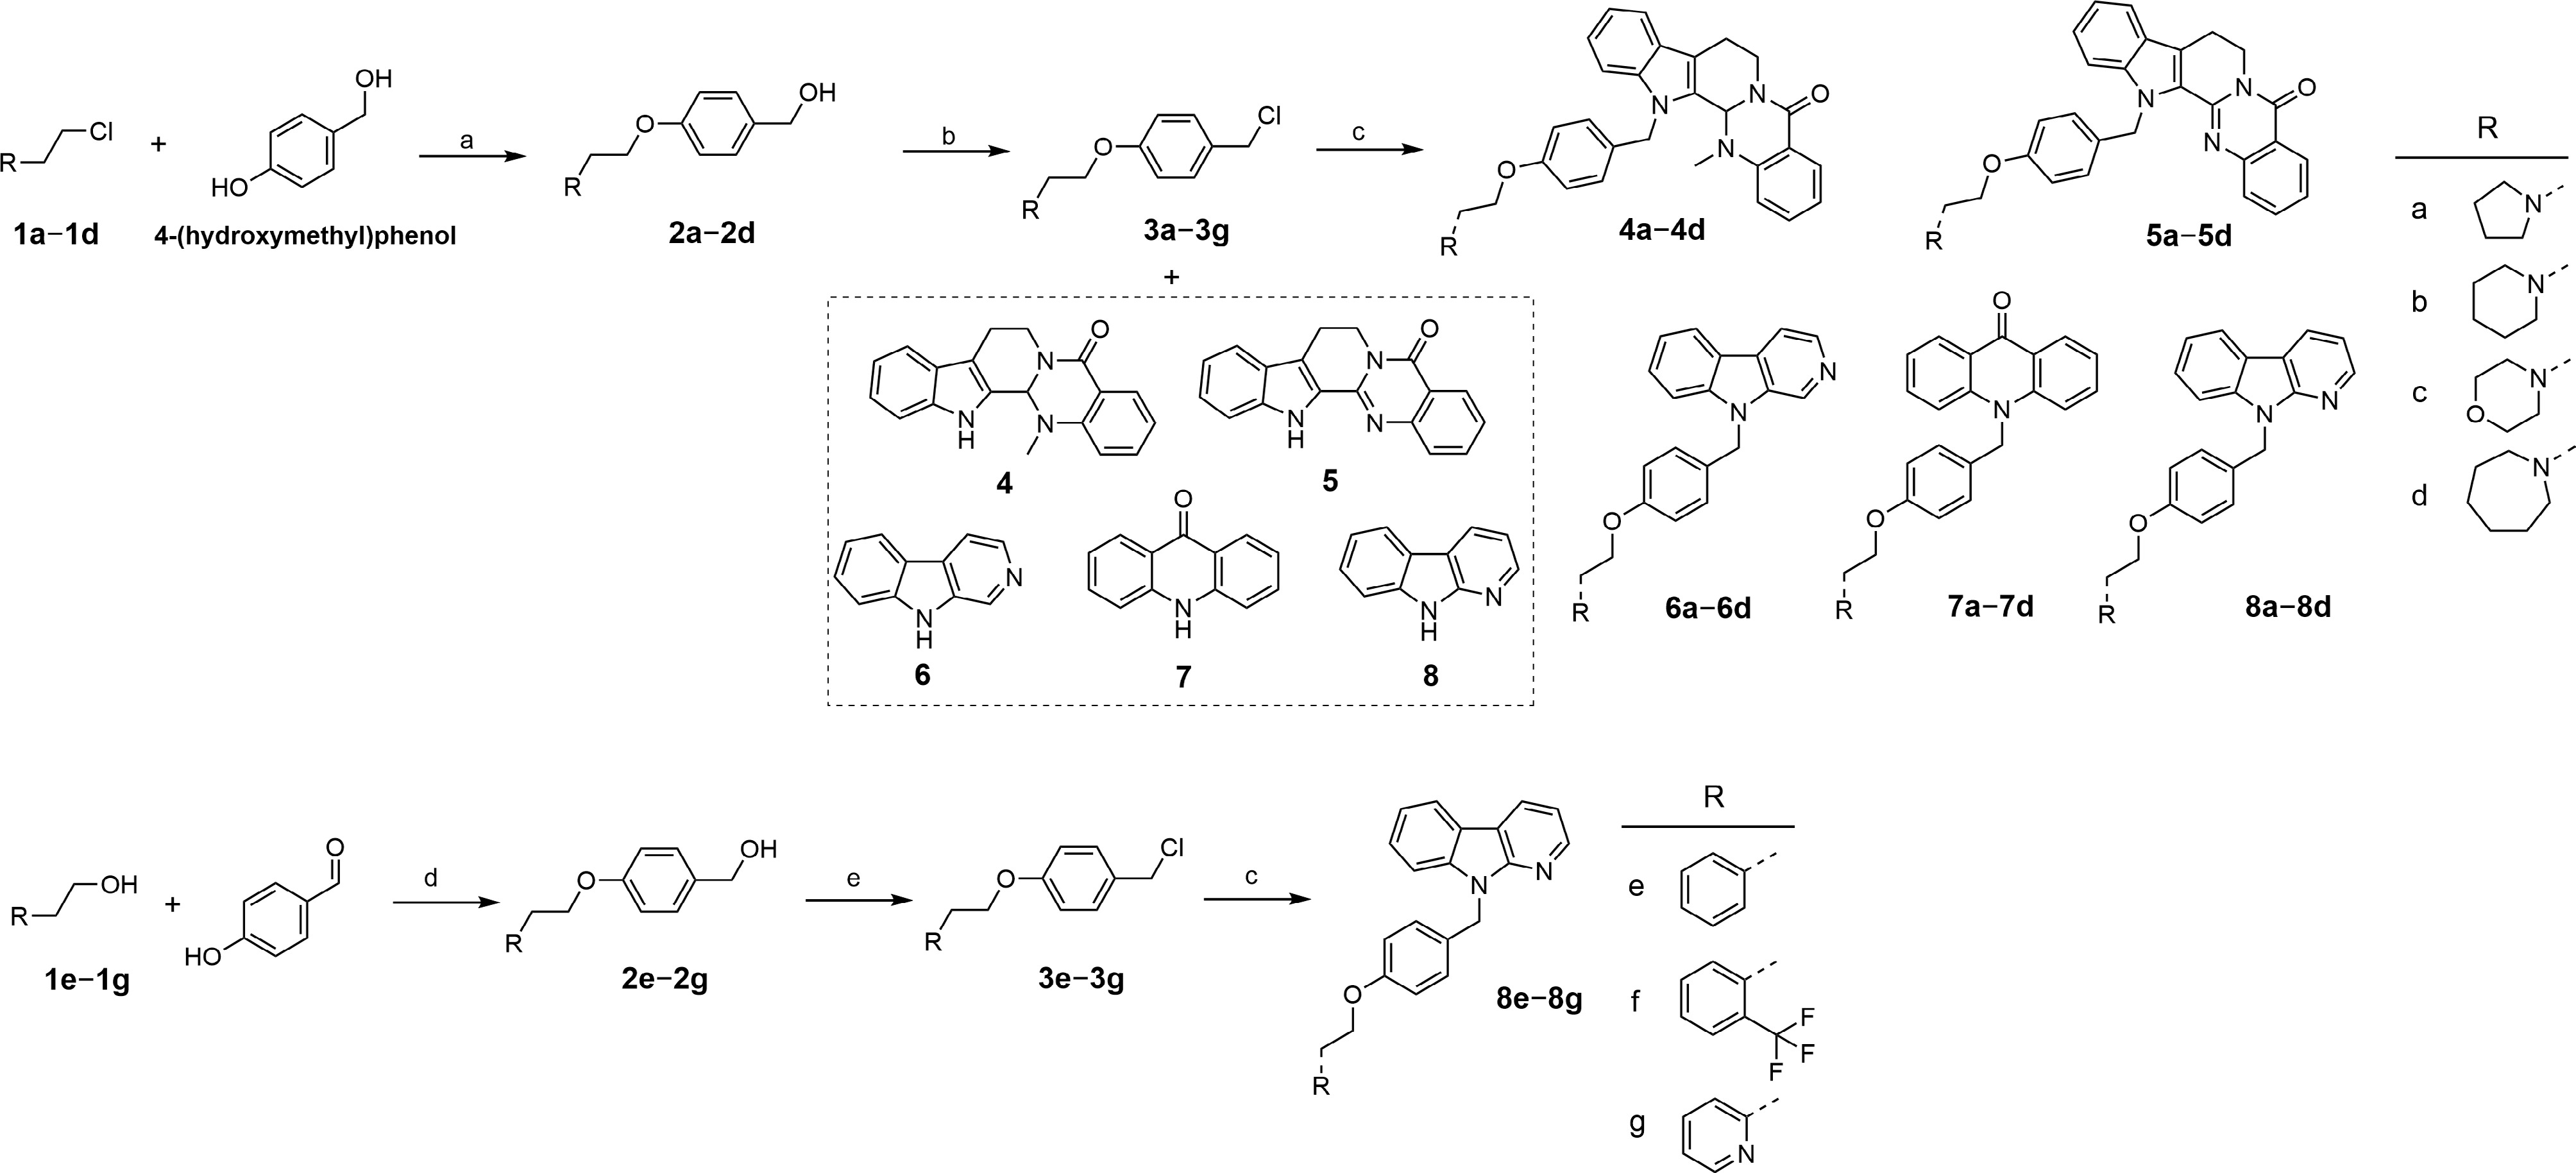
Figure 2.
The synthesis of targeted compounds. (a) NaOH, TBAB, H2O/toluene, 85 °C, 2 h; (b) SOCl2, THF, 0 °C to r.t., overnight; (c) NaH, anhydrous DMF, 0 °C to r.t., overnight; (d) (1) PPh3, DIAD, 4-hydroxybenzaldehyde, THF, 0 °C to r.t., 2 h; (2) NaBH4, MeOH, r.t., 2 h; (e) SOCl2, anhydrous CH2Cl2, 0 °C to r.t., overnight.
-
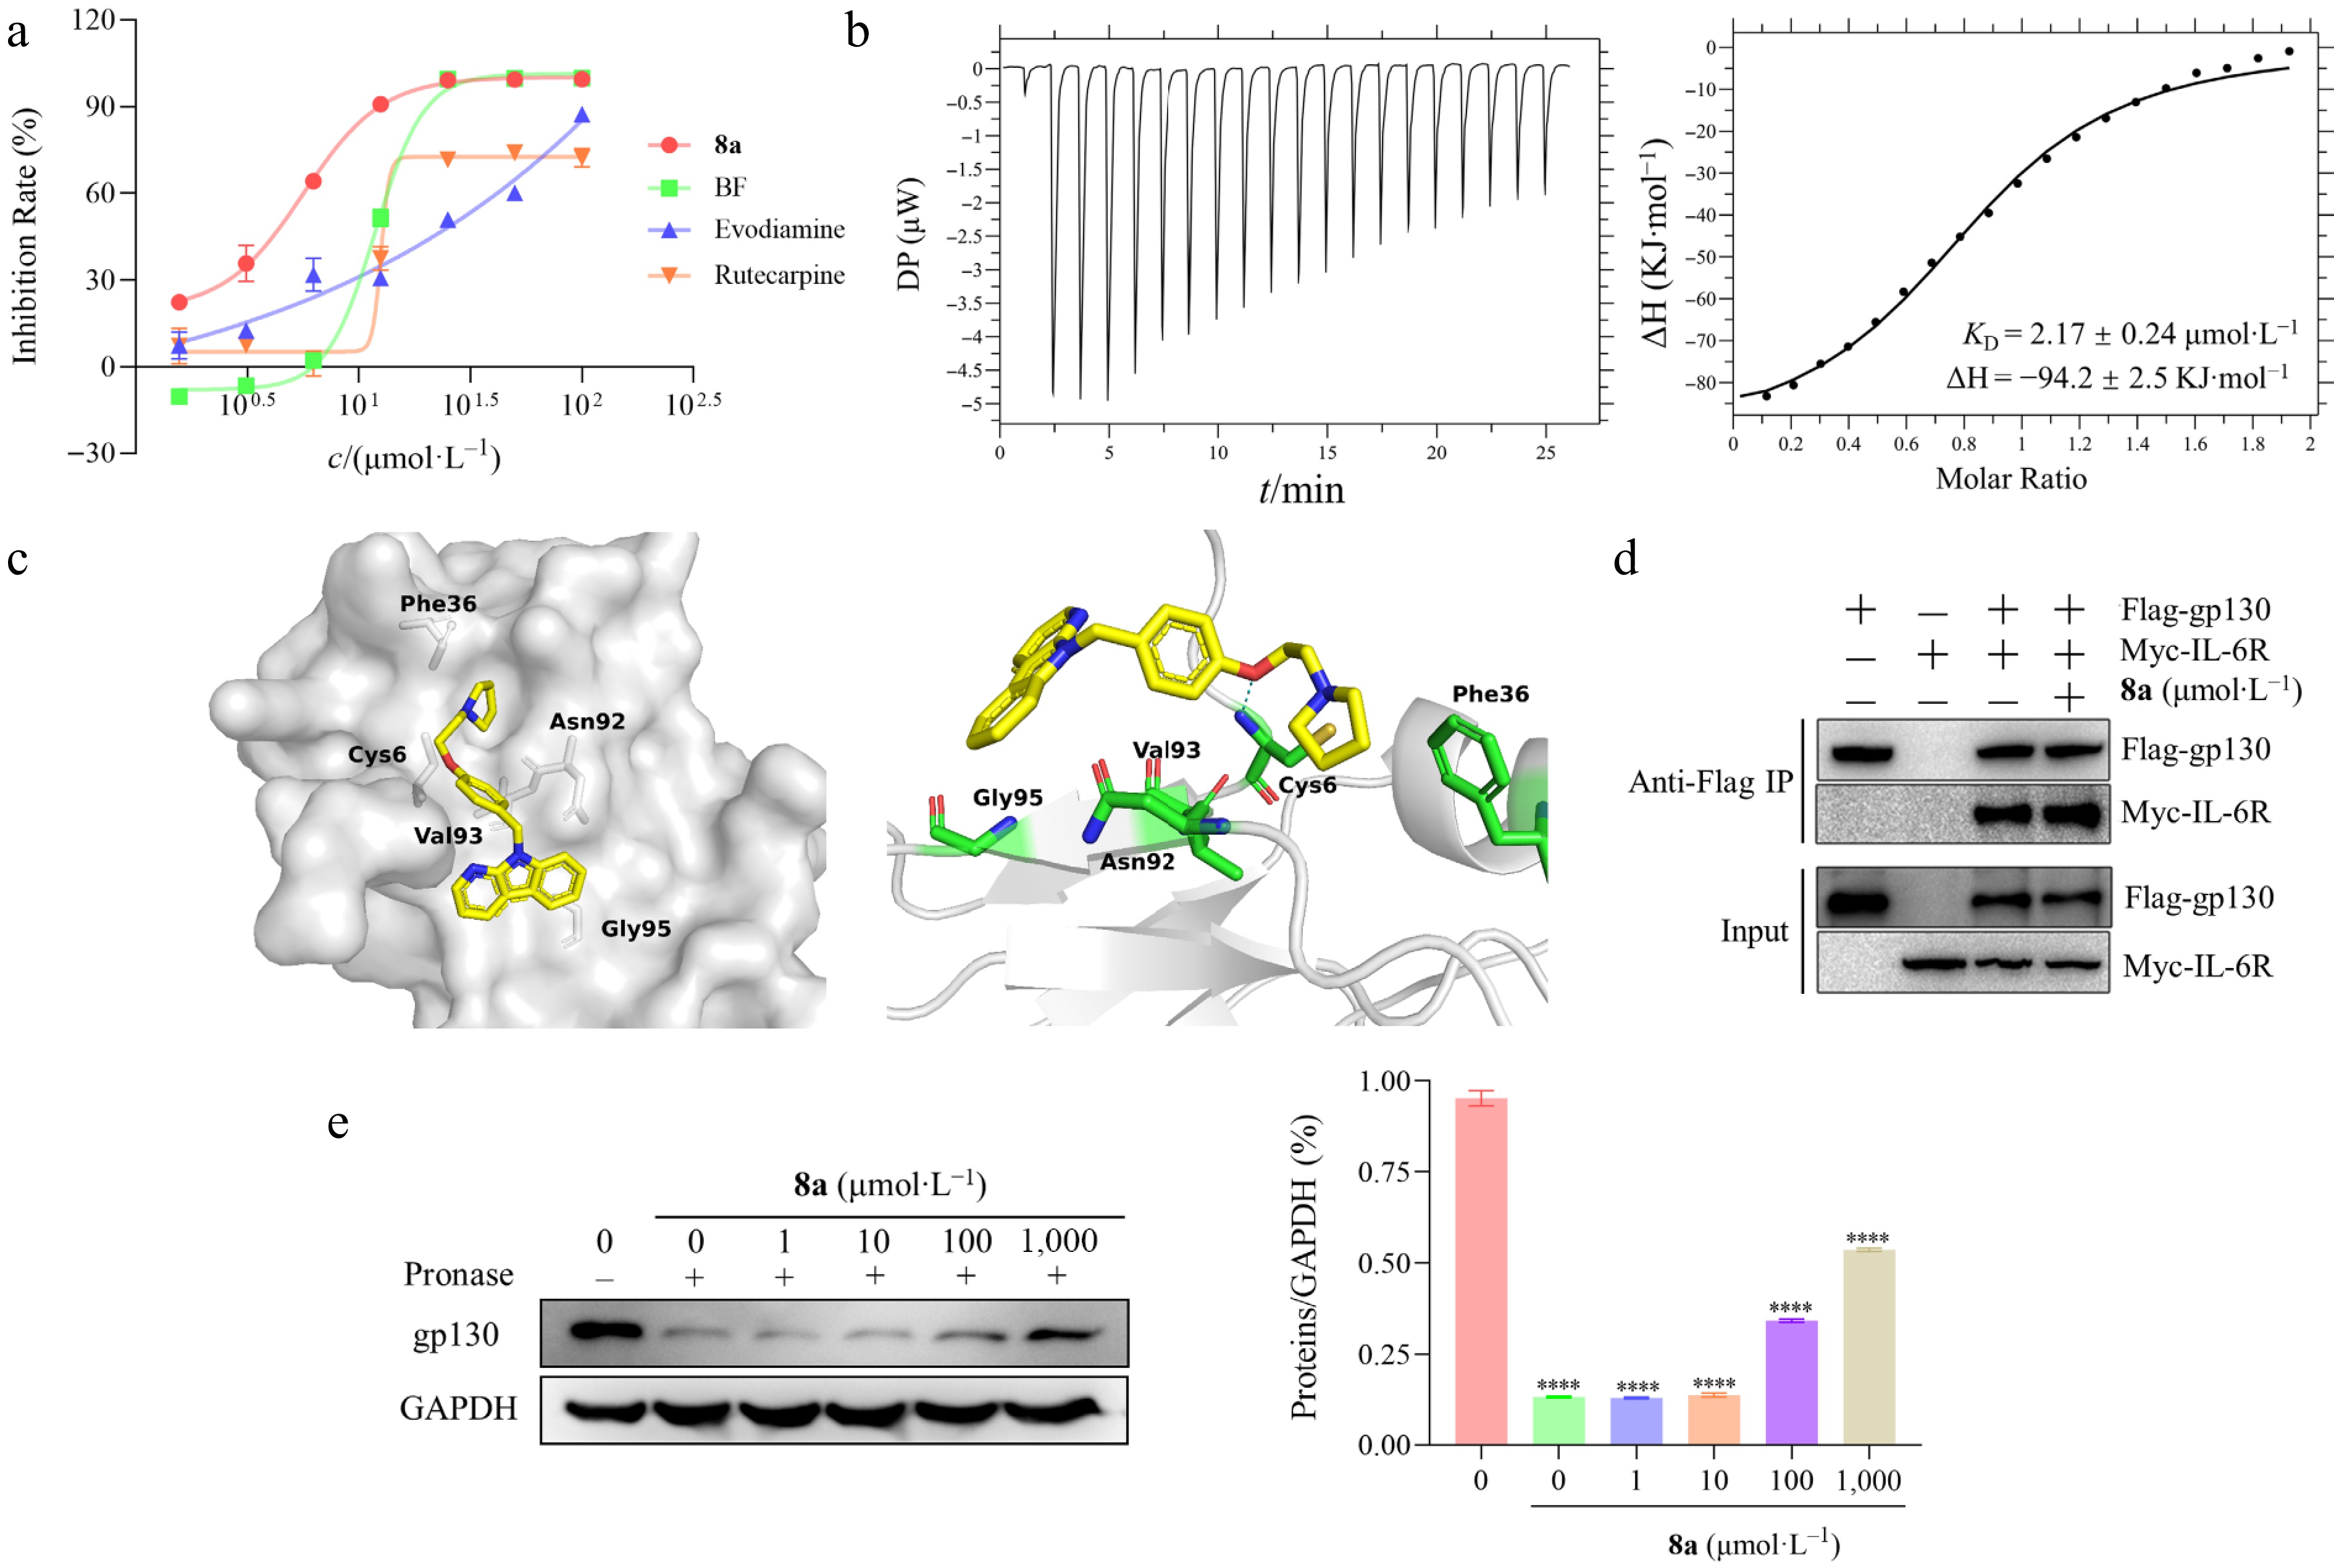
Figure 3.
Study on the interaction between 8a and gp130 protein. (a) The antiproliferation activities of evodiamine (IC50 = 23.50 ± 2.48 μmol·L−1), rutaecarpine (IC50 = 20.41 ± 2.35 μmol·L−1), bazedoxifene (IC50 = 10.03 ± 1.02 μmol·L−1), and 8a (IC50 = 4.57 ± 0.16 μmol·L−1) against HT-29 cells in vitro. (b) Thermodynamic characterization of the interaction between 8a and the gp130 protein. The direct binding affinity of compound 8a to gp130 protein was determined by isothermal titration calorimetry (ITC) at 25 °C, and the binding isotherms were fitted by the unit point model of the PEAQ-ITC software. The left figure shows the thermodynamic curve of the binding of 8a to the gp130 protein, and the titration curve indicates that the binding of 8a to the gp130 protein is an exothermic process. The right figure shows that the equilibrium dissociation constant (KD) is 2.17µmol·L−1 by integrating with isotherms. (c) Molecular docking predicts the 8a binding mode. Molecular docking simulation of compound 8a (yellow rod) within the D1 domain of gp130 (gray surface). This diagram includes a general view (left) and a detailed view (right), that the specific hydrogen bond interactions formed between 8a and the key amino acid residues of gp130 (the blue dotted line). (d) The compound 8a treated the HEK293 cells that were co-transfected with flag labeled gp130, and myc labeled IL-6Rα, and then collected cell lysates or co-immunoprecipitation assay analysis. The results revealed that 8a did not disrupt IL-6/IL-6R/gp130 complex formation. (e) The binding of compounds to target proteins protect proteins from protease hydrolysis. HT-29 cells were treated with 8a, and the lysates were collected for DARTS assay to analyze the relative abundance of the gp130 protein. The left figure shows the protein abundance by Western blot, and the right figure shows the quantitative analysis of protein abundance.
-
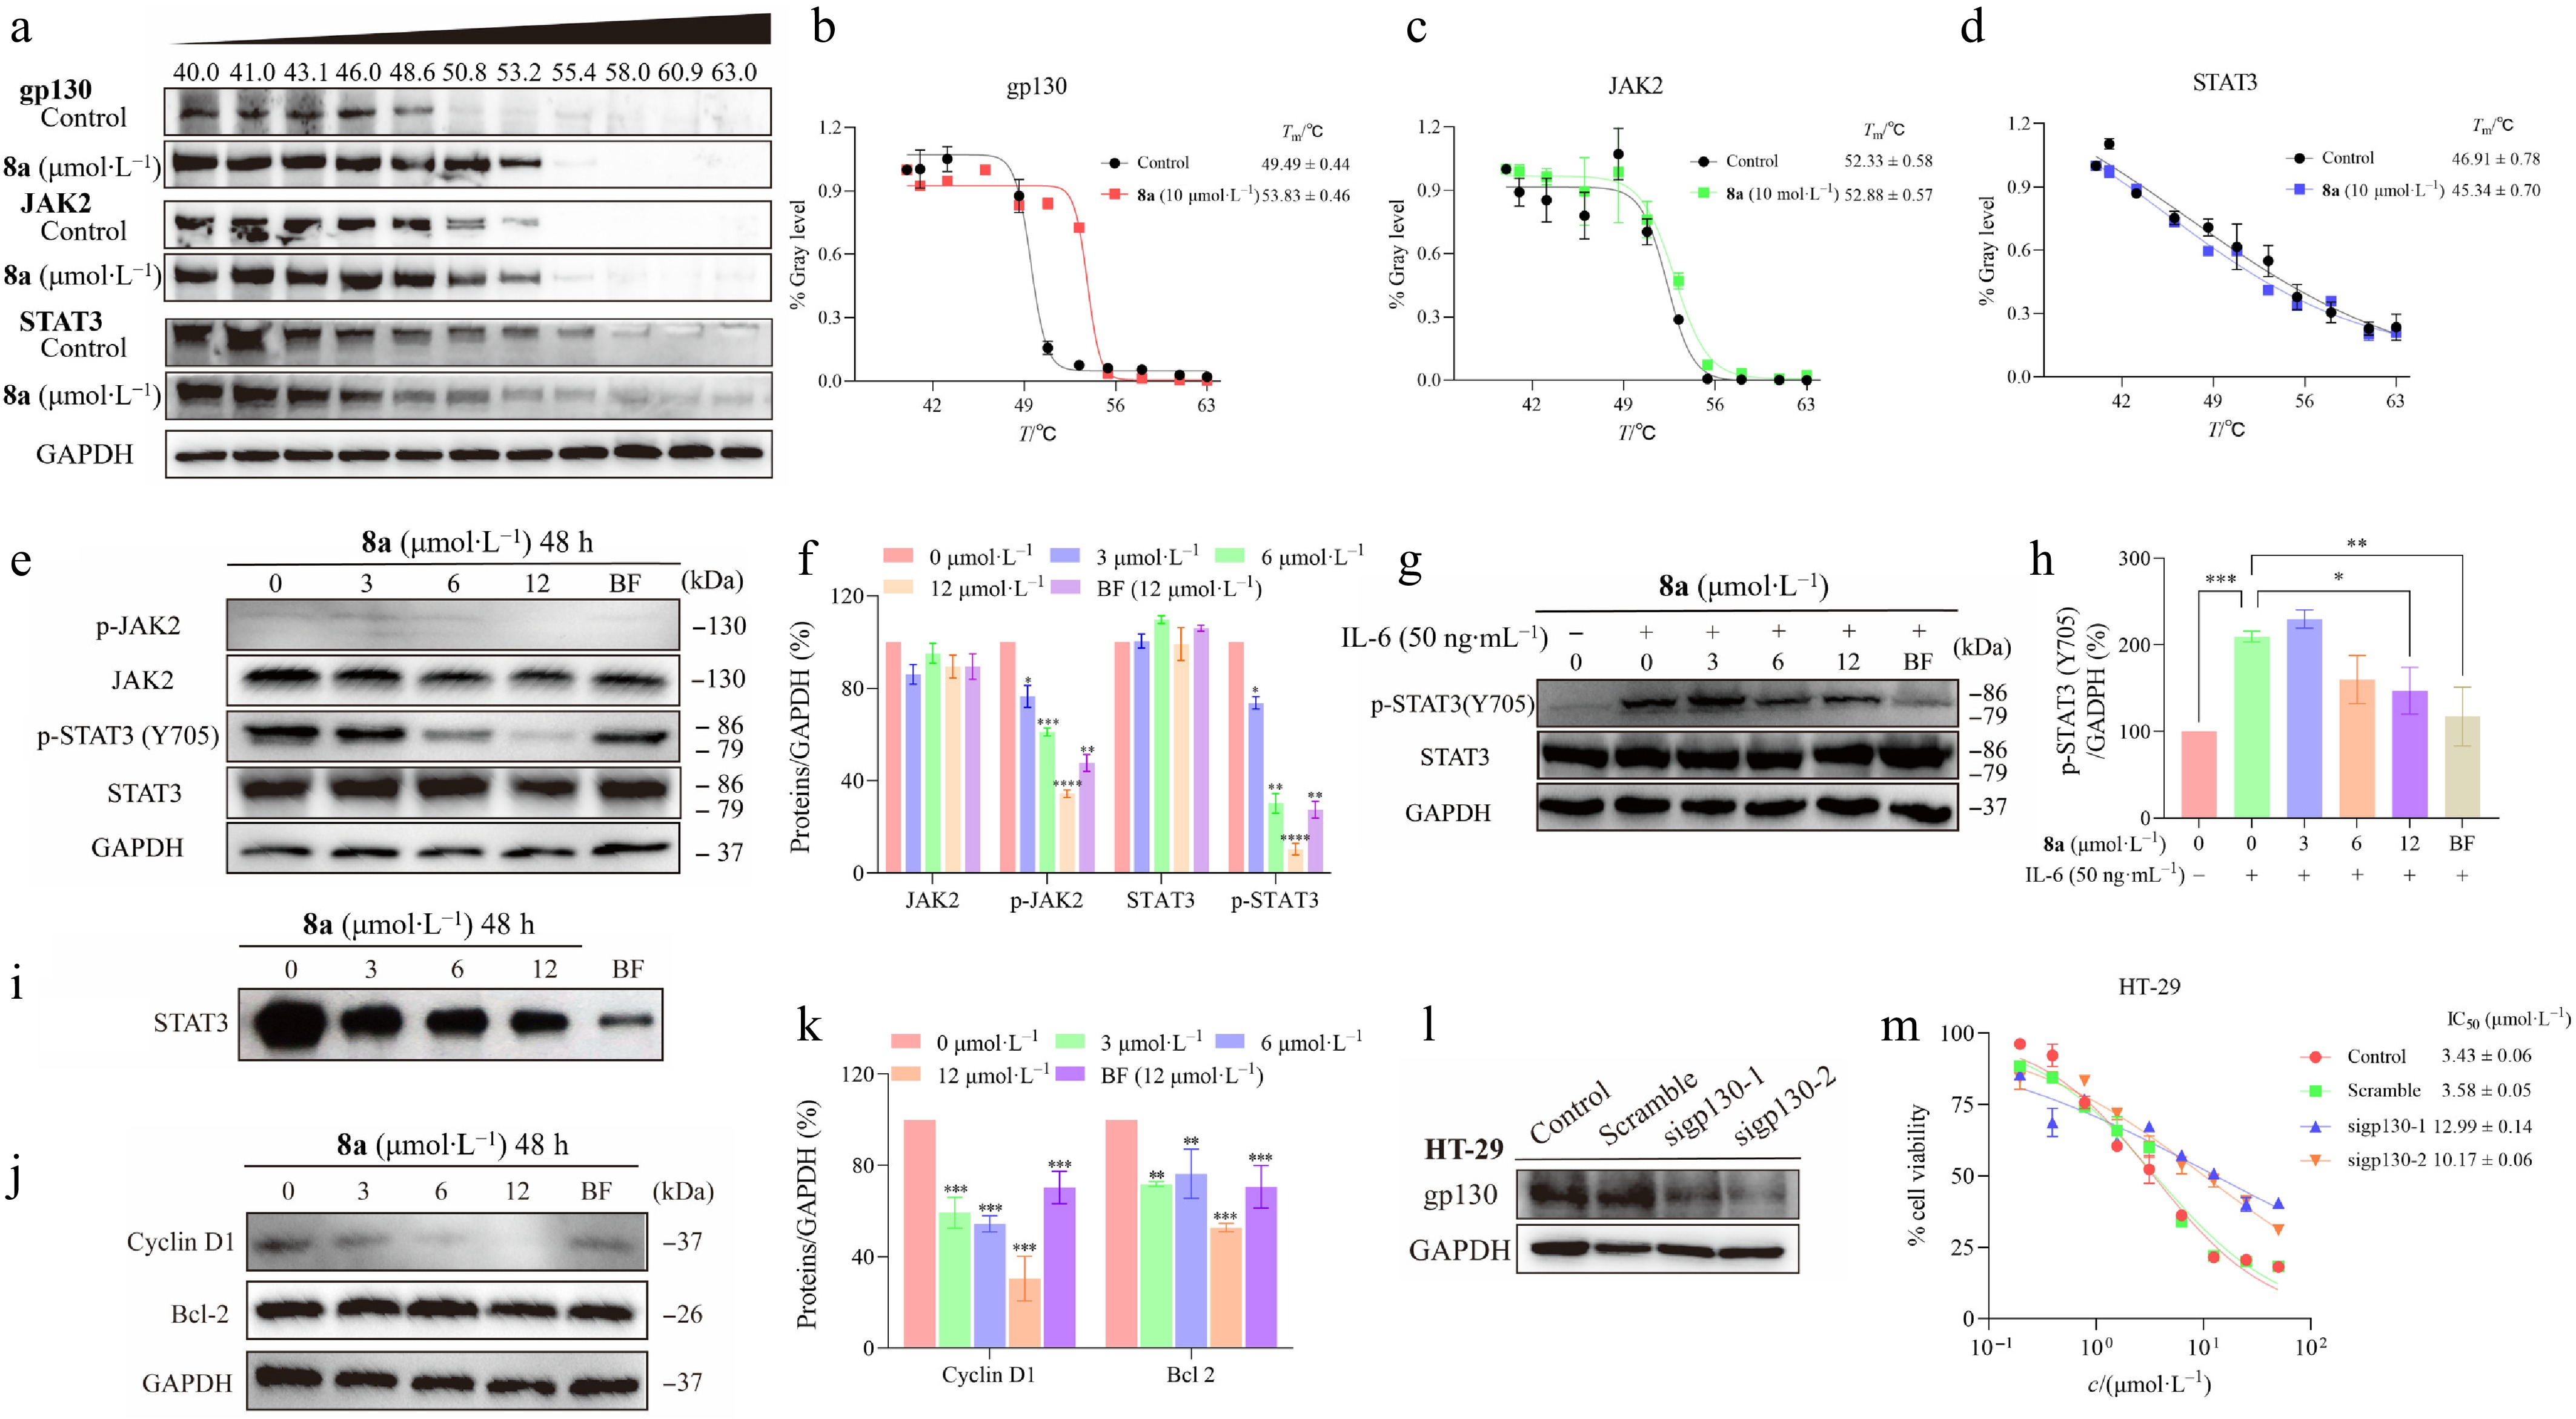
Figure 4.
Compound 8a downregulates the JAK2/STAT3 signaling pathway. (a) CETSA experiments were conducted to assess the impact of compound 8a on the thermal stability of key proteins in the gp130/JAK2/STAT3 signaling pathway, followed by analysis using Western blotting. (b) ImageJ was used to analyze the abundance of gp130 protein in HT-29 cells treated with 8a and heat treatment, and GraphPad was used to fit the Tm curve. The thermal denaturation temperature (Tm) of gp130 increased from 49.49 to 53.83 °C (ΔTm = +4.34 °C). (c) The Tm of JAK2 slightly increased from 52.33 to 52.88 °C (ΔTm = +0.55 °C). (d) The Tm of STAT3 decreased from 46.91 to 45.34 °C (ΔTm = −1.57 °C). HT-29 cells were treated with gradient concentrations of 8a for 48 h. Cell lysates were collected, and the expression levels of relevant proteins were analyzed via Western Blot. GAPDH was used as a control and quantified via ImageJ with a grayscale analysis system. (e), (f) Compound 8a or Bazedoxifene (BF) inhibited the phosphorylation of STAT3 and JAK2 in HT-29 cells. (g), (h) Compound 8a or Bazedoxifene (BF) inhibited the IL-6-induced phosphorylation of STAT3. (i) Compound 8a inhibited STAT3 activation. EMSA analysis of nuclear extracts of equal amounts of total protein containing activated STAT3 from HT-29 cells treated with compound 8a or Bazedoxifene (BF) for 48 h after incubation with an hSIE probe that binds to STAT3. (j), (k) Compound 8a or Bazedoxifene (BF) inhibited the expression of the Bcl-2 and Cyclin D1 downstream genes of STAT3. (l) siRNA was used to knock down gp130 protein in HT-29 cells, and Western blot analysis was performed to assess the expression level of gp130. (m) HT-29 cells with siRNA-mediated knockdown of gp130 were treated with compound 8a to test the change in tumor cell inhibitory activity. Data are presented as the mean ± SEM (n = 3). ** P < 0.01; *** P < 0.001.
-
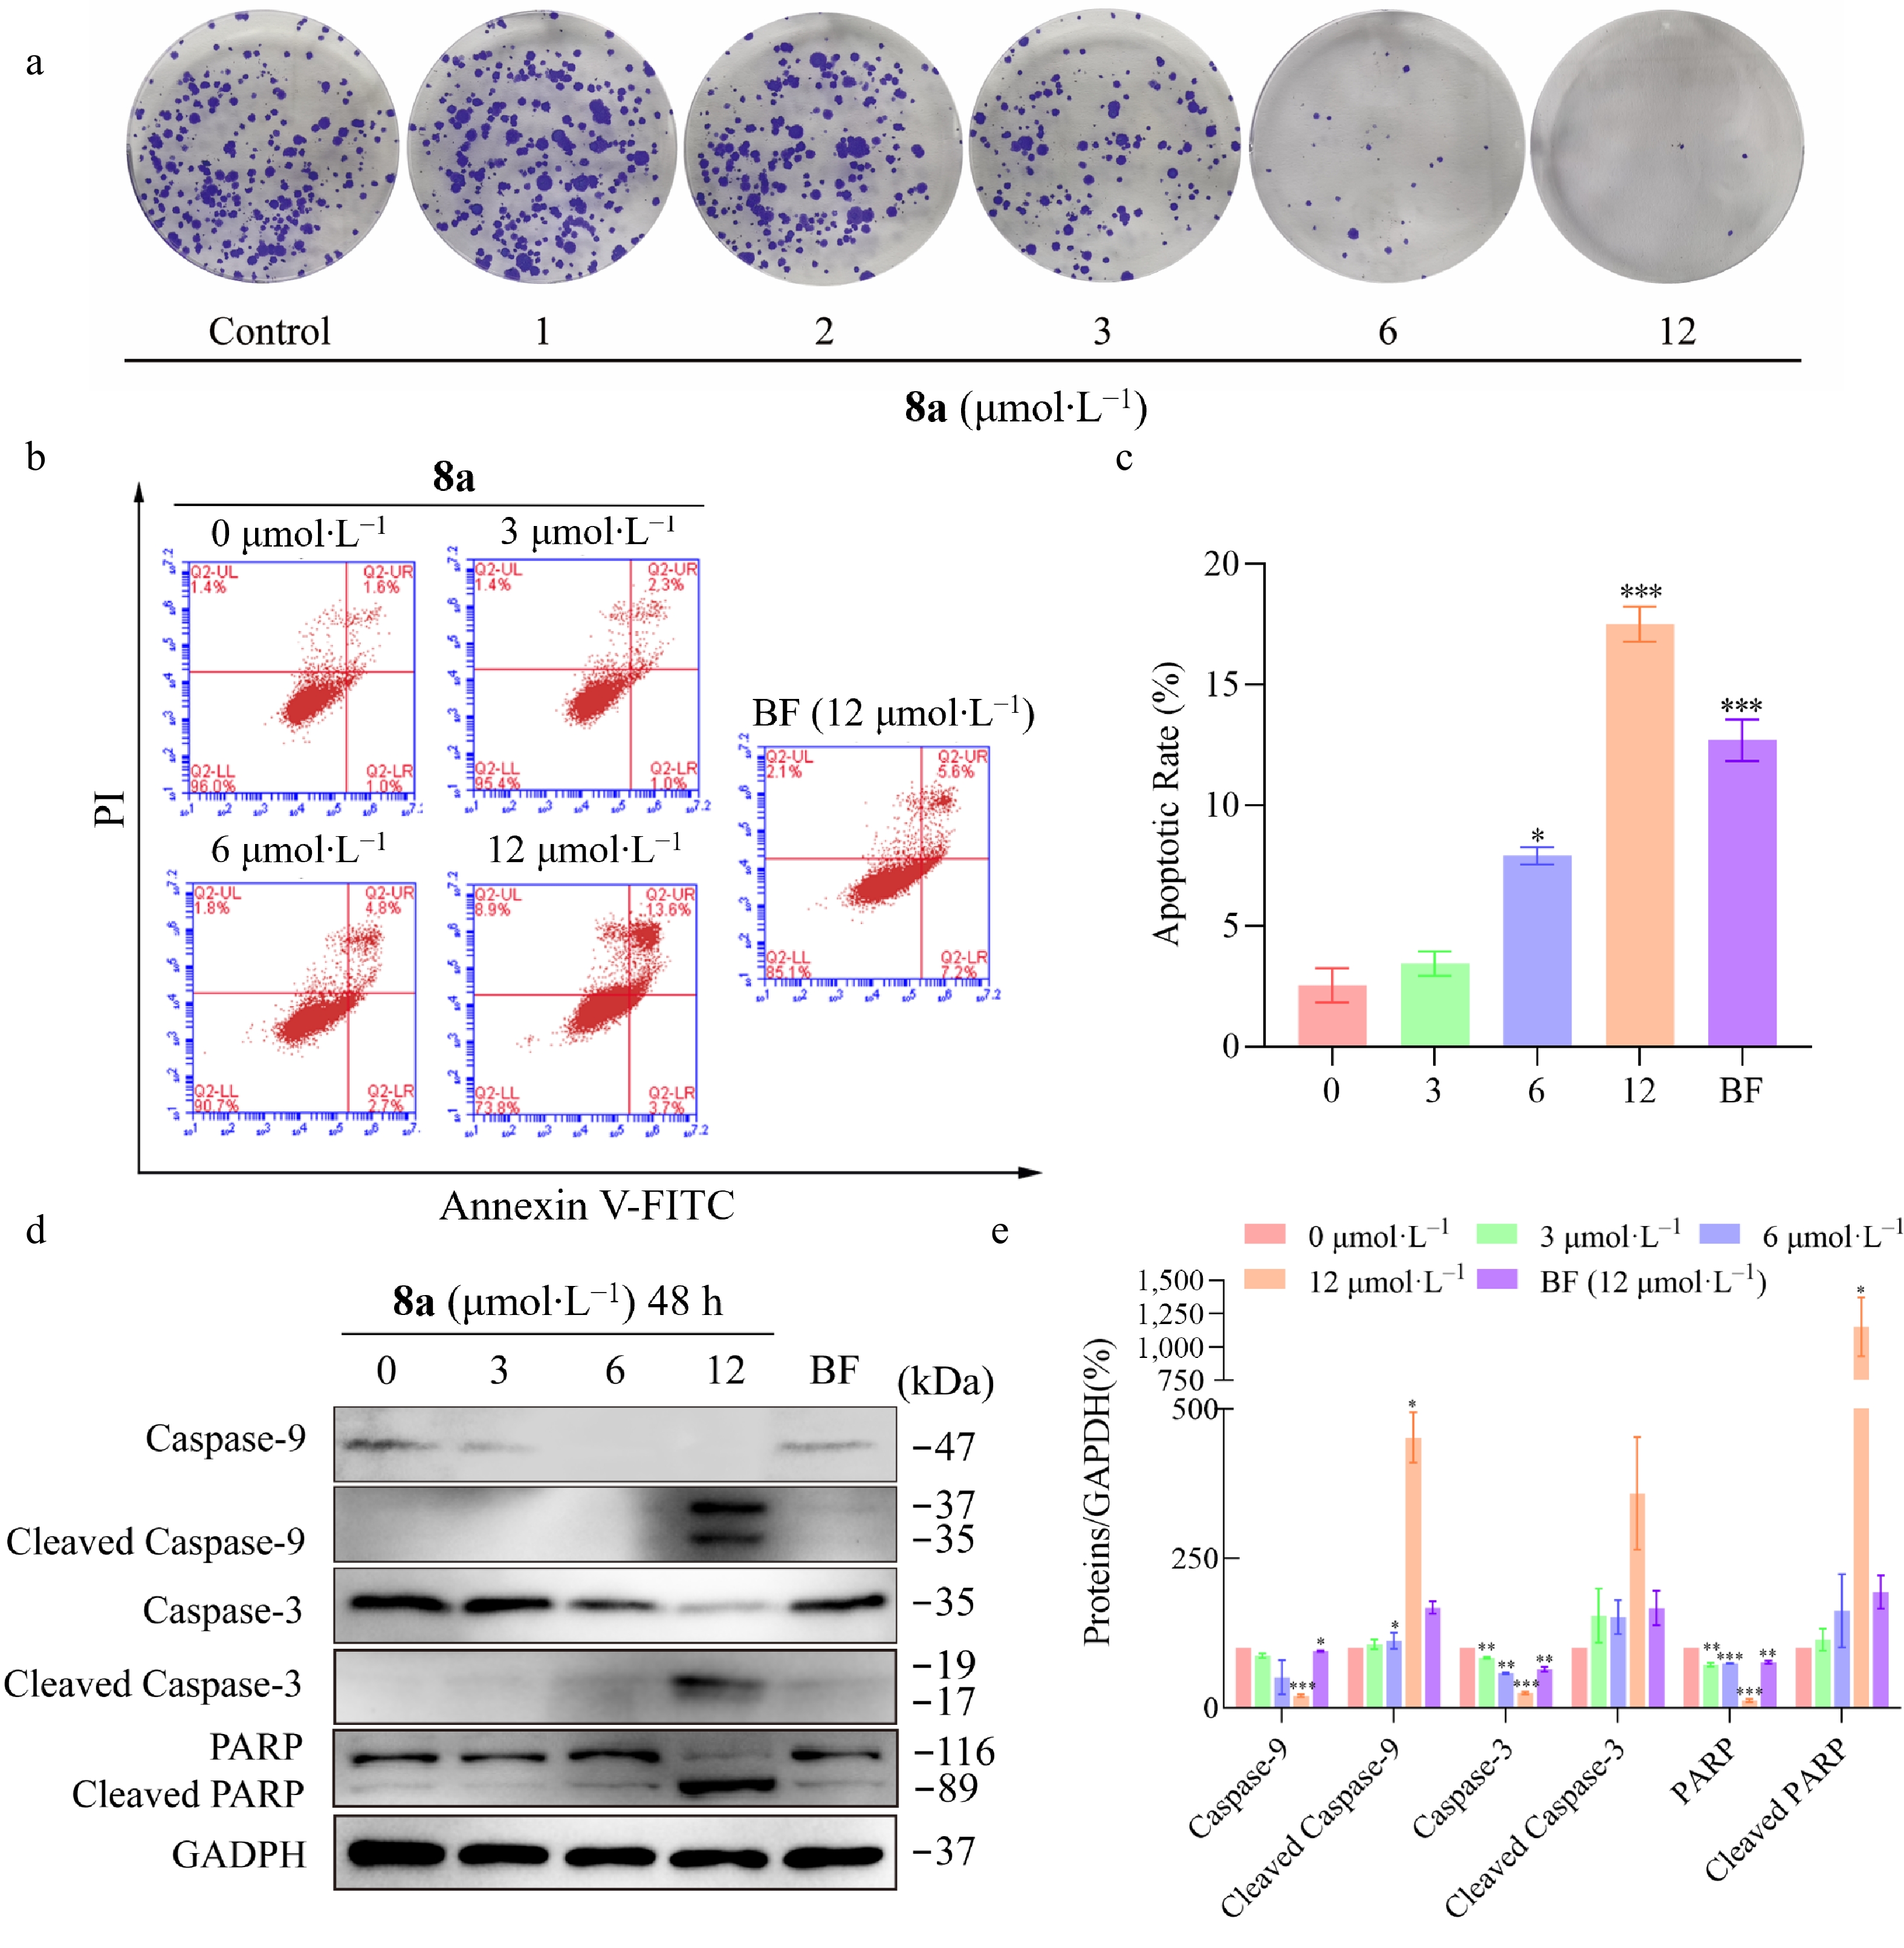
Figure 5.
Compound 8a inhibits HT-29 cell proliferation and induces apoptosis. HT-29 cells were treated with compound 8a or BF at the tested concentrations for 48 h. (a) Compound 8a inhibited the proliferation of HT-29 cells in vitro. (b) Apoptotic effects were detected via Annexin V-FITC/PI staining and flow cytometry. (c) Histograms of the percentage of apoptotic cells (early and late stages of apoptosis). (d) Effects of compound 8a or BF on the protein levels of Caspase-9, Cleaved Caspase-9, Caspase-3, Cleaved Caspase-3, PARP, and Cleaved PARP. The cell lysates were harvested and analyzed via Western blot with the corresponding antibodies. (e) Quantitative analysis of the western blot results via the Image Lab program, with GAPDH serving as the internal control. Data are presented as the mean ± SEM (n = 3). ** P < 0.01 *** P < 0.001.
-
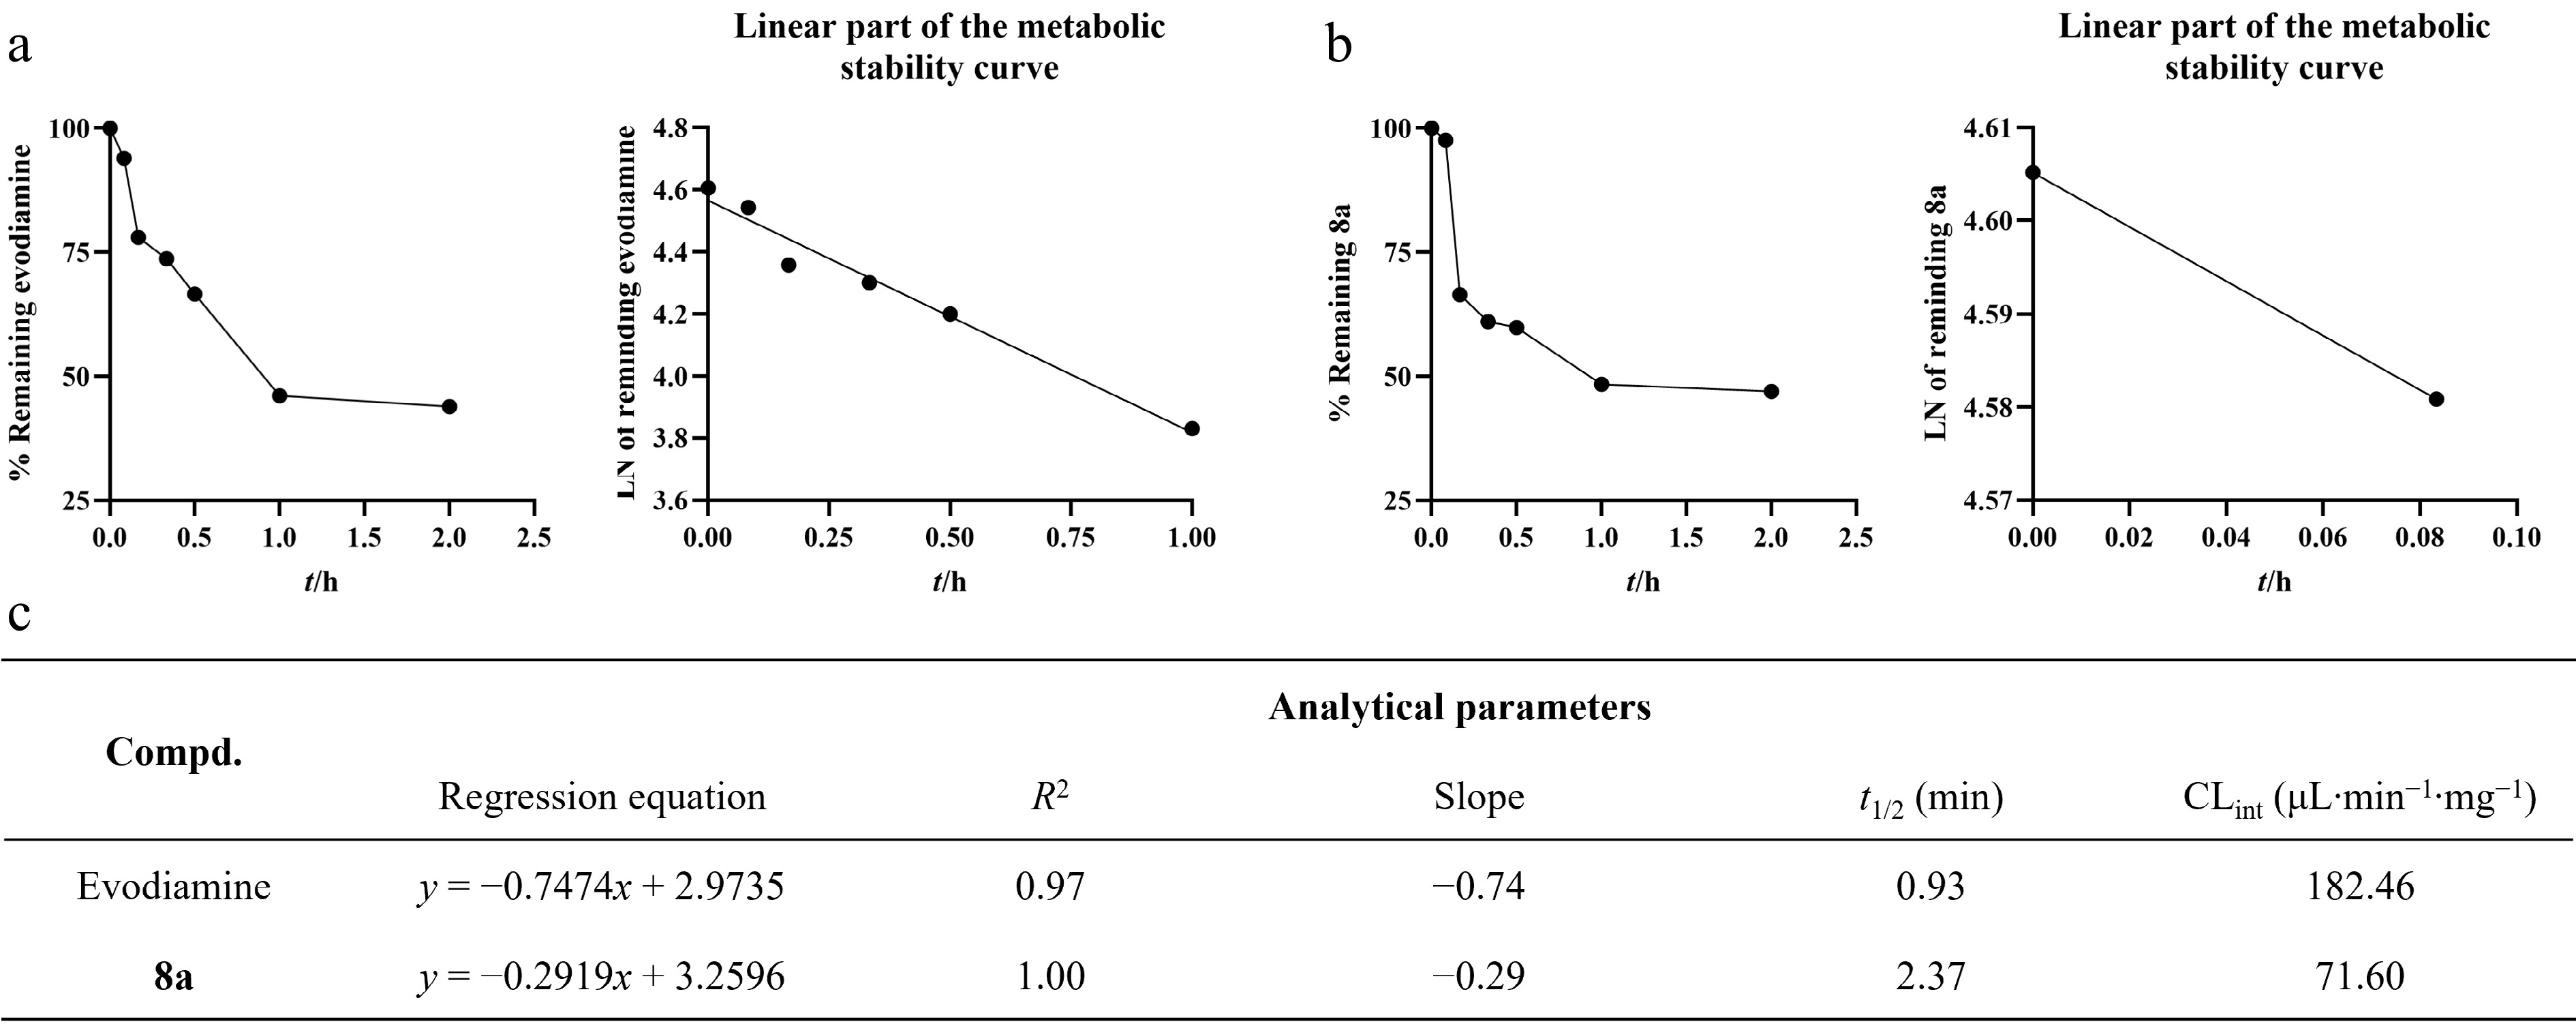
Figure 6.
Metabolic stability of evodiamine and 8a in rat liver microsomes (RLM). (a) The metabolic stability curve of evodiamine in RLM within 2 h and the regression equation of the linear part of the curve. (b) The metabolic stability curve of 8a in RLM within 2 h and the regression equation of the linear part of the curve. (c) Key parameters for the metabolic stability of evodiamine and 8a.
-
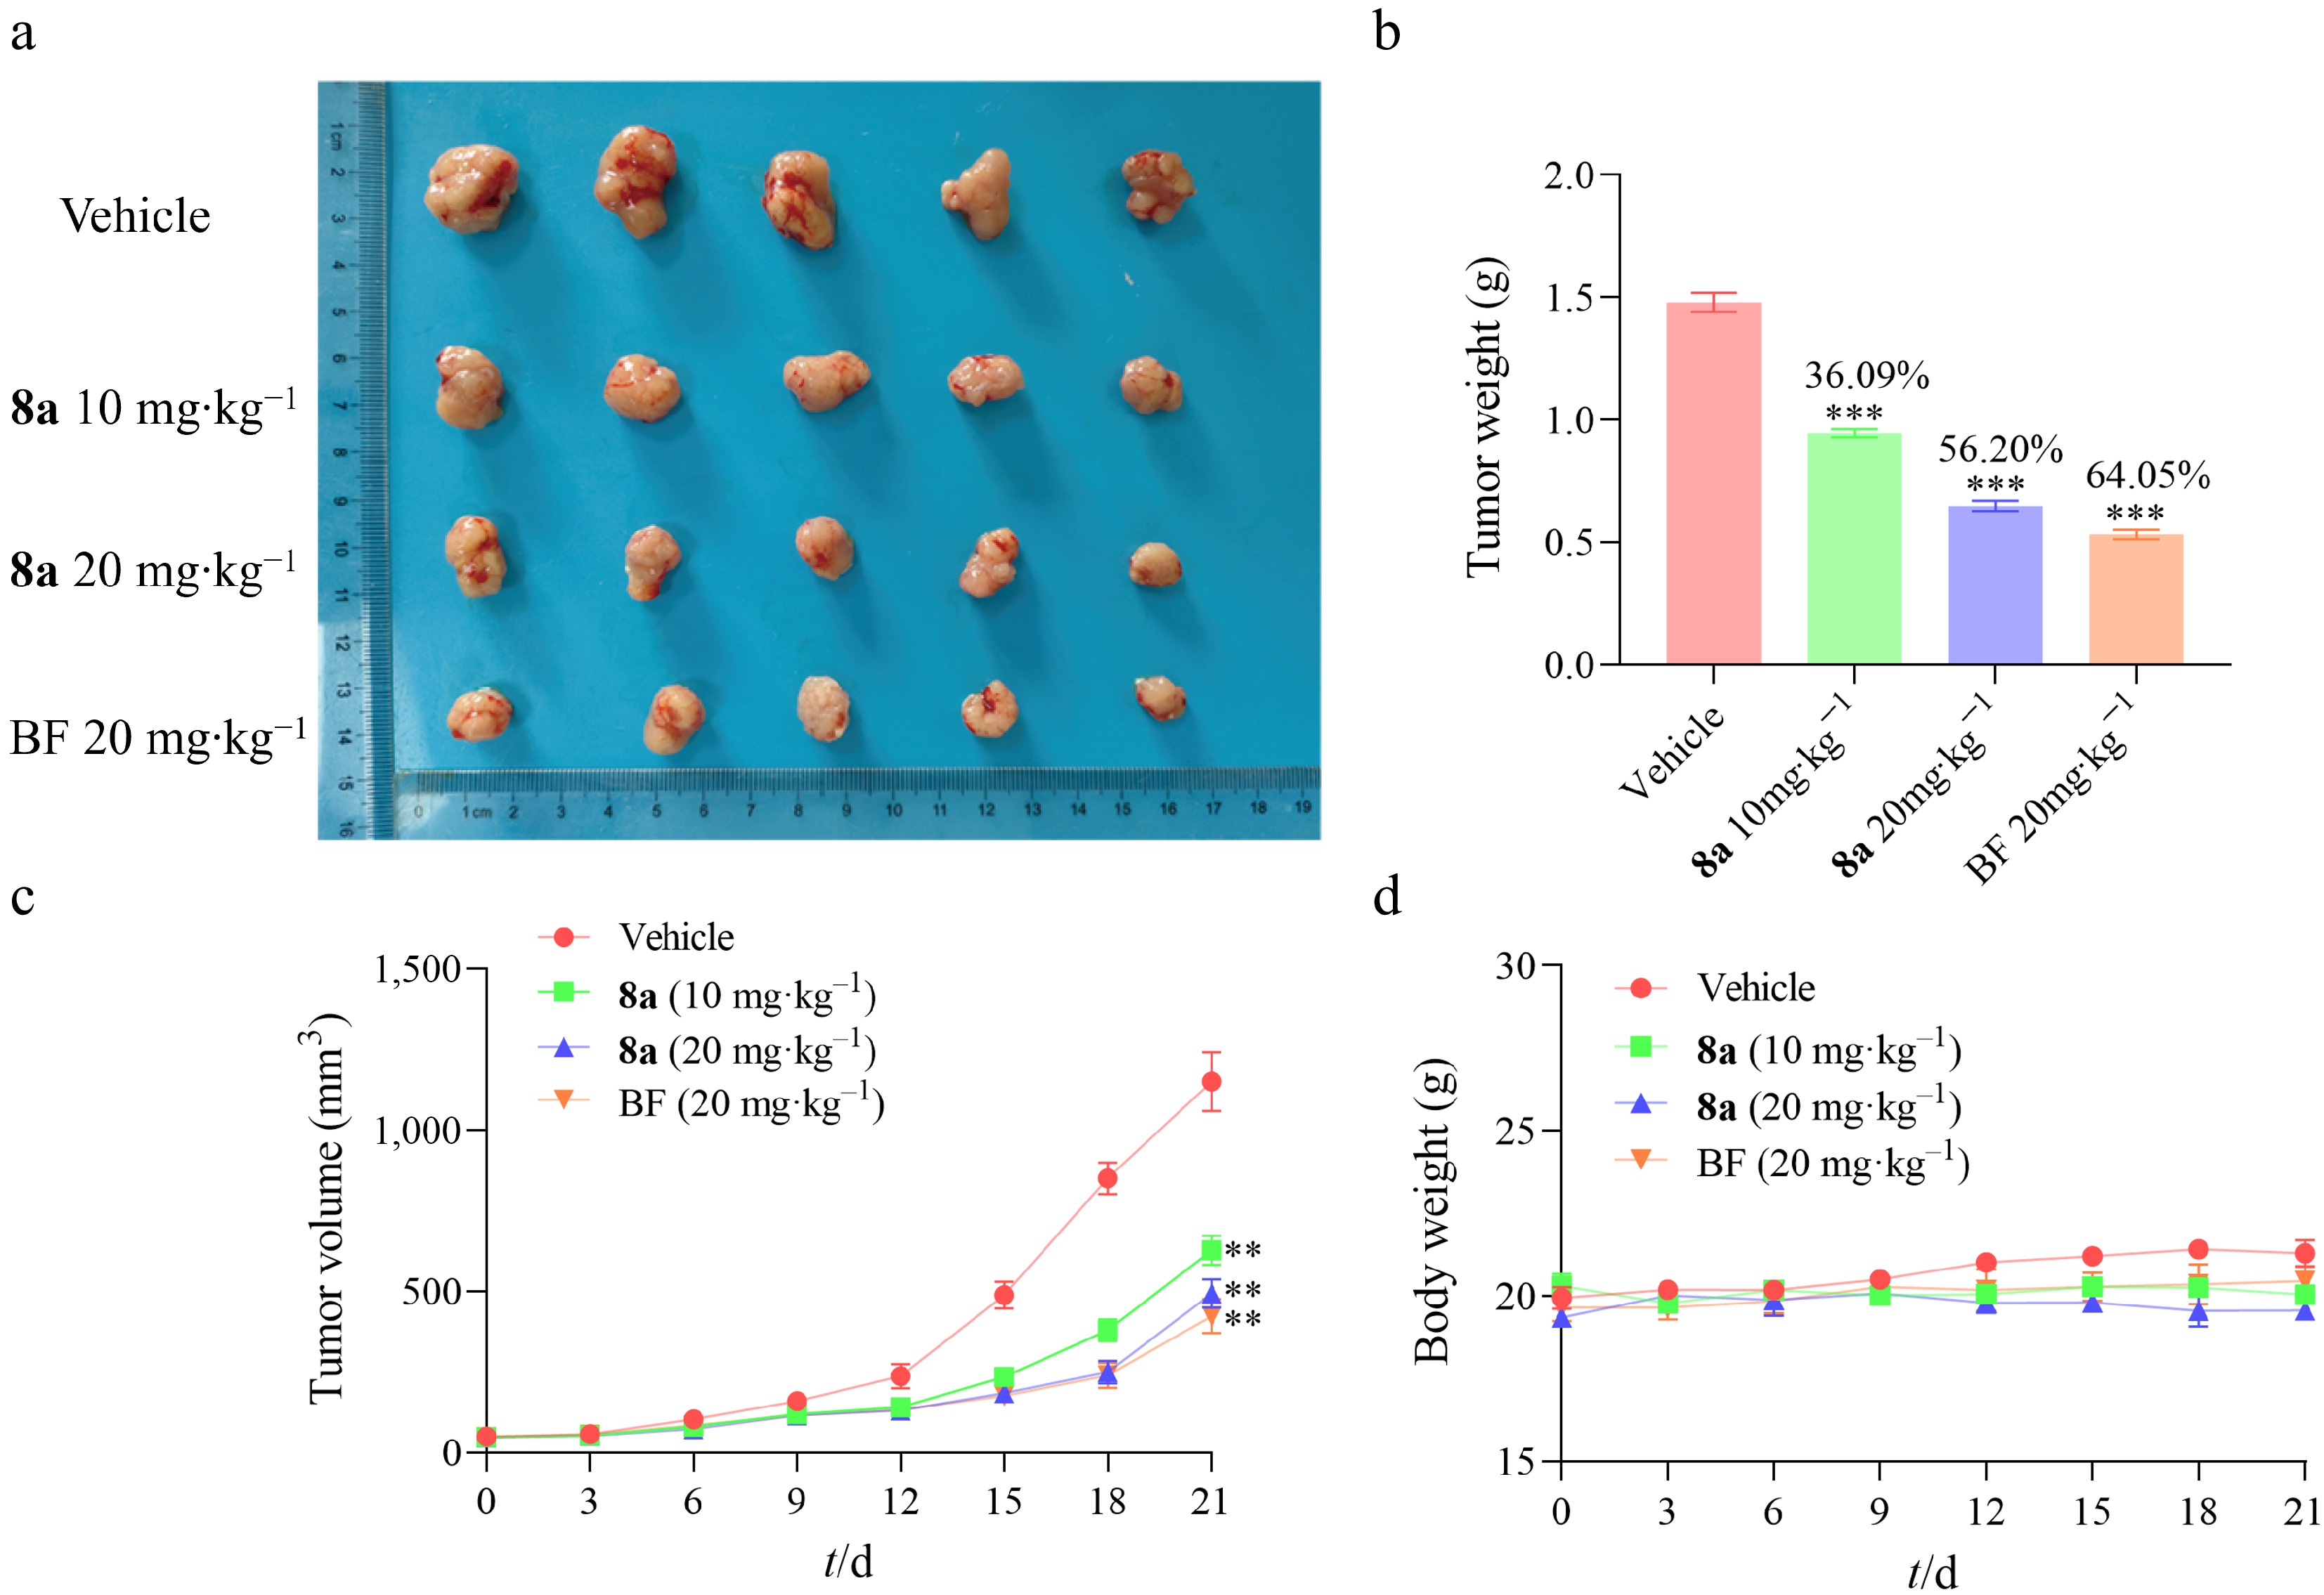
Figure 7.
Compound 8a inhibited the development of HT-29 xenograft tumors in vivo (n = 5). (a) The anatomical diagram of tumors in the experimental group of mice. (b) The comparison of tumor weights in the experimental group of mice was used for the calculation of tumor inhibition rate. (c) Growth curves of mouse tumor volume. (d) Growth curves of mouse body weights. Data are presented as the mean ± SEM (n = 3). ** P < 0.01, *** P < 0.001.
-

Compd. R1 R2 IC50a (μmol·L−1) Compd. R1 R2 IC50a (μmol·L−1) 4a 

17.01 ± 0.89 7a 

9.39 ± 0.71 4b 

10.58 ± 1.06 7b 

9.67 ± 0.17 4c 

32.88 ± 1.55 7c 

> 60 4d 

16.72 ± 0.88 7d 

14.37 ± 1.21 5a 

15.15 ± 1.29 8a 

4.57 ± 0.16 5b 

15.70 ± 1.24 8b 

6.57 ± 0.91 5c 

13.68 ± 0.42 8c 

28.35 ± 1.47 5d 

17.73 ± 1.31 8d 

6.58 ± 1.21 6a 

6.18 ± 0.83 8e 

> 60 6b 

5.77 ± 0.79 8f 

> 60 6c 

17.57 ± 0.63 8g 

> 60 6d 

7.55 ± 0.92 BFb / / 10.03 ± 1.02 a IC50: 50% inhibitory concentration (mean ± SD of three experiments). b Bazedoxifene, used as positive control. Table 1.
Antiproliferative activity of compounds 4a−9d in HT-29 cells (48 h).
Figures
(7)
Tables
(1)