-
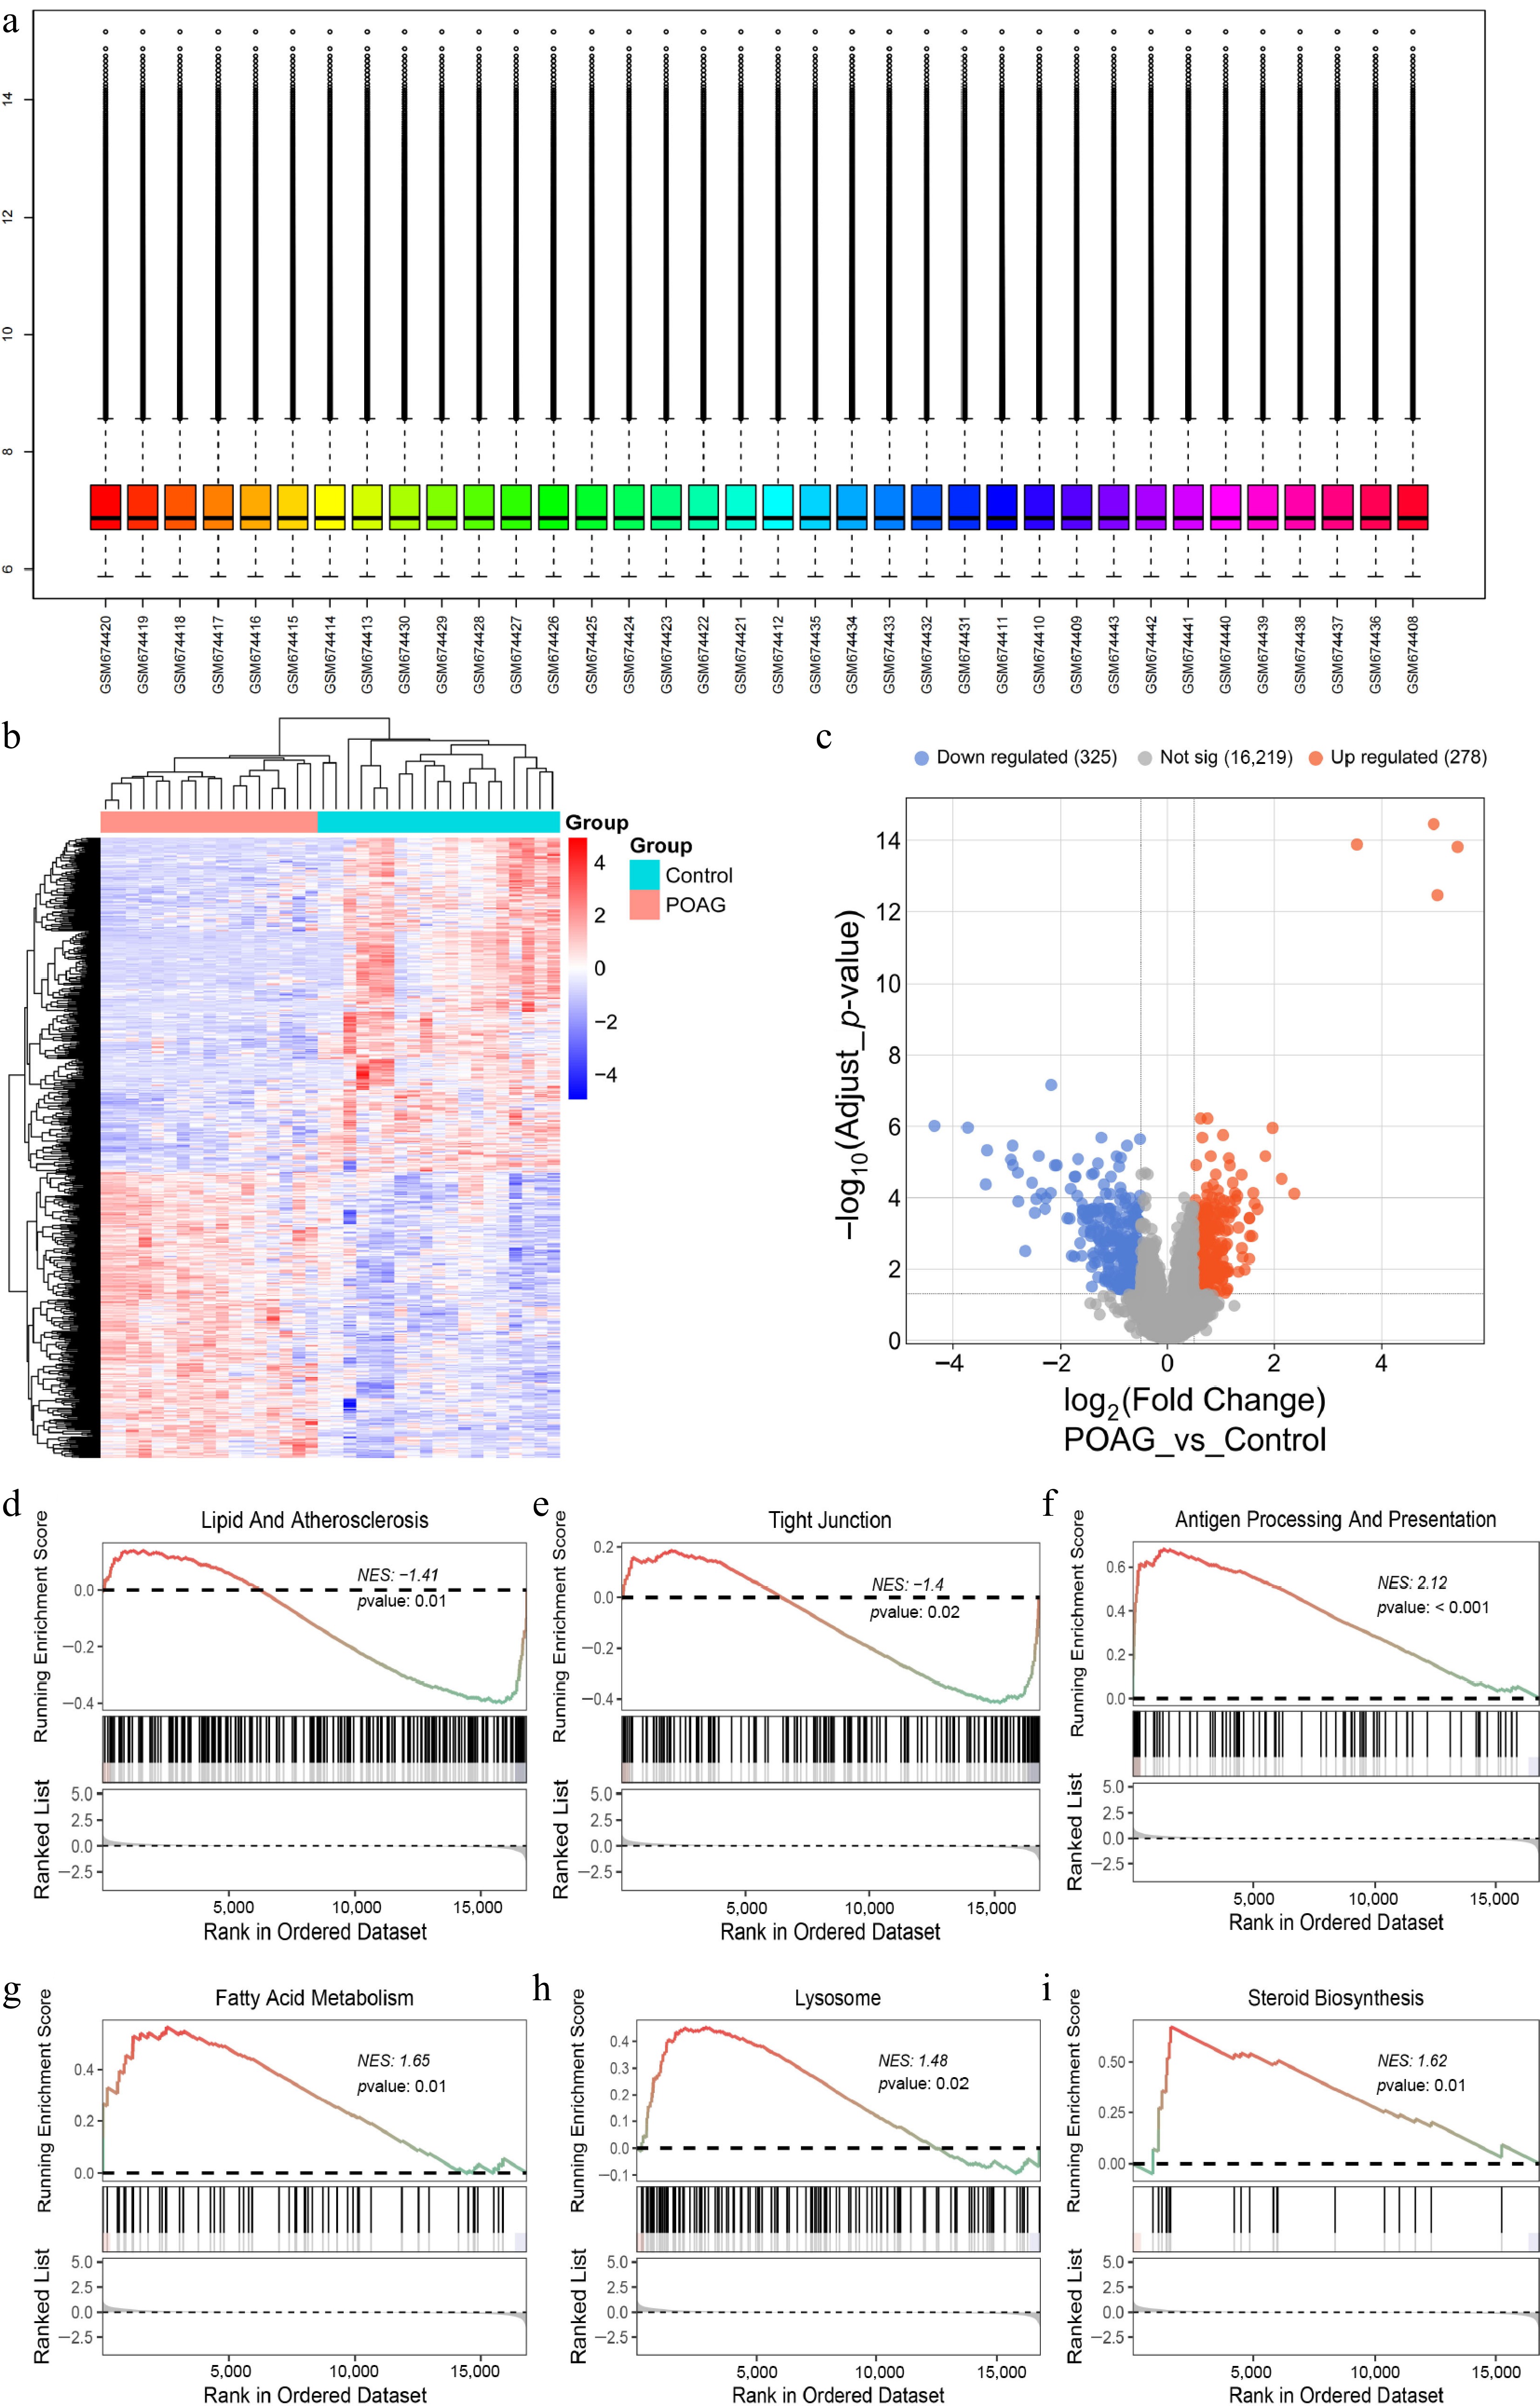
Figure 1.
Screening DEGs in POAG and GSEA analysis. (a) The GSE27276 dataset was normalized using the 'normalizeBetweenArrays' function in R. (b) Heatmap illustrates the 603 DEGs between the POAG group, and the control group (325 downregulated; 278 upregulated, |log2FC| > 0.5, p < 0.05). (c) Volcano plot illustrates the 603 DEGs by comparing the POAG group with the control group (325 downregulated; 278 upregulated, |log2FC| > 0.5, p < 0.05). GSEA of POAG-DEGs mapping to GO pathway, (d) Lipid and atherosclerosis, (e) tight junction, (f) antigen processing and presentation, (g) fatty acid metabolism, (h) lysosome, (i) steroid biosynthesis.
-
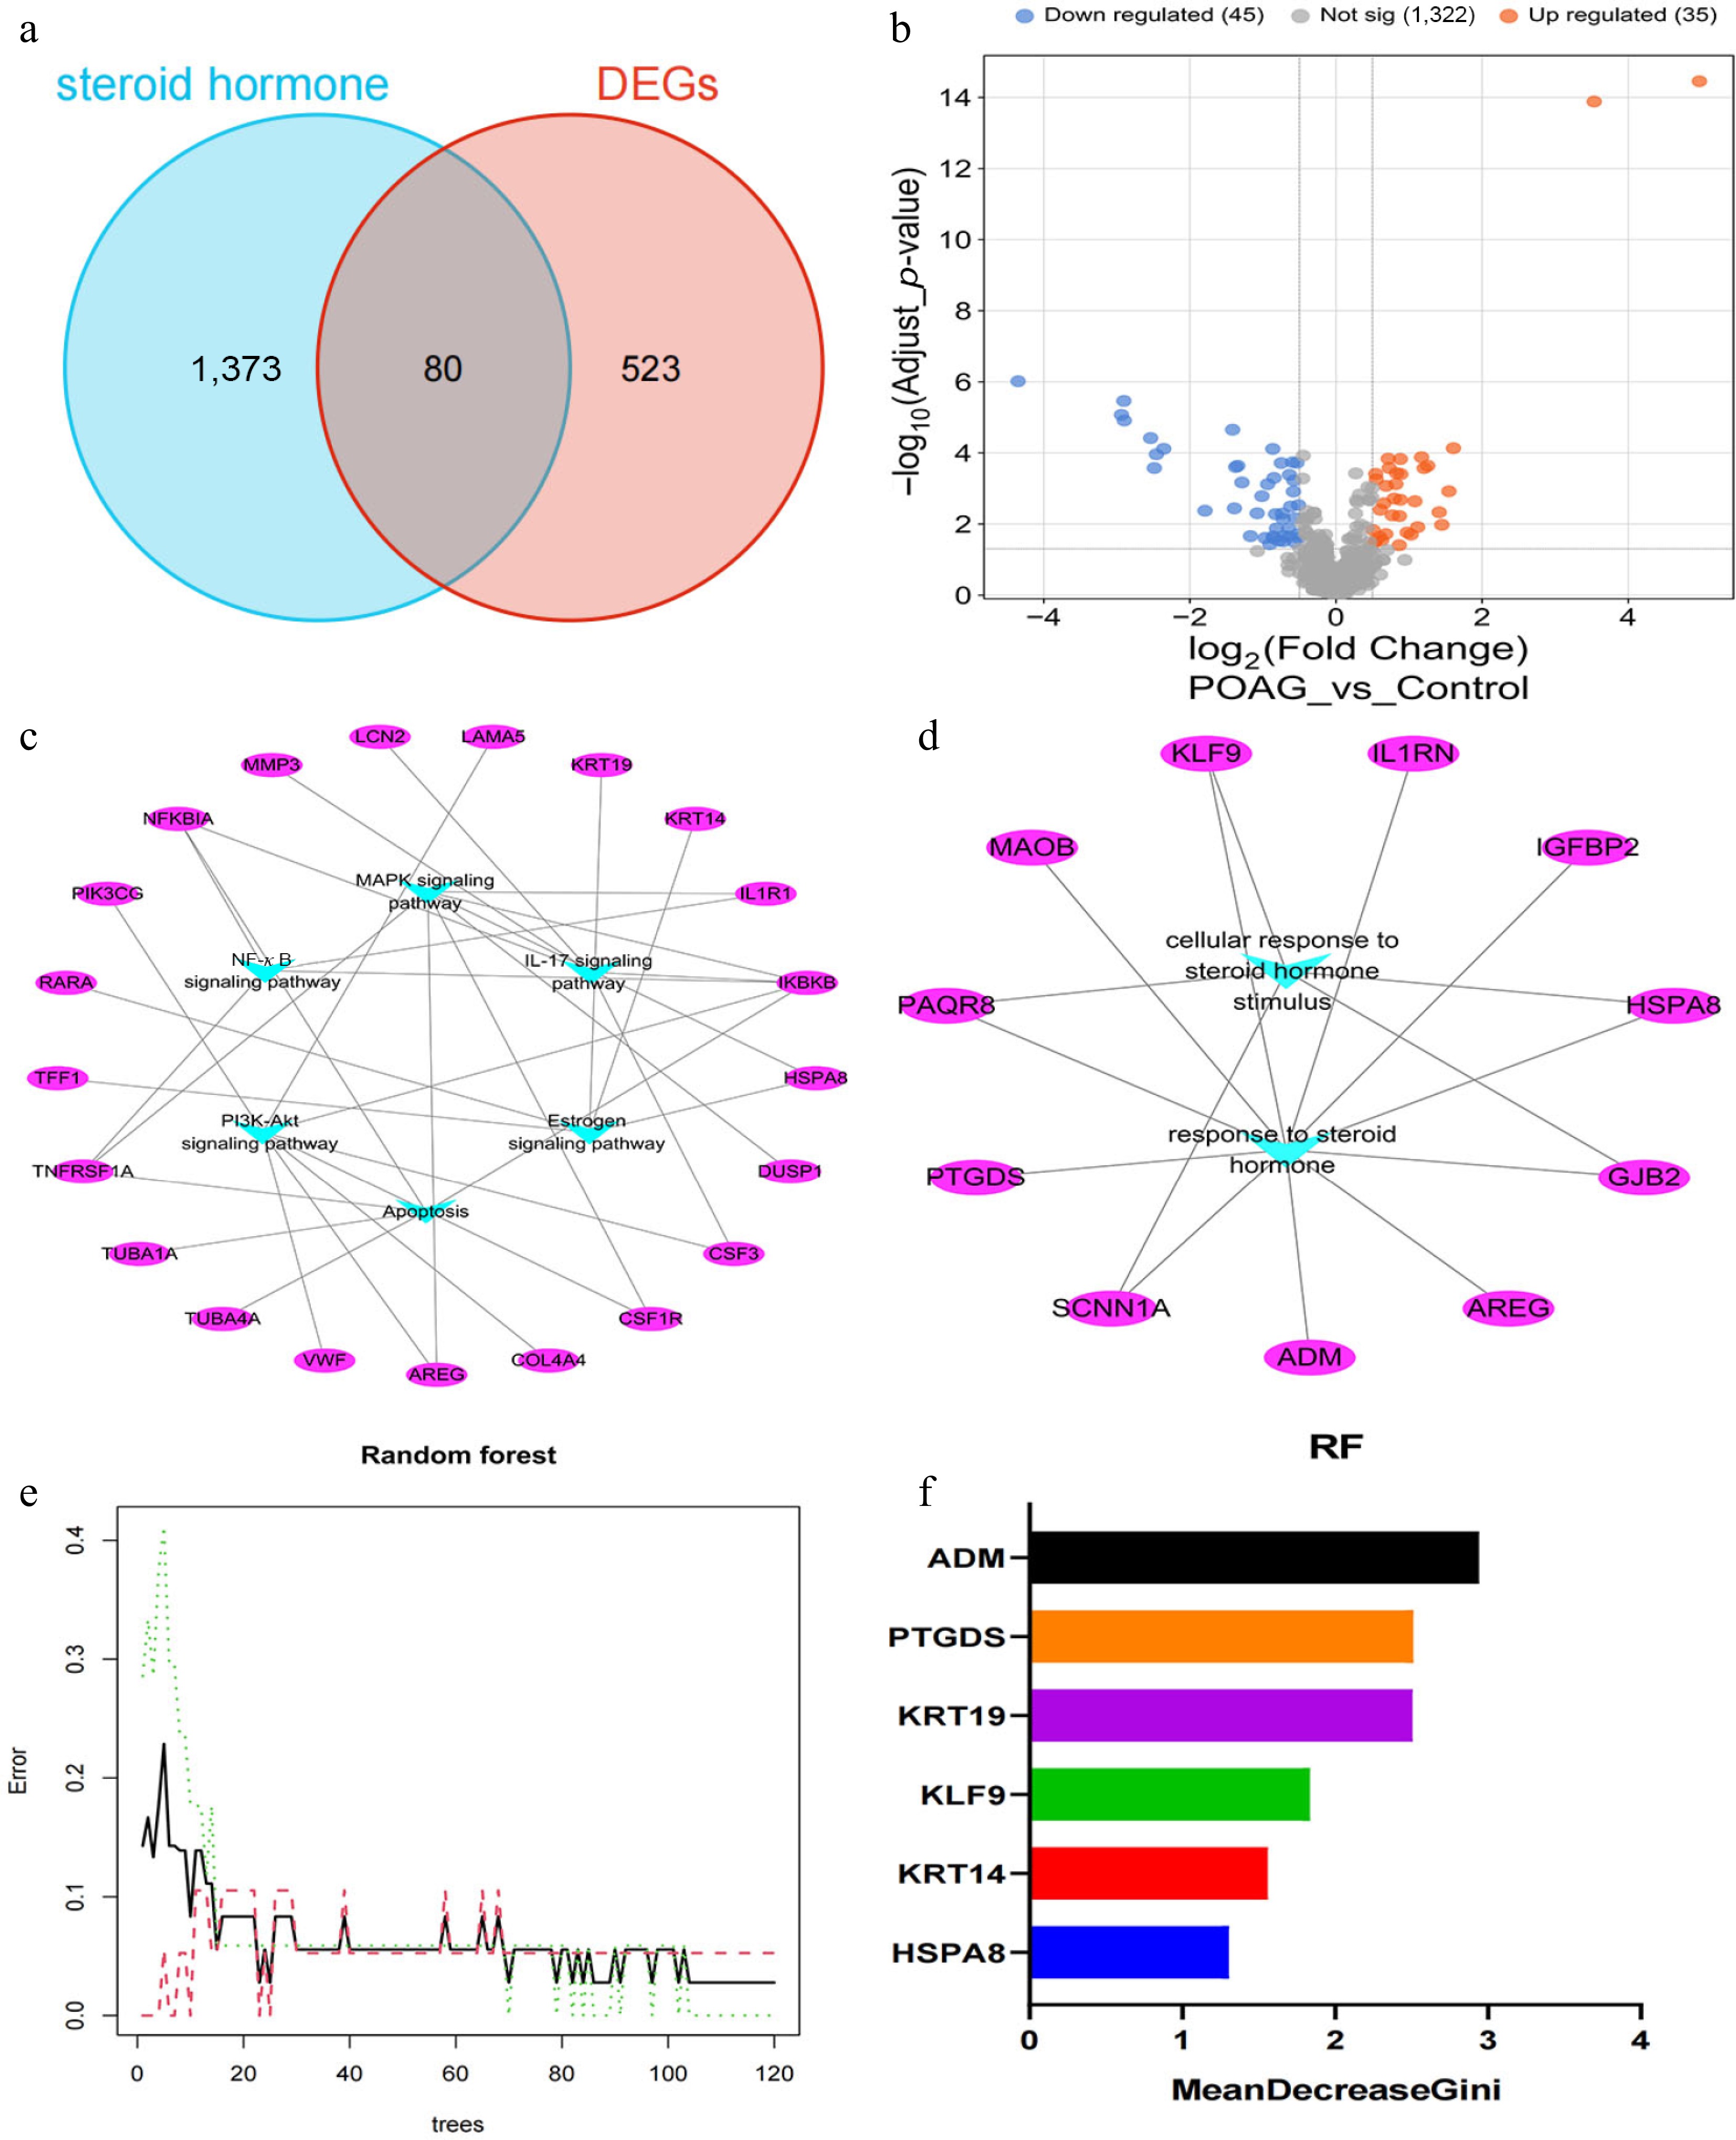
Figure 2.
Identification of SH-related DEGs in POAG. (a) Venn diagram illustrates the intersection of DEGs in POAG and SH-regulated genes. (b) Volcano plot illustrates the SH-related DEGs in POAG (45 downregulated; 35 upregulated). (c) KEGG pathway analysis exhibited that the top six enriched signaling pathways of 80 SH-related DEGs include MAPK, NF-κB, IL-17, PI3K-Akt, apoptosis, and estrogen signaling pathways, with the 21 key genes embedded within these pathways (Supplementary Table S2). (d) GO analysis demonstrated that IGFBP2, ADM, IL1RN, PAQR8, HSPA8, AREG, PTGDS, SCNN1A, GJB2, MAOB, and KLF9 were enriched in the category of response to SHs (Supplementary Table S3). (e) Error plot for random forest model as a function of the number of trees. The black line represents the out-of-bag error, the green dashed line represents the training error, and the red dashed line represents the test error. (f) The bar chart of the MeanDecreaseGini parameters of HSPA8, KRT14, KLF9, KRT19, PTGDS, and ADM.
-
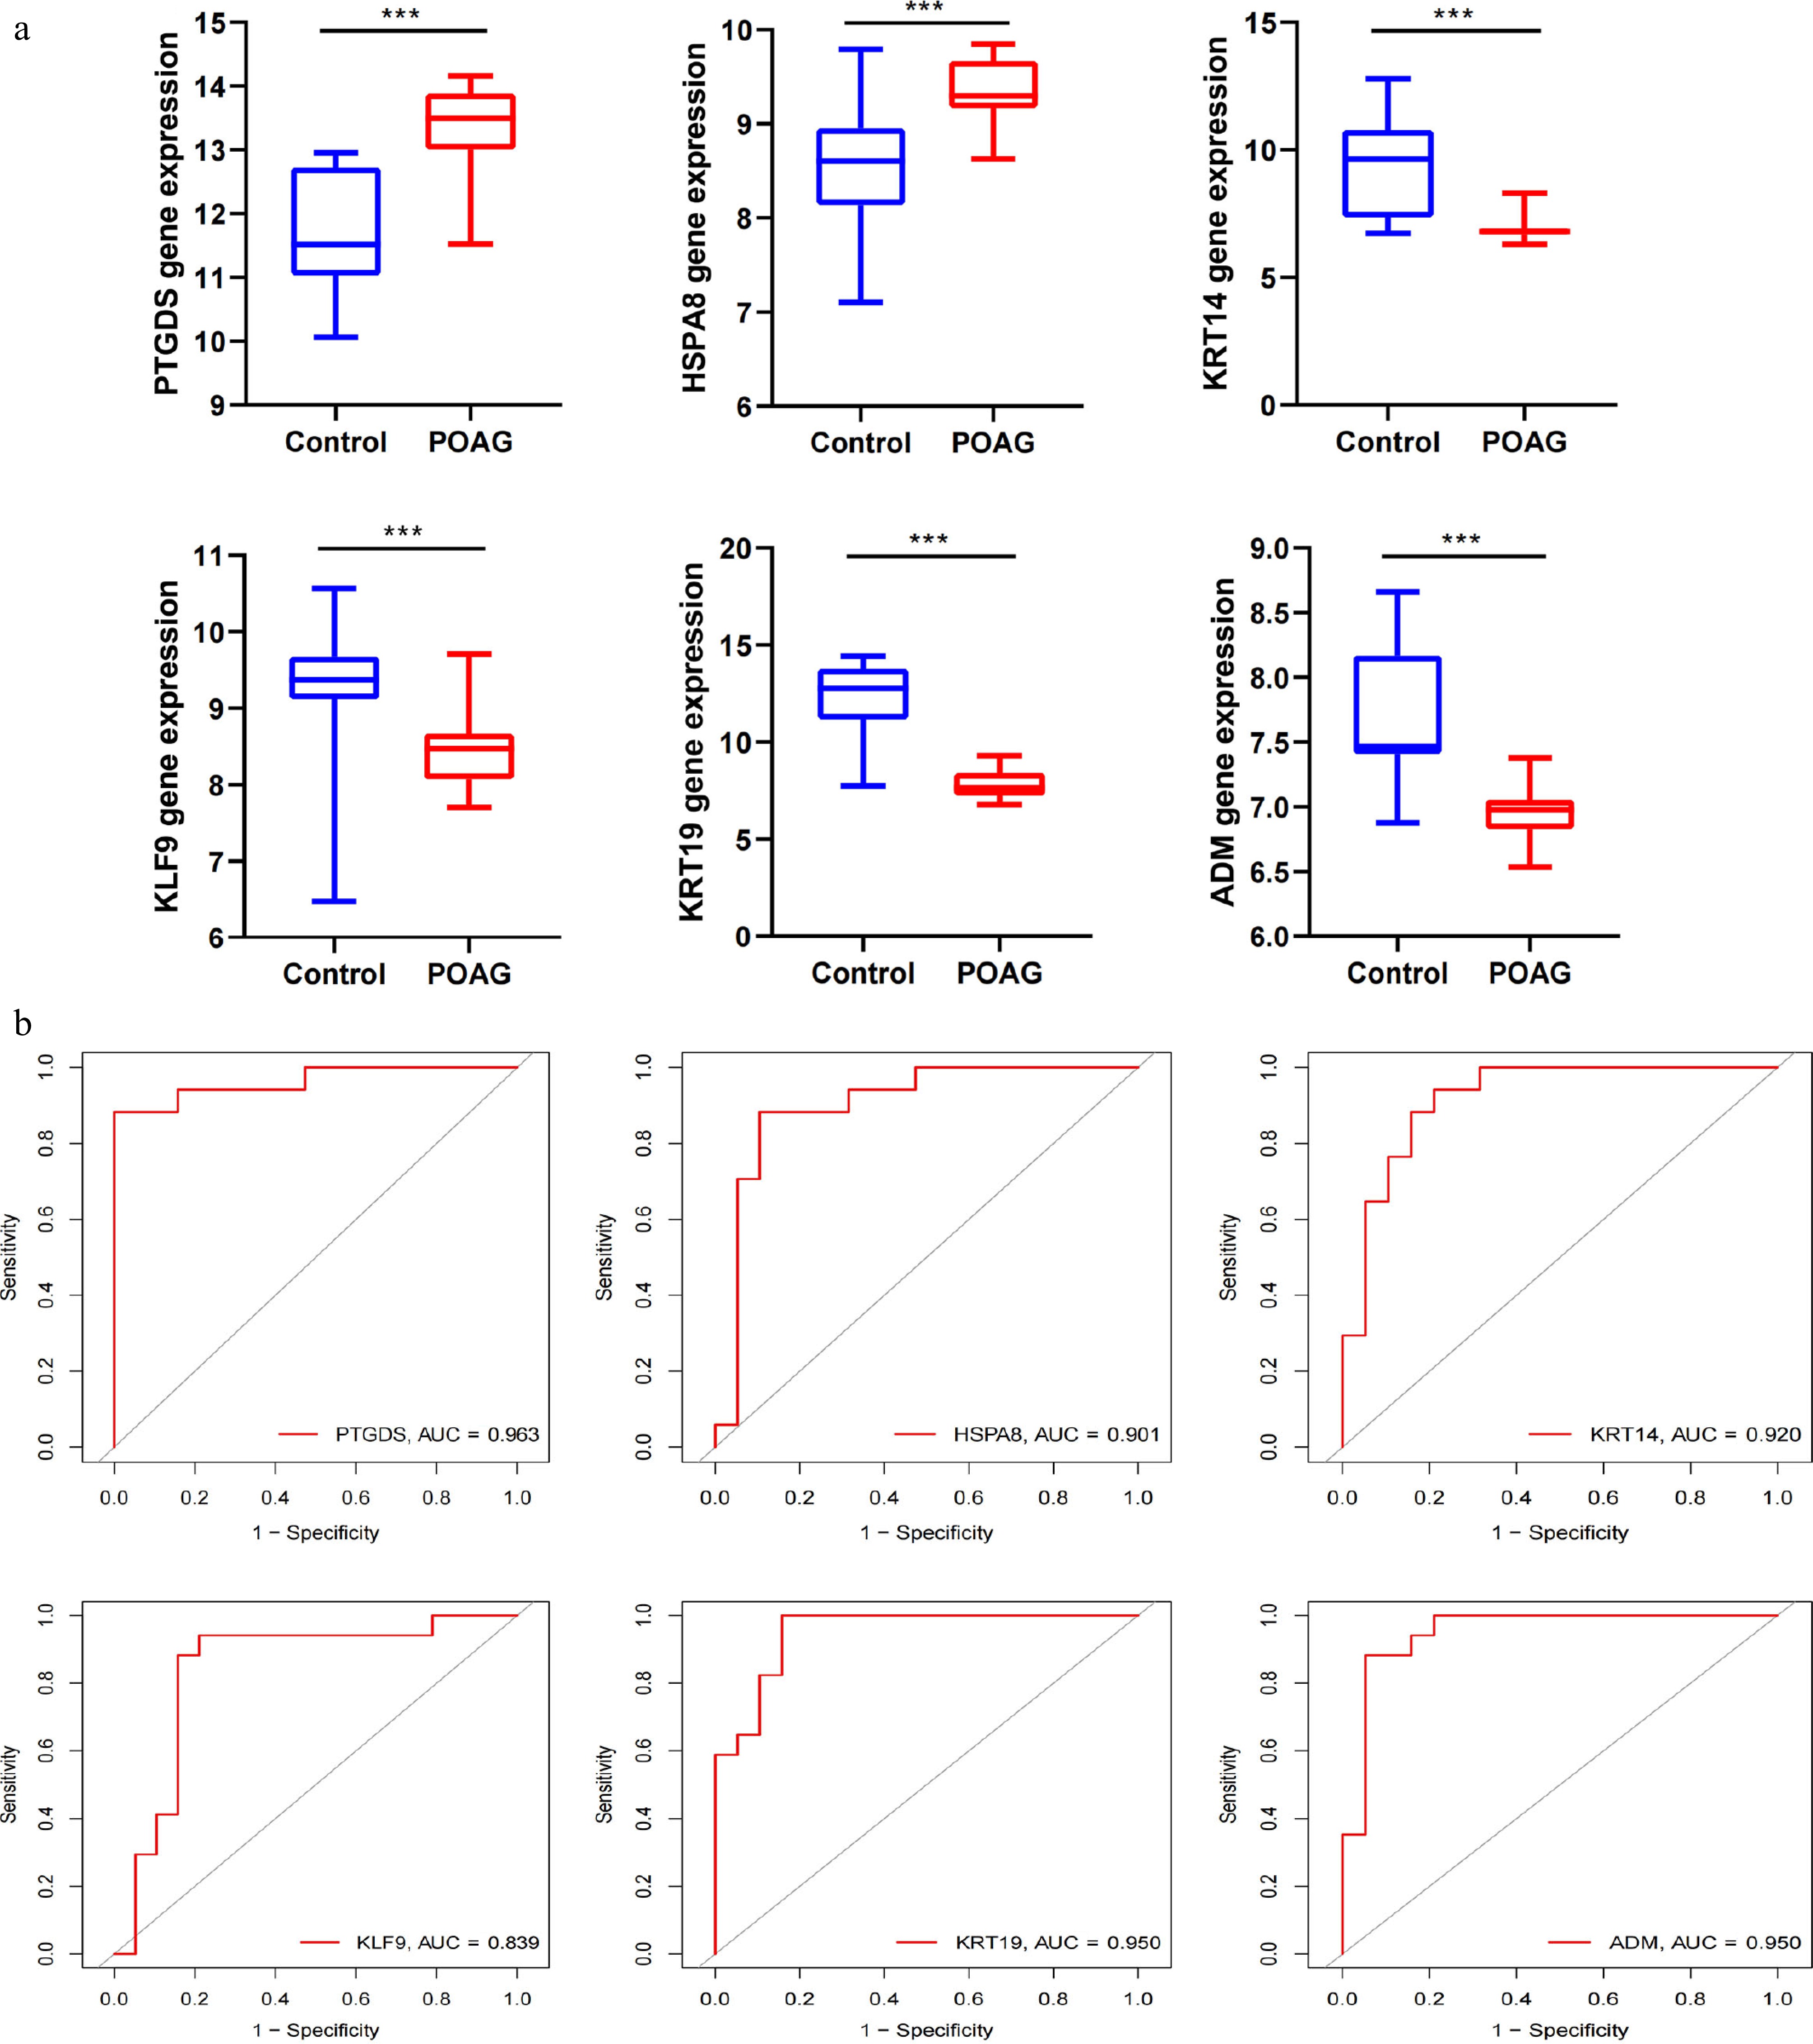
Figure 3.
ROC and pathway analysis in SH-related Hub Genes. (a) Relative expression of PTGDS, HSPA8, KRT14, KLF9, KRT19, and ADM in POAG and control samples in GSE27276 dataset. All p-values are less than 0.001. (b) ROC curve analysis was performed using the R package 'pROC' to estimate the sensitivity and specificity of the identified genes for the diagnosis of POAG (PTGDS: 0.963; HSPA8: 0.901; KTR14: 0.920; KLF9: 0.839; KTR19: 0.950; ADM: 0.950).
-
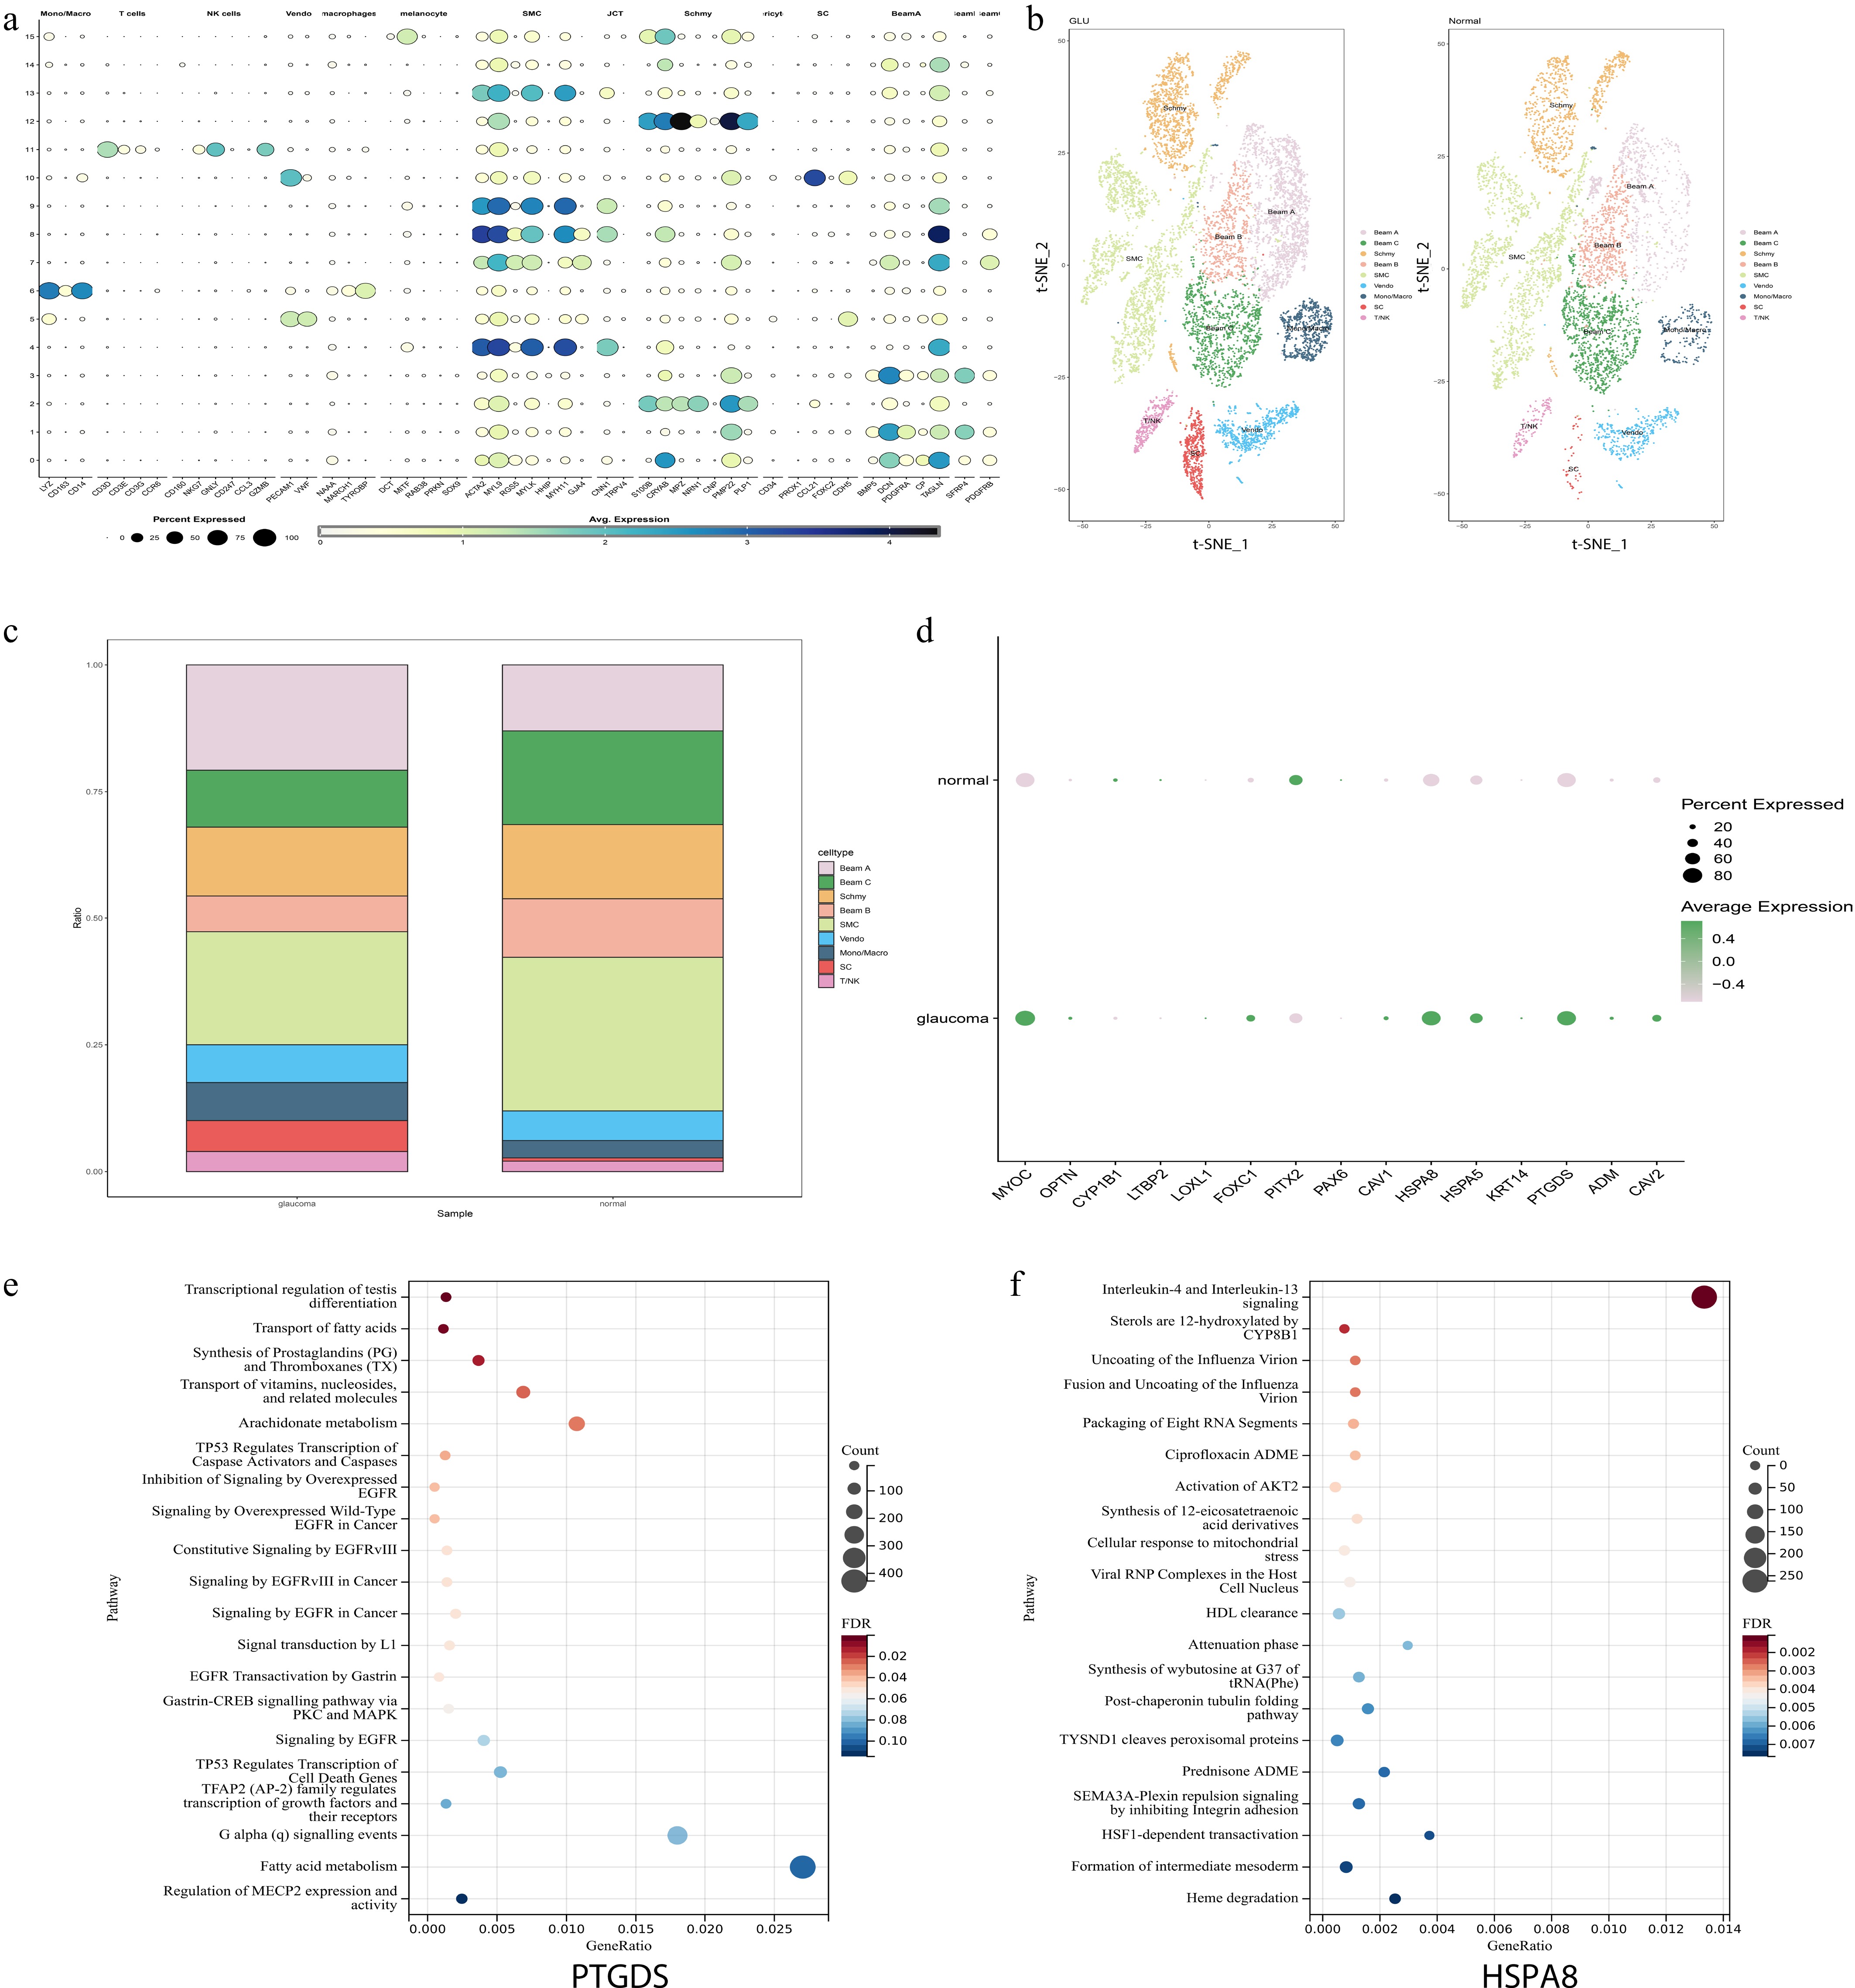
Figure 4.
scRNA-seq identifies key genes related to SH in POAG. (a) The dot plot shows the expression levels of marker genes across each cell types in scRNA-seq analysis. (b) t-SNE visualization of the nine major cell types identified from POAG and normal samples, with clusters color-coded according to their associated cell types. (c) Proportions of different cell types in POAG and normal samples. (d) Dot plot illustrates the expression levels of SH-related genes in both the POAG group and the normal control group. The expressions of the HSPA8 and PTGDS genes were significantly increased in the POAG group. (e), (f) The GSEA enrichment analysis results of PTGDS and HSPA8 are presented. The x-axis represents the gene ratio (proportion of genes in a pathway that are differentially expressed), the y-axis lists the pathways, the bubble size corresponds to the count of genes in the pathway, and the color gradient indicates the false discovery rate (FDR) value (red for lower FDR, blue for higher FDR).
-
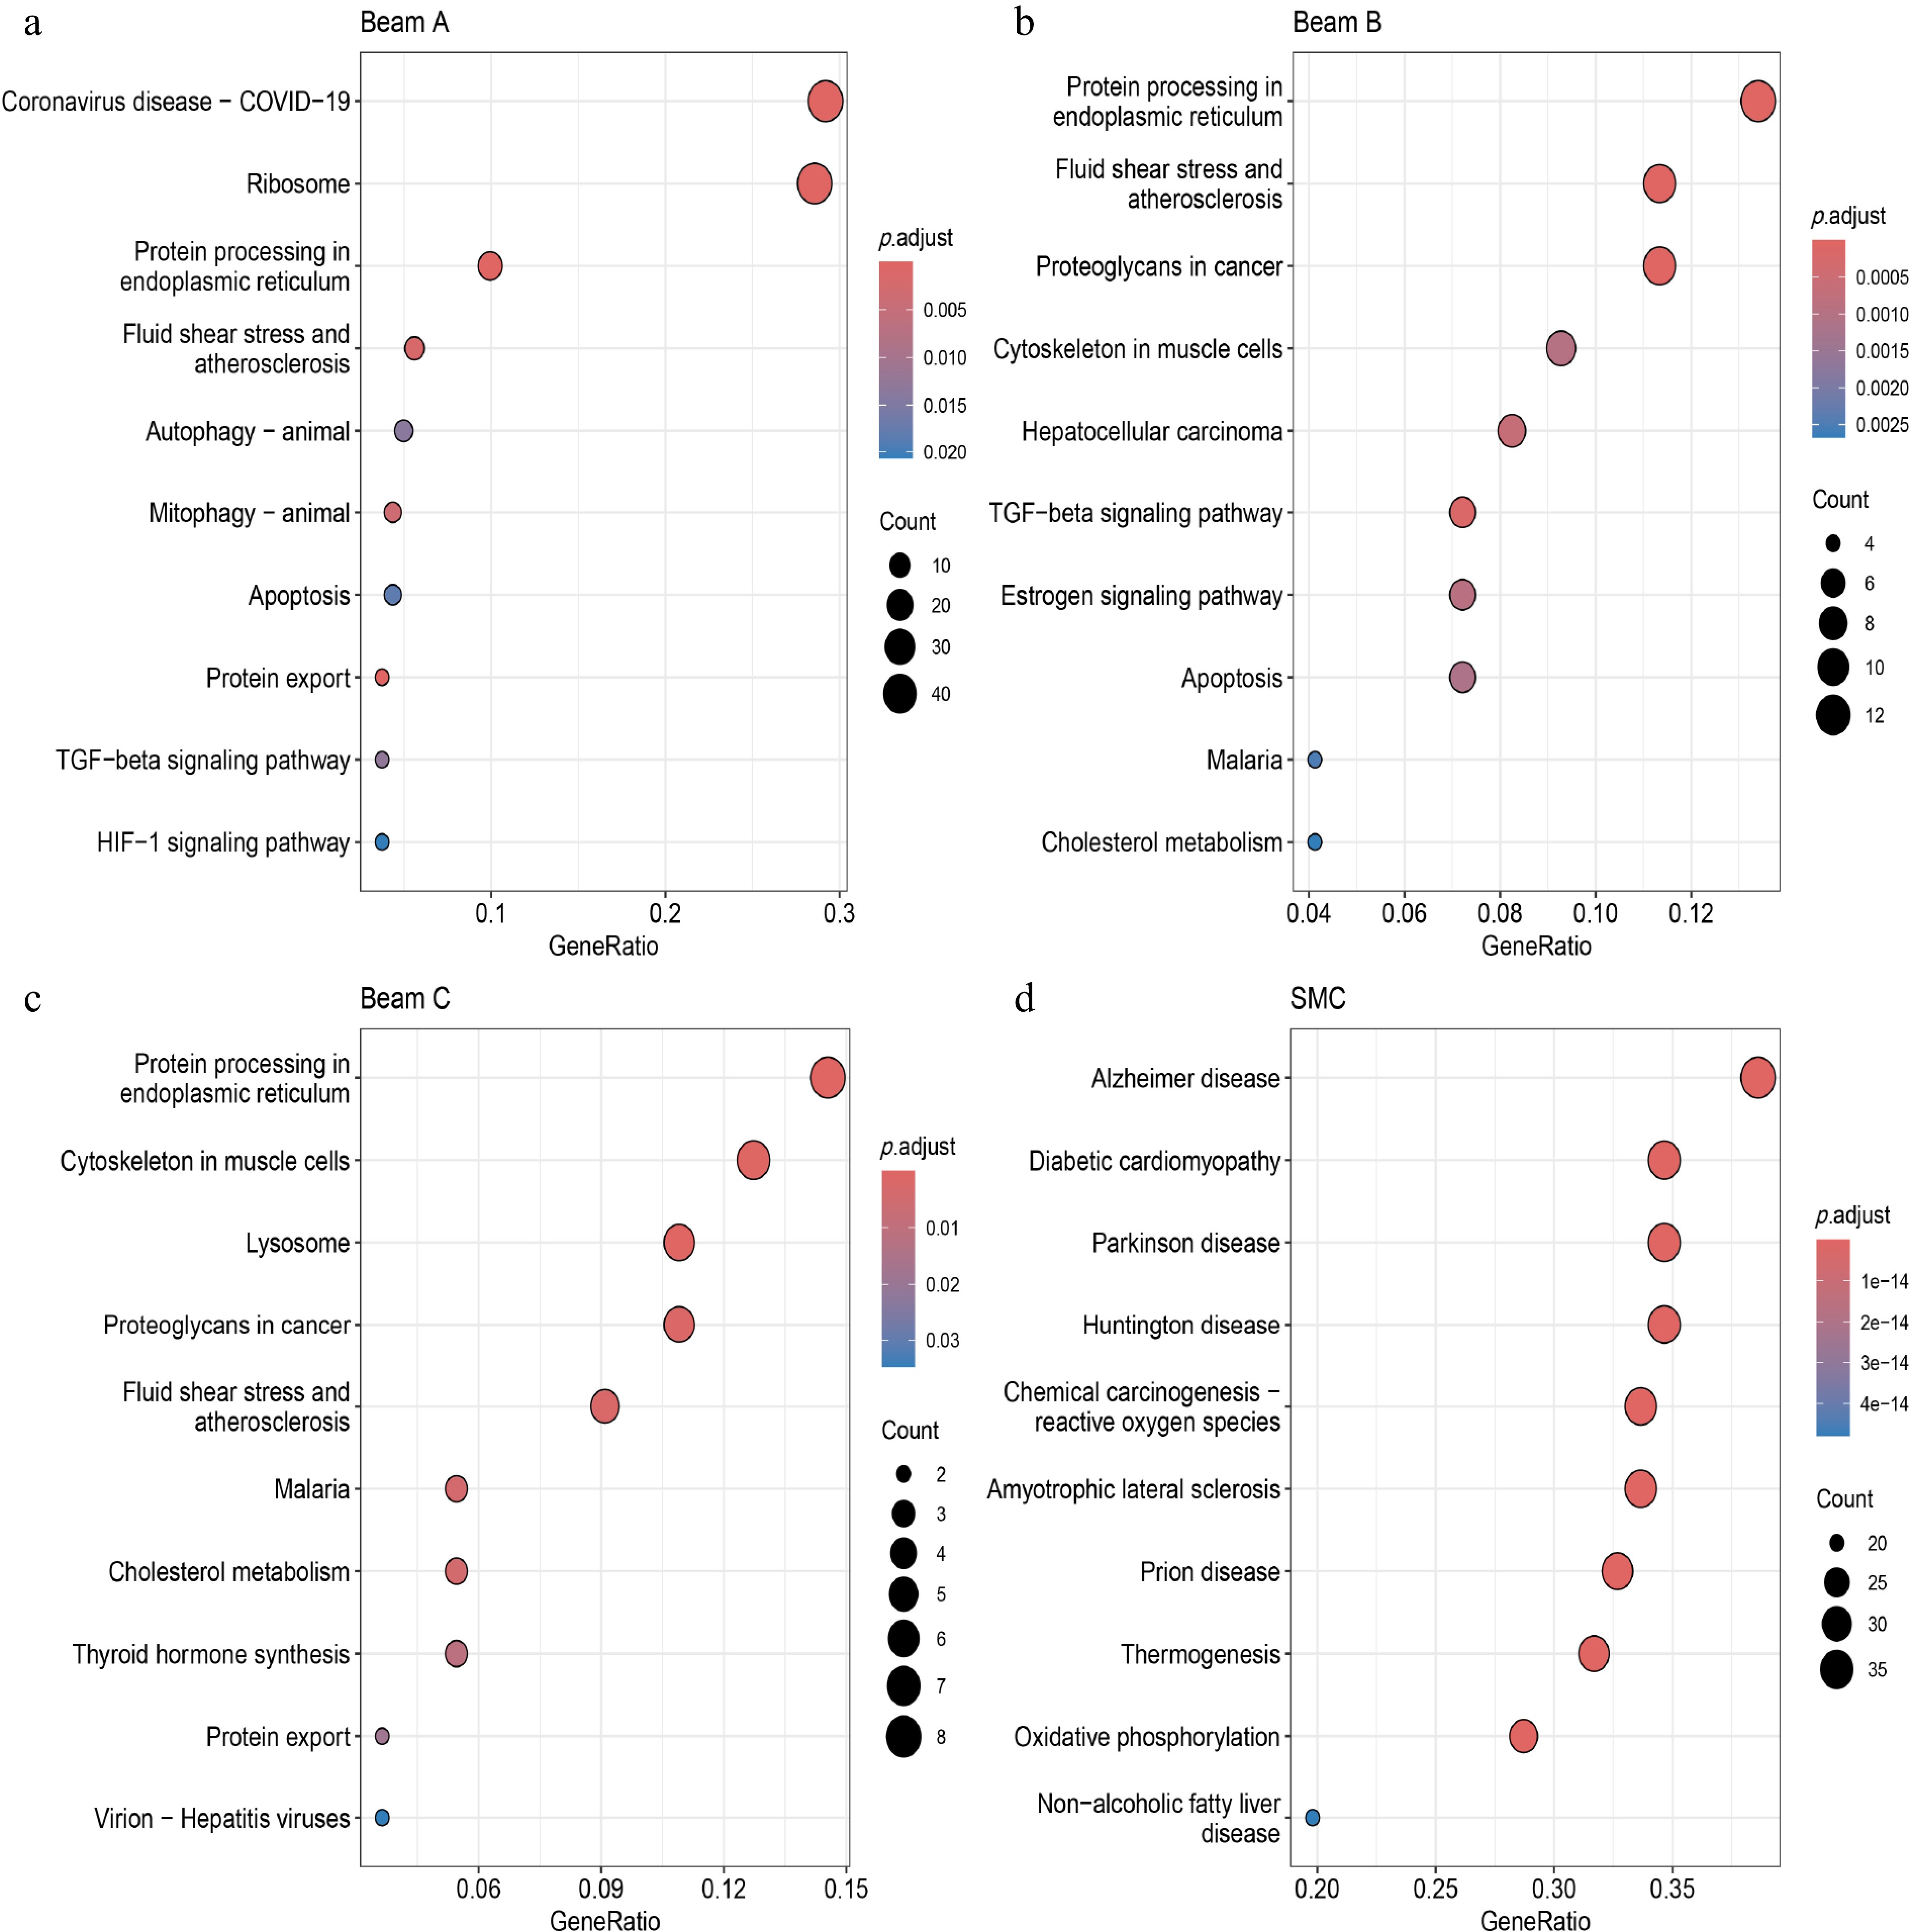
Figure 5.
KEGG enrichment analysis of Beams and SMC clusters in POAG scRNA-seq data. (a)−(d) KEGG enrichment analysis of DEGs in Beams and SMC clusters derived from POAG scRNA-seq data. The x-axis denotes the GeneRatio (proportion of genes in a pathway that are differentially expressed), the y-axis lists the pathways. Bubble size corresponds to the count of genes in the pathway, and the color gradient represents the adjusted p-value (p.adjust), with red indicating lower adjusted p-values, and blue indicating higher adjusted p-values.
Figures
(5)
Tables
(0)