-
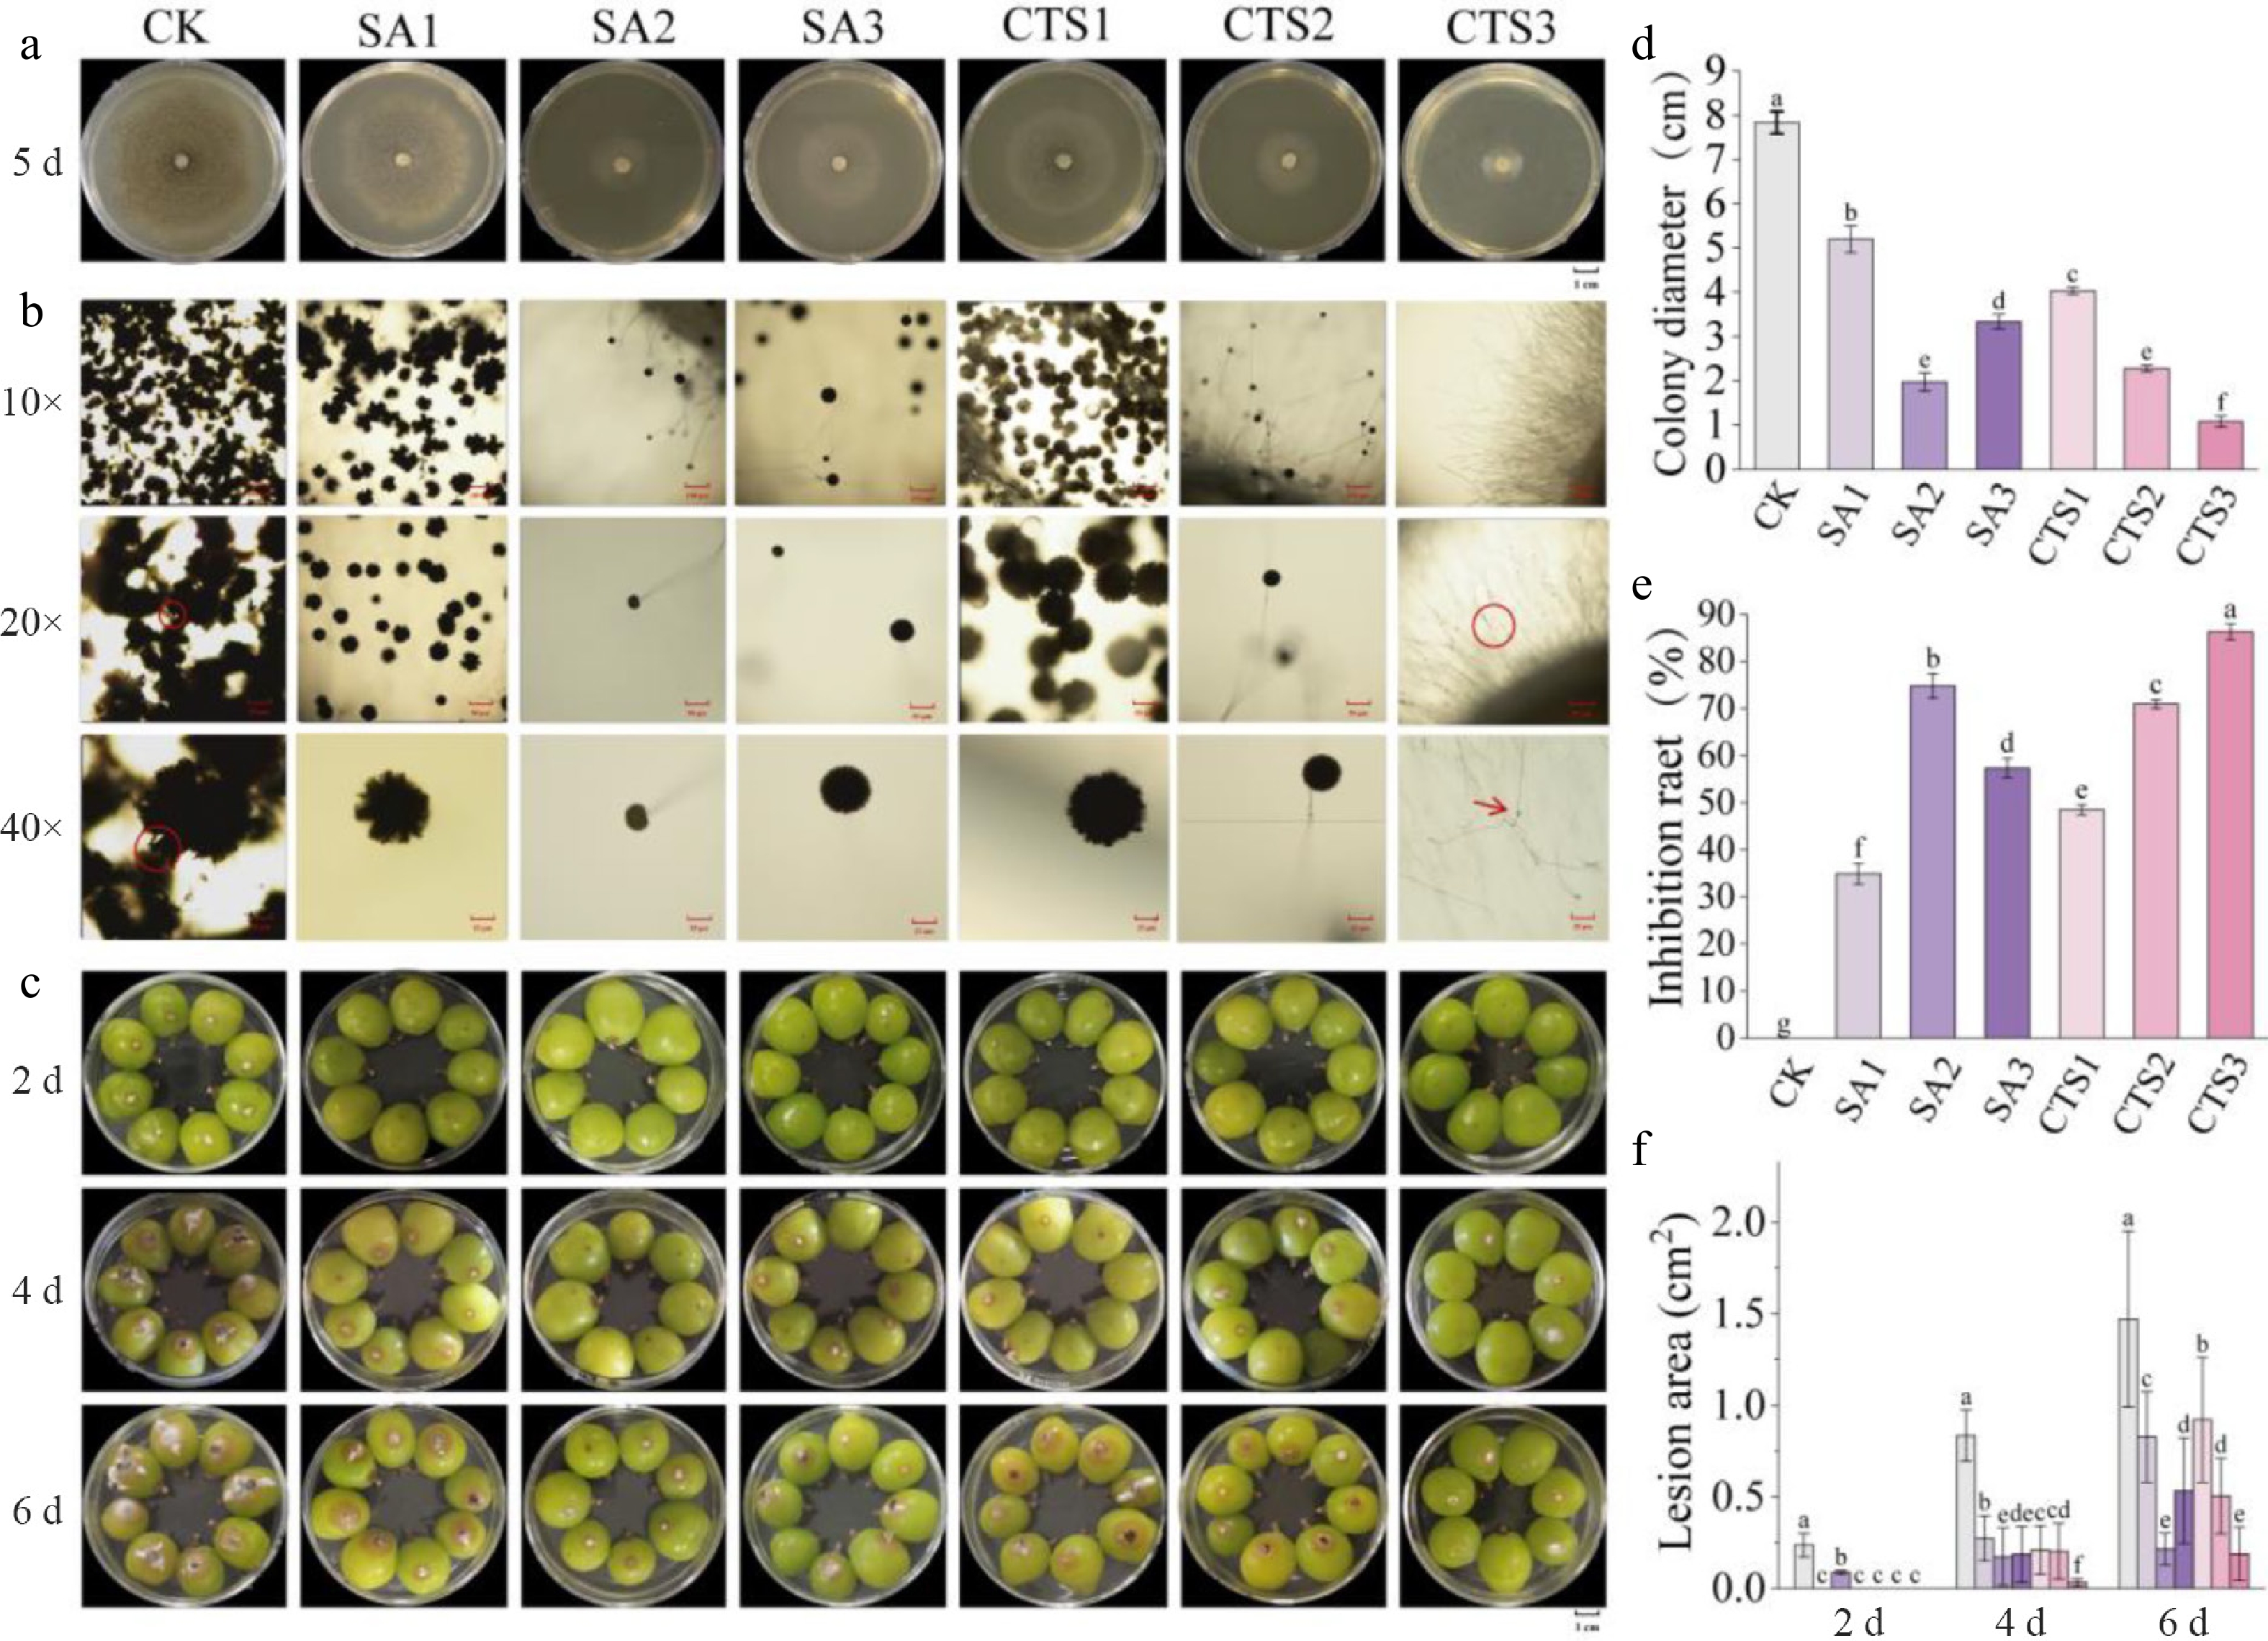
Figure 1.
Antifungal activity of SA and CTS against Aspergillus niger. (a) Inhibition of A. niger mycelial growth by SA and CTS; (b) effects of SA and CTS treatments on microscopic morphology of A. niger spores; the arrow is pointing to a pathological nodule. (c) To observe pathogenicity, grapes were inoculated with A. niger; (d) colony diameter; (e) inhibition rate; (f) lesion area. Data is presented as mean ± SD, n = 3. Different letters indicate significant (p < 0.05) differences between the control and treated samples.
-
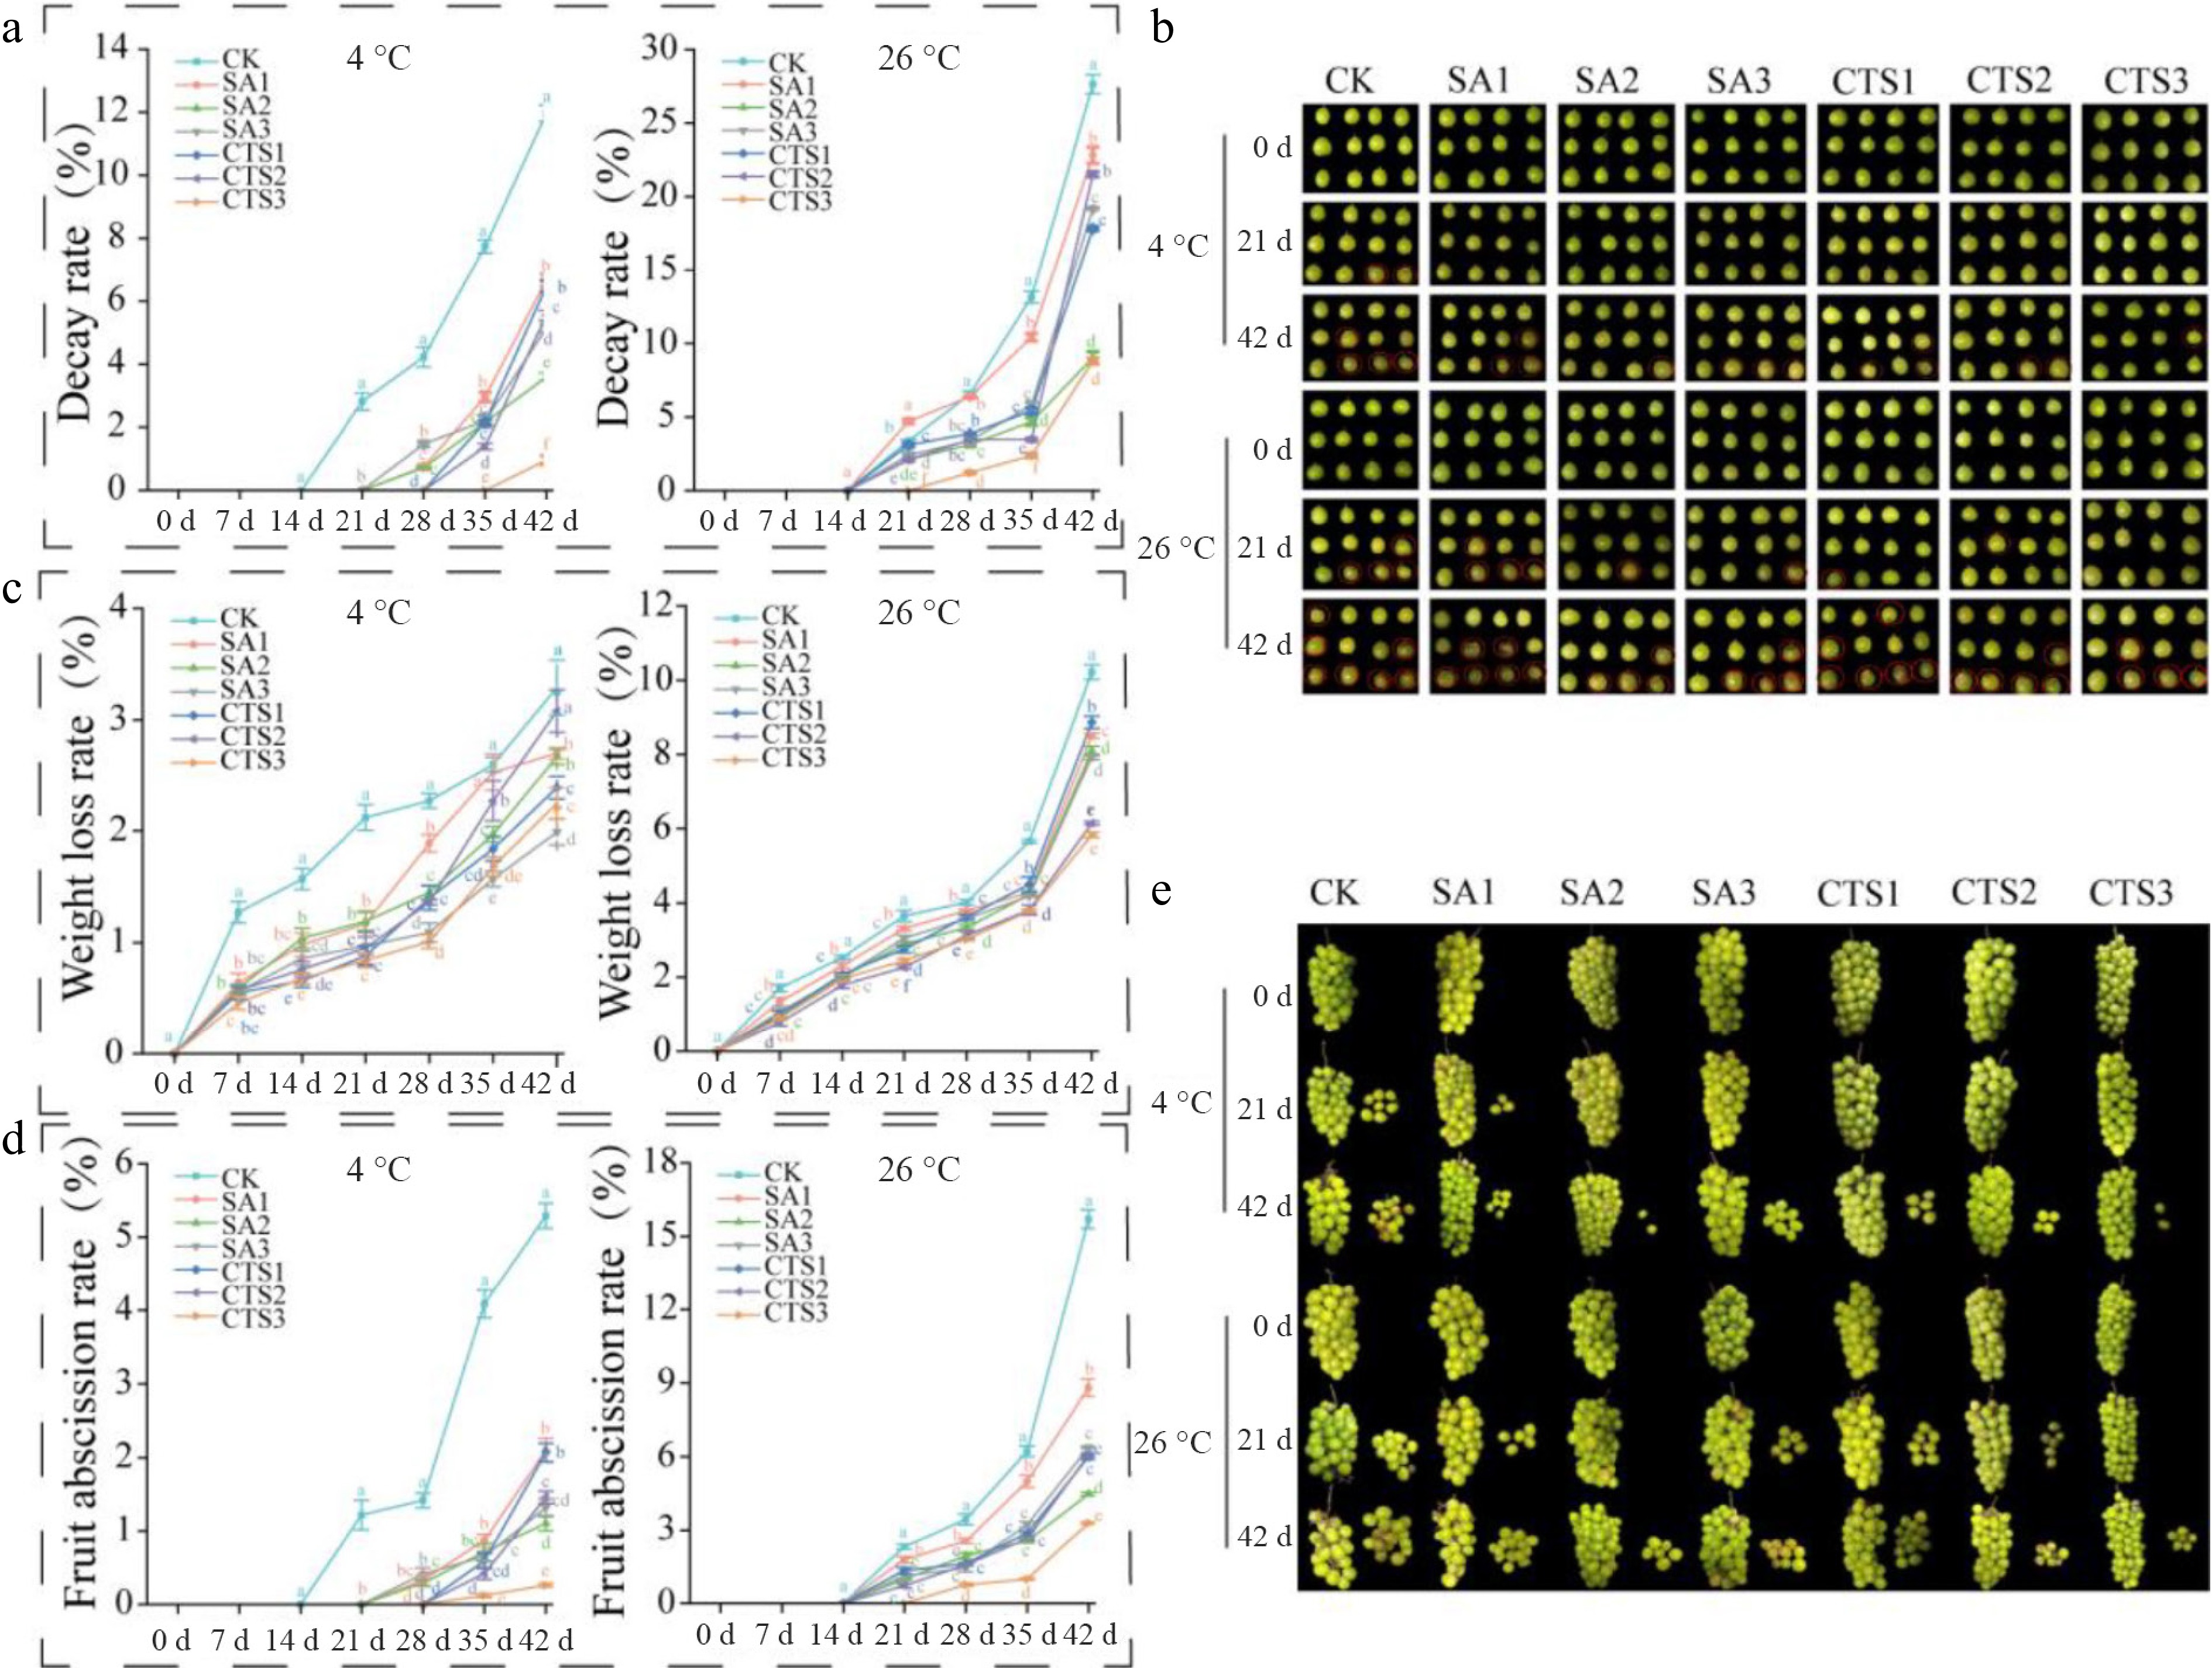
Figure 2.
Effects of different treatments on the external quality of grapes during storage. (a) Decay rate; (b) changes of fruit decay rate in control group and treatment group during storage; (c) weight loss rate; (d) fruit abscission rate; (e) changes of fruit abscission rate in the control group and treatment group during storage. Data is presented as mean ± SD, n = 3. Different letters indicate significant (p < 0.05) differences between the control and treated samples.
-
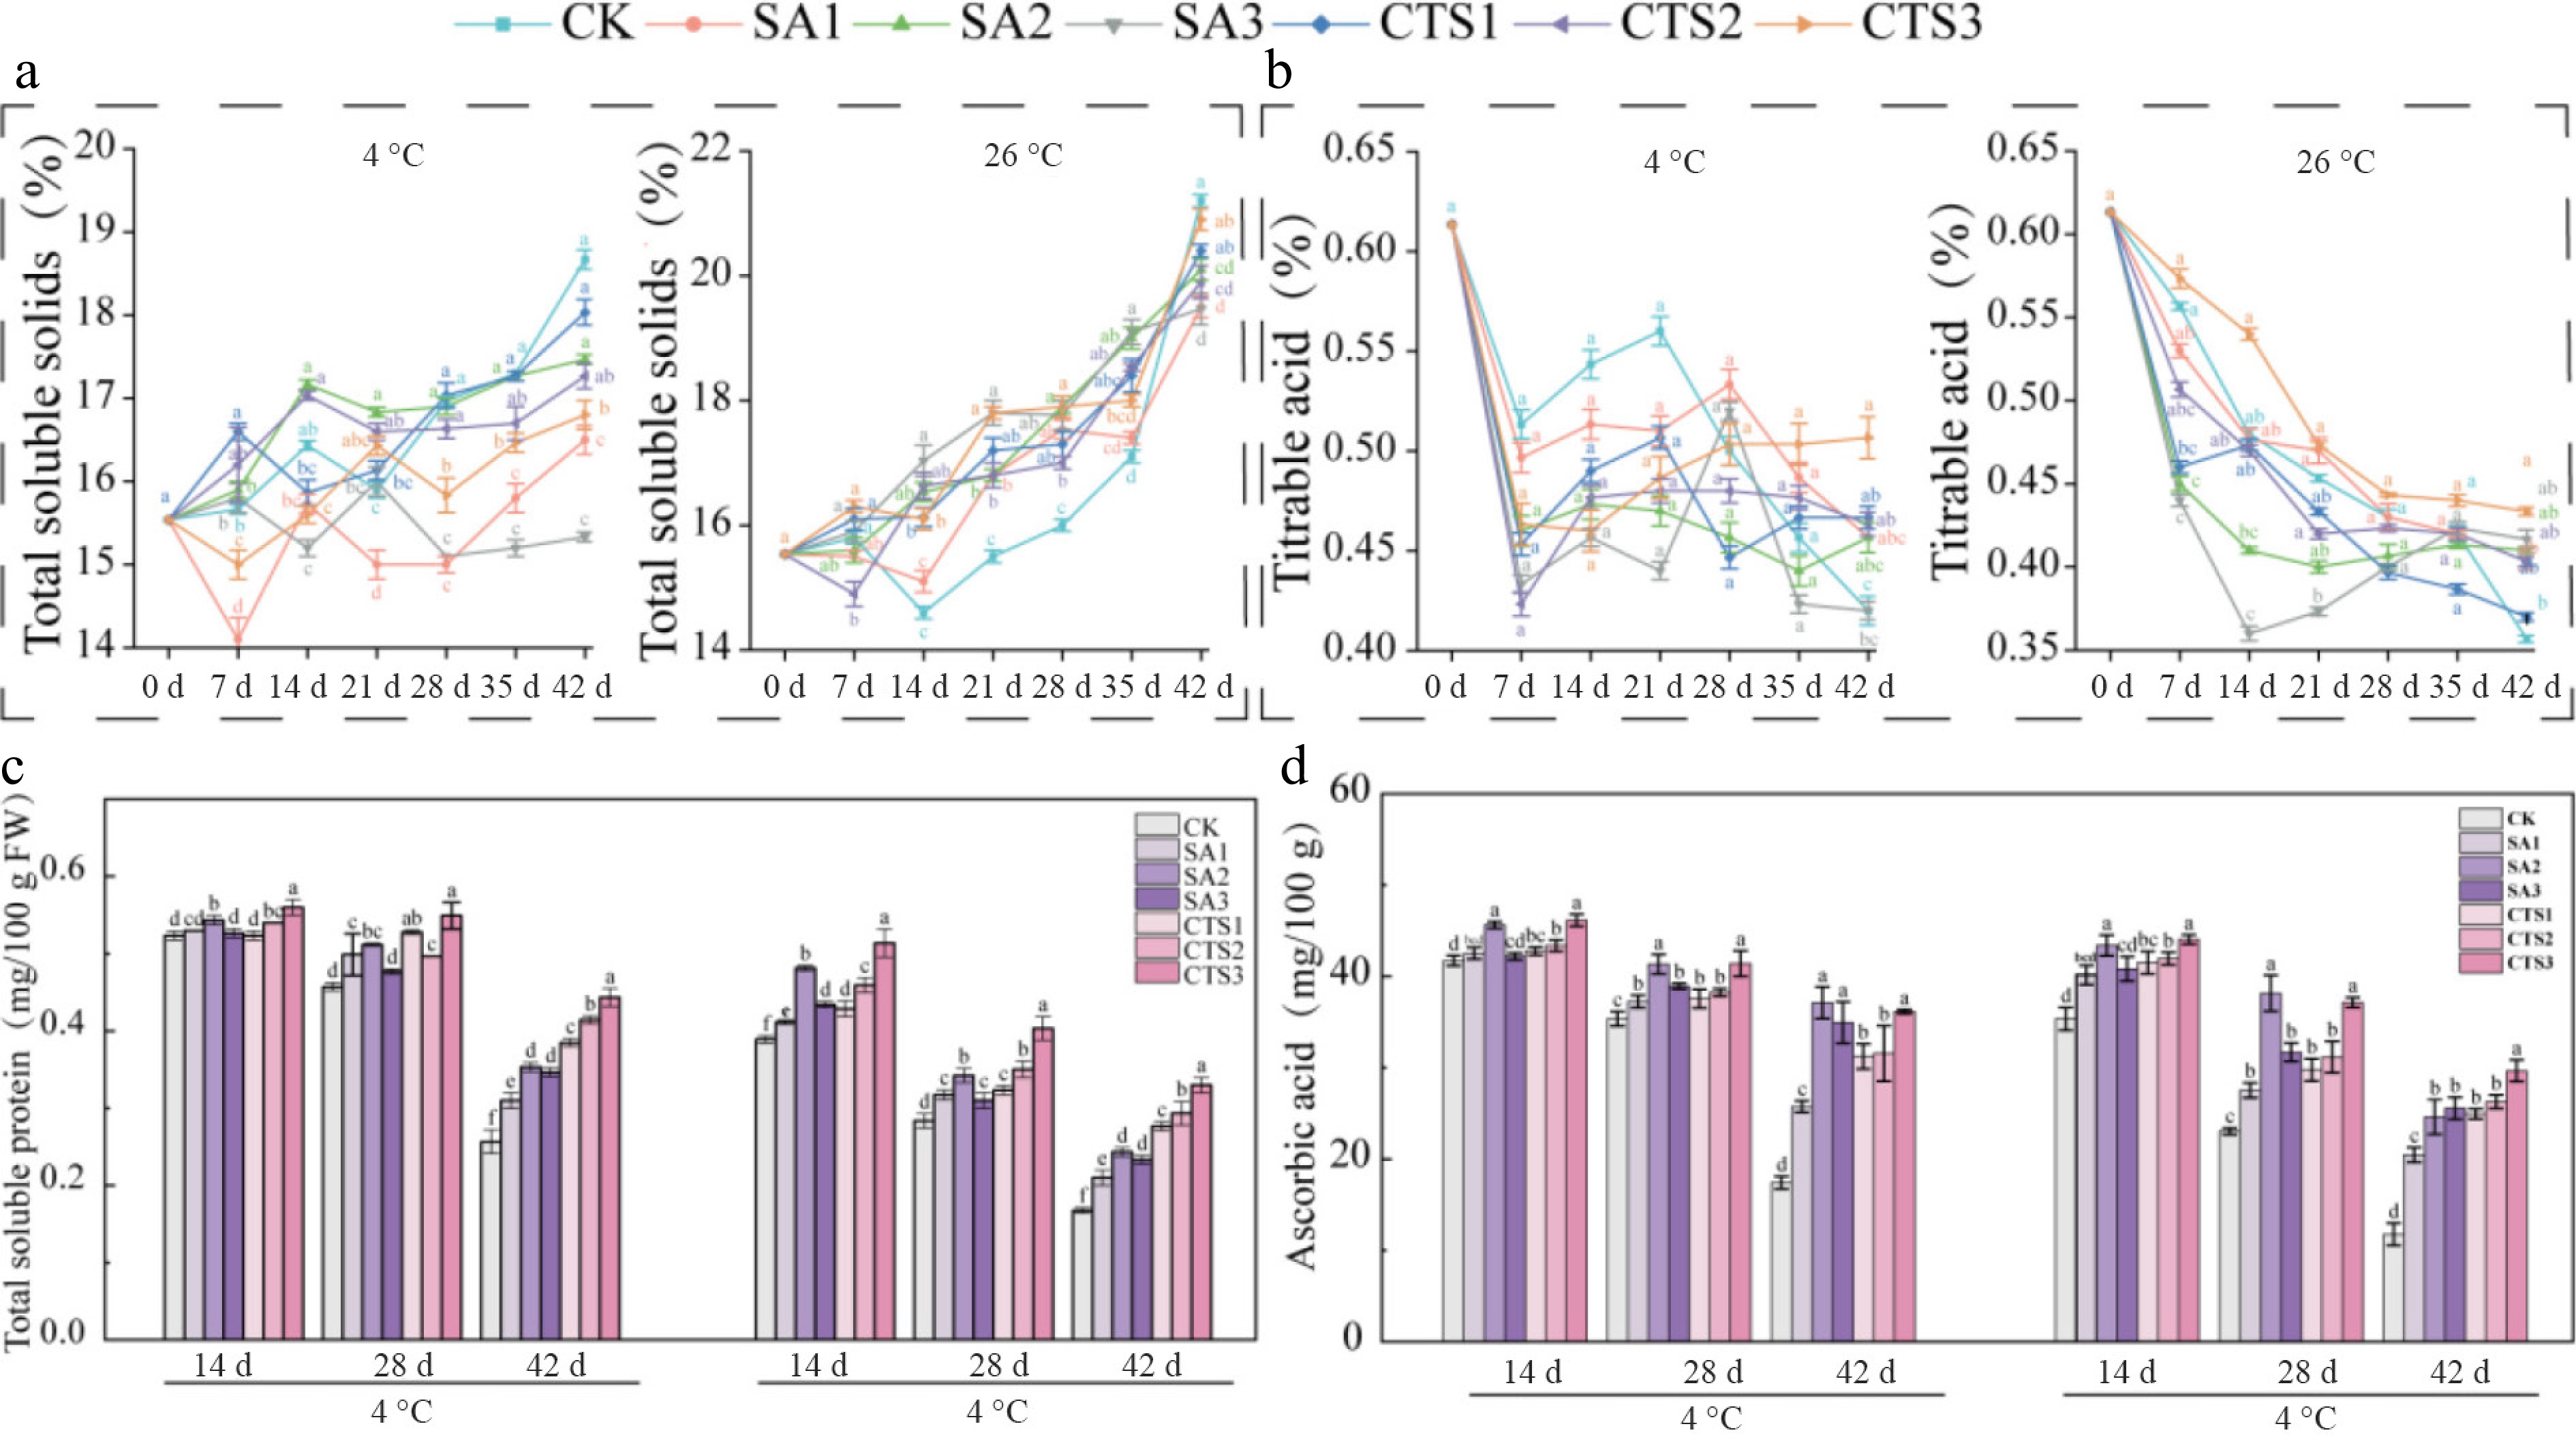
Figure 3.
Effects of different treatments on the internal quality of grapes during storage. (a) Total soluble solids content; (b) titratable acid content; (c) total soluble protein; (d) ascorbic acid. Data is presented as mean ± SD, n = 3. Different letters indicate significant (p < 0.05) differences between the control and treated samples.
-
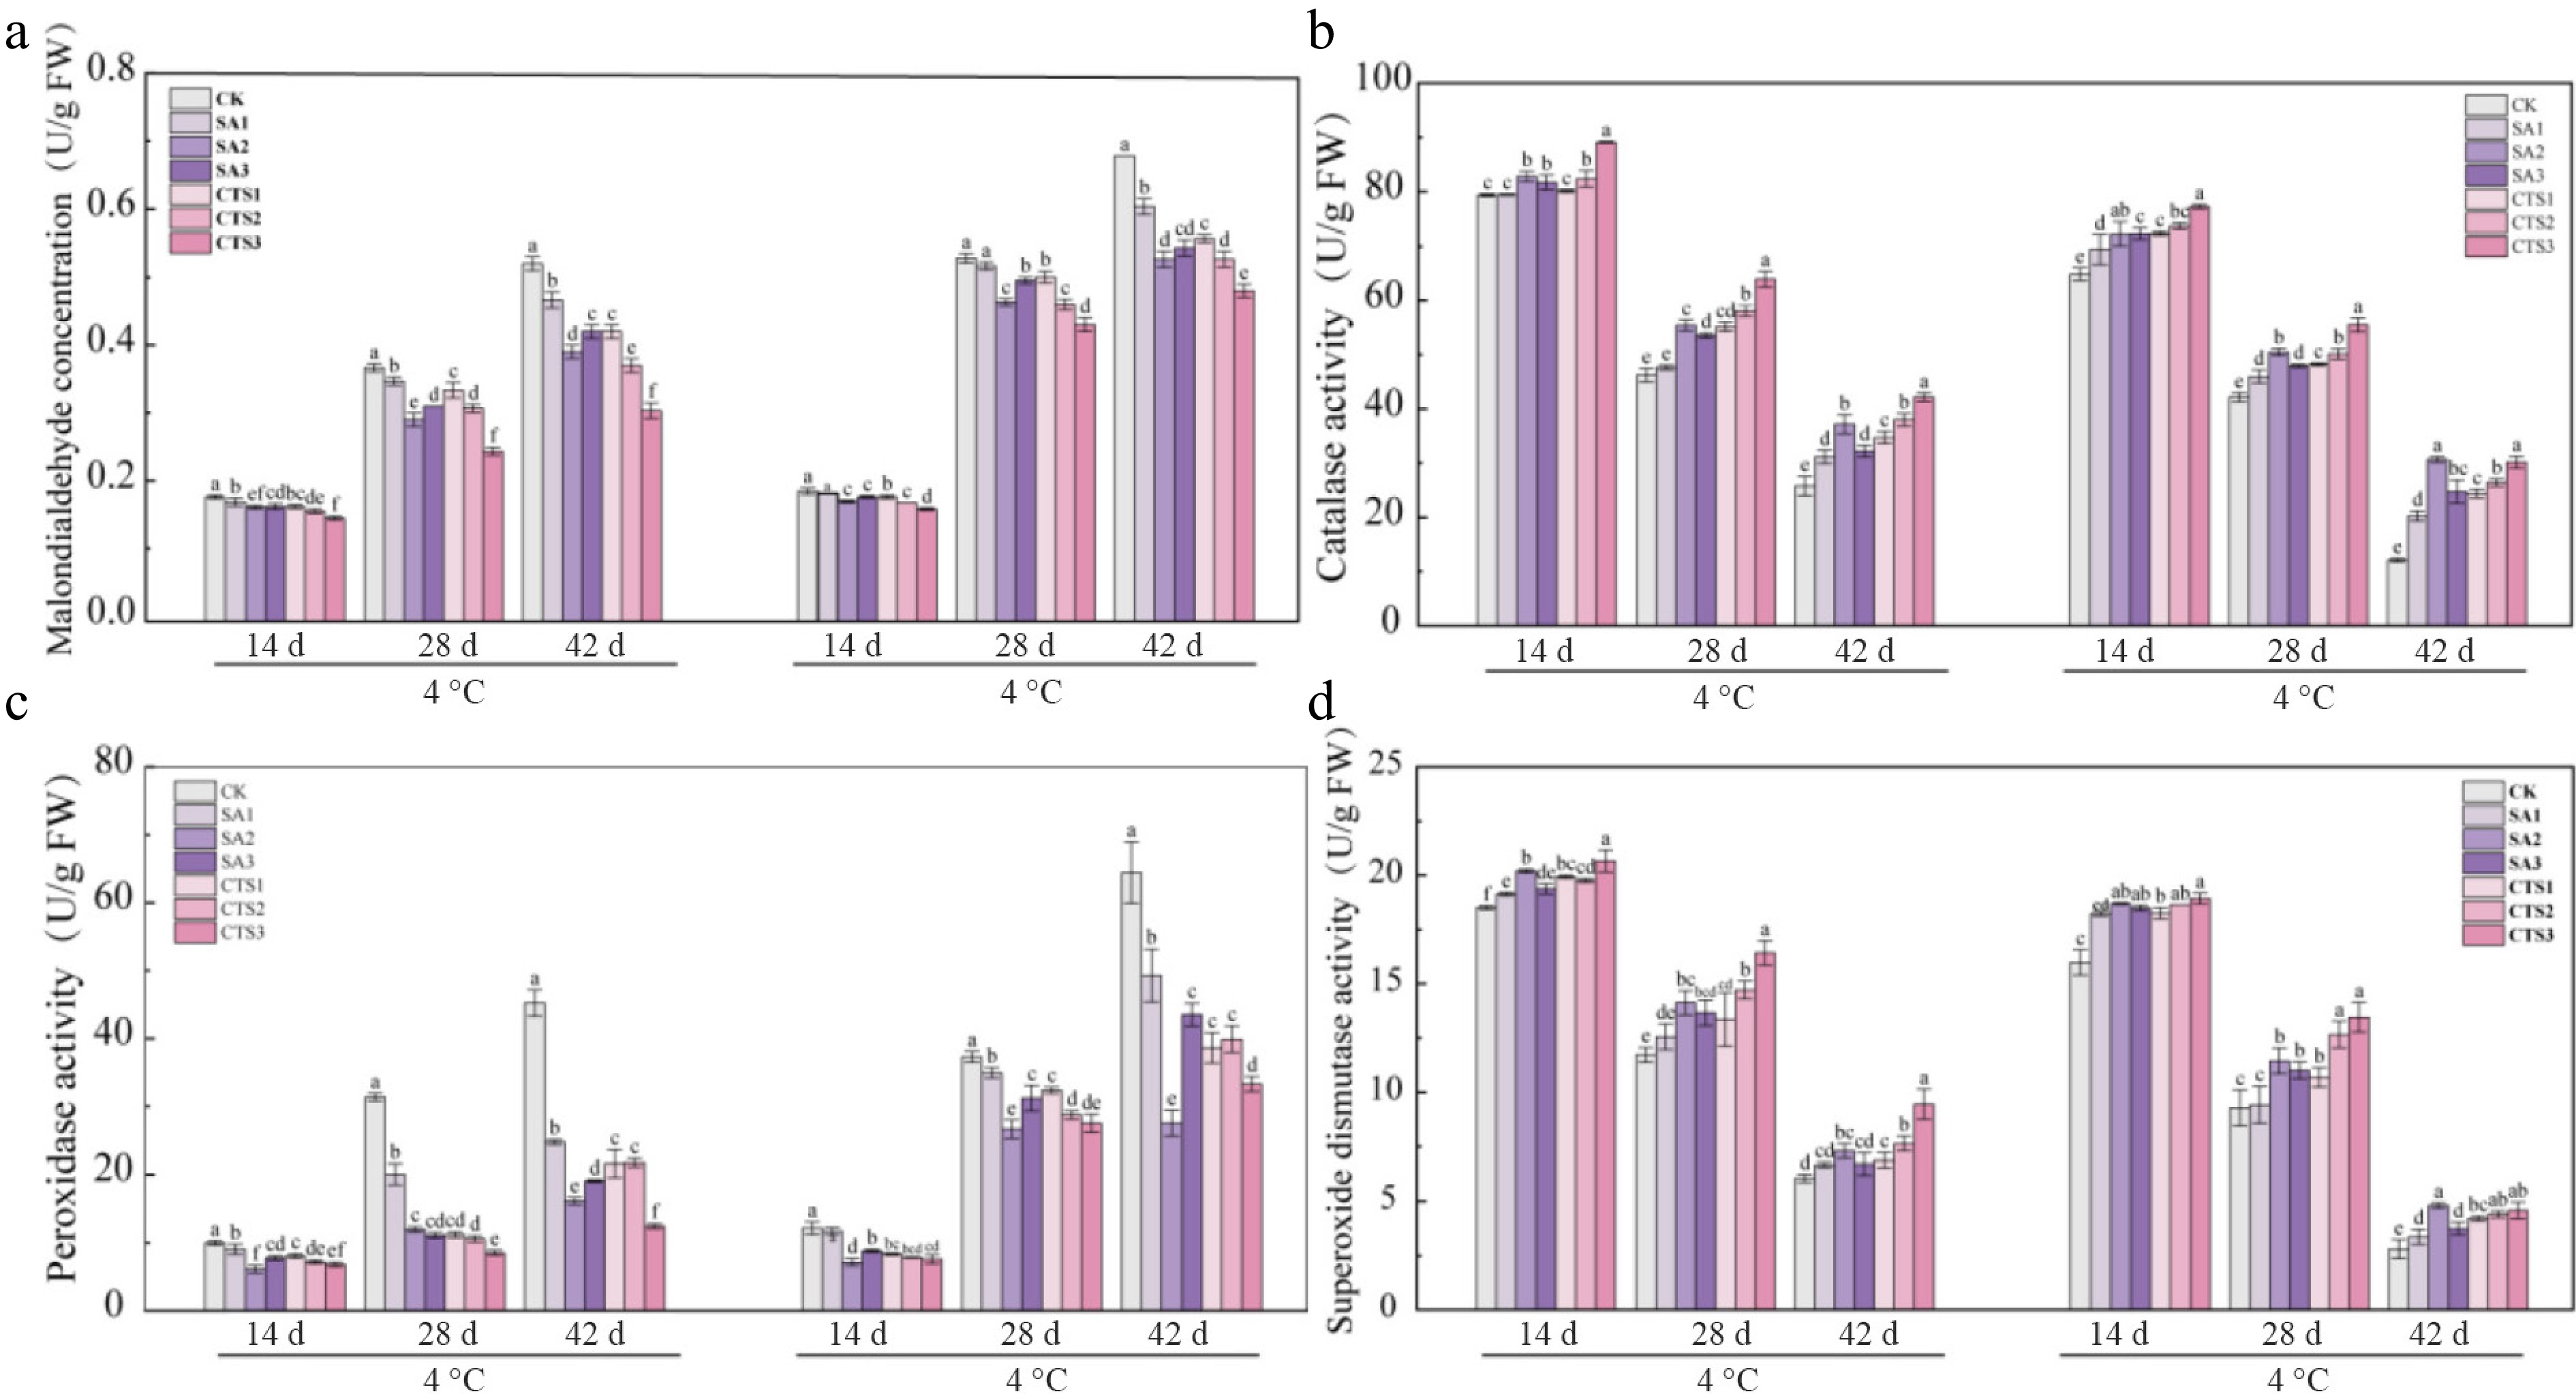
Figure 4.
Modulation of grape antioxidant defense by chitosan and salicylic acid coatings during storage at 4 and 26 °C. (a) Malondialdehyde concentration; (b) catalase activity; (c) peroxidase activity; (d) superoxide dismutase activity. Data is presented as mean ± SD, n = 3. Different letters indicate significant (p < 0.05) differences between the control and treated samples.
-
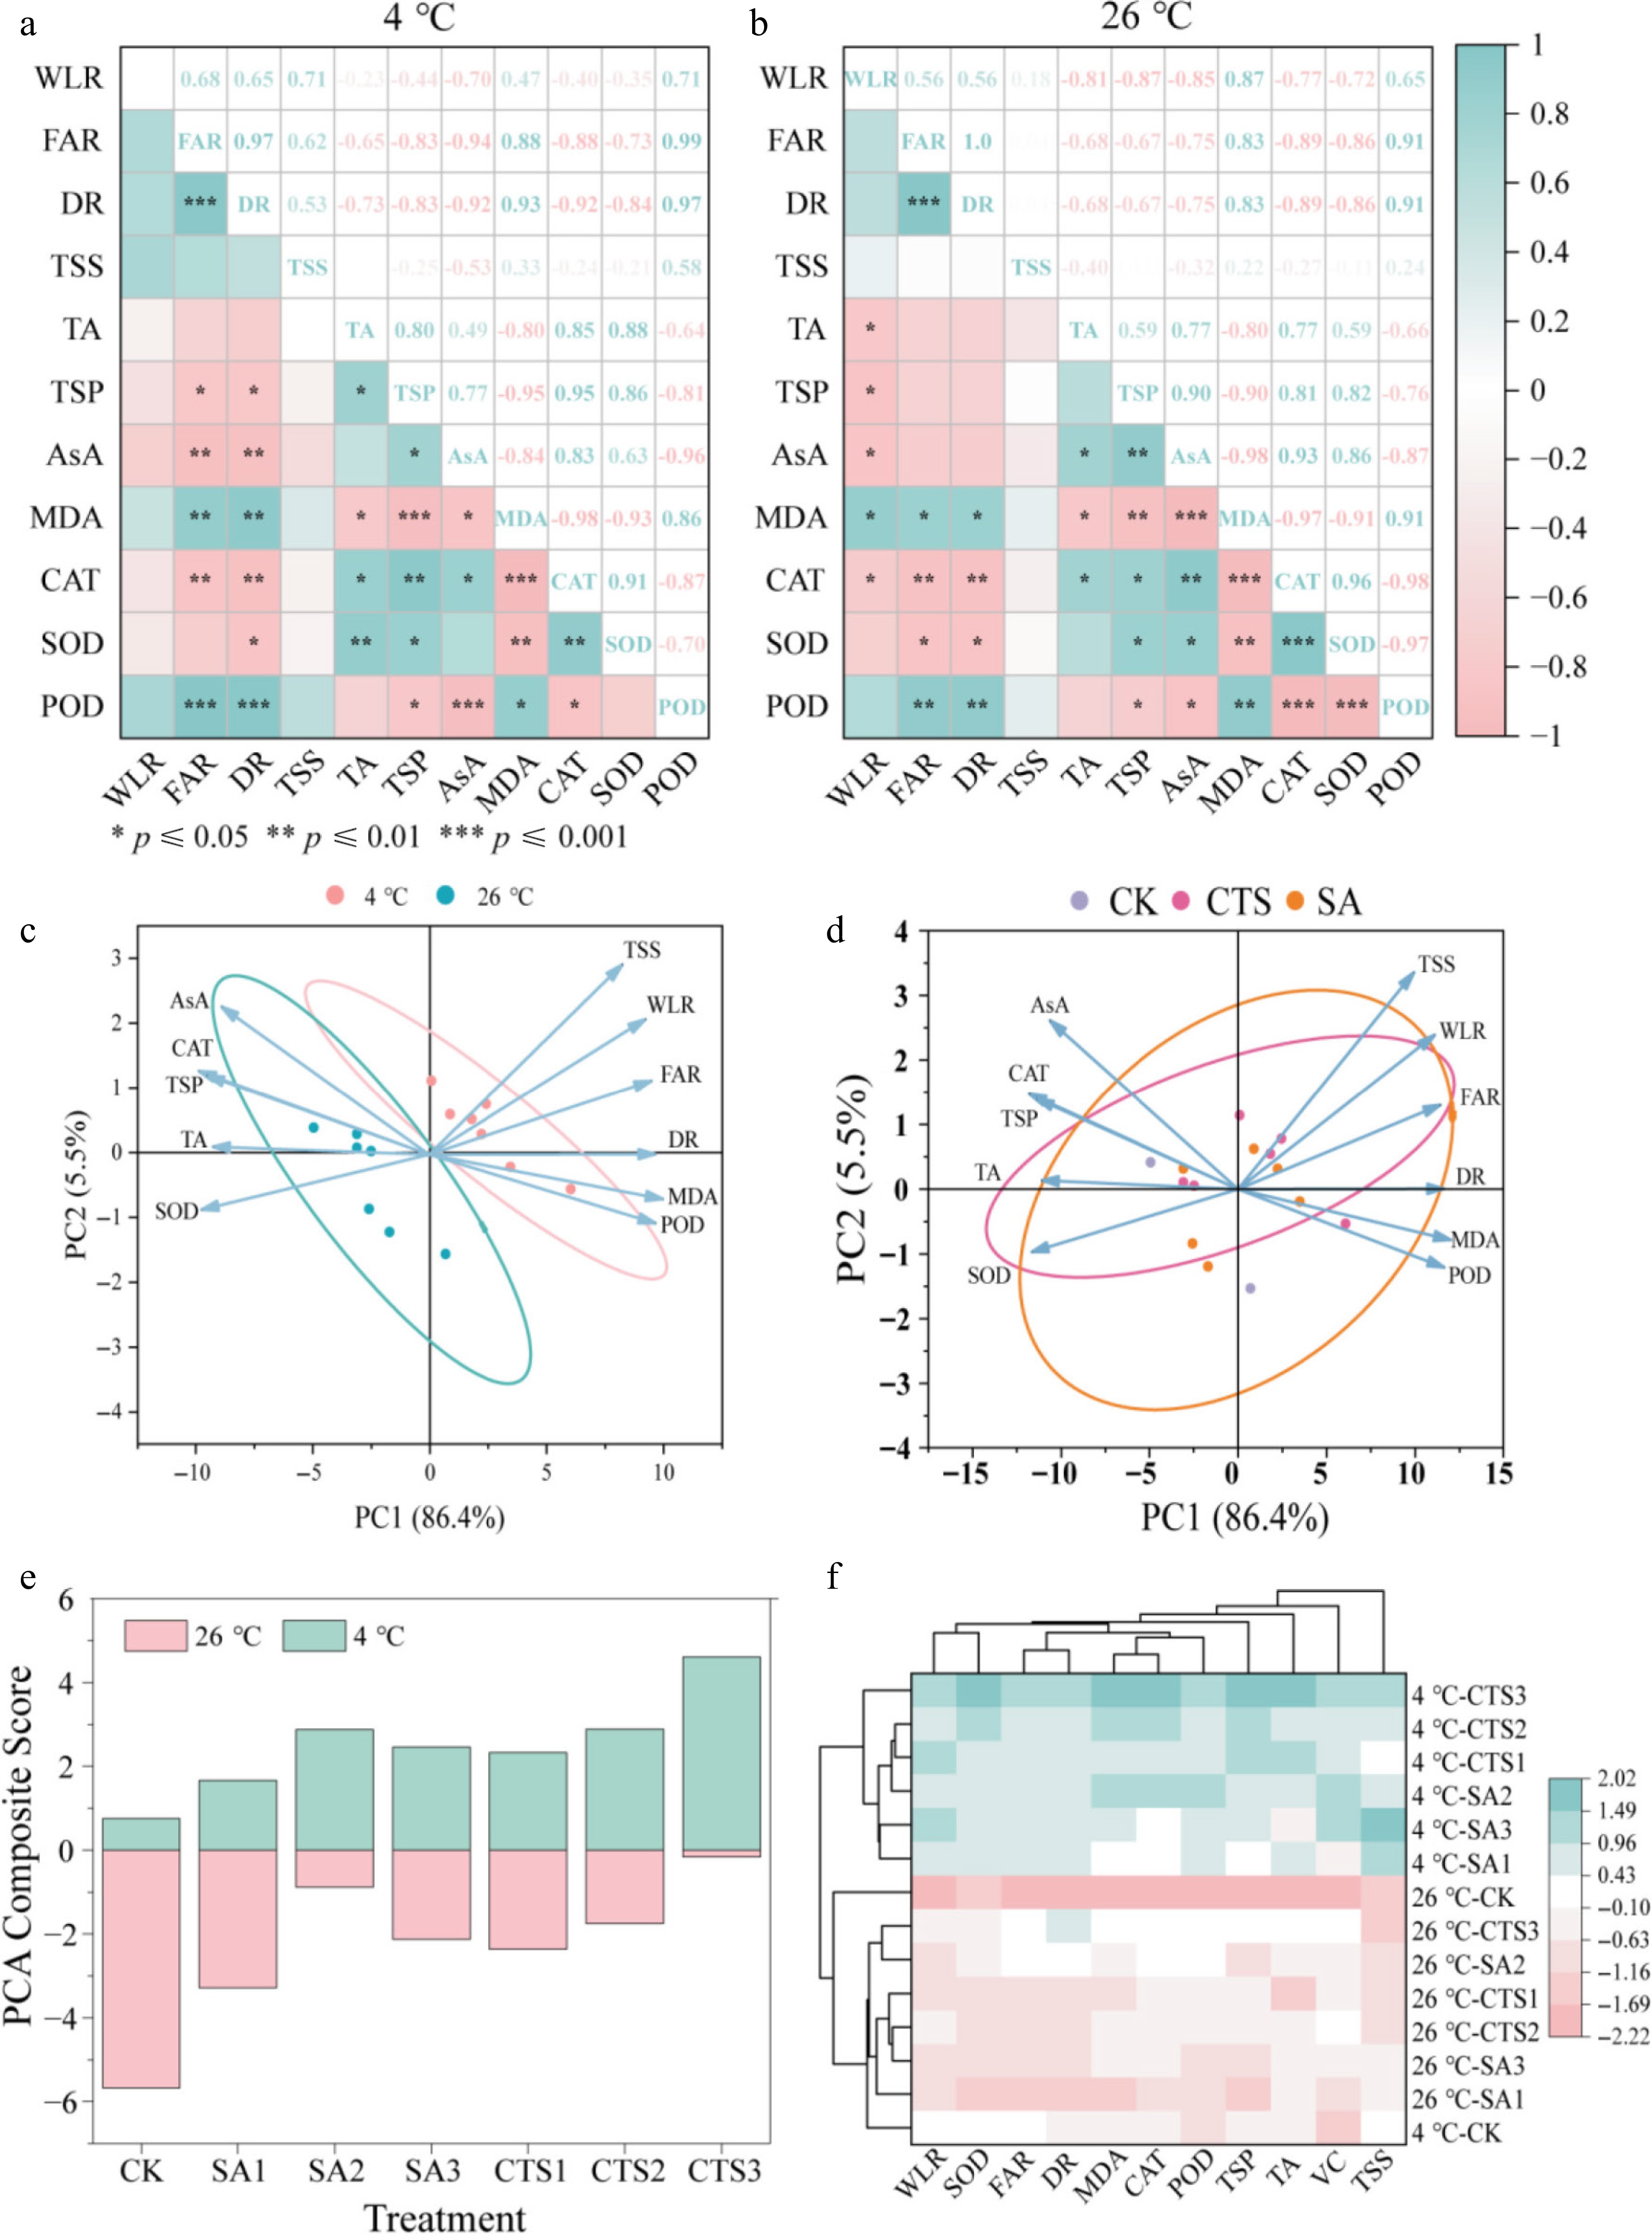
Figure 5.
Multivariate analysis of grape preservation mechanisms. (a) Correlation analysis; (b) PCA effect of storage temperature (4 °C) on storage quality of grapes during storage; (c) PCA effect of storage temperature (26 °C) on storage quality of grapes during storage; (d) PCA of grape storage quality with different coating treatments under two storage temperatures; (e) PCA composite score; (f) cluster analysis of different coating treatments and storage temperature of grapes.
-
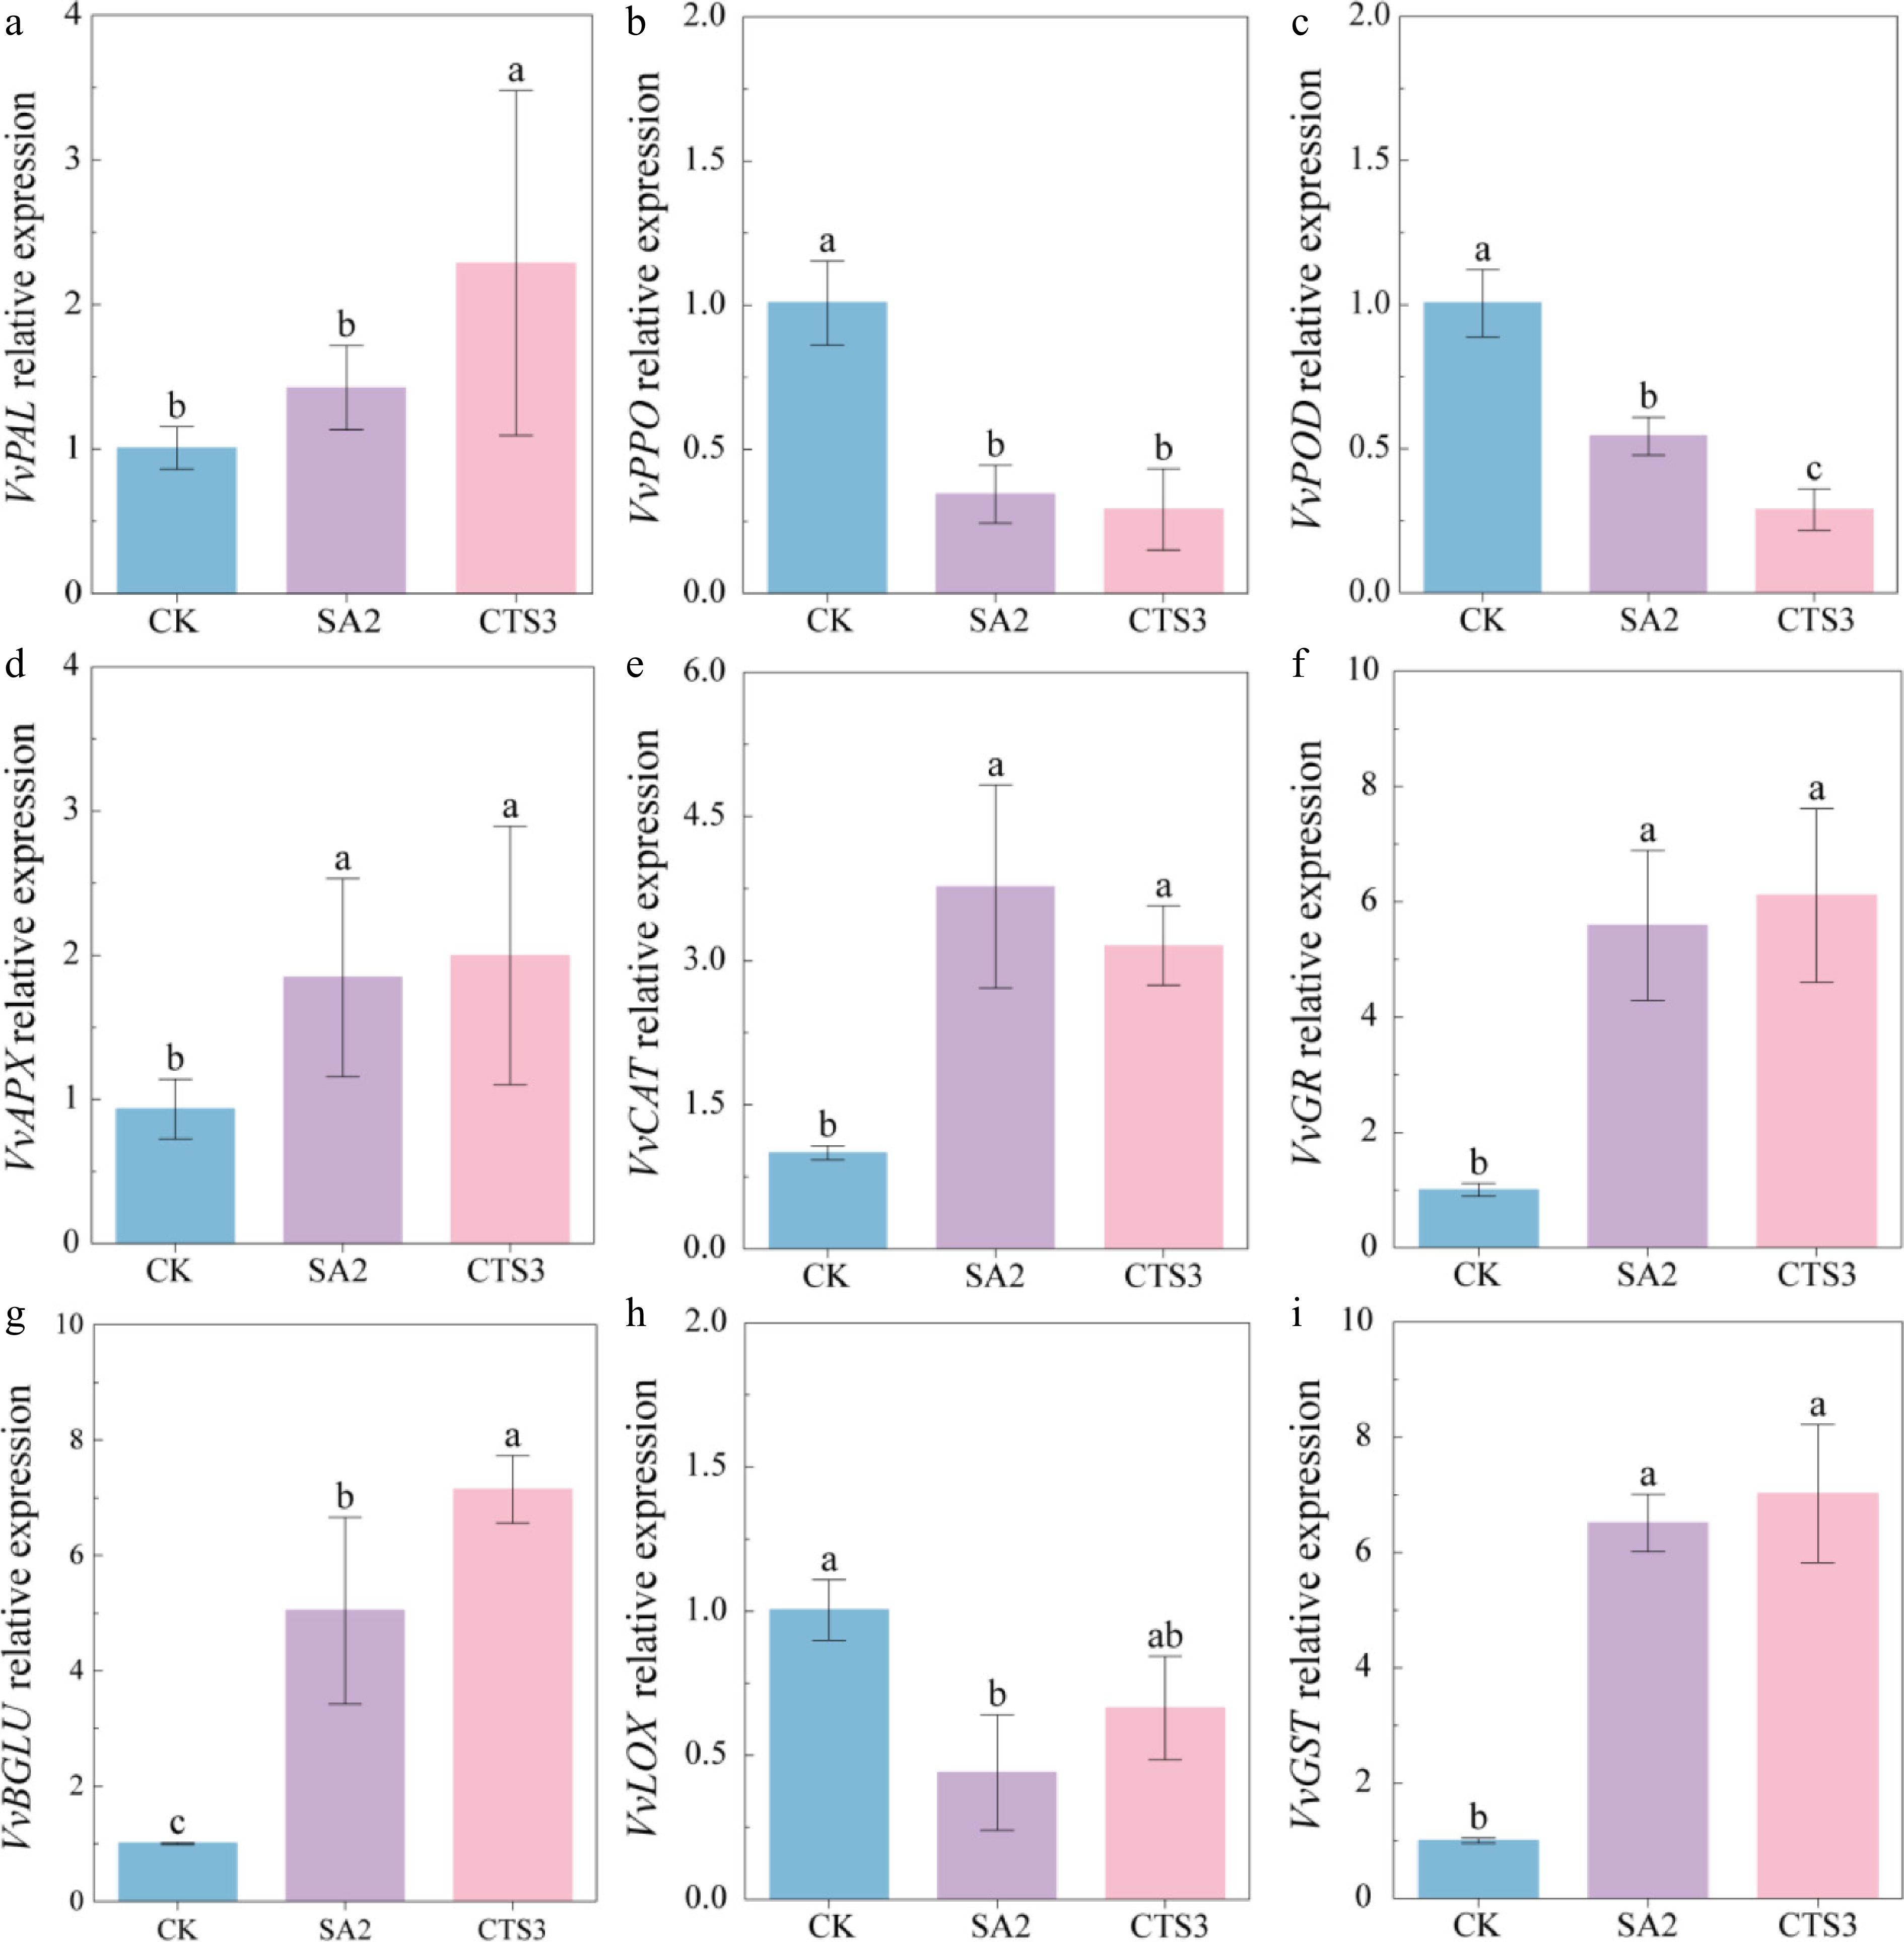
Figure 6.
Effects of SA2 and CTS3 treatments on the relative expression levels of disease-response genes in grapes inoculated with Aspergillus niger. (a) VvPAL; (b) VvPPO; (c) VvPOD; (d)VvAPX; (e) VvCAT; (f) VvGR; (g) VvBGLU; (h)VvLOX; (i) VvGST. Data is presented as mean ± SD, n = 3. Different letters indicate significant (p < 0.05) differences between the control and treated samples.
-
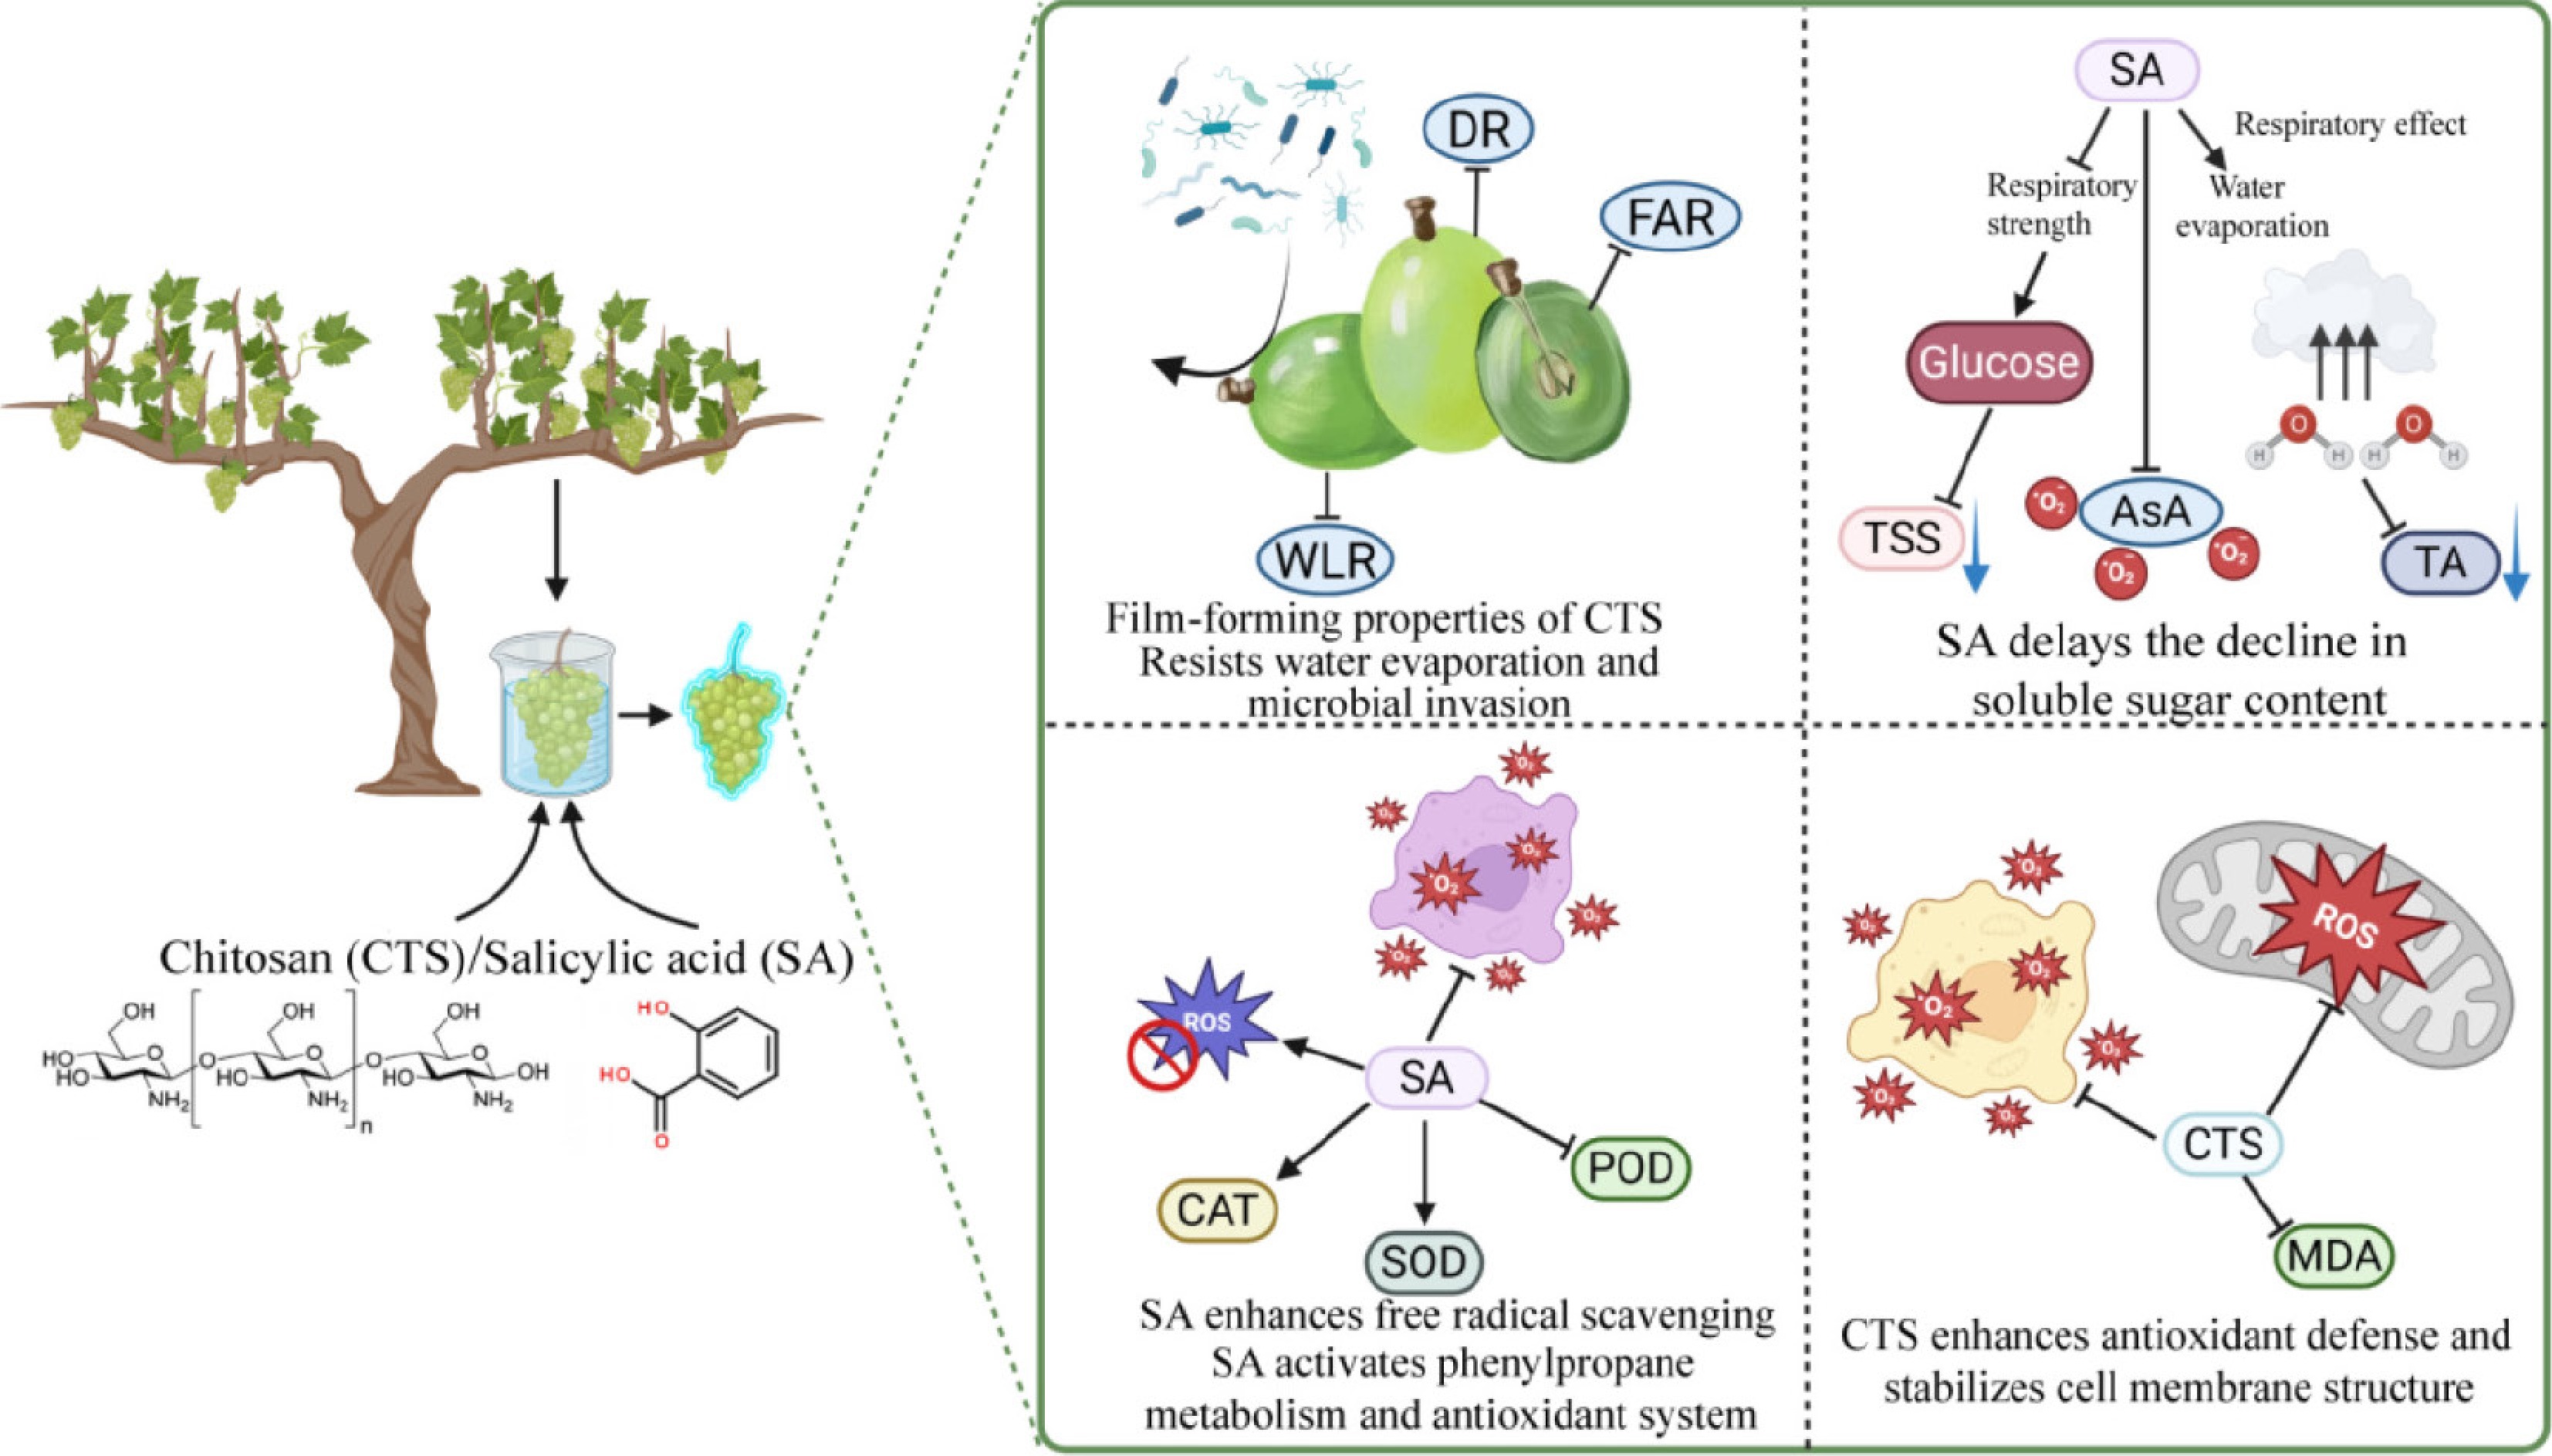
Figure 7.
Effects of postharvest coating with chitosan and salicylic acid on grape storage quality. CTS (chitosan); SA (salicylic acid); DR (decay rate); WLR (weight loss rate); FAR (fruit abscission rate); TSS (total soluble solids); TA (titratable acidity); AsA (ascorbic acid); CAT (catalase); SOD (superoxide dismutase); POD (peroxidase); MDA (malondialdehyde); ROS (reactive oxygen species). The figure was created on BioRender (
www.biorender.com ).
Figures
(7)
Tables
(0)