-
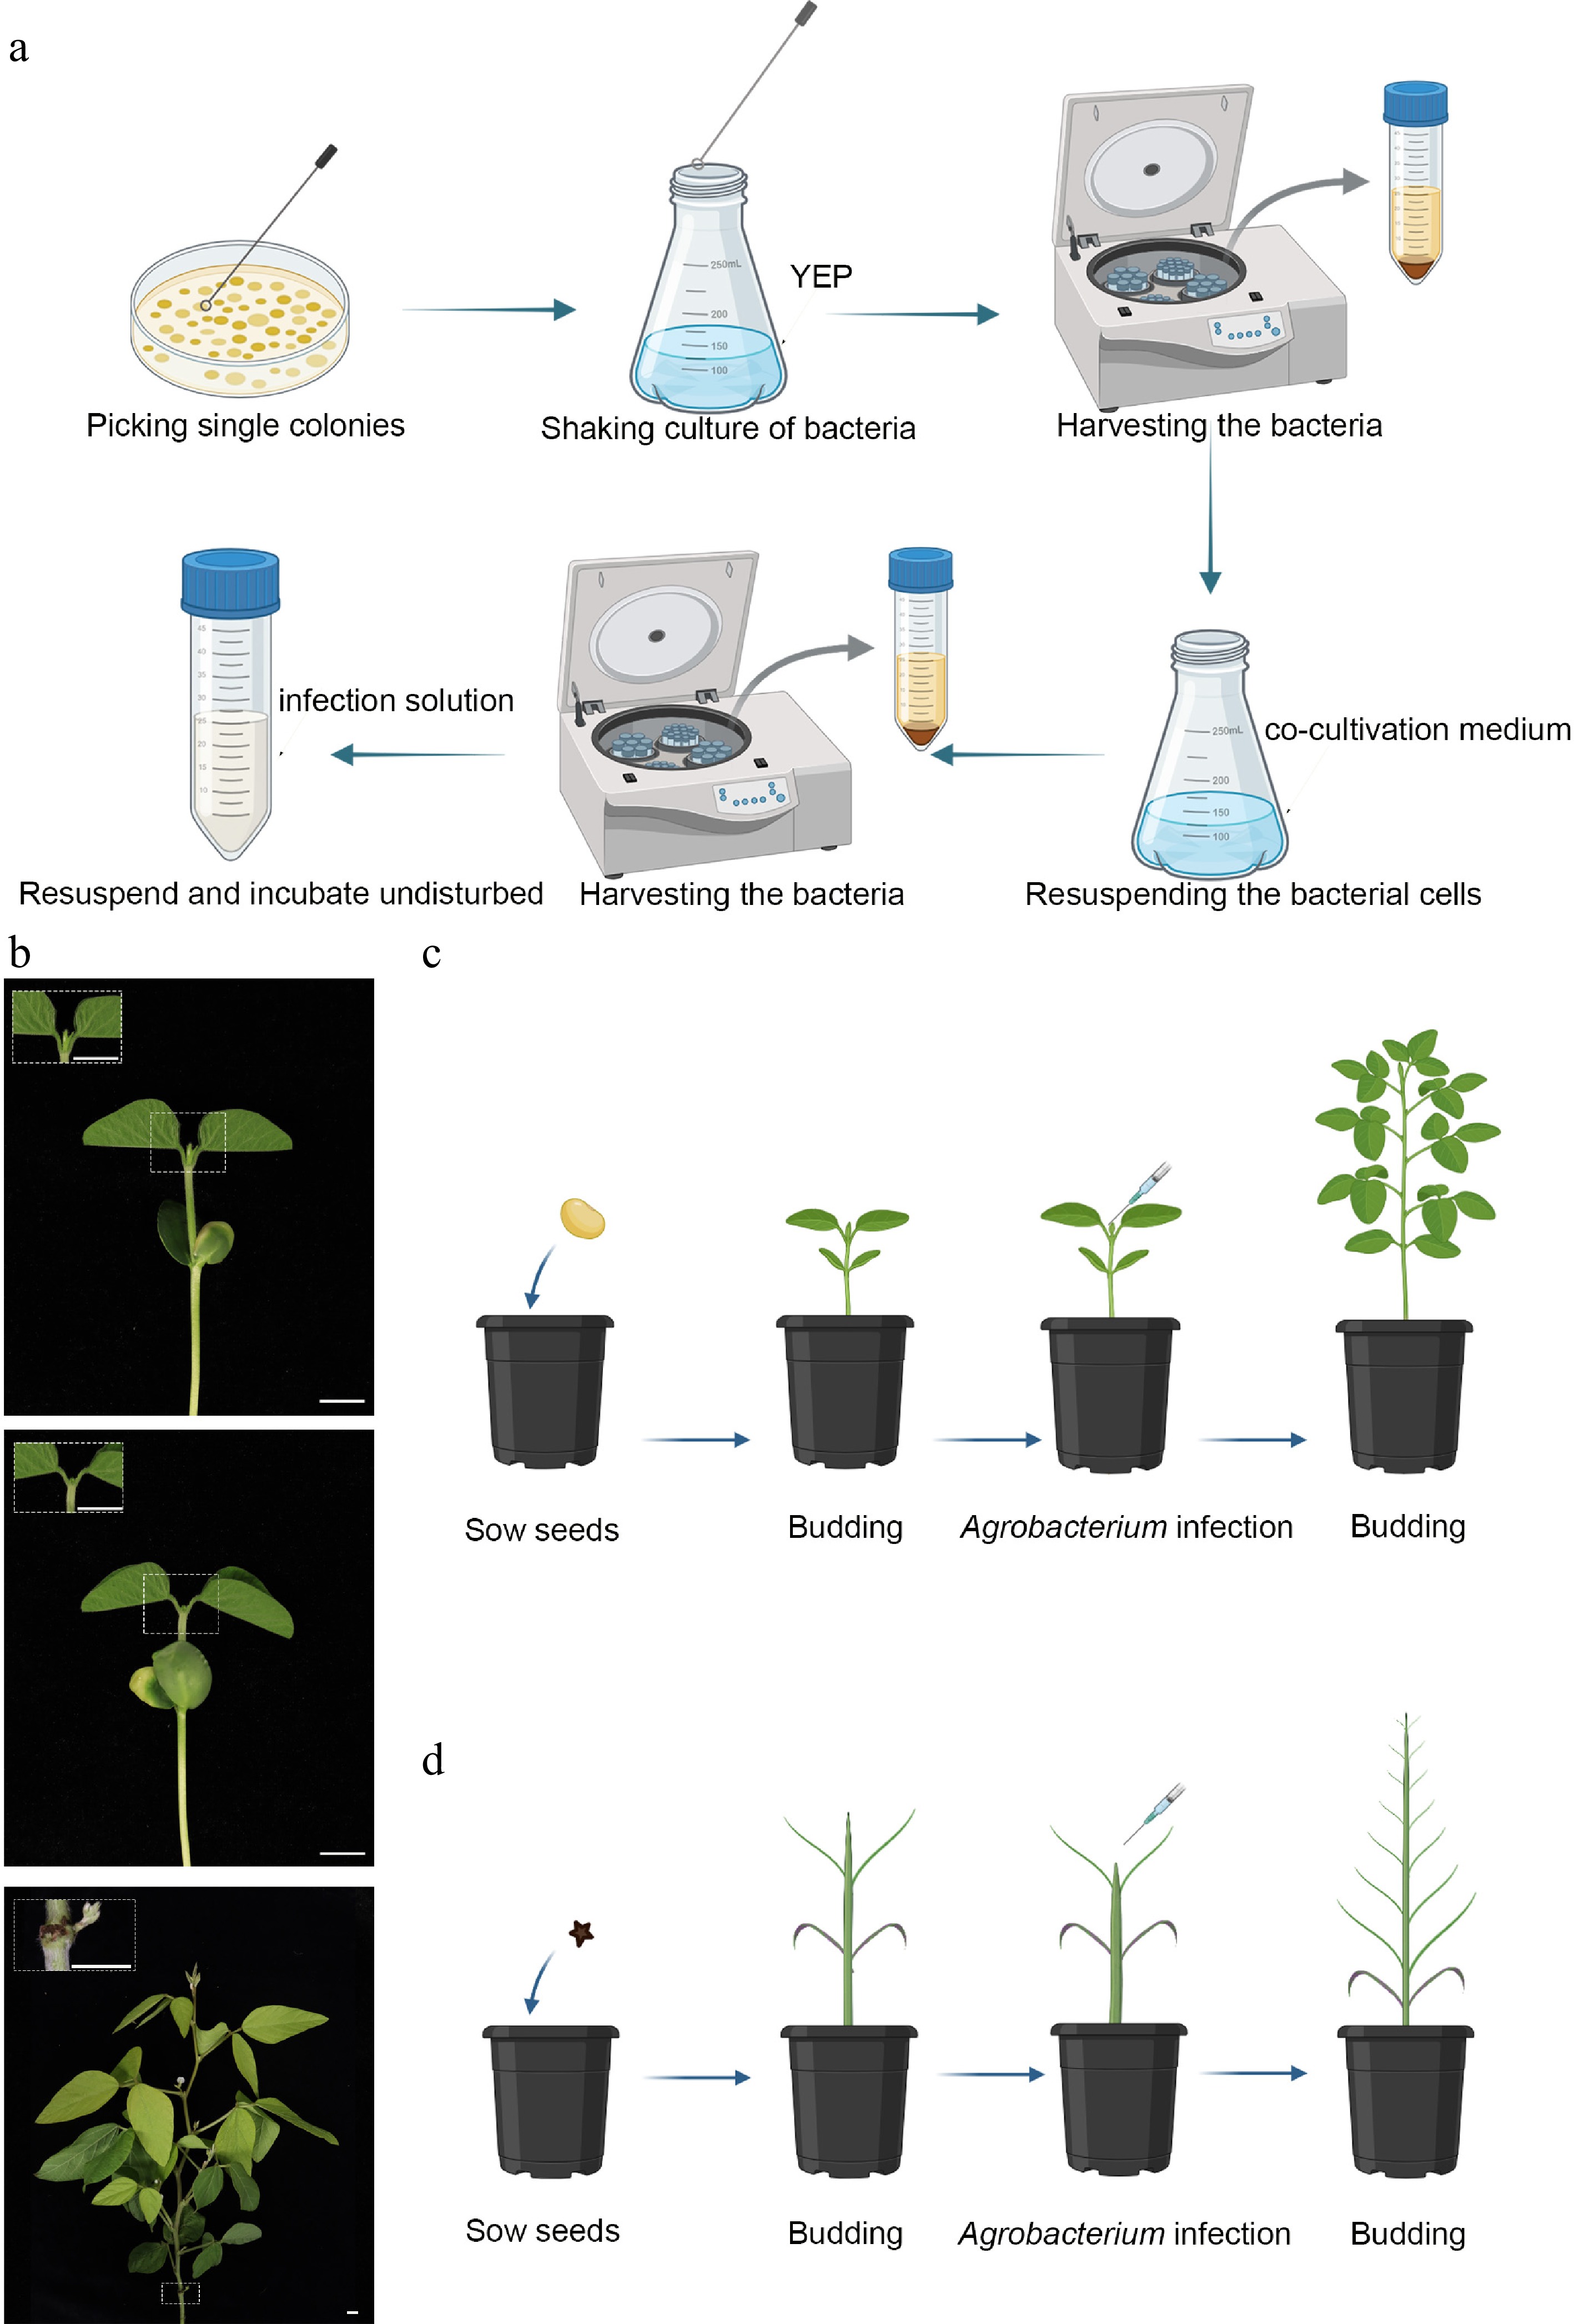
Figure 1.
Gene transformation methods for soybean and S. glauca. (a) Preparation of the A. tumefaciens suspension. A single colony was picked and inoculated into YEP medium, followed by incubation with overnight shaking under optimal conditions. The bacterial cells were harvested, the OD600 value was adjusted, and the culture was transferred to the co-cultivation medium for an additional overnight incubation. The cells were then collected again, resuspended in the infection solution, and incubated in the dark until use. Figure was created with BioRender;
https://app.biorender.com/illustrations/canvas-beta/6945203f781eec89c8bf494e . (b) Tissue culture-free organ regeneration of soybean. After sowing, the plants were grown to the seedling stage; positive shoots appear 1–2 weeks after inoculation, and transgenic seeds can be harvested after about 4 months. Scale bar = 1 cm. (c) Schematic representation of soybean transformation. Figure was created with BioRender;https://app.biorender.com/illustrations/canvas-beta/6945203f781eec89c8bf494e . (d) Schematic representation of S. glauca transformation. The time from sowing to the first pair of cotyledons takes about 1 week, positive shoots appear within 1–2 weeks after infection, and transgenic seeds can be harvested after about 5 months. Figure was created with BioRender;https://app.biorender.com/illustrations/canvas-beta/6945203f781eec89c8bf494e . -
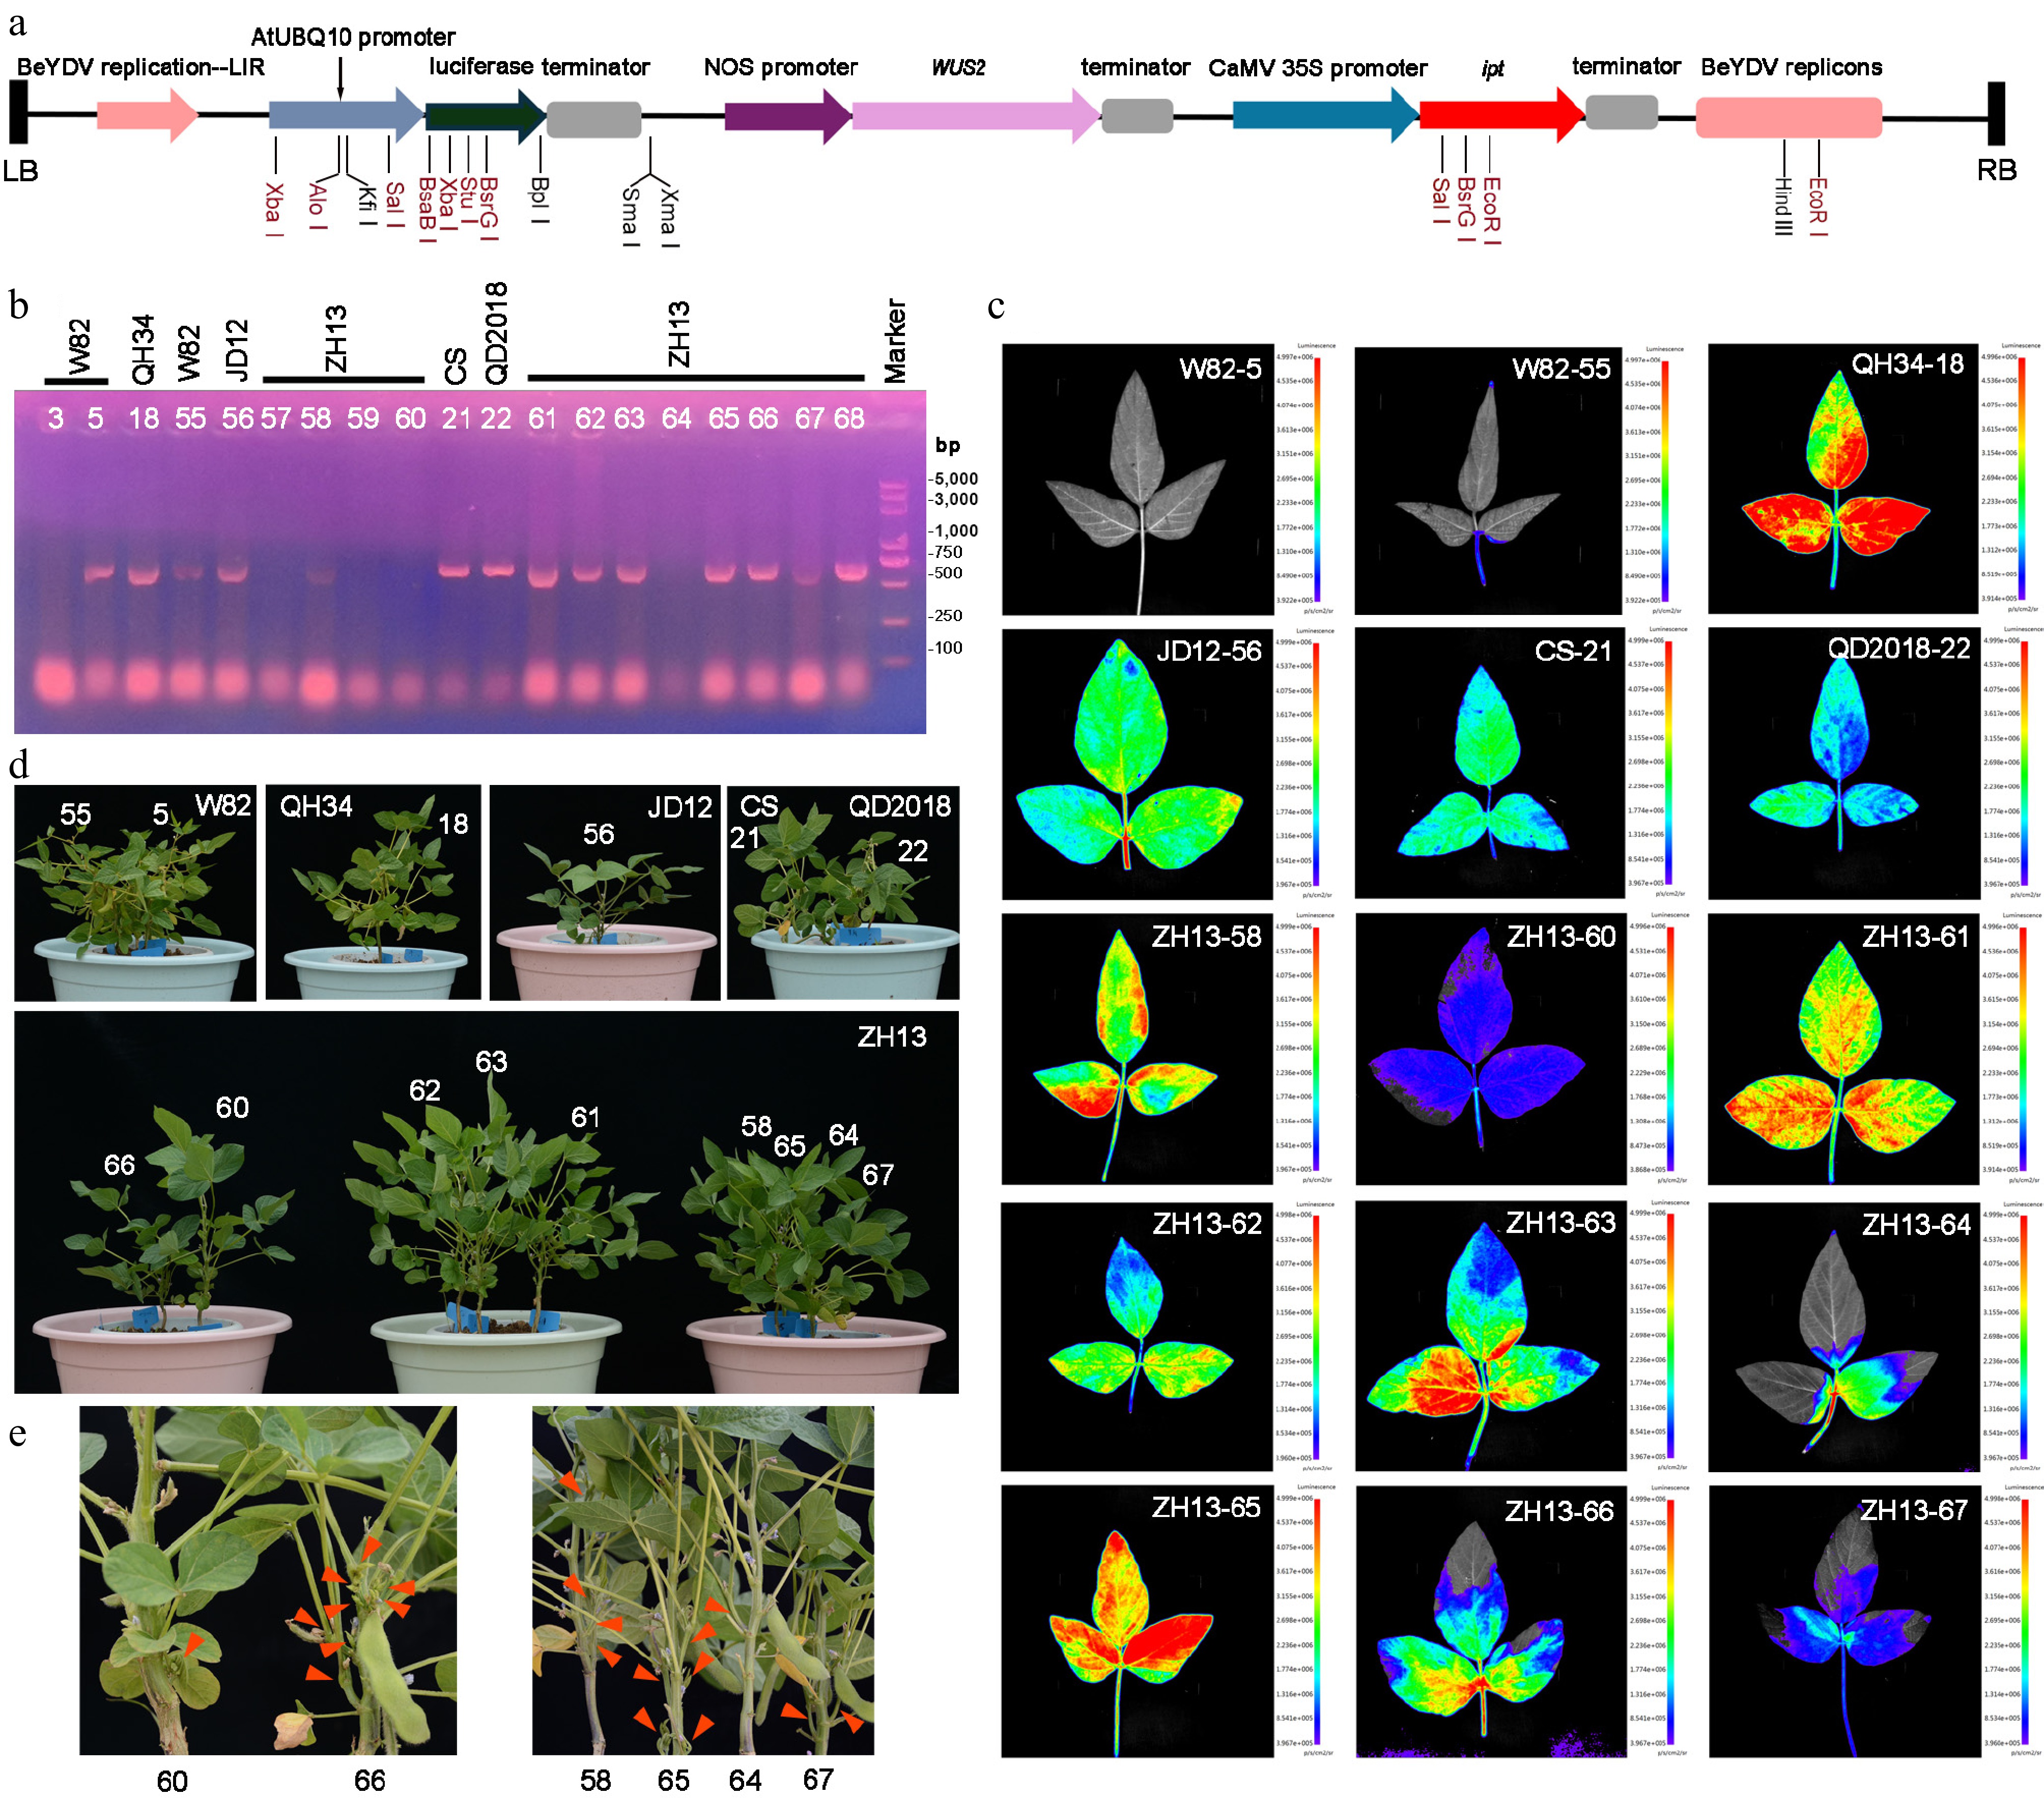
Figure 2.
Identification of transformed soybean seedlings across different cultivars. (a) Expression cassette of the vector pMKV057. Black labels indicate single-restriction enzyme sites, whereas red labels indicate double-restriction enzyme sites. (b) PCR-based identification of the ipt gene in transformed seedlings from different cultivars. Transformation-positive frequency = number of PCR-positive plants (14)/total number of surviving inoculated plants (19) = 73.7%. This experiment was independently repeated twice, and representative experimental data are presented in this study. (c) Detection of luciferase fluorescence in transformed seedlings across different cultivars. (d) Growth performance of transformed seedlings. (e) Flowering and pod development in transformed seedlings and negative controls (red arrows indicate flowers).
-
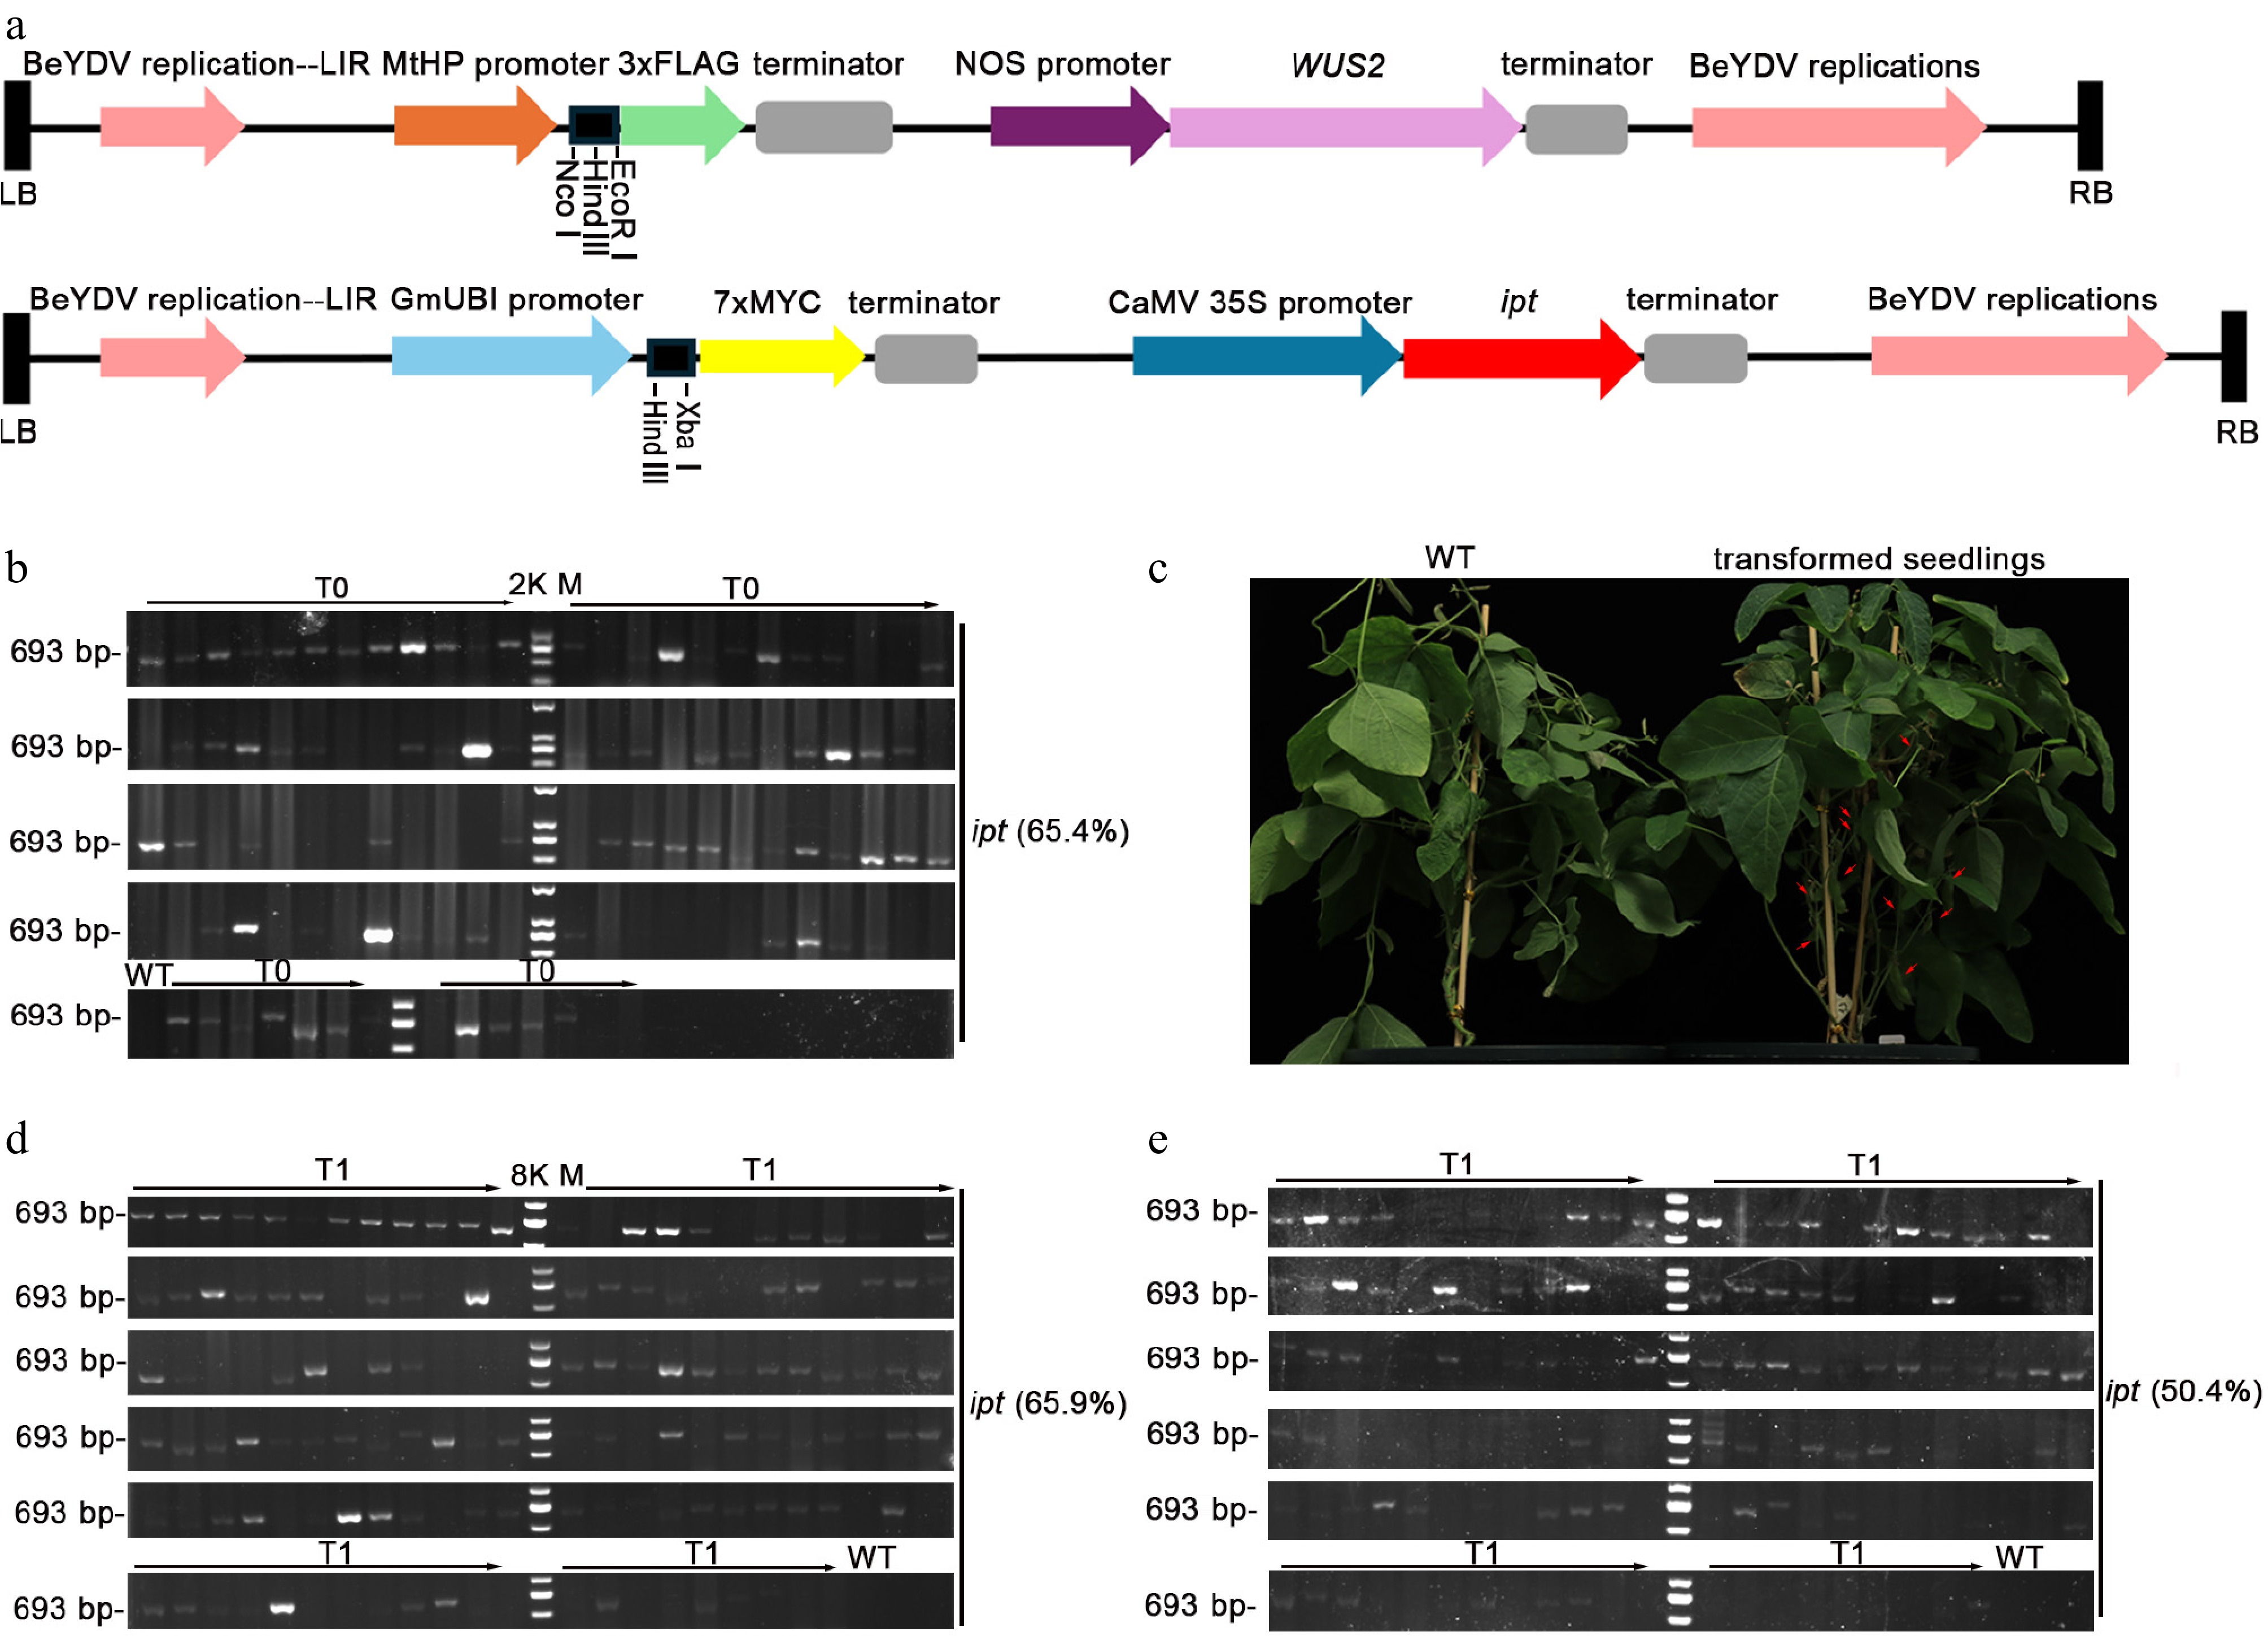
Figure 3.
Vector schematic and transformation-positive frequency. (a) Schematic representation of the vector's expression cassette (single-restriction enzyme sites are indicated in black). (b) Transformation-positive frequency in the soybean germplasm ChiDou. Transformation-positive frequency = number of PCR-positive plants (72)/total number of surviving inoculated plants (110) = 65.4%. This experiment was independently repeated twice, and representative experimental data are presented in this study. (c) Phenotype of transformed seedlings. Scale bar = 1 cm. (d) Transformation-positive frequency in the aboveground parts of T1 generation of the soybean germplasm ChiDou. Transformation-positive frequency = number of PCR-positive plants (93)/total number of surviving inoculated plants (141) = 65.9%. (e) Transformation-positive frequency in the underground parts of the T1 generation of the soybean germplasm ChiDou. Transformation-positive frequency = number of PCR-positive plants (71)/total number of surviving inoculated plants (141) = 50.4%.
-
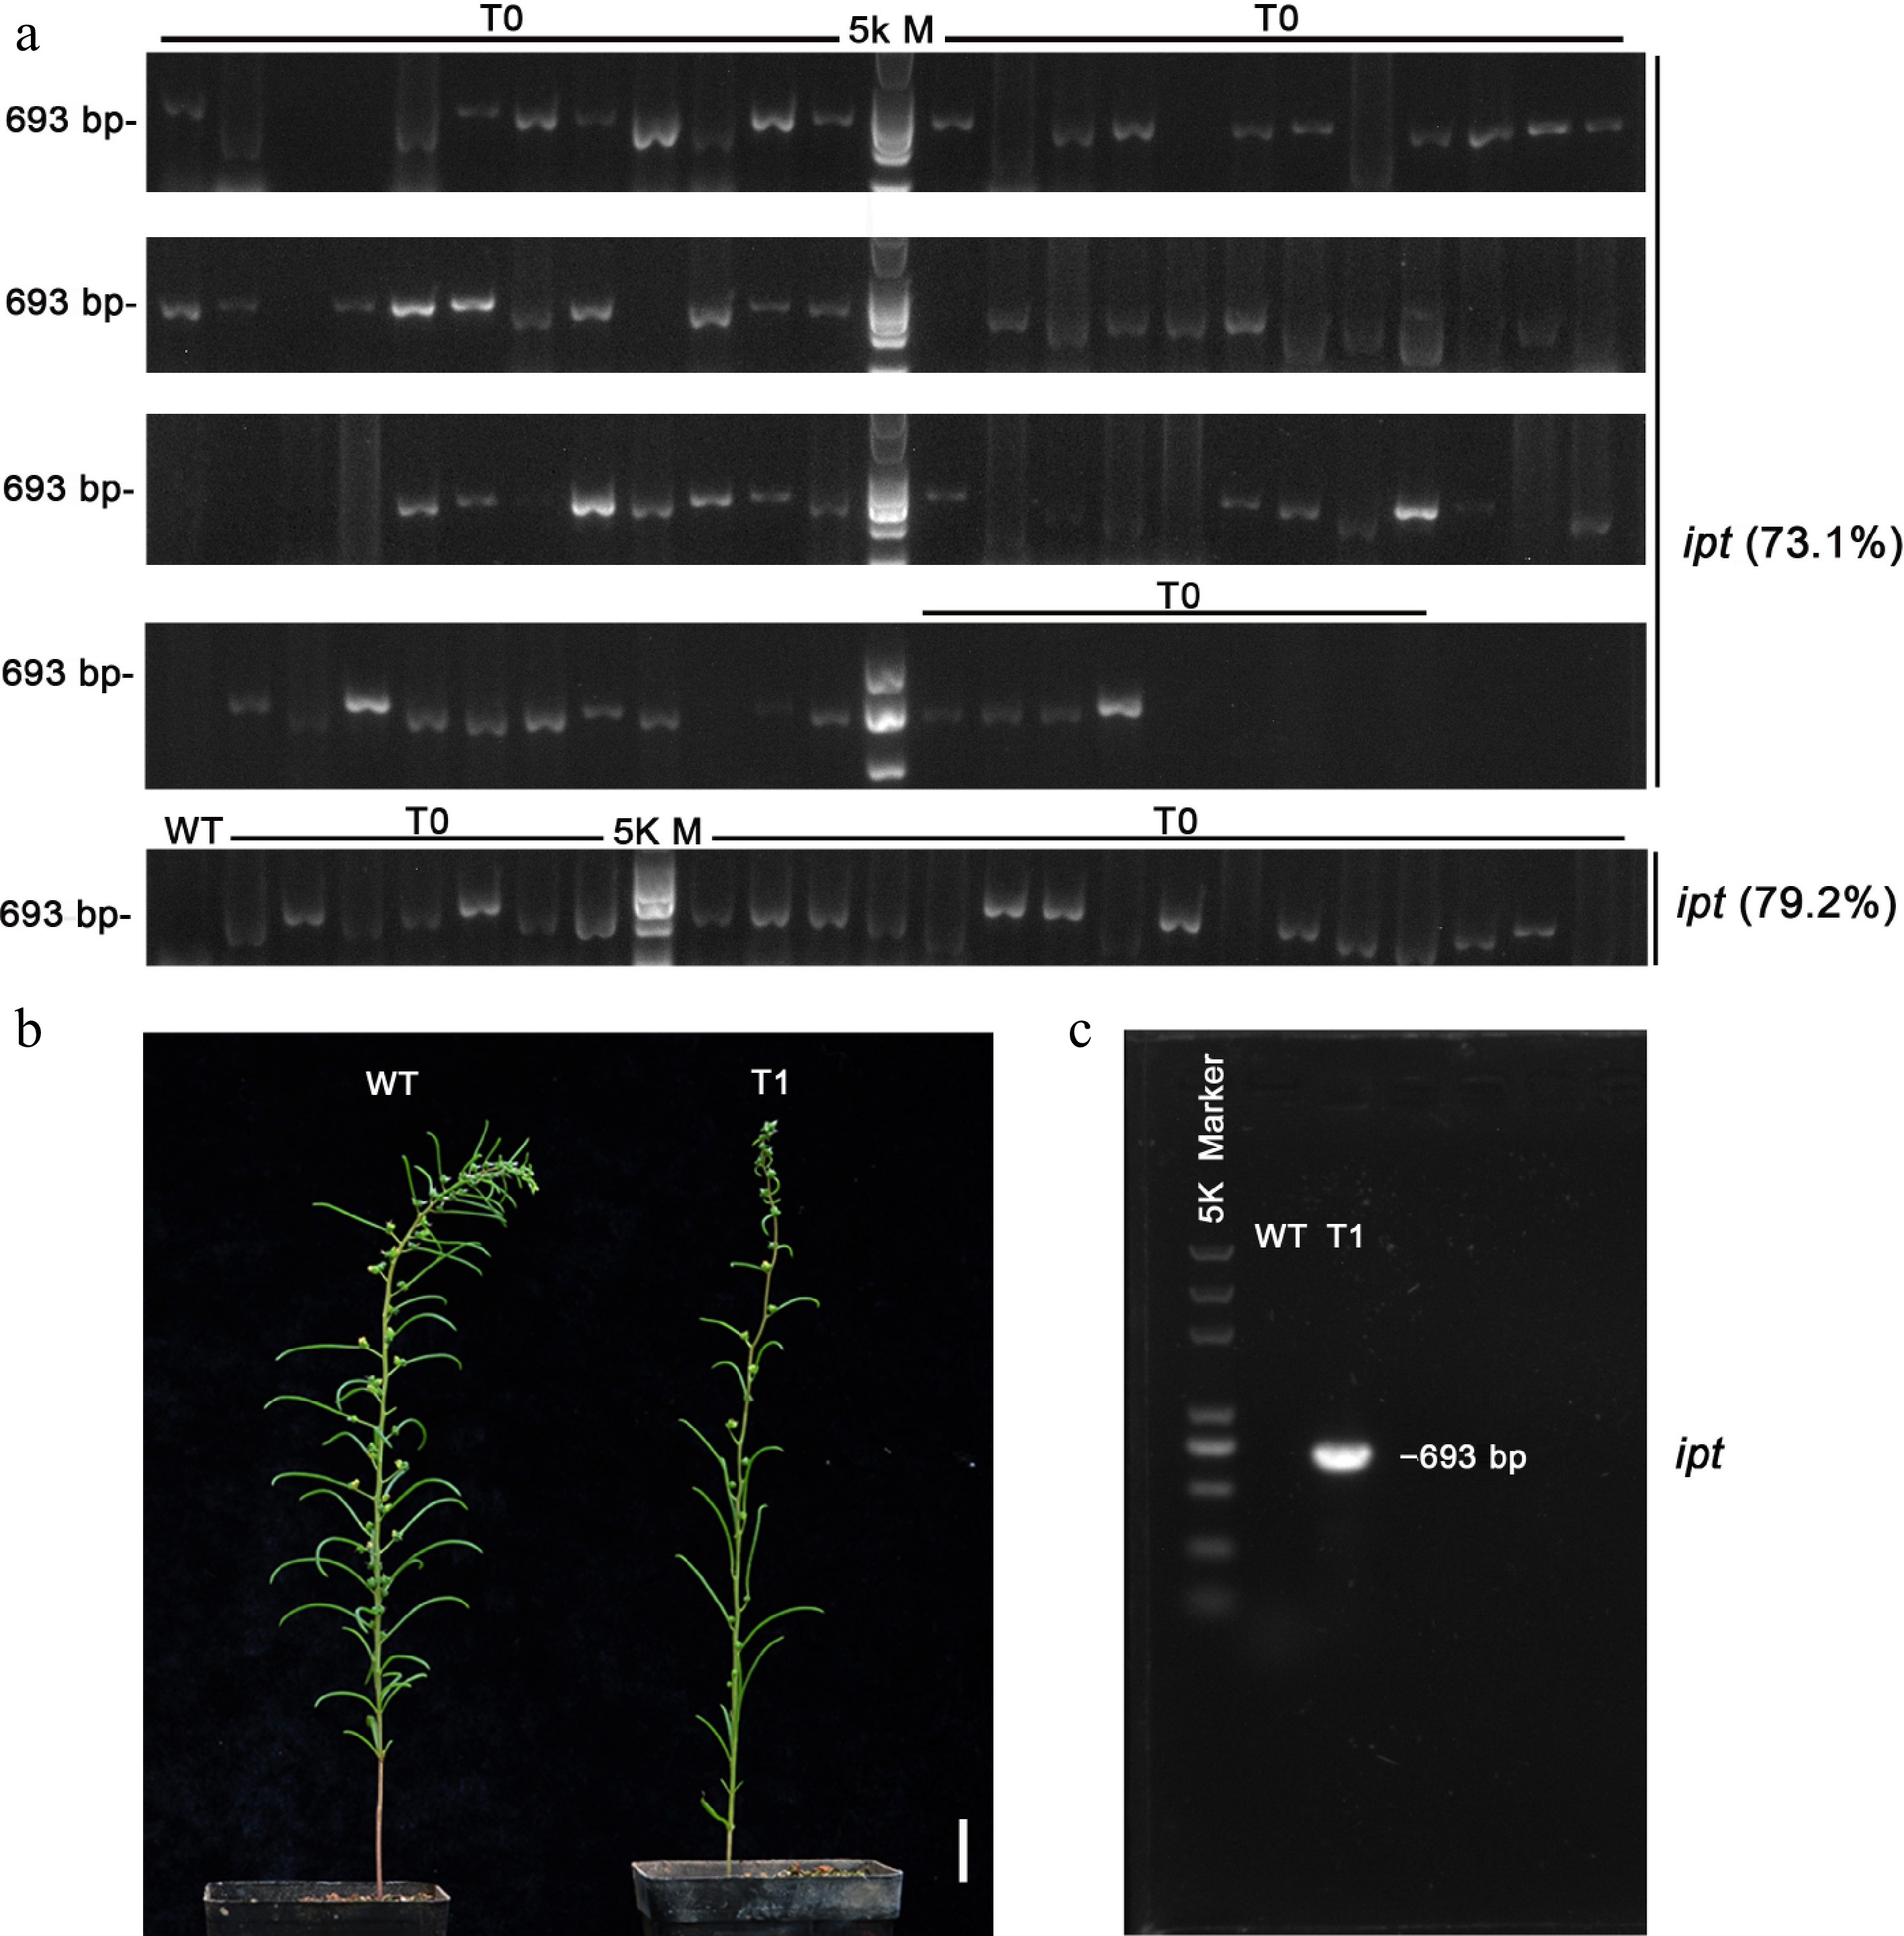
Figure 4.
Identification of T1 transgenic S. glauca seedlings. (a) Identification of T0 transgenic S. glauca. Transformation-positive frequency = number of PCR-positive plants (68)/total number of surviving inoculated plants (93) = 73.1%. Transformation-positive frequency = number of PCR-positive plants (19)/total number of surviving inoculated plants (24) = 79.2%. This experiment was independently repeated twice, and representative experimental data are presented in this study. (b) Phenotype of T1 transgenic S. glauca. Scale bar = 1 cm. (c) Detection of the ipt gene in T1 transgenic S. glauca.
Figures
(4)
Tables
(0)