-
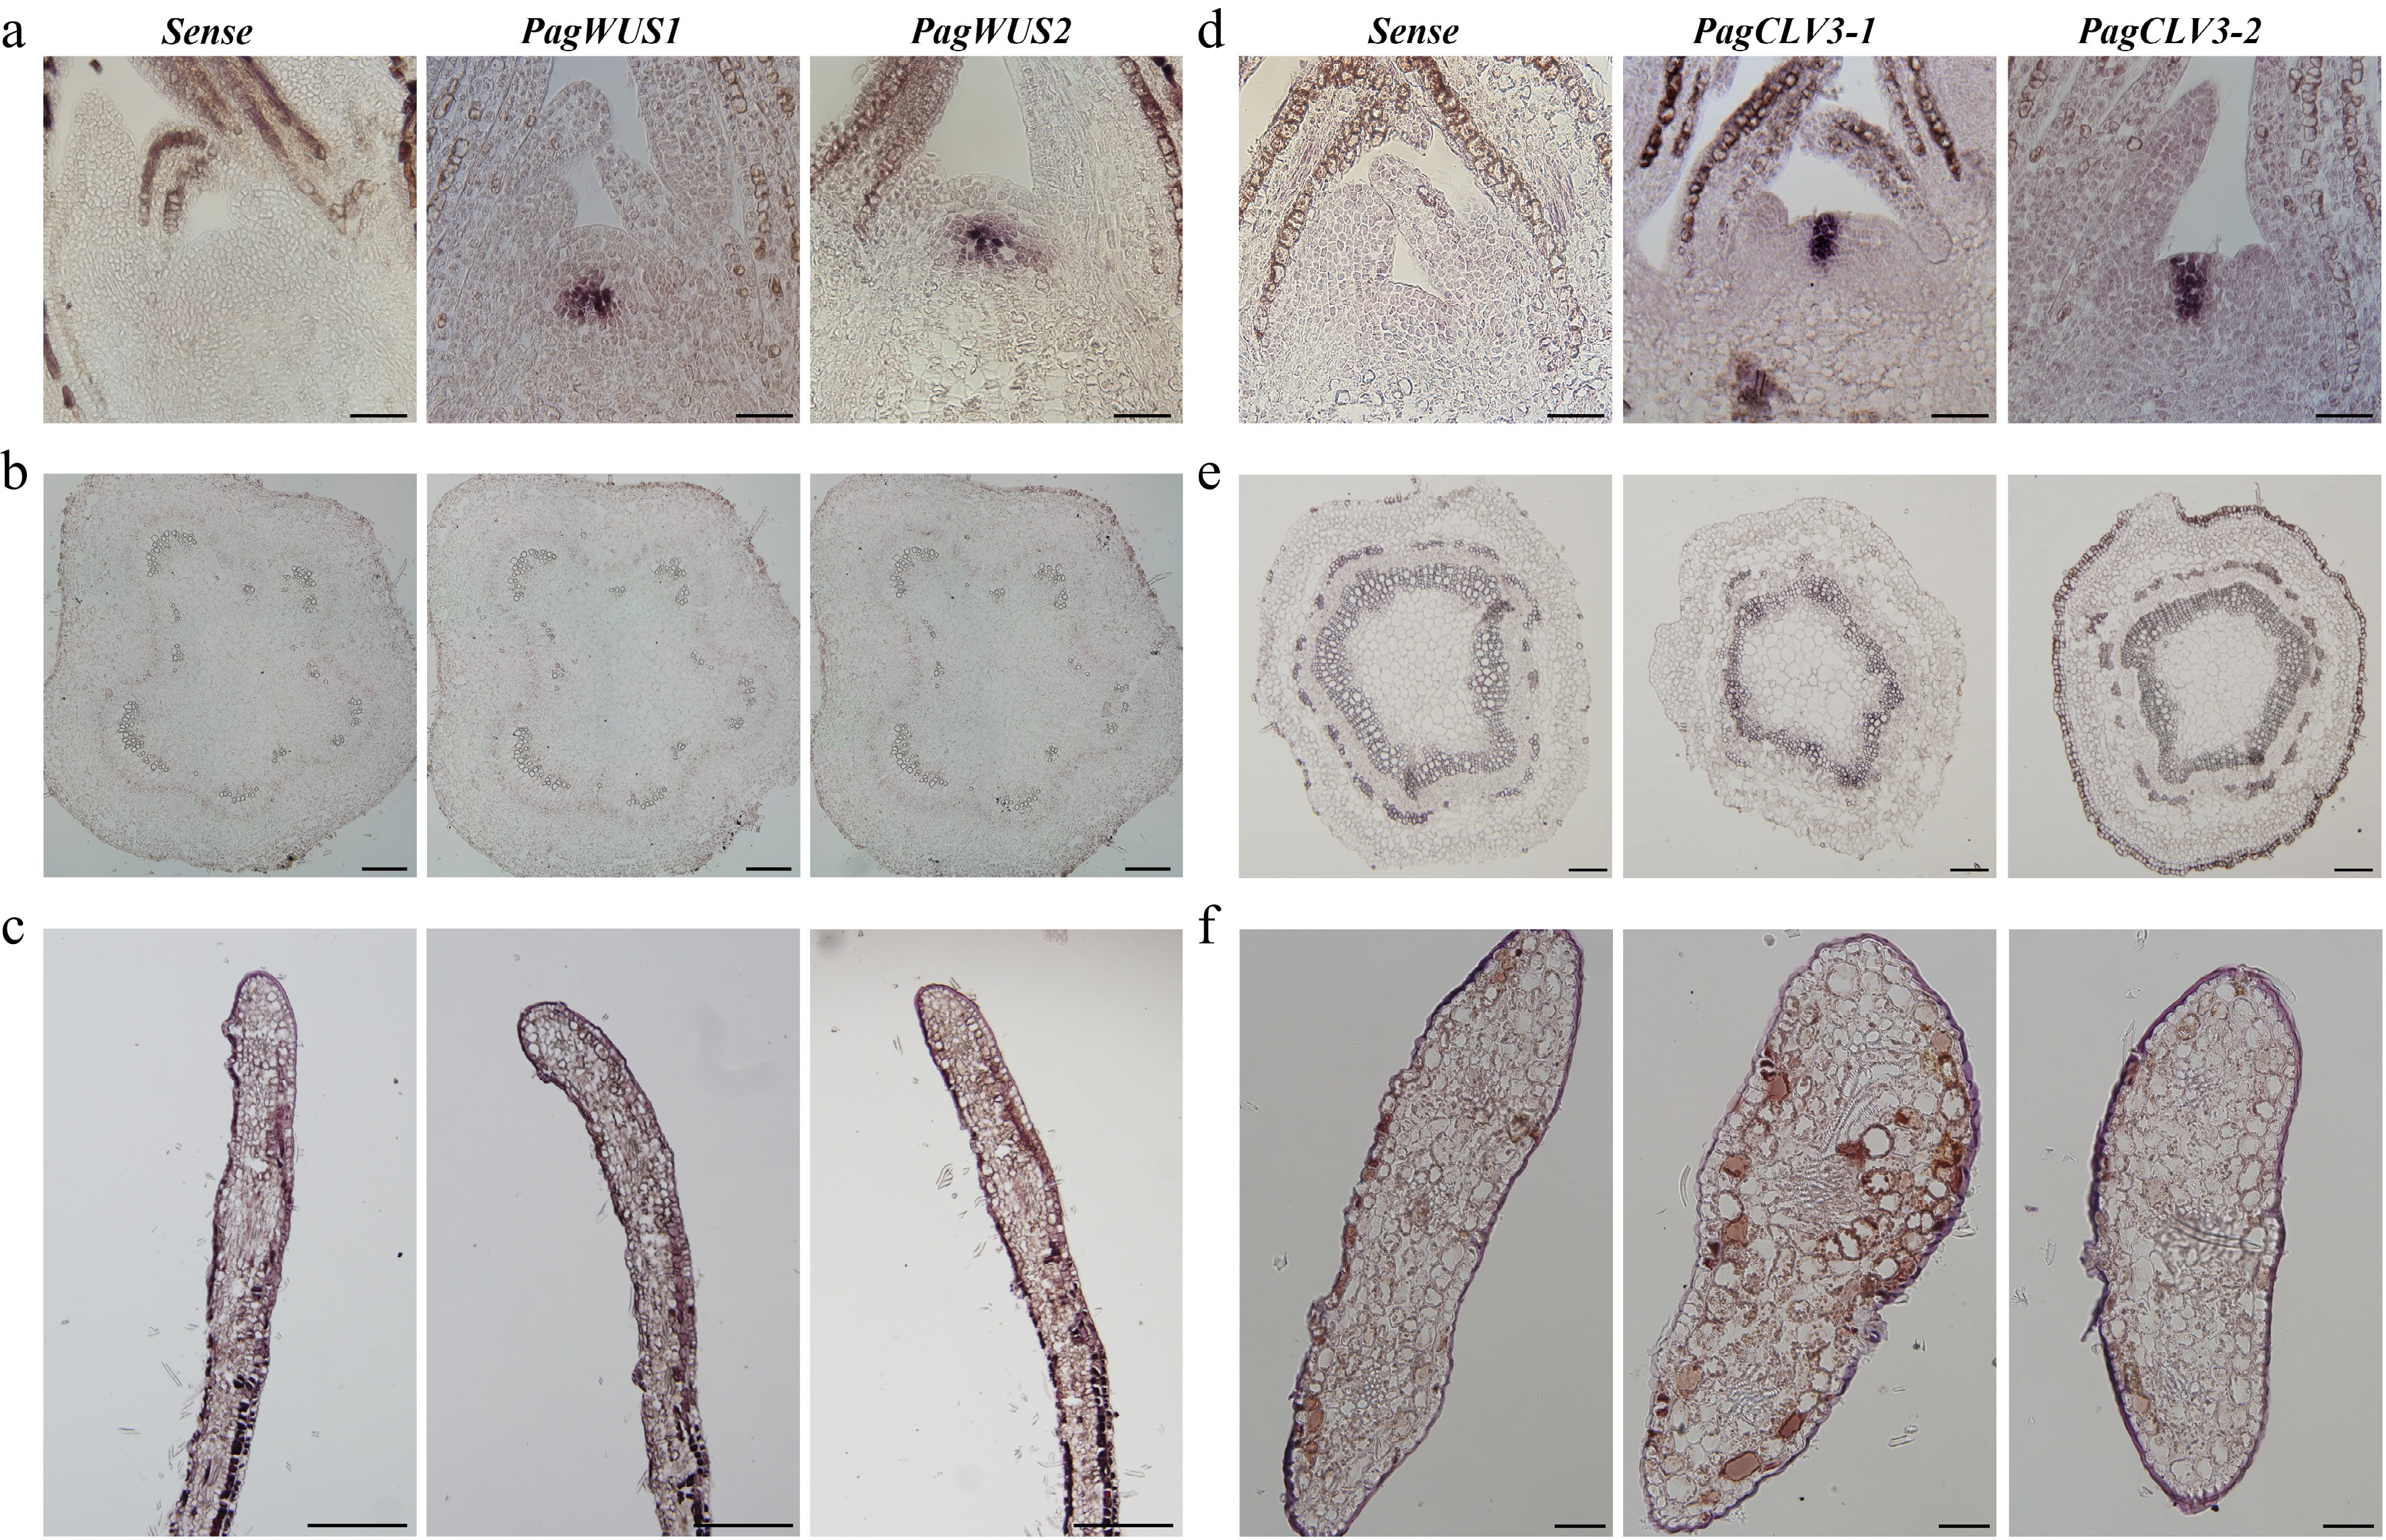
Figure 1.
Expression patterns of PagWUS1/2 and PagCLV3-1/2 as detected by in situ hybridization. Signals of PagWUS1 and PagWUS2 transcripts were (a) present in the organizing center (OC) of shoot meristem, but (b) absent from the cross section of third internode, and (c) longitudinal section of young leaf. Signals of PagCLV3-1 and PagCLV3-2 transcripts were (d) localized in the central zone (CZ) of shoot meristem, but (e) absent from the cross section of fifth internode, and (f) cross section of young leaf. Sense probe controls are shown in the left column. Bar = 100 μm.
-
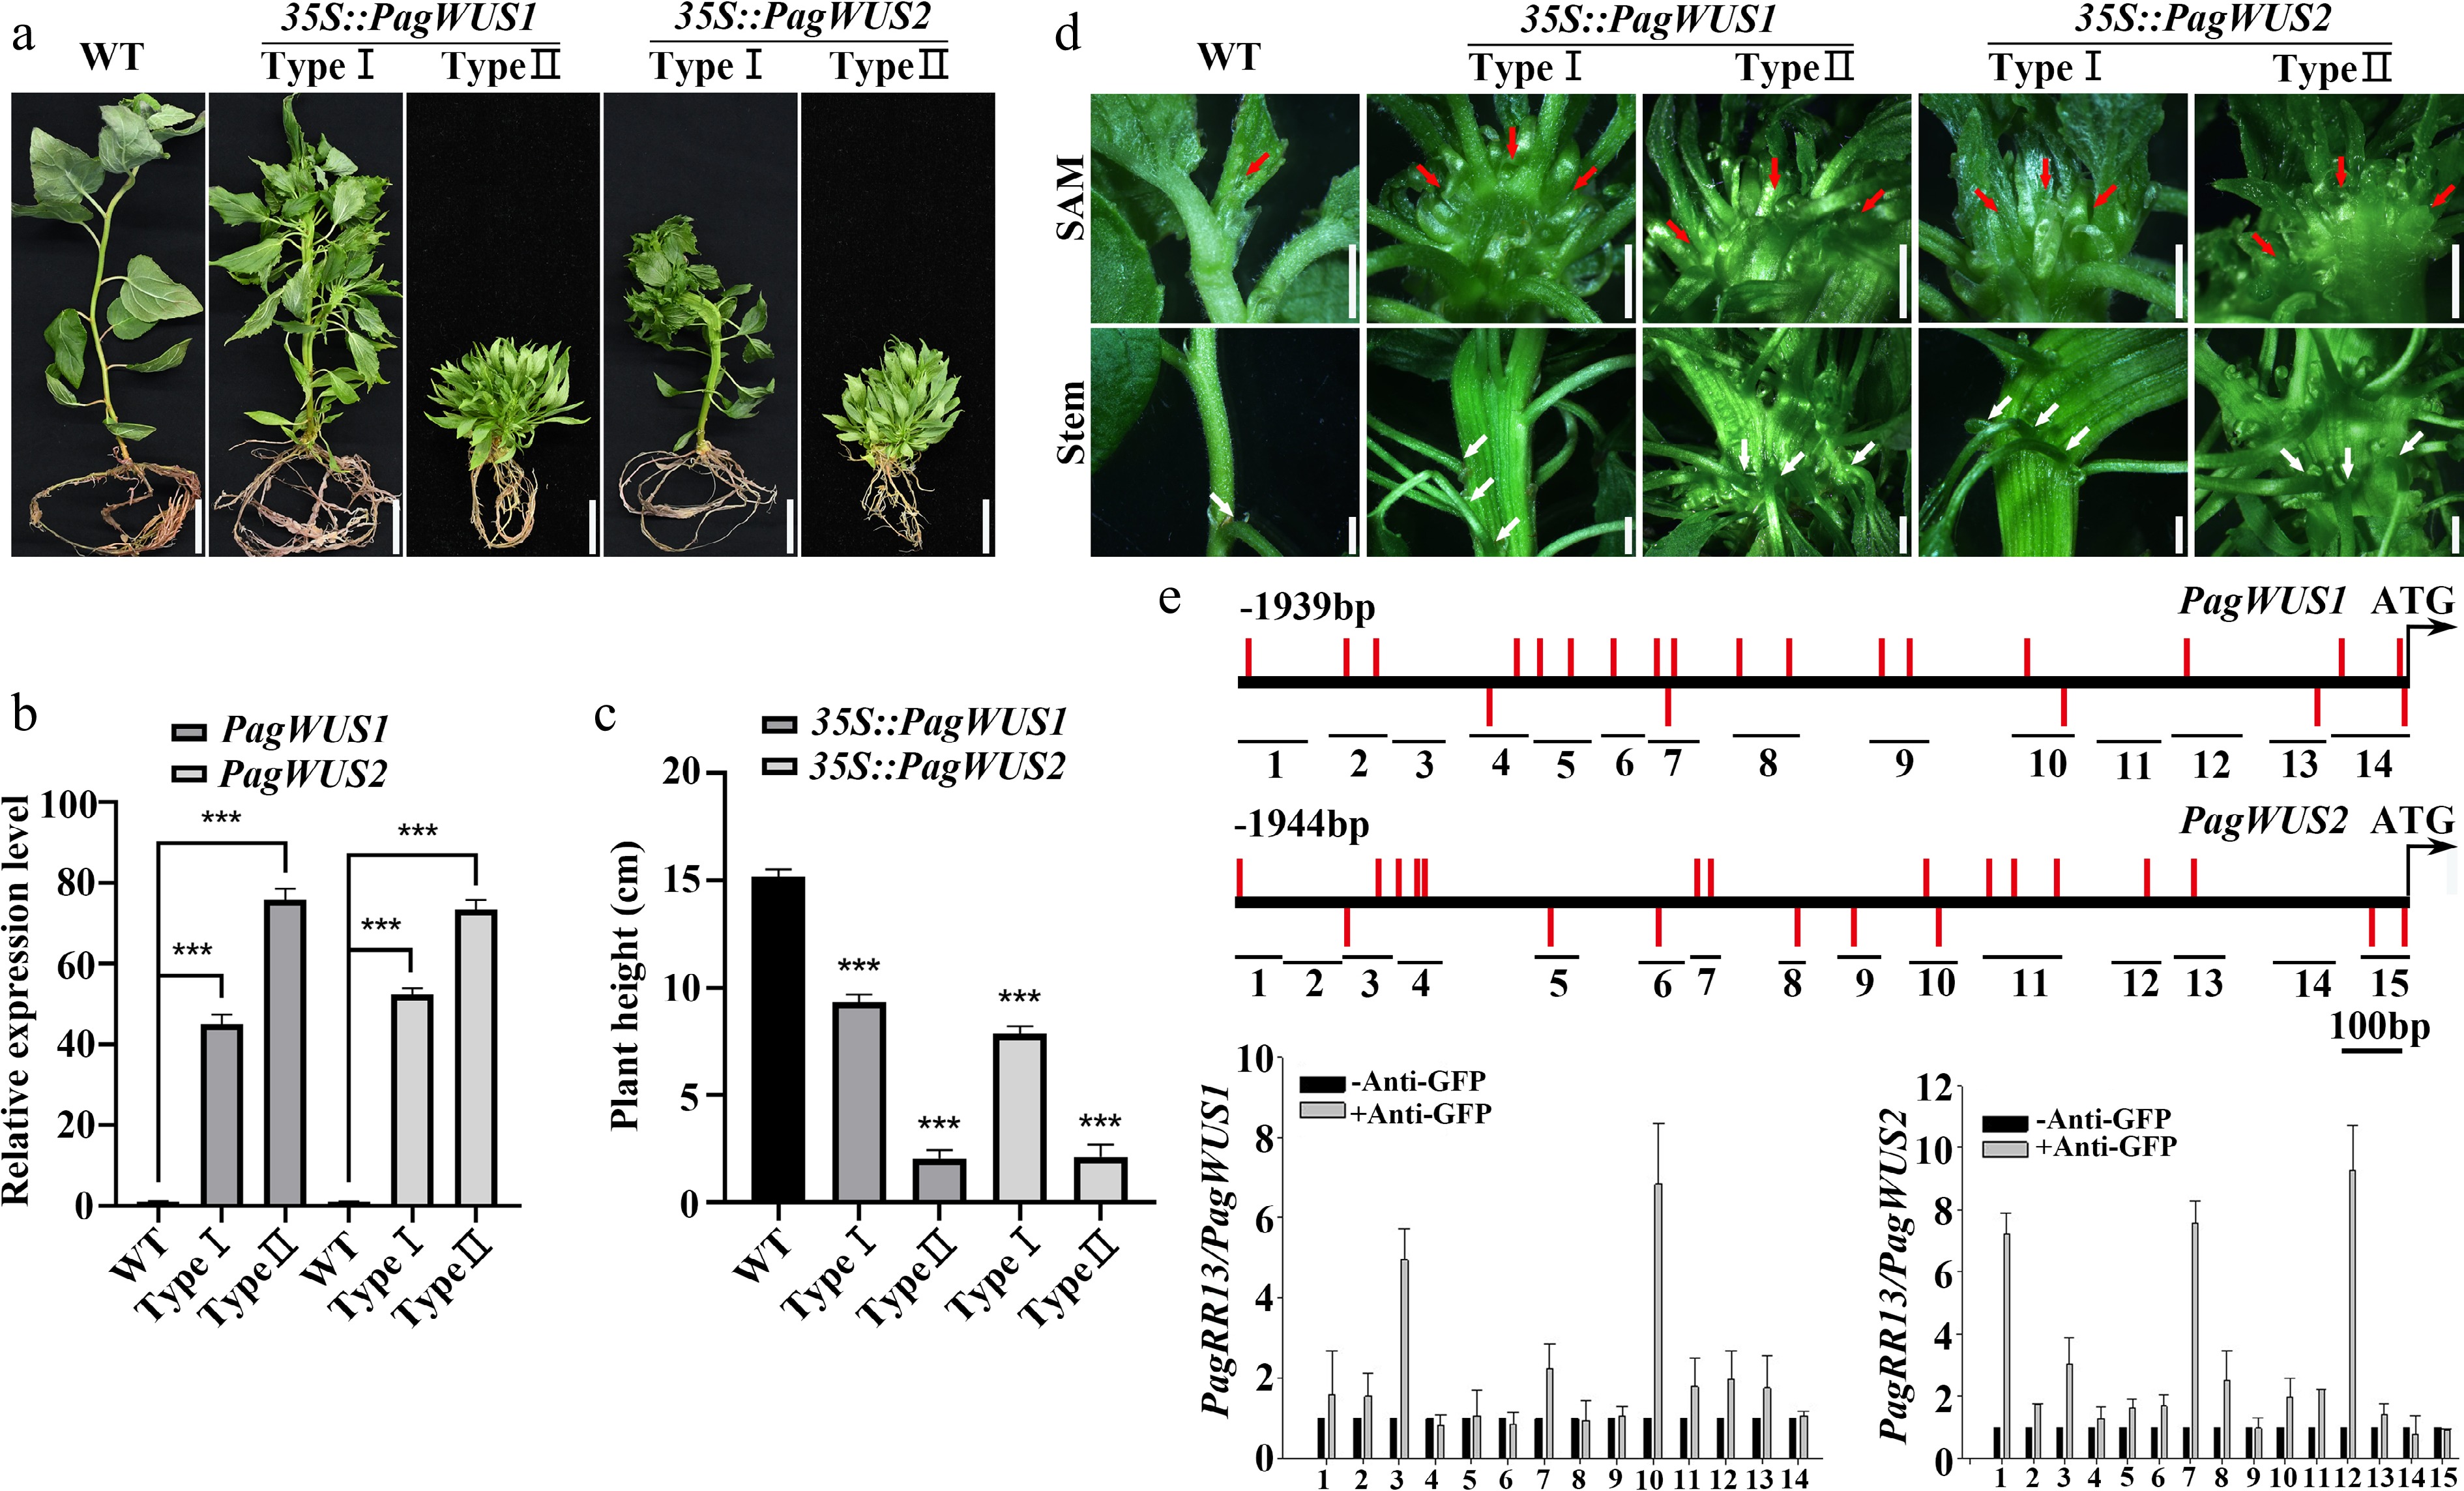
Figure 2.
PagWUS1/2 positively regulate shoot meristem activity. (a) Phenotype of 35S::PagWUS1 and 35S::PagWUS2 seedlings. Bar = 2 cm. (b) Correlation between relative transcript levels of PagWUS1/2 and phenotype severity of overexpressing lines. (c) Plant height of 35S::PagWUS1 and 35S::PagWUS2 saplings. (d) Fasciated shoot meristem and stem with disordered phyllotaxis in 35S::PagWUS1 and 35S::PagWUS2 lines. Red arrows indicate fasciated shoot meristem. White arrows denote disordered phyllotaxis. Bar = 2 mm. (e) ChIP-qPCR results showing association between PagRR13 and PagWUS1/2 promoter fragments. Scheme of promoter regions of PagWUS1 and PagWUS2 is shown above. Black short lines with numbers indicate positions of corresponding fragments used for ChIP-qPCR. Red bars indicate type-B RR binding elements GAT(T/C). Data are mean ± sd of three independent biological repeats. *** Indicates significant difference at p < 0.001 (two-tailed Student’s t-tests).
-
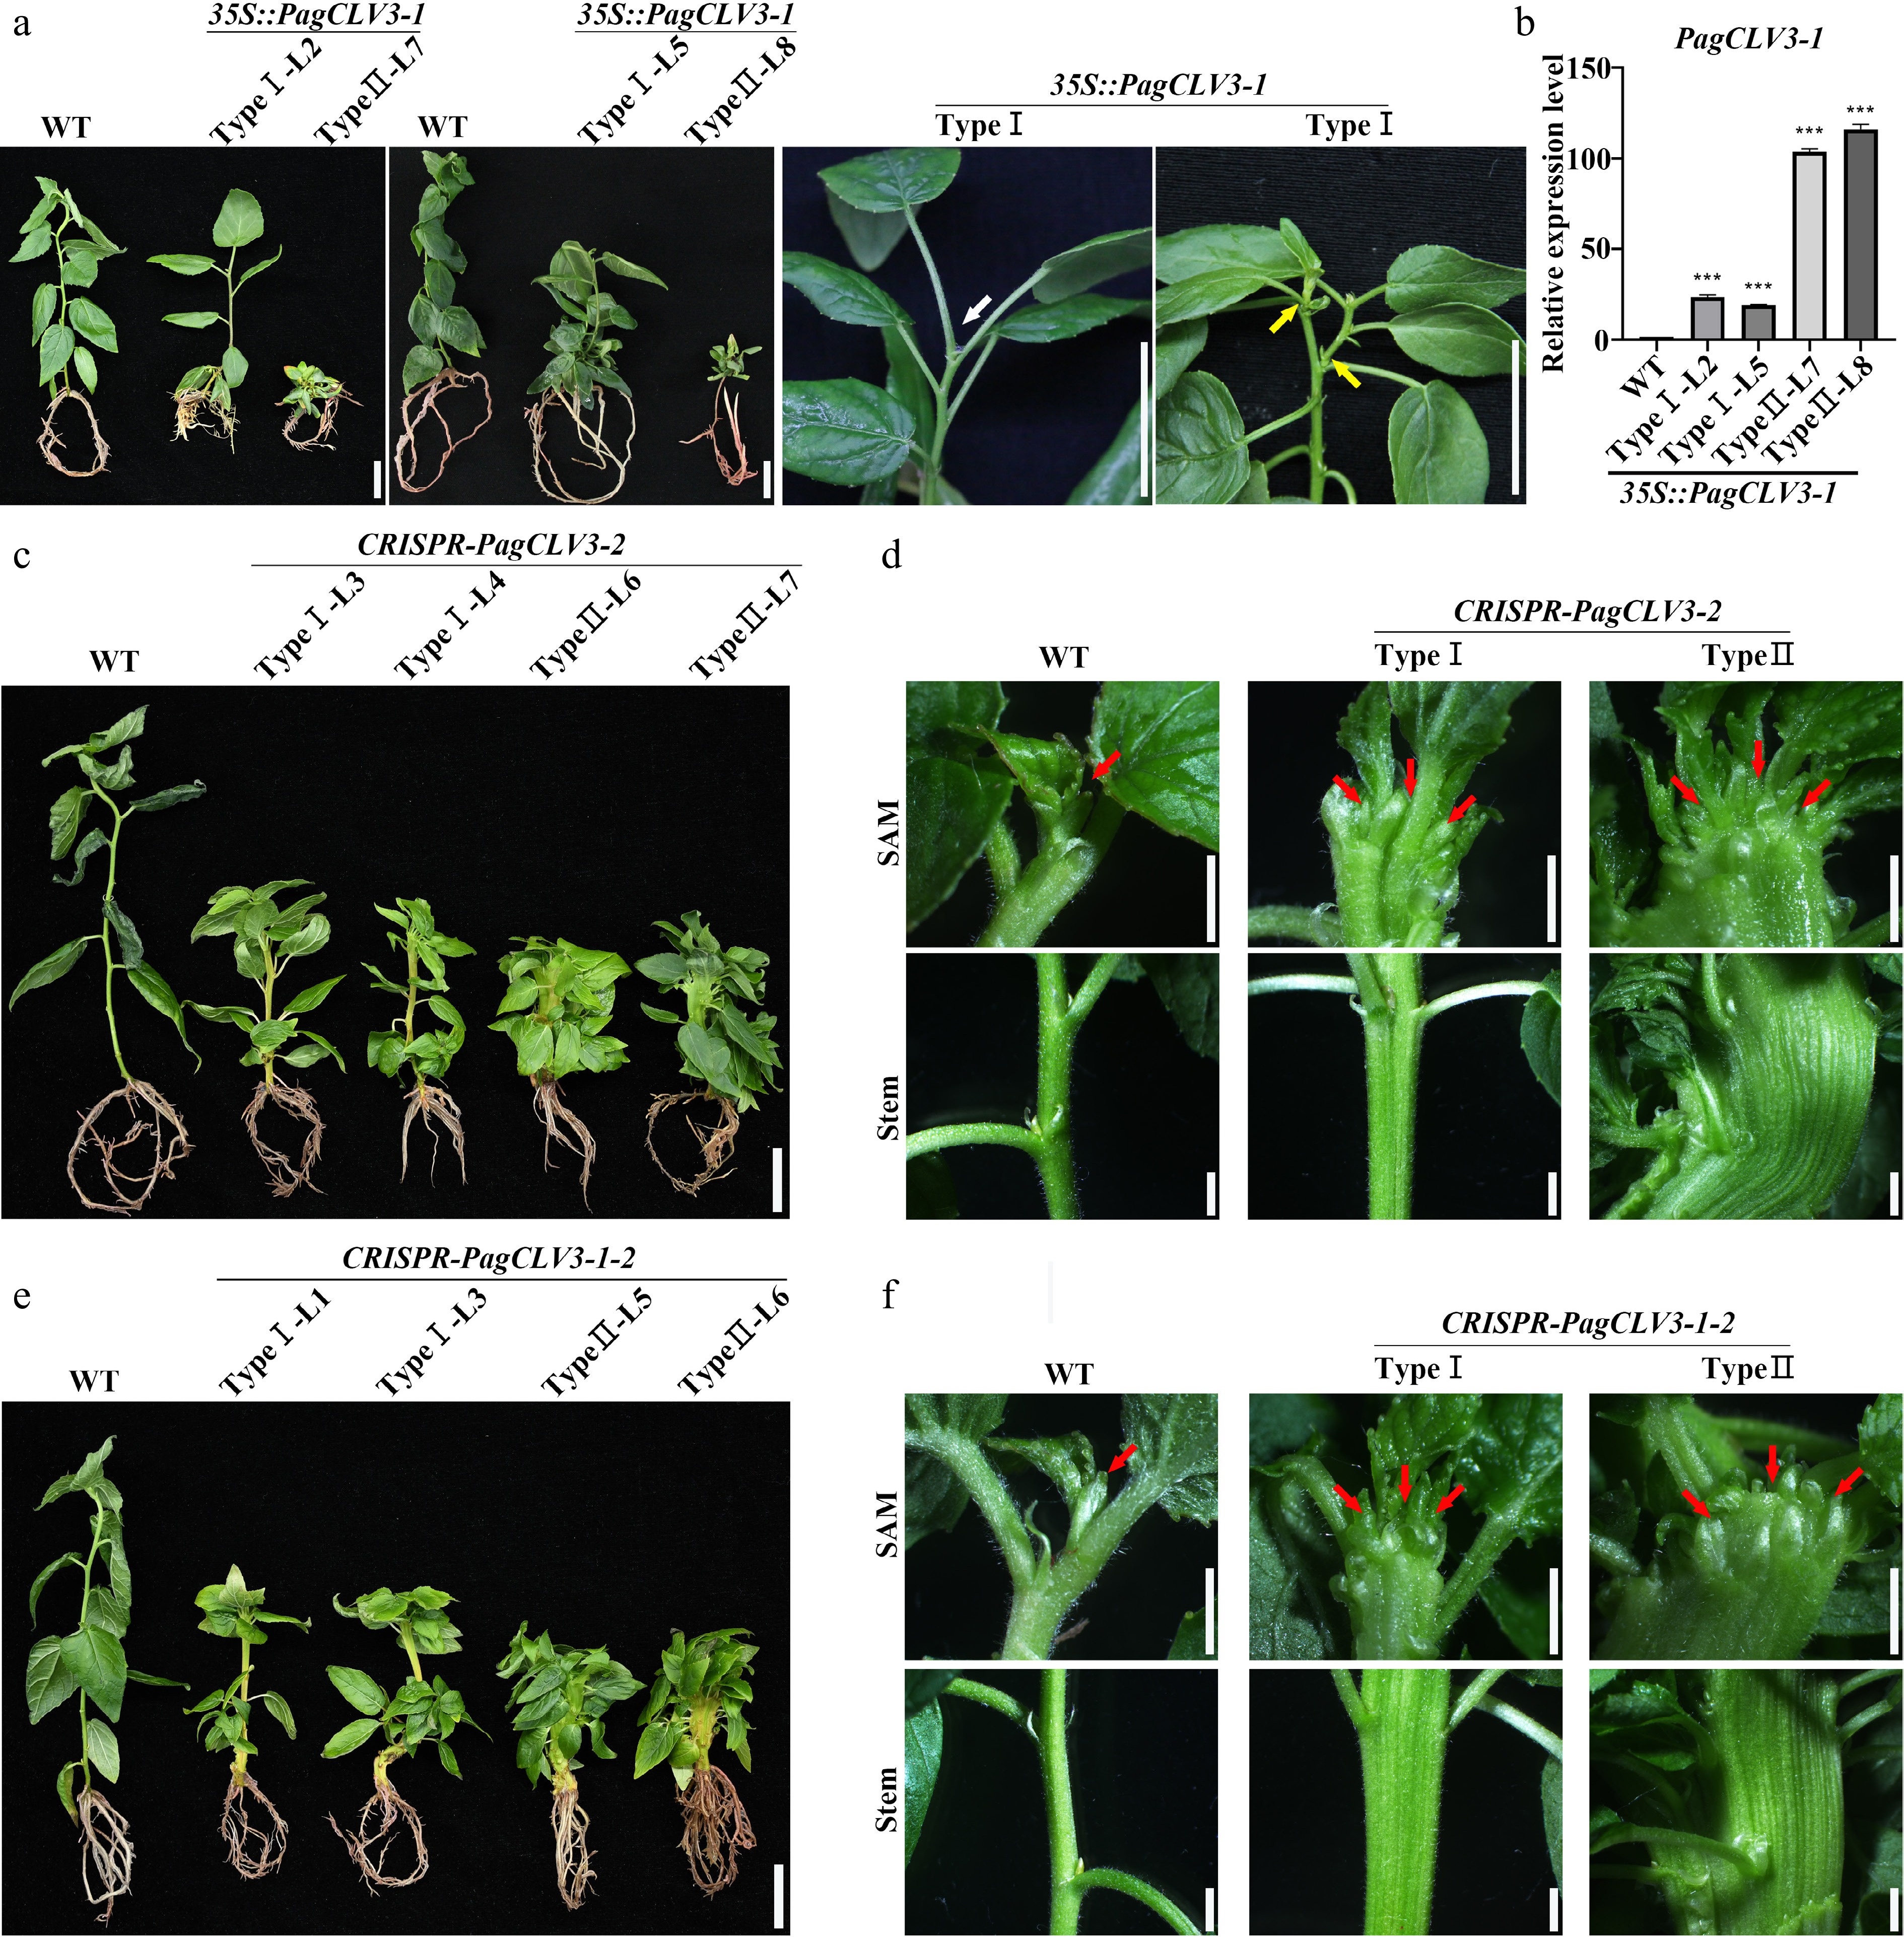
Figure 3.
PagCLV3 negatively regulates shoot meristem maintenance. (a) Phenotype of 35S::PagCLV3-1 seedings. White arrow denotes position of vanished shoot meristem. Yellow arrows indicate axial bud outgrowths. (b) Correlation between relative transcript levels of PagCLV3-1 in 35S::PagCLV3-1 lines and phenotype severity. Data are mean ± sd of three independent biological repeats. (c) Phenotype of CRISPR-PagCLV3-2 seedlings. (d) Fasciation phenotypes of saplings in (c). (e) Phenotype of CRISPR-PagCLV3-1-2 (f) Fasciation phenotypes of saplings in (e). In (d) and (f), red arrows indicate shoot meristem. For (a), bar = 2 cm. For (c) and (e), bar = 2 cm. For (d) and (f), bar = 2 mm. Data are mean ± sd of three independent biological repeats. *** indicates significant difference at p < 0.001 (two-tailed Student’s t-tests).
-
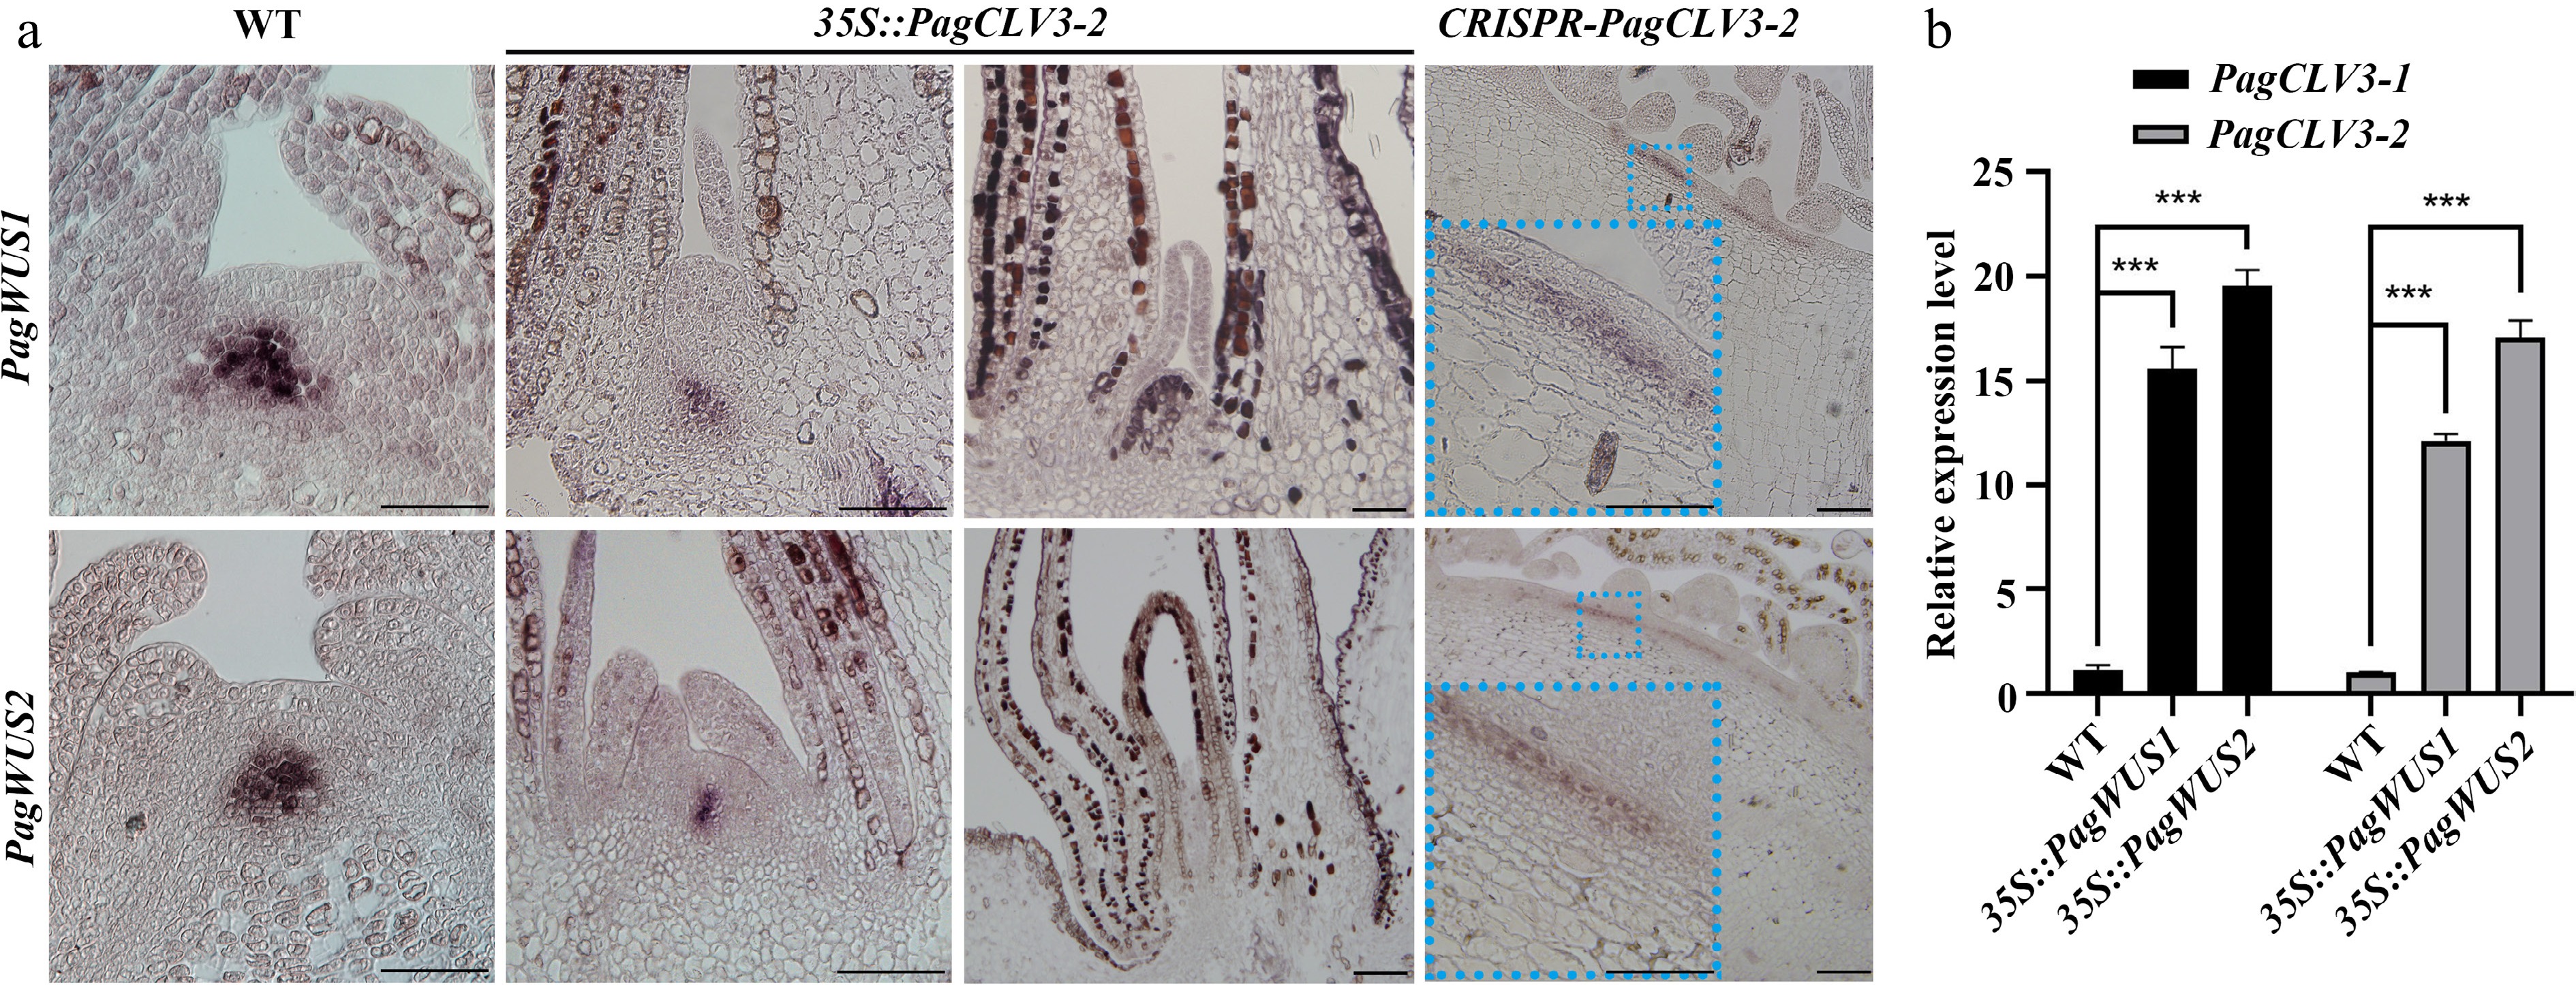
Figure 4.
Negative feedback regulation between transcription of PagWUS and PagCLV3. (a) In situ hybridization of PagWUS1 and PagWUS2 transcripts in shoot meristem of wild-type, 35S::PagCLV3-2, and CRISPR-PagCLV3-2 saplings. Lower left insets in the right column are magnified images of blue dotted rectangles. Bar = 100 μm. (b) qRT-PCR analyses showing increased PagCLV3-1/2 transcript levels in shoot tips of 35S::PagWUS1 and 35S::PagWUS2 saplings. Data are mean ± sd of three independent biological repeats. *** Indicates significant difference at p < 0.001 (two-tailed Student’s t-tests).
-
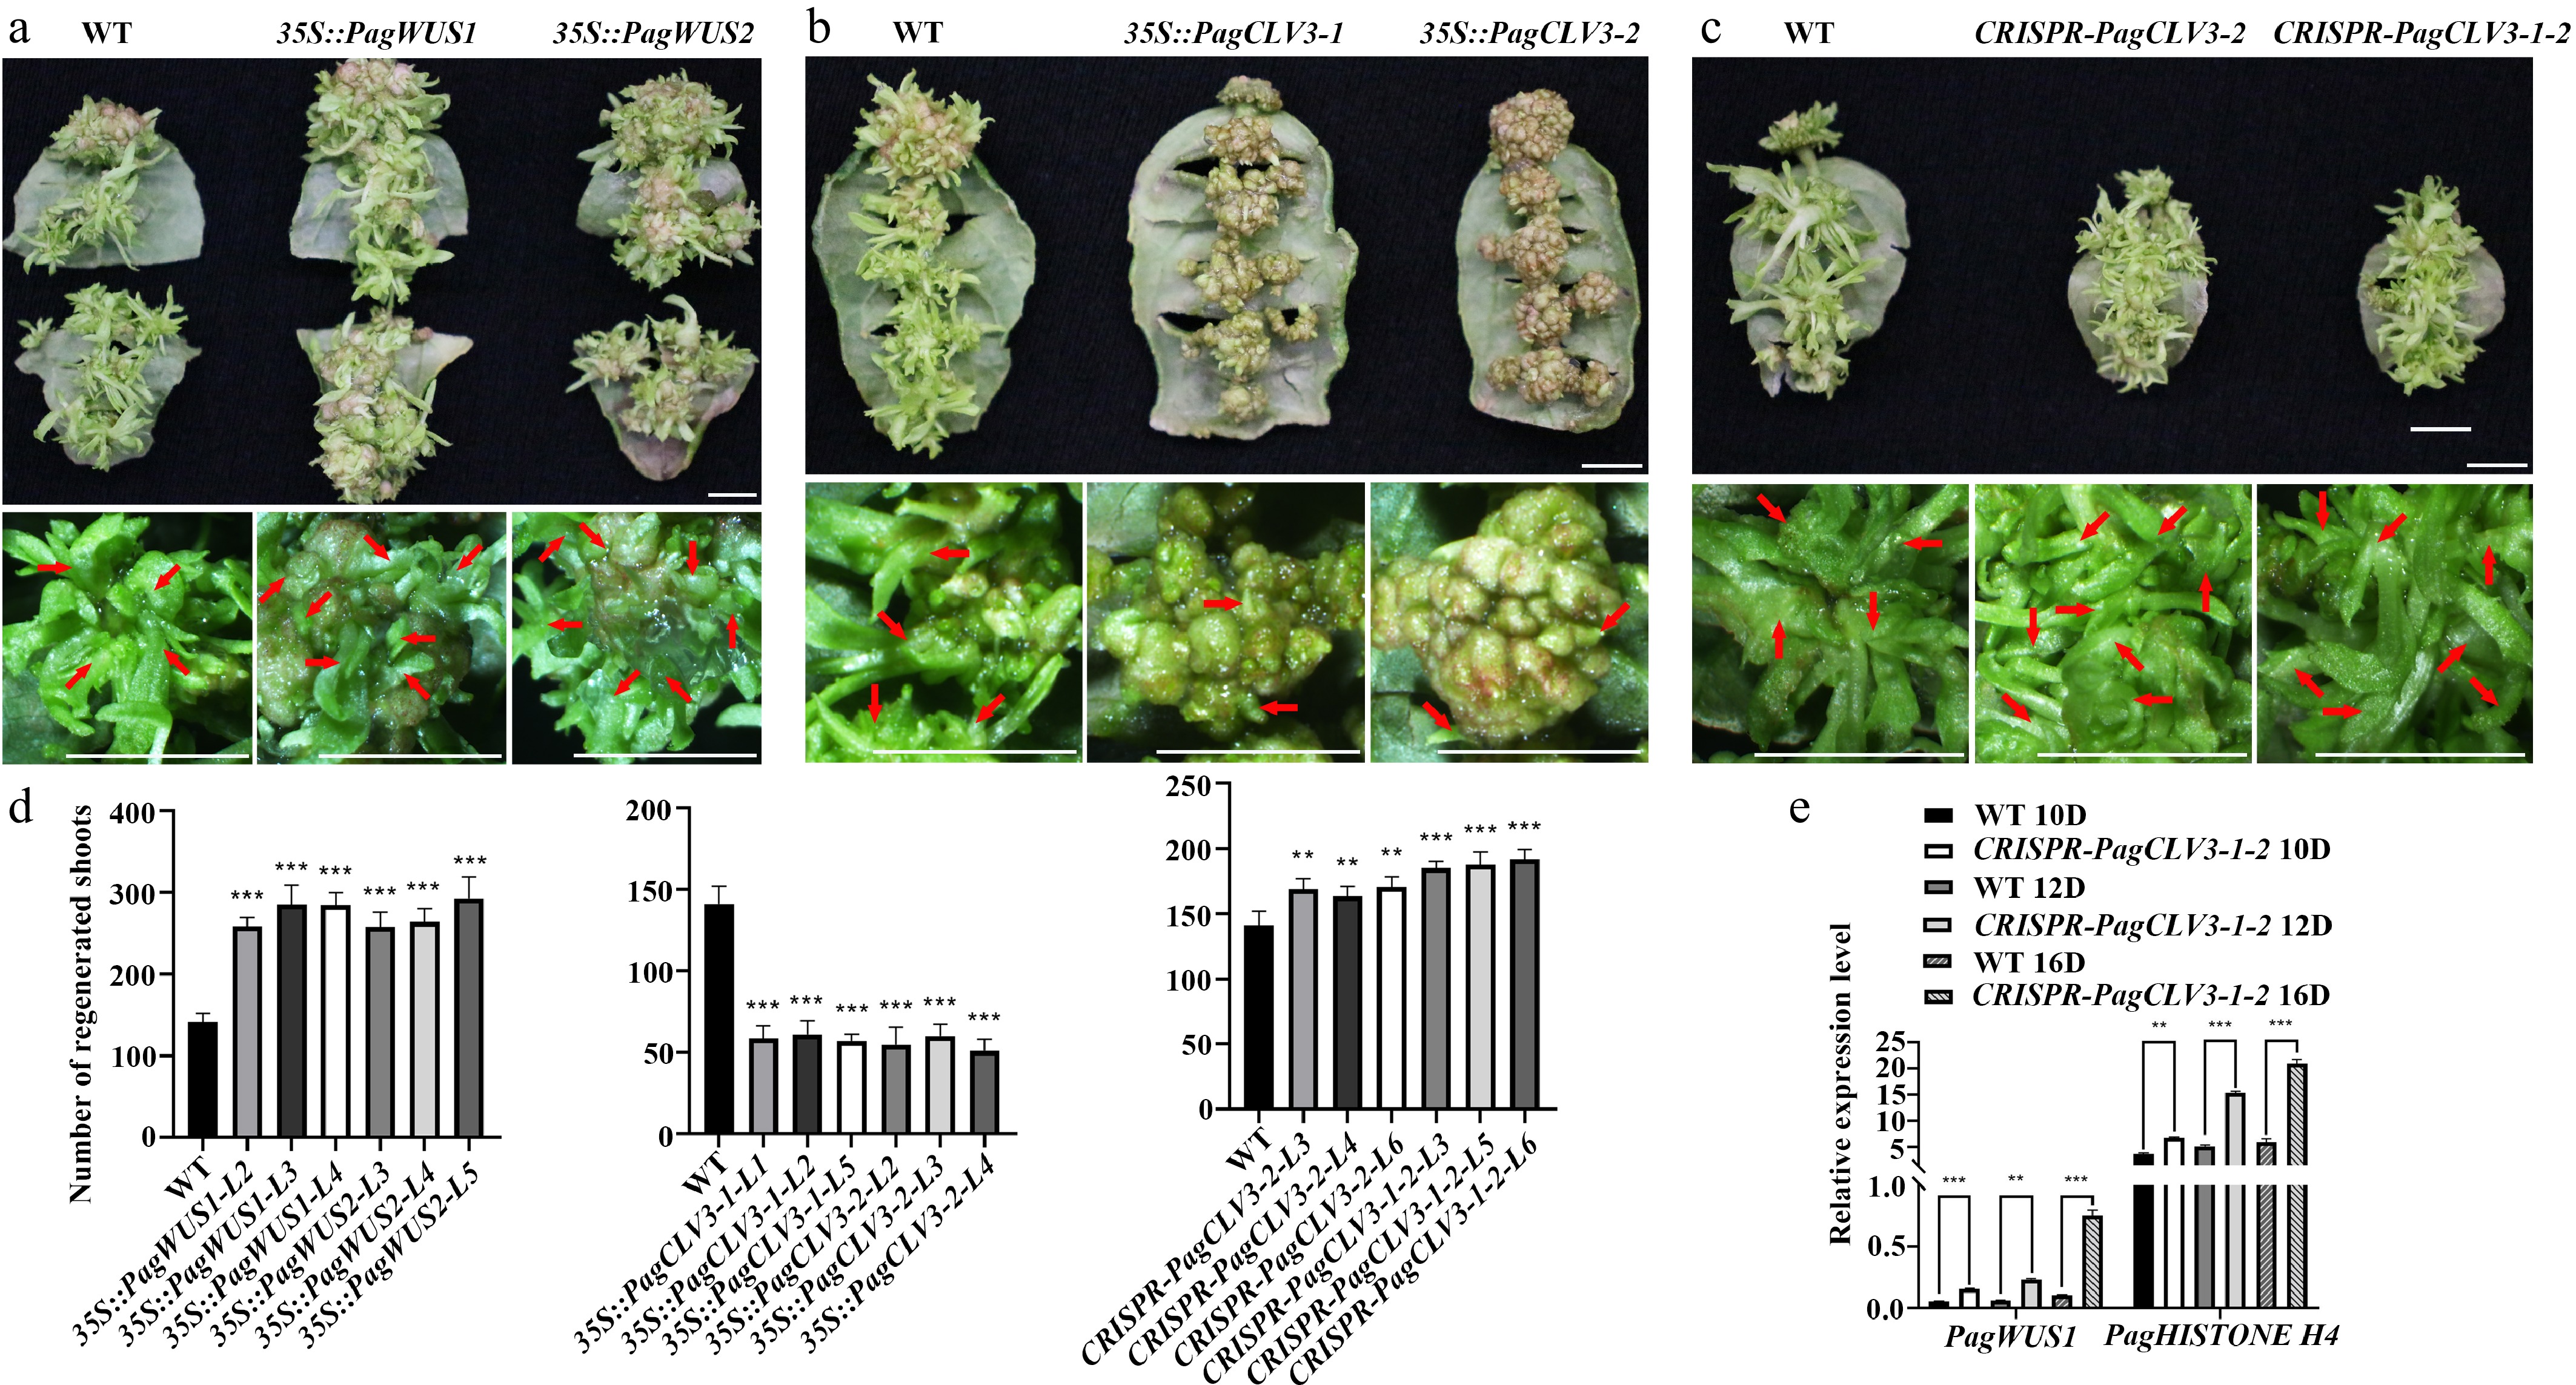
Figure 5.
Participation of PagWUS-PagCLV3 module in shoot regeneration. Shoot regeneration was promoted in (a) 35S::PagWUS, repressed in (b) 35S::PagCLV3, and enhanced in the (c) CRISPR-PagCLV3 explants. Bars = 5 mm. For (a)–(c), upper panels show shoots regenerated from leaf explants. Lower panels show formation of regenerated shoots. Red arrows indicate position of regenerated shoots. (d) Numbers of regenerated shoots per leaf explant. For 35S::PagWUS1, n = 25; 35S::PagWUS2, n = 25; 35S::PagCLV3-1, n = 25; 35S::PagCLV3-2, n = 25; CRISPR-PagCLV3-2, n = 25; CRISPR-PagCLV3-1-2, n = 25. Error bars show mean ± sd. (e) qRT-PCR analyses showing increased PagWUS1 and Histone H4 transcript levels in CRISPR-PagCLV3-1-2 explants, as compared with wild type. D indicates days of culture. Data are mean ± sd of three independent biological repeats. Asterisks indicate significant differences: ** 0.001 < p < 0.01 and *** p < 0.001 (two-tailed Student’s t-tests).
-
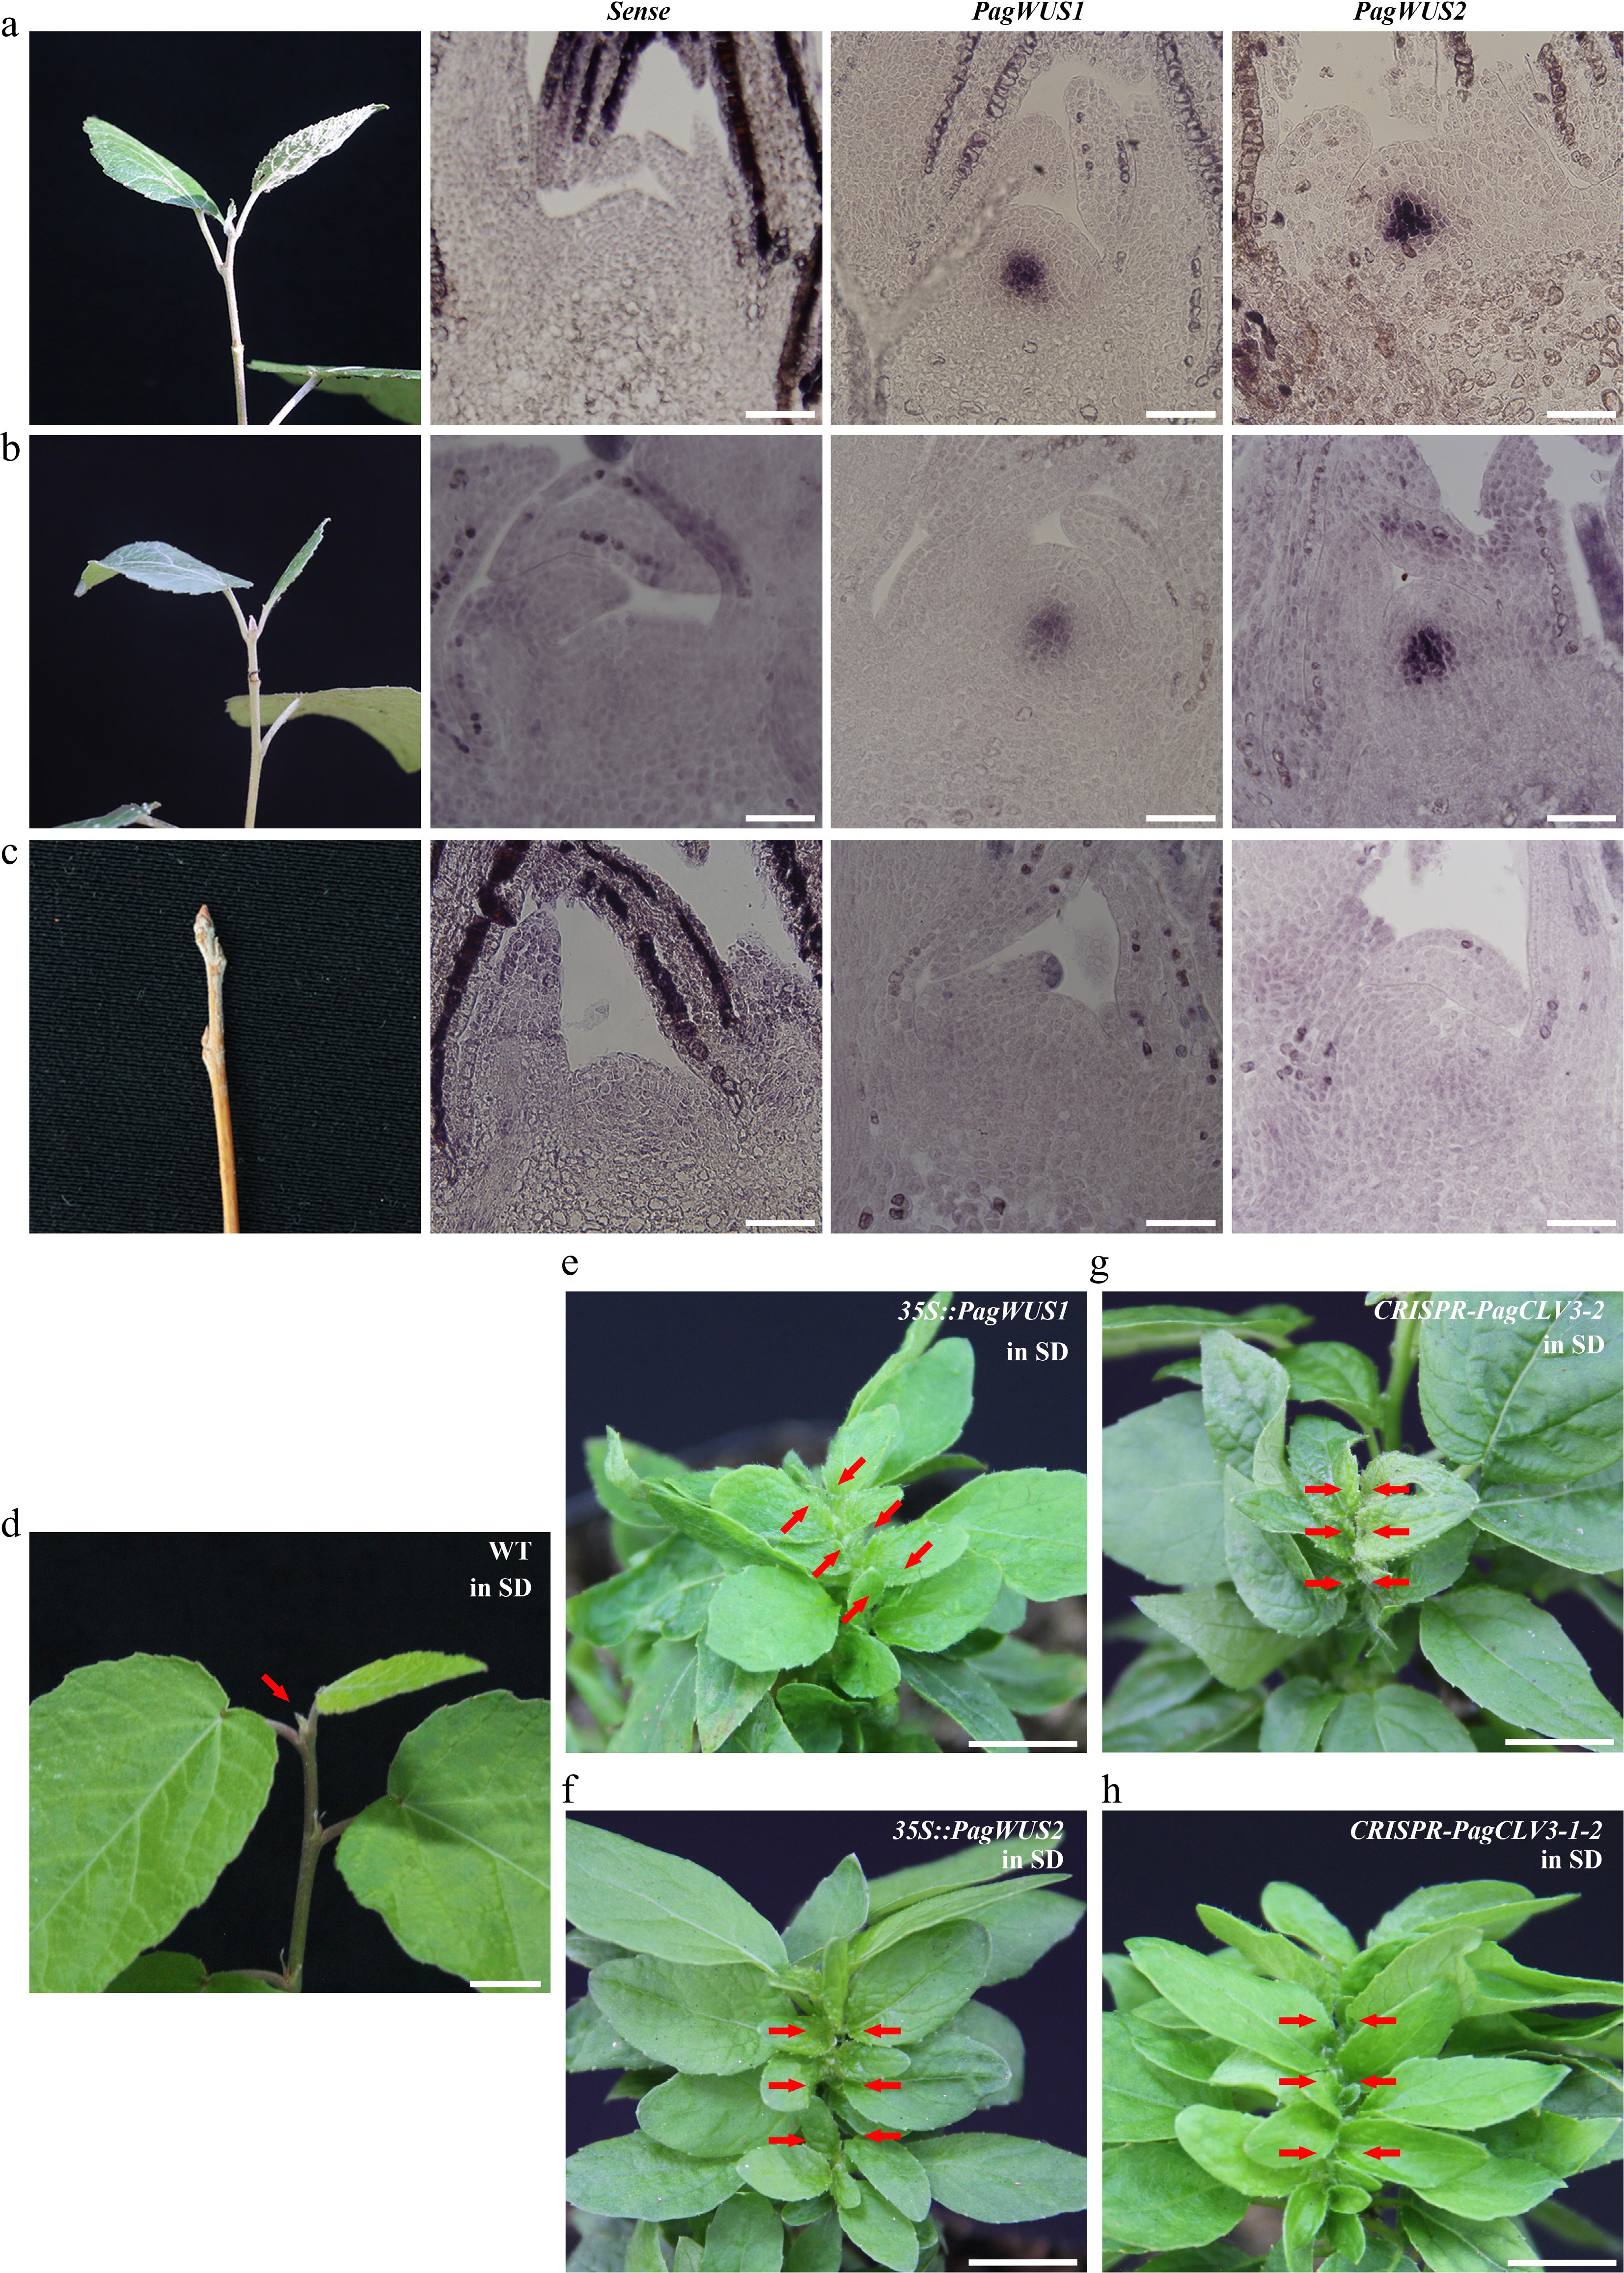
Figure 6.
The PagWUS-PagCLV3 module regulates the cessation of shoot meristem activity. In situ hybridization analyses showing abundance of PagWUS1 and PagWUS2 transcripts: (a) abundant during growth season, (b) reduced at the onset of cessation, and (c) absent after bud scale maturation. Bar = 100 μm. After short day treatment for 4 weeks, shoot meristem became inactive in (d) wild-type, but remained active in (e) 35S::PagWUS1, (f) 35S::PagWUS2, (g) CRISPR-PagCLV3-2, and (h) CRISPR-PagCLV3-1-2 saplings. Red arrows indicate shoot meristem. Bar = 1 cm.
Figures
(6)
Tables
(0)