-
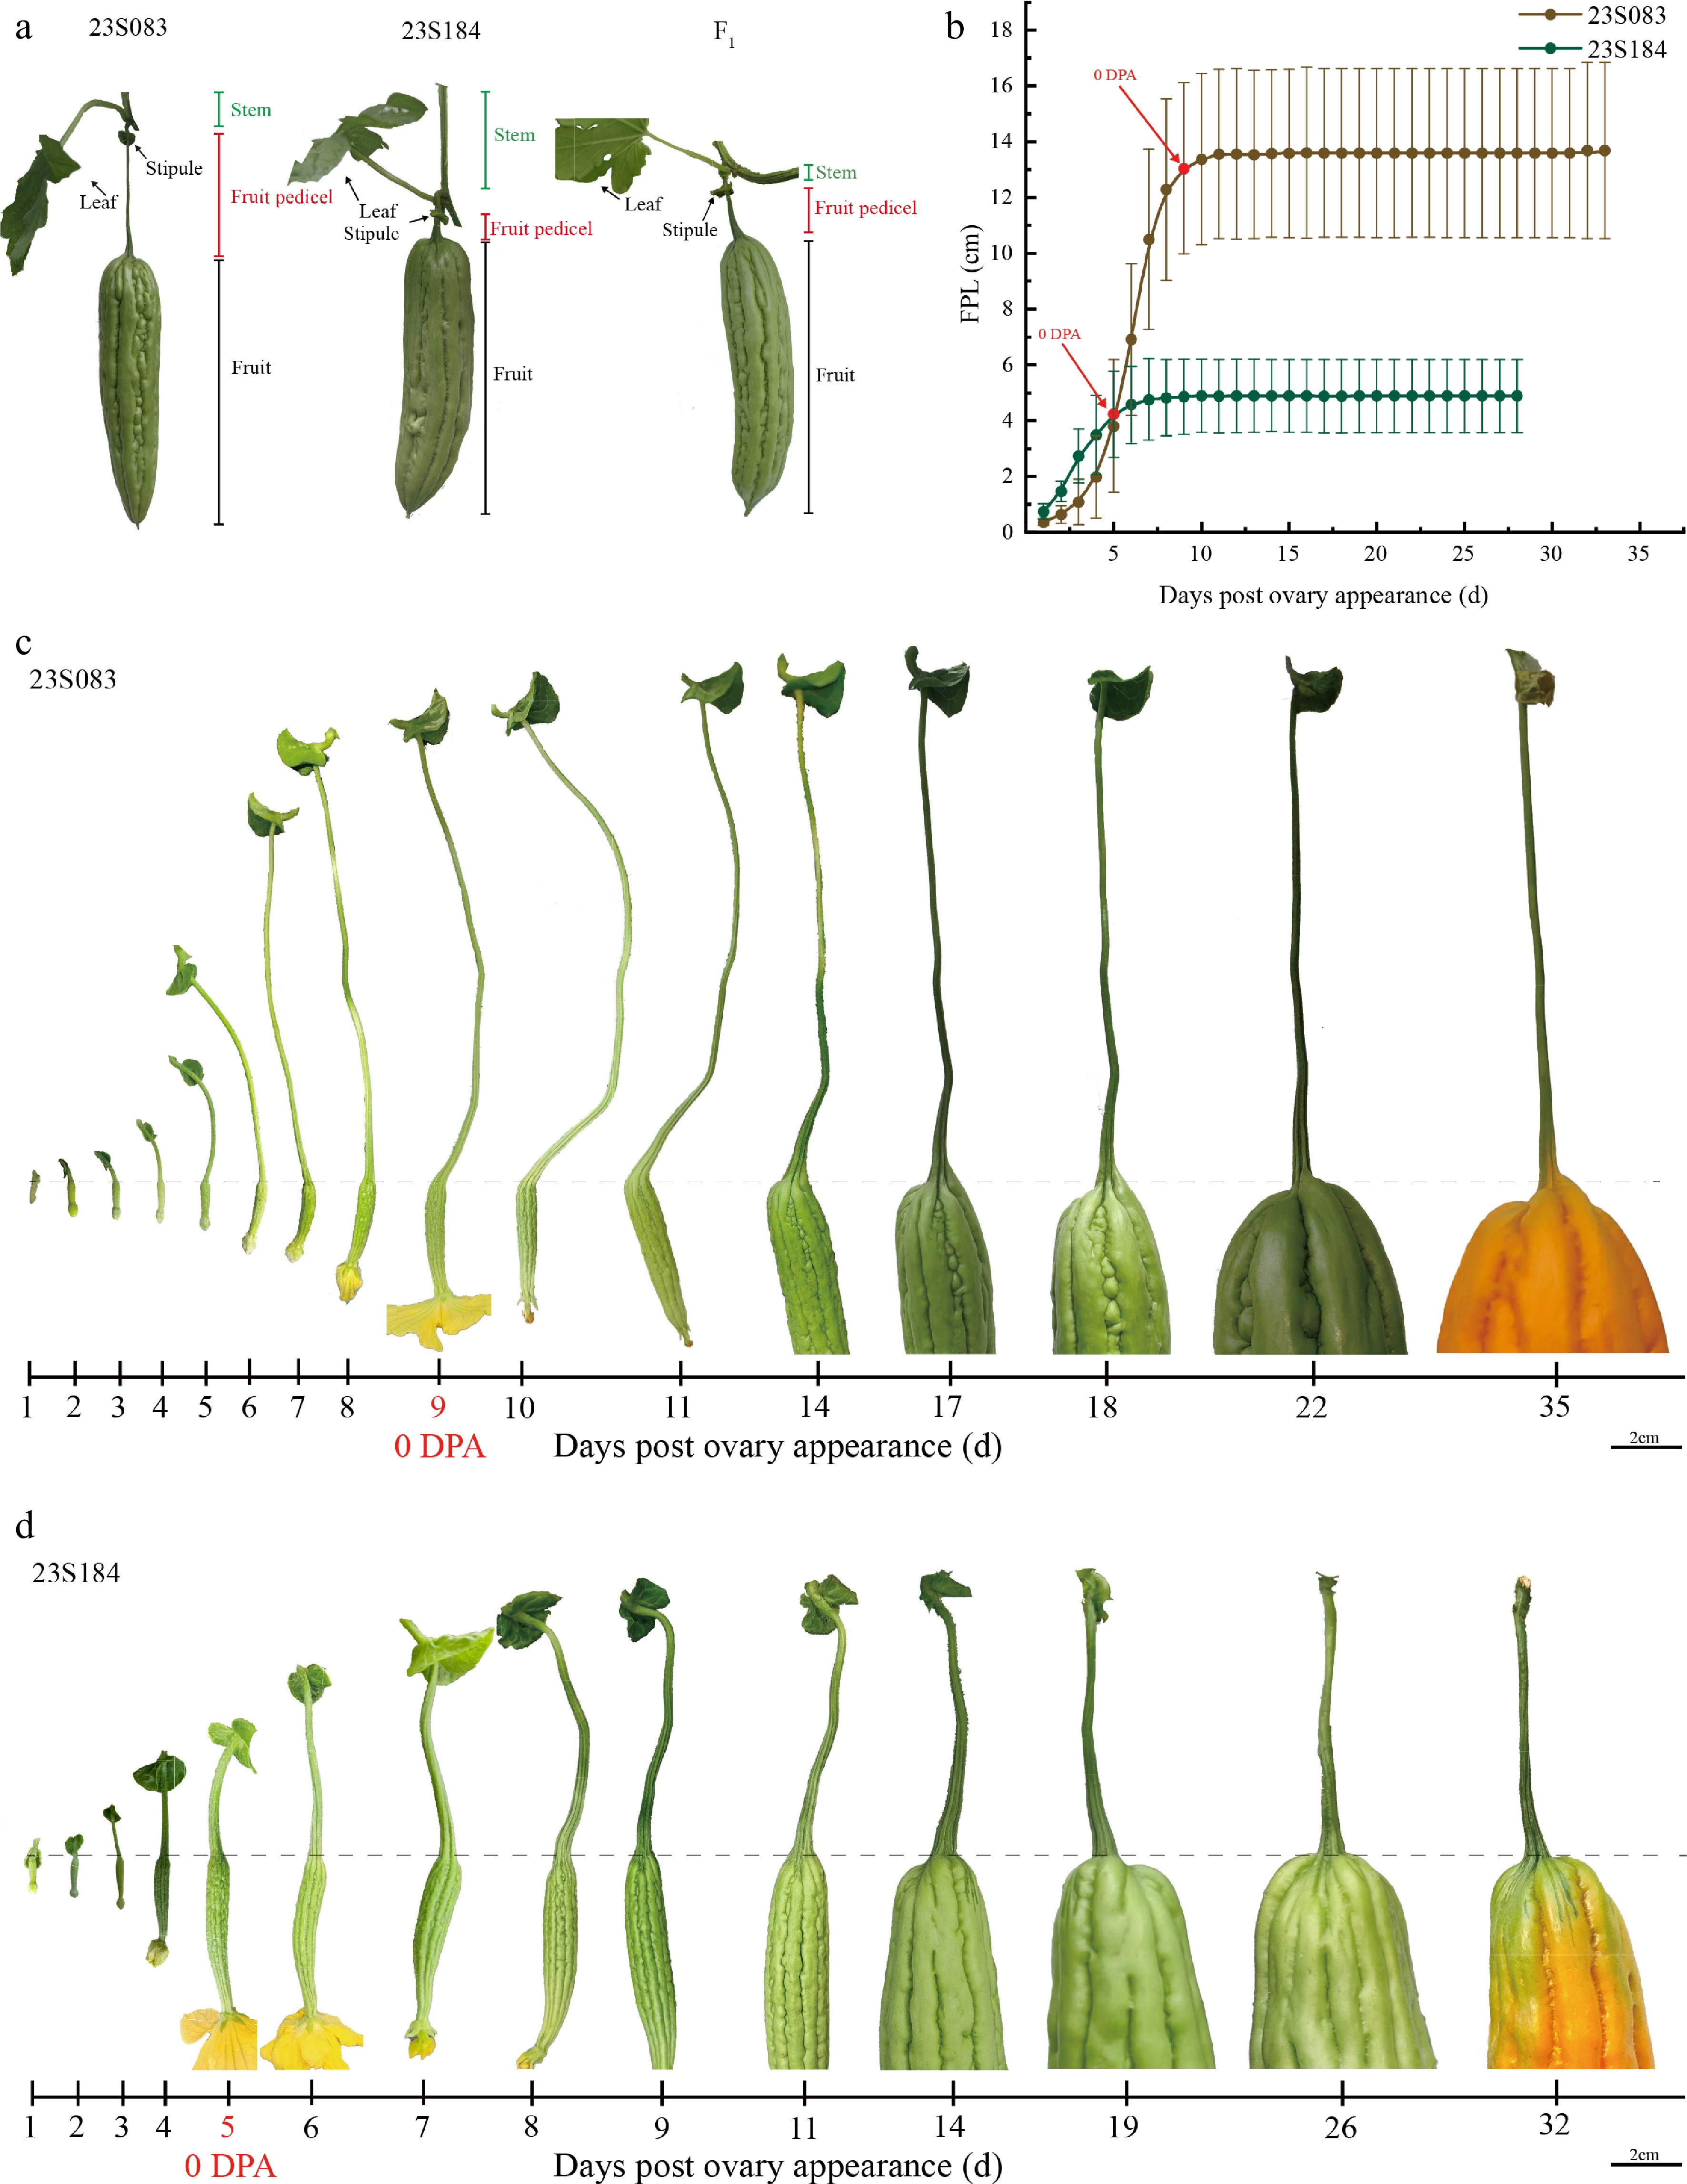
Figure 1.
Phenotypic characterization of fruit pedicel length in bitter gourd. (a) Structural characteristics of 23S083, 23S184, and their F1 lines at commercial maturity. (b) The dynamic changes of FPL (fruit pedicel length) across developmental stages of 23S083 and 23S184 lines. Image of representative stages in the FPL changing process of (c) 23S083, and (d) 23S84.
-
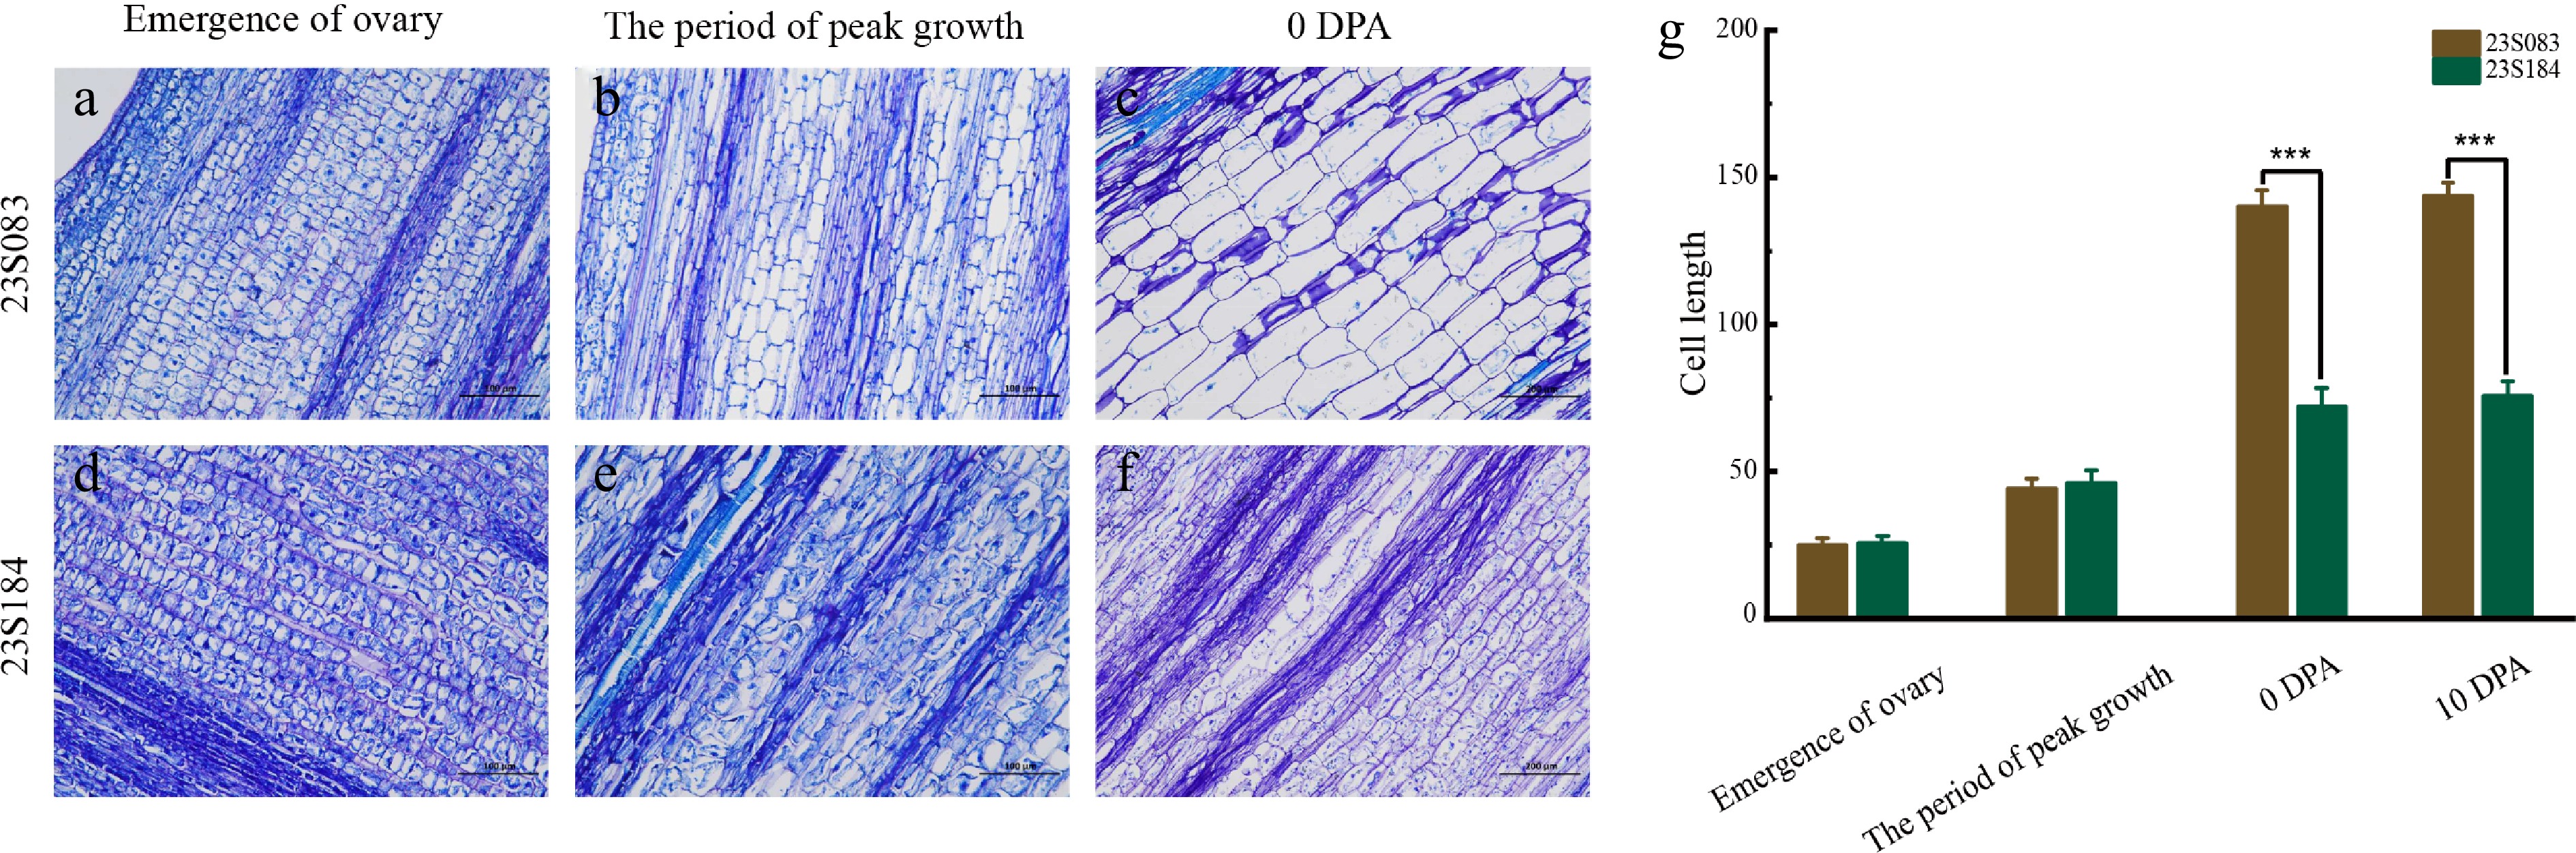
Figure 2.
Microscope evaluation of the pedicel cell. Representative cell morphology of fruit pedicel longitudinal sections at key stages in (a)–(c) 23S083, and (d)–(f) 23S184; with (g) corresponding quantifications of cell length. Data are presented as mean ± SE. *** p < 0.001, ** p < 0.01 (Student's t-test).
-
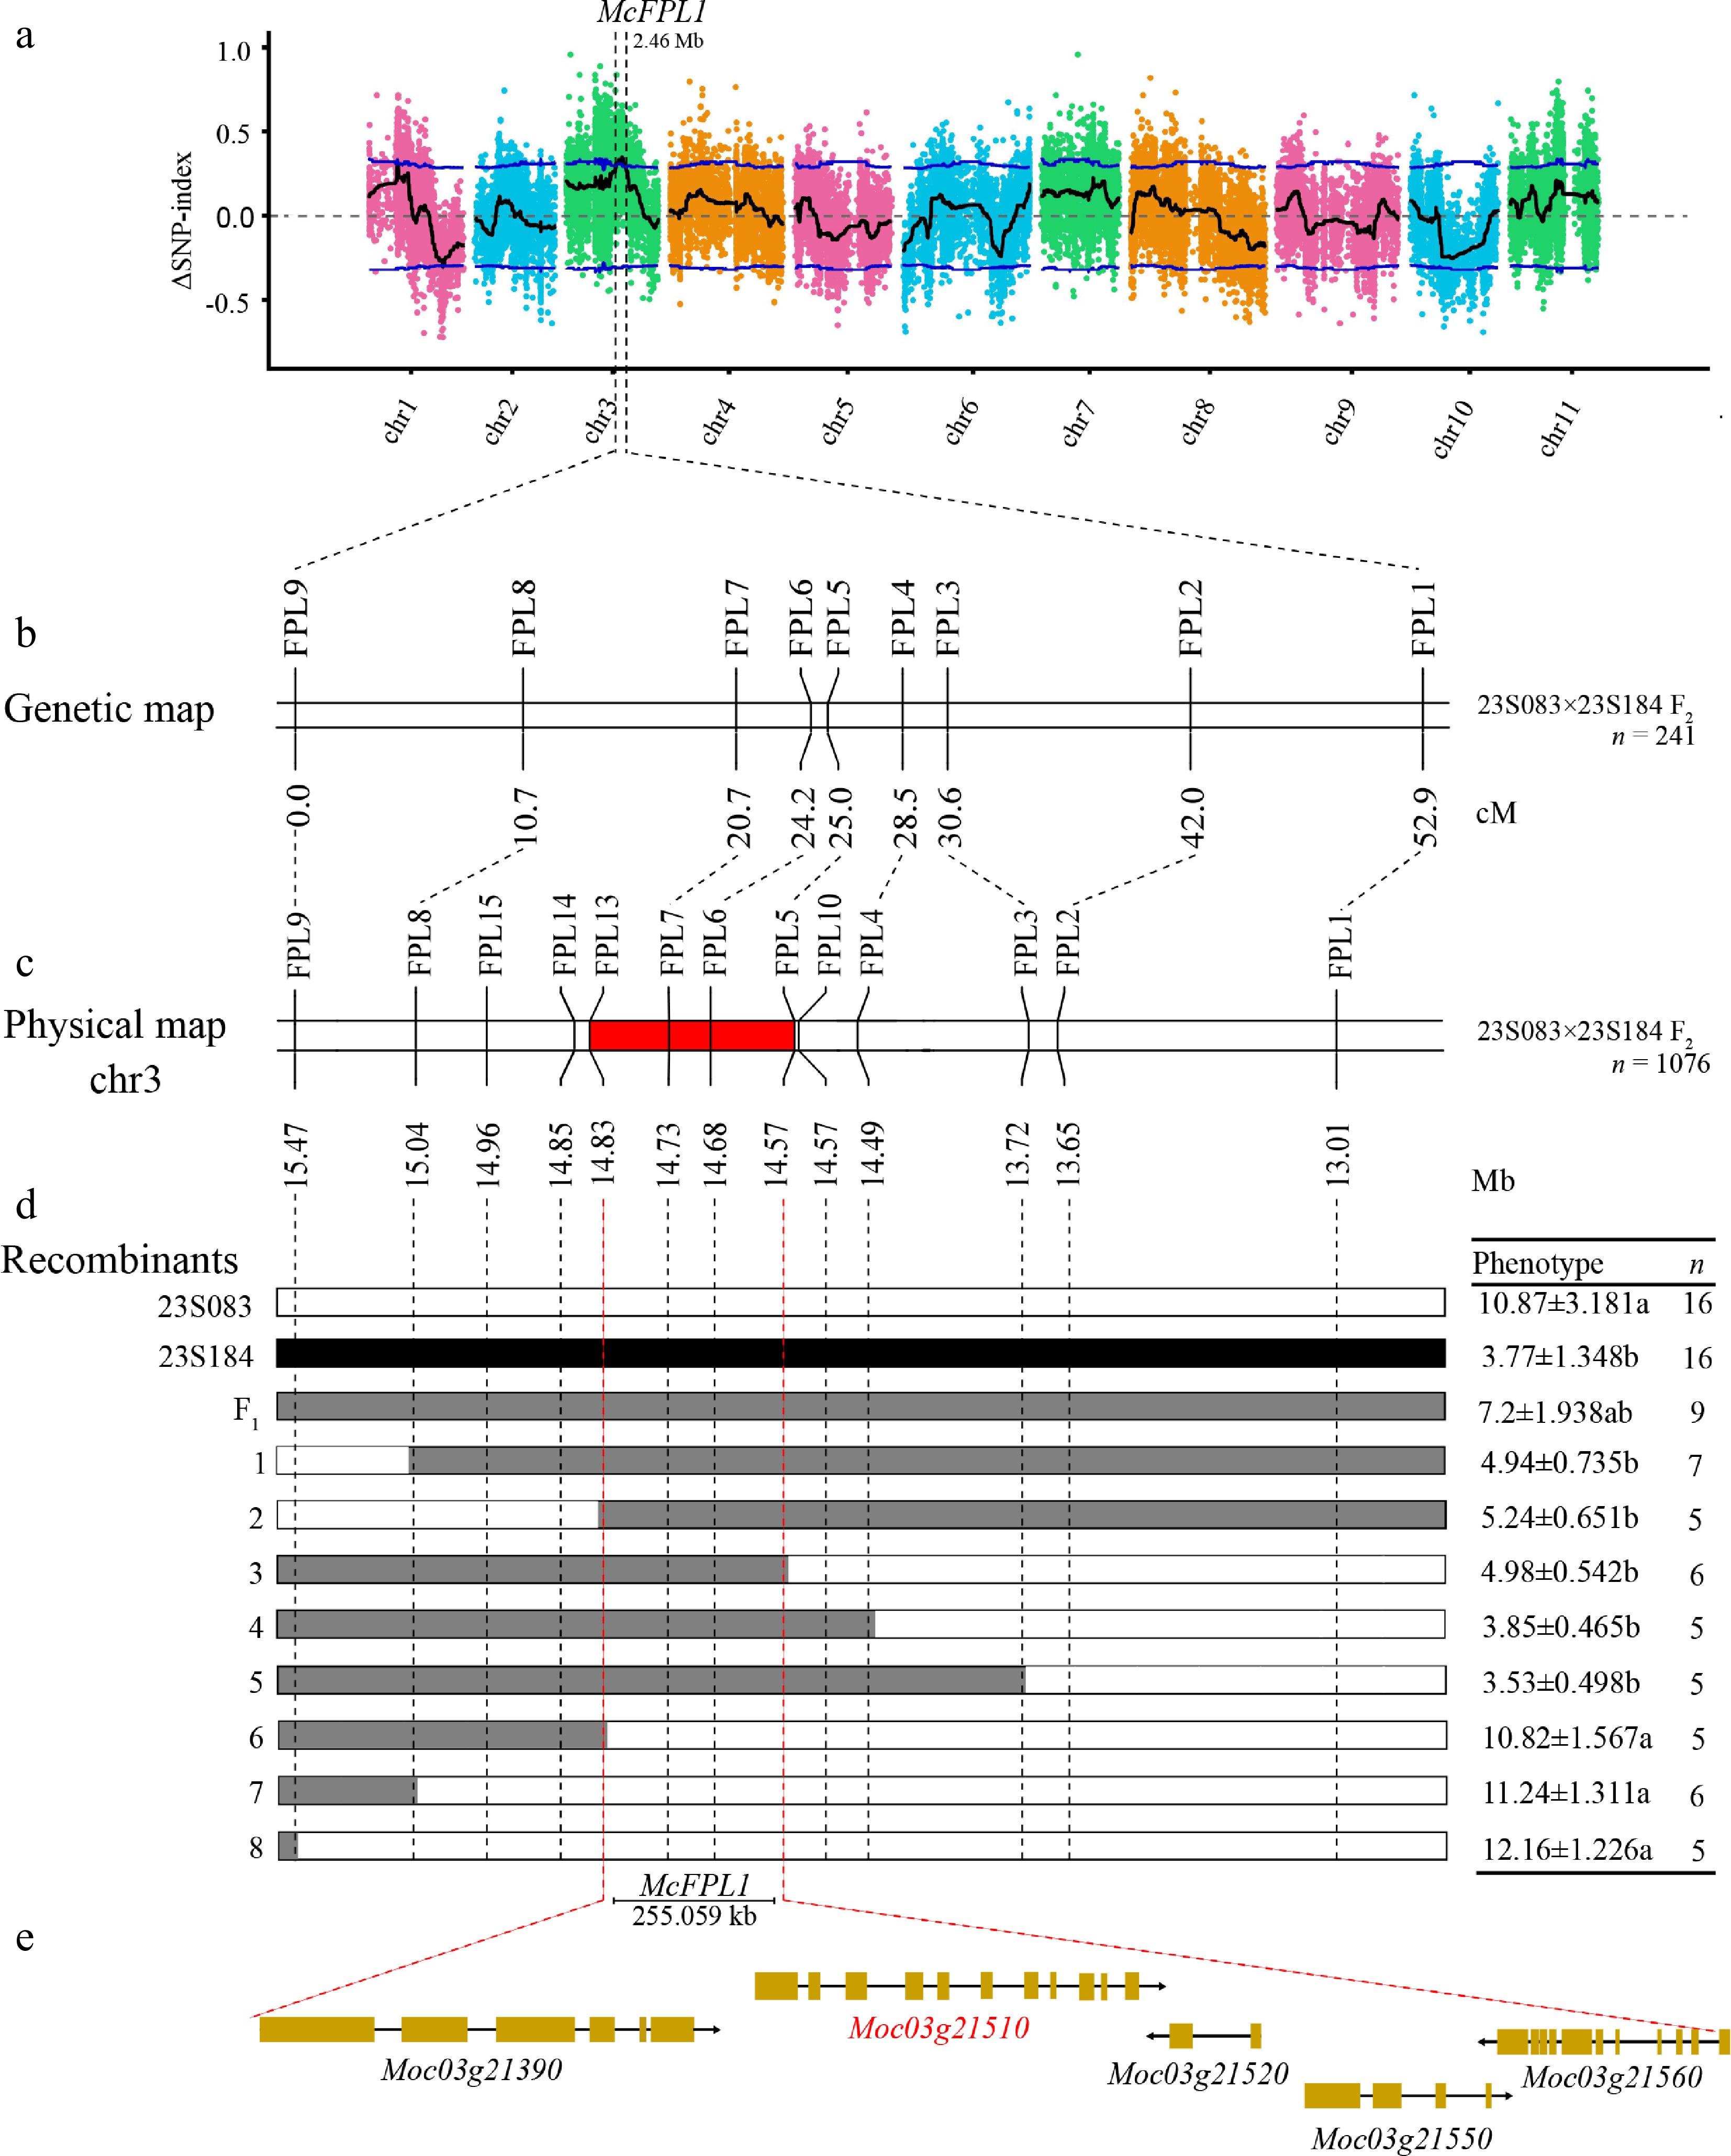
Figure 3.
Map-based cloning of McFPL1. (a) Manhattan plot of the ΔSNP-index. The blue line represents the threshold lines for confidence levels of 0.95. The confidence interval for McFPL1 at 2.46 Mb on chromosome 3 is indicated by the red dotted lines. (b) Genetic linkage map of the 241 individual F2 population (23S083 × 23S184). (c) Physical position of the markers based on the OHB3-1 reference genome, the 255.059 kb candidate region is filled in red. (d) Fine-mapping of McFPL1 using 1076 F2 recombinants. The black, white, and grey bars represent 23S184, 23S083, and heterozygotes, respectively. (e) The gene structure of five genes.
-
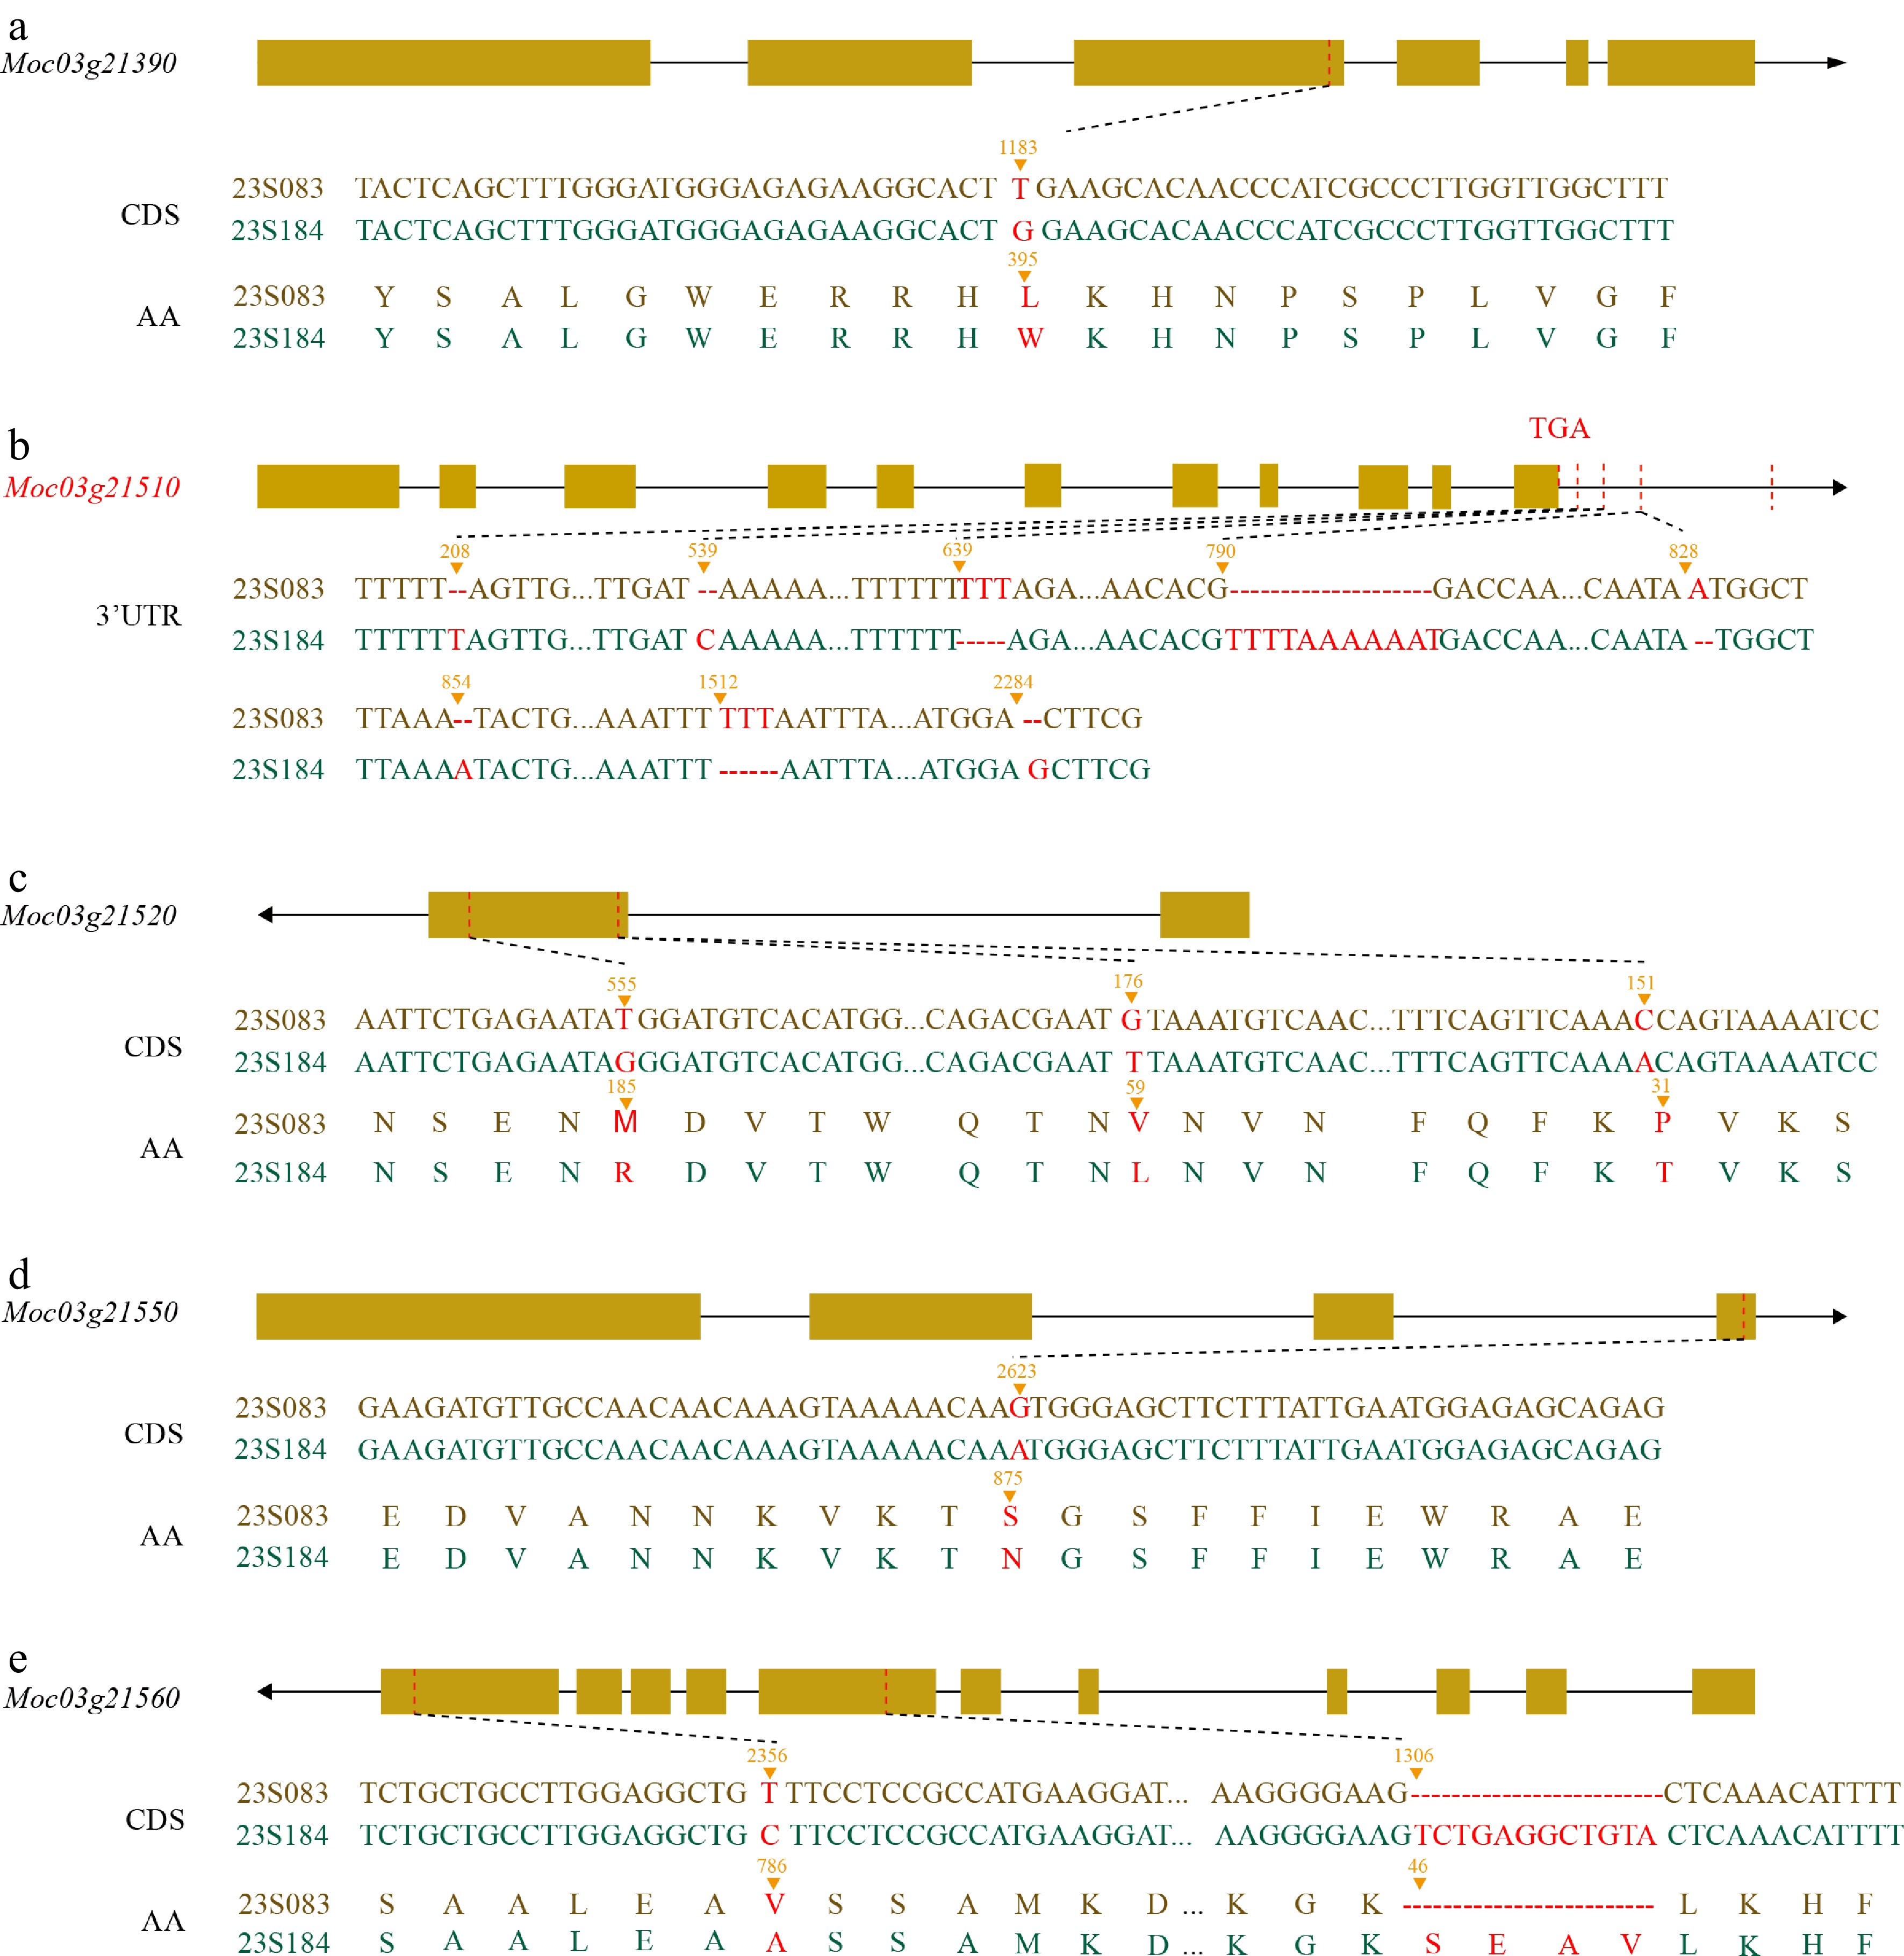
Figure 4.
(a), (c)–(e) Sequence analysis of the candidate gene. DNA sequence variations and the resulting non-synonymous amino acid changes in the four candidate genes. (b) InDel information for Moc03g21510. Variant positions were calculated excluding introns.
-
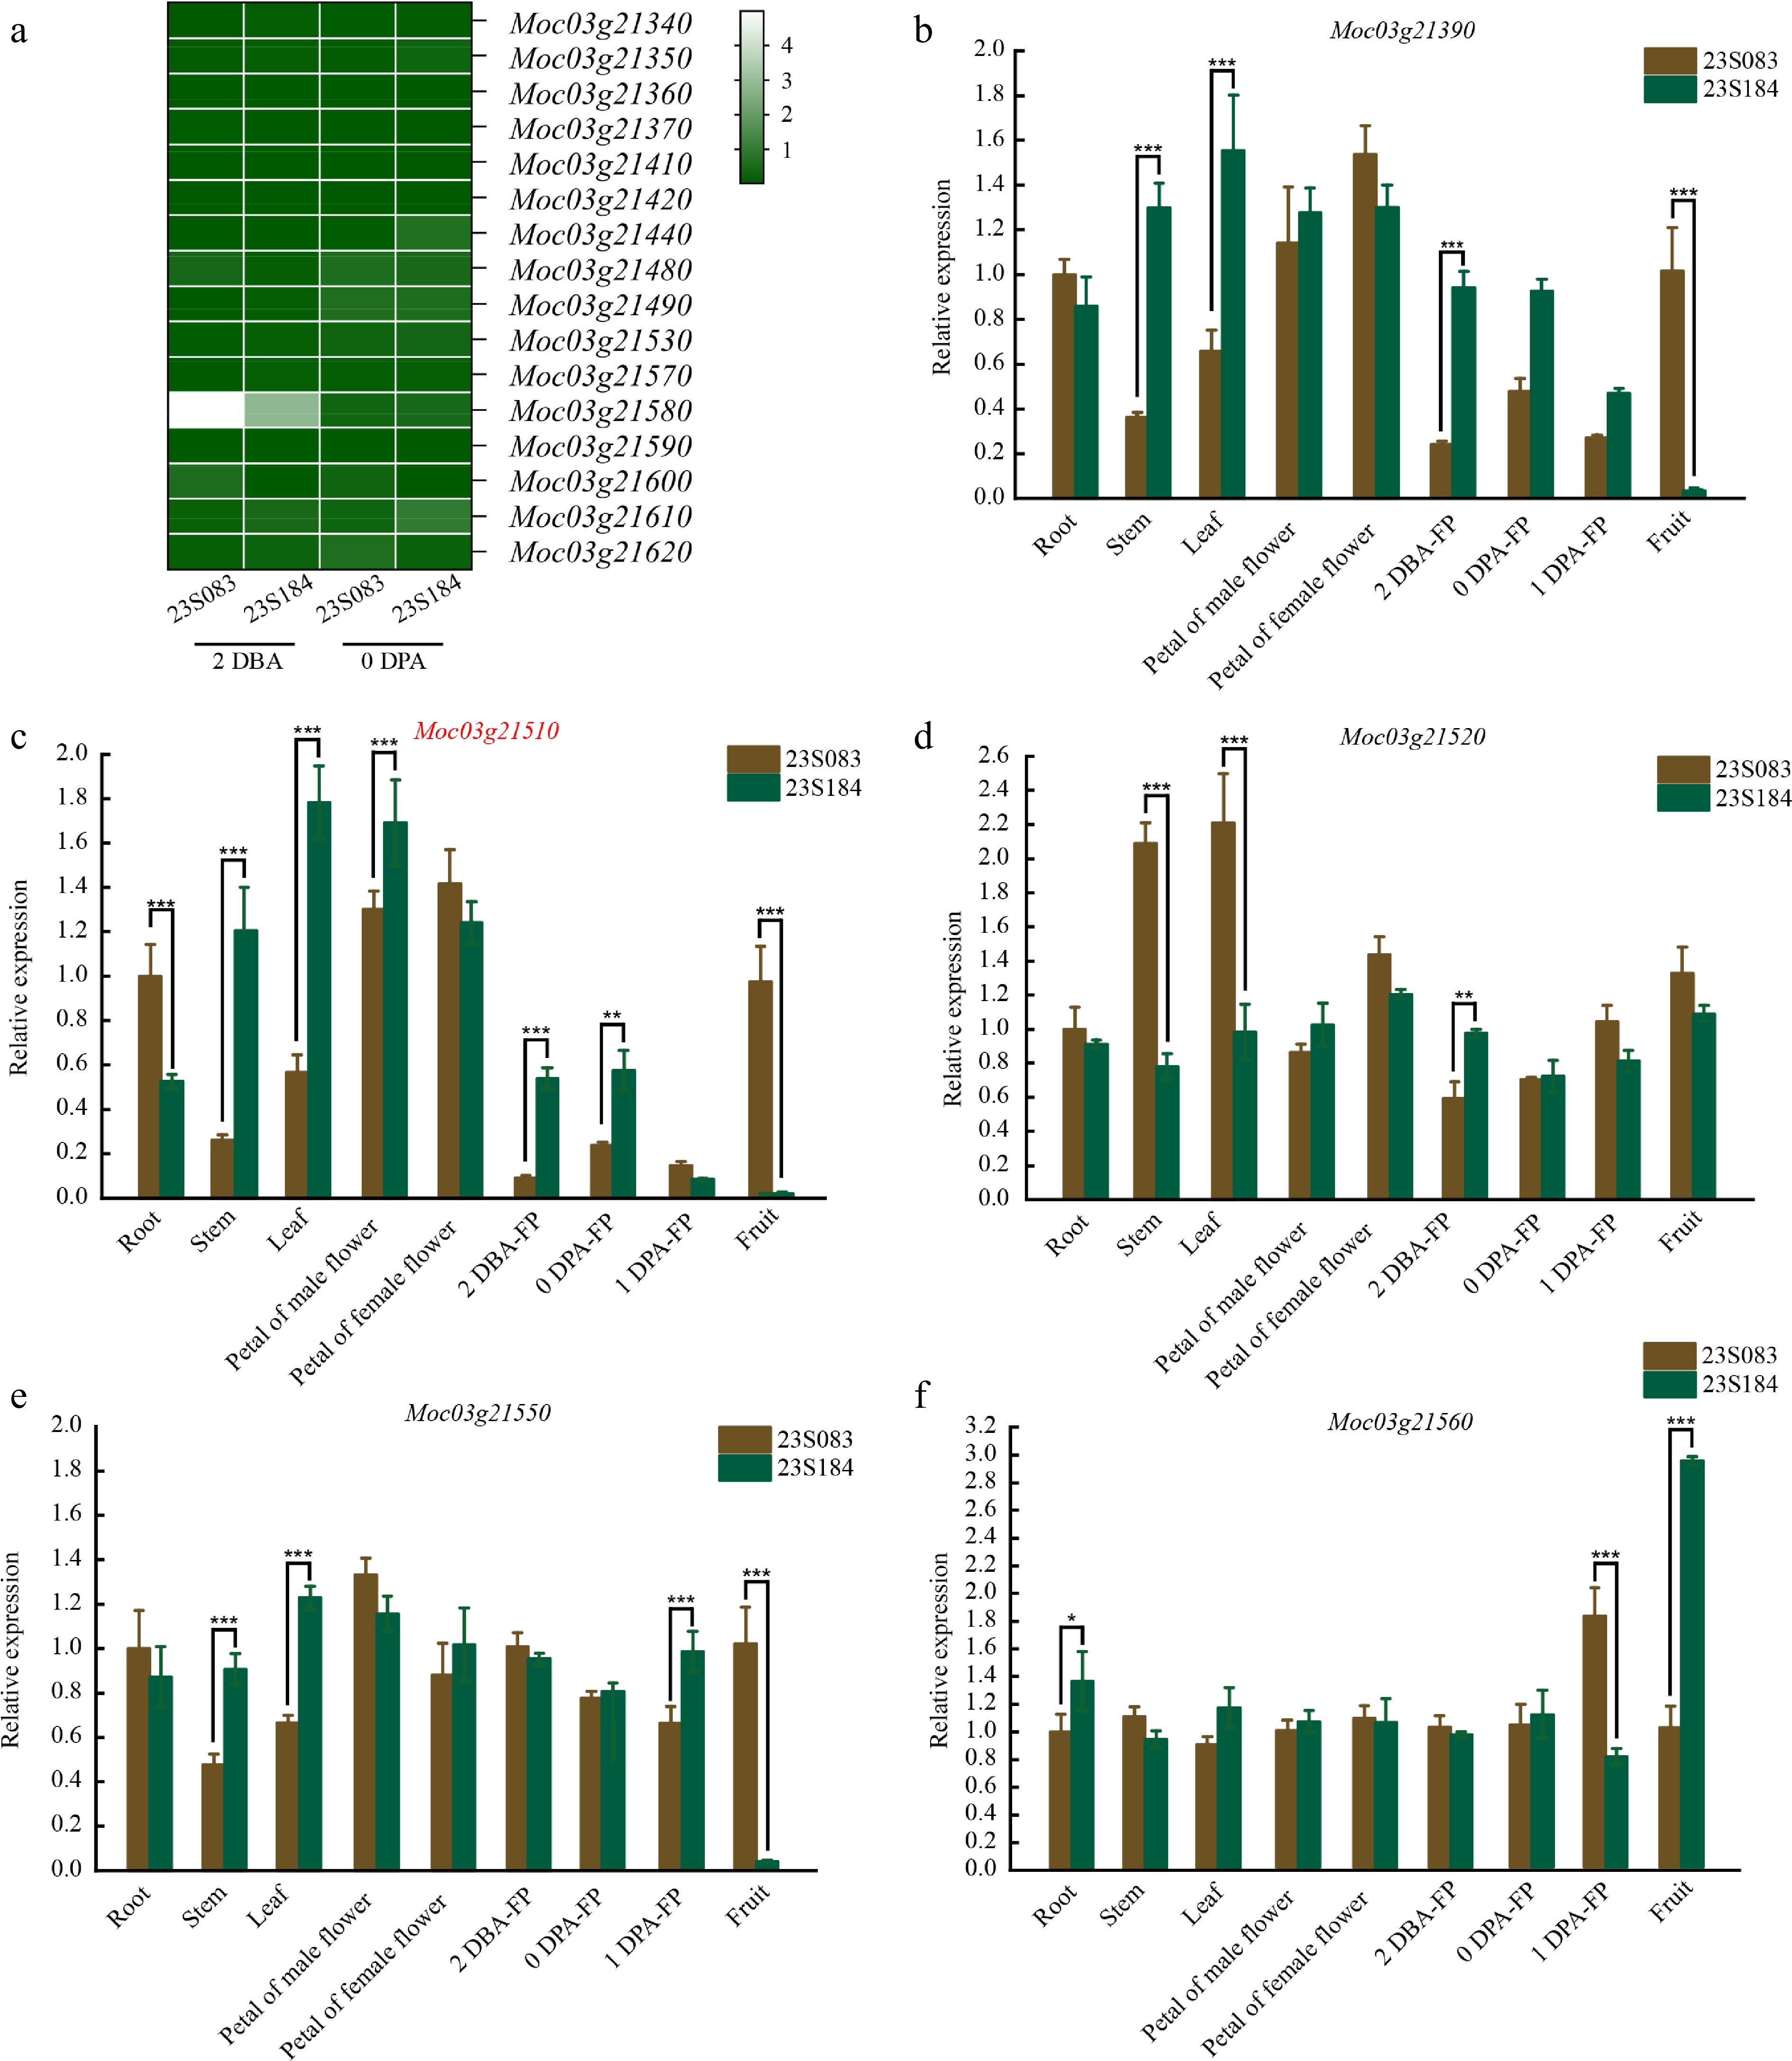
Figure 5.
Expression pattern of the candidate genes. (a) The relative expression level of 16 genes in two stages of fruit pedicel (2 DBA, 0 DPA) with a heatmap. The relative expression levels of (b) Moc03g21390, (c) Moc03g21510, (d) Moc03g21520, (e) Moc03g21550, and (f) Moc03g21560 in root, stem, leaf, petal, fruit, and three stages of fruit pedicel (2 DBA, 0 DPA, 1 DPA). Values represent the mean ± SE of three biological replicates. Different letters (***, **, *) indicate statistically significant differences at p < 0.001, p < 0.01, and p < 0.05, respectively, according to the Sidak test.
-
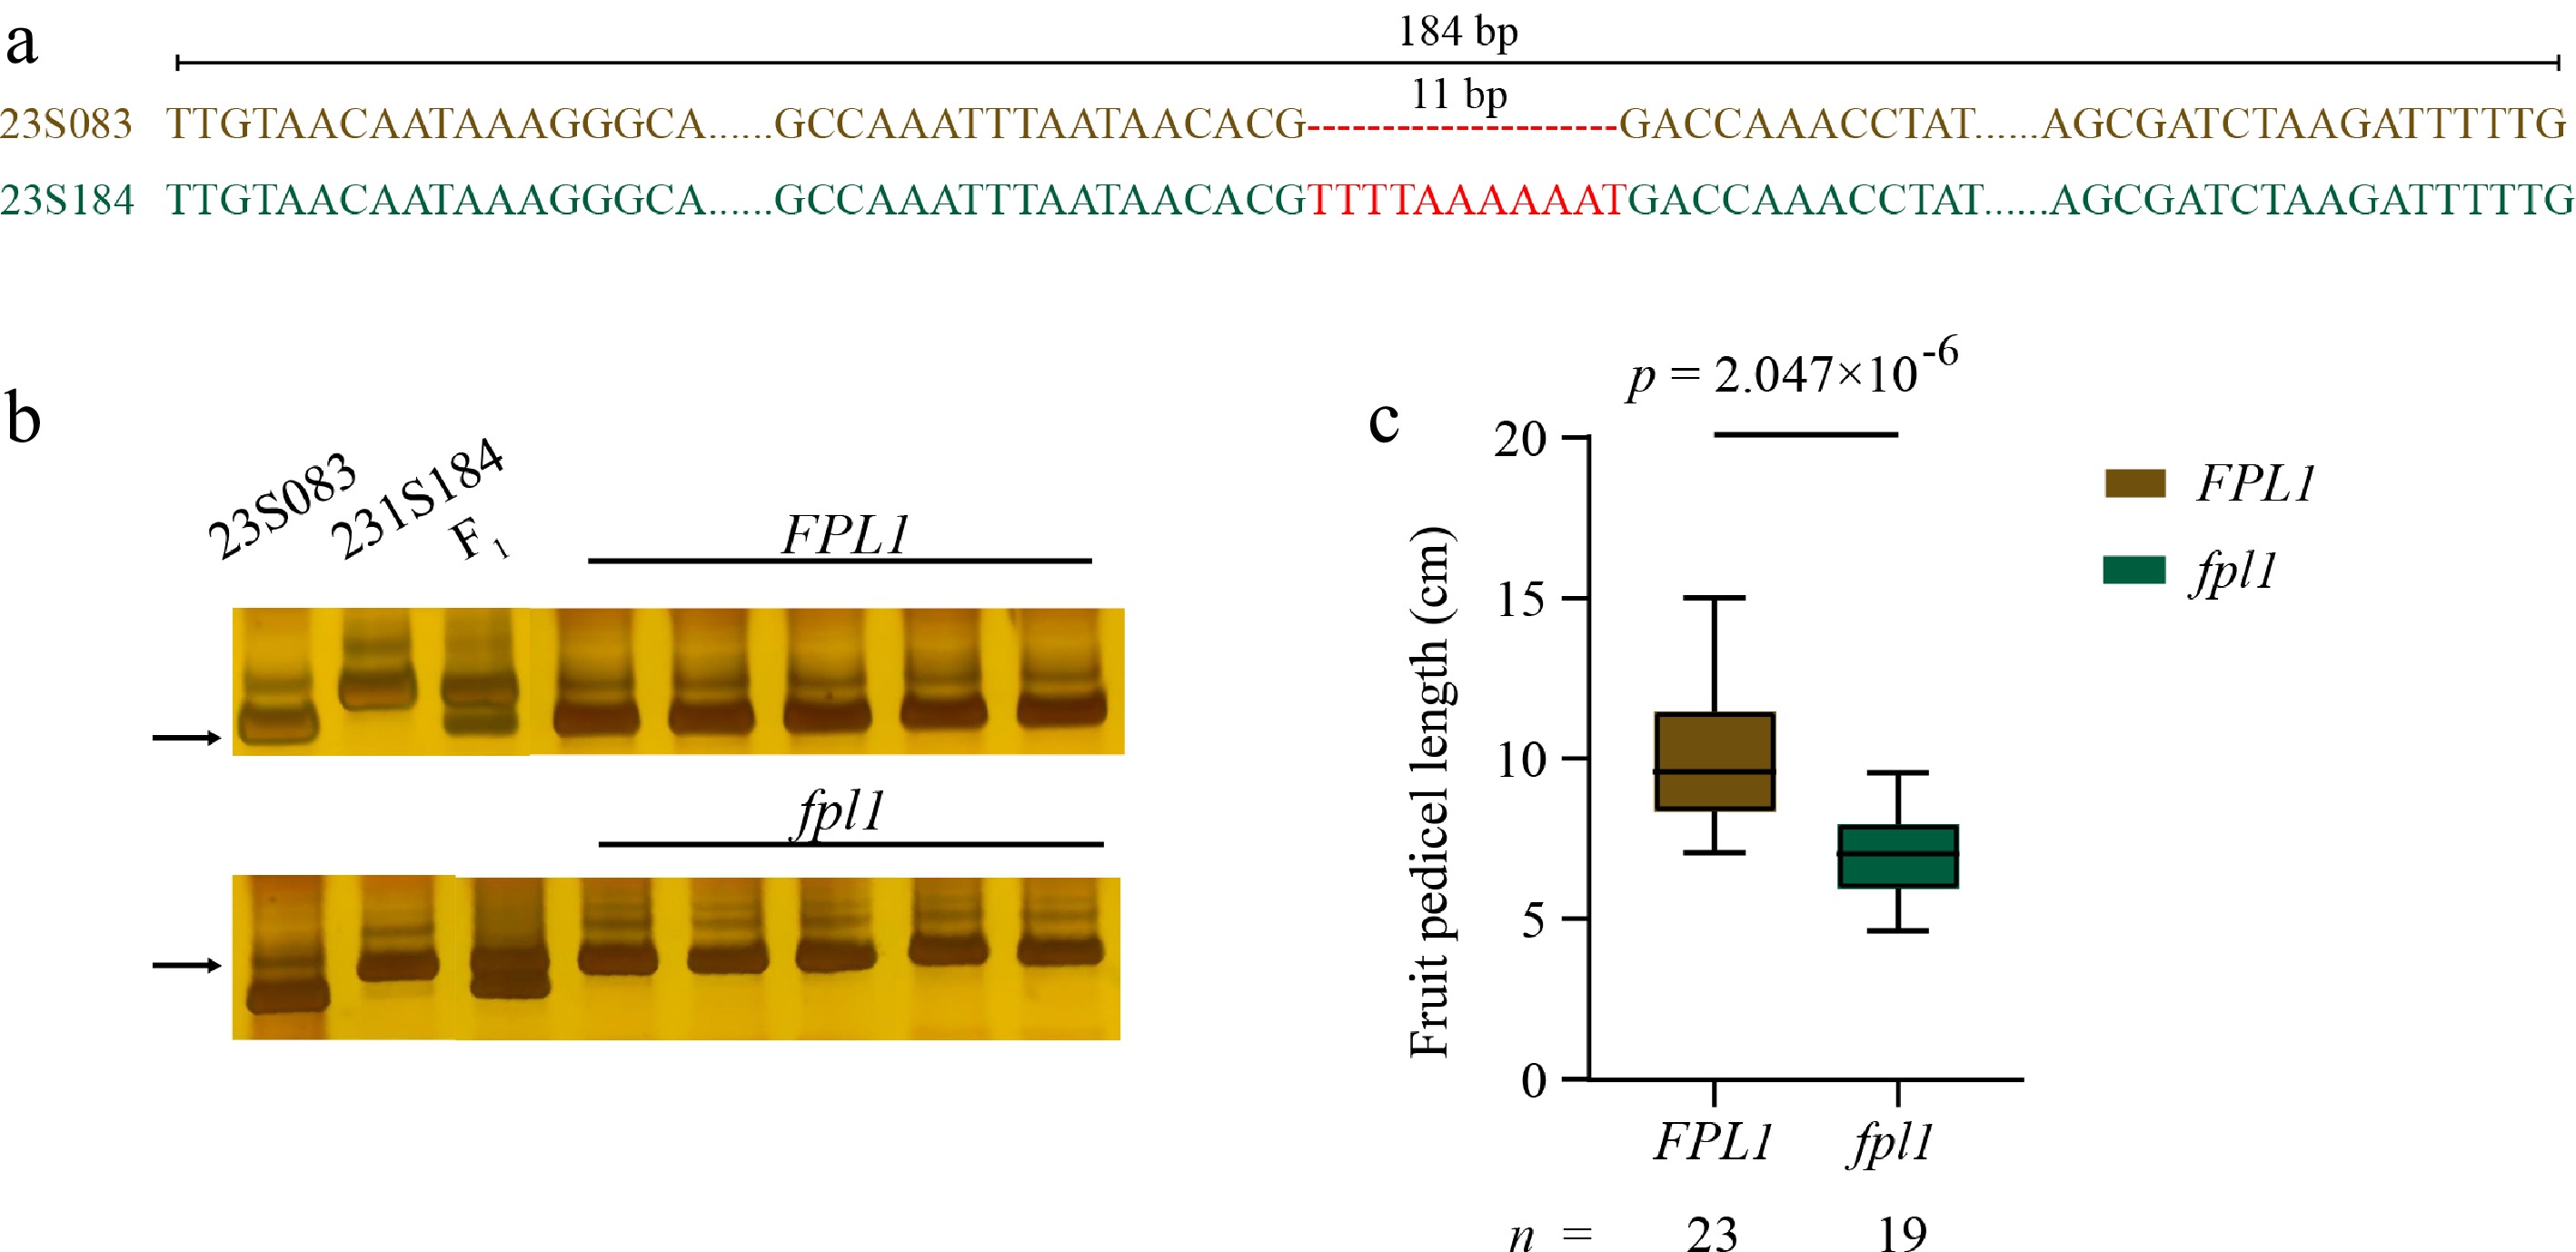
Figure 6.
Genotyping of bitter gourd natural populations. (a) The sequence deletion in McFPL1 between 23S083 and 23S184 was employed for genotyping. (b) Representative polyacrylamide gel electrophoresis (PAGE) of McFPL1 PCR products. (c) Comparison of fruit pedicel length between the two genotypes in a natural population. Statistical significance was assessed using a t-test.
Figures
(6)
Tables
(0)