-
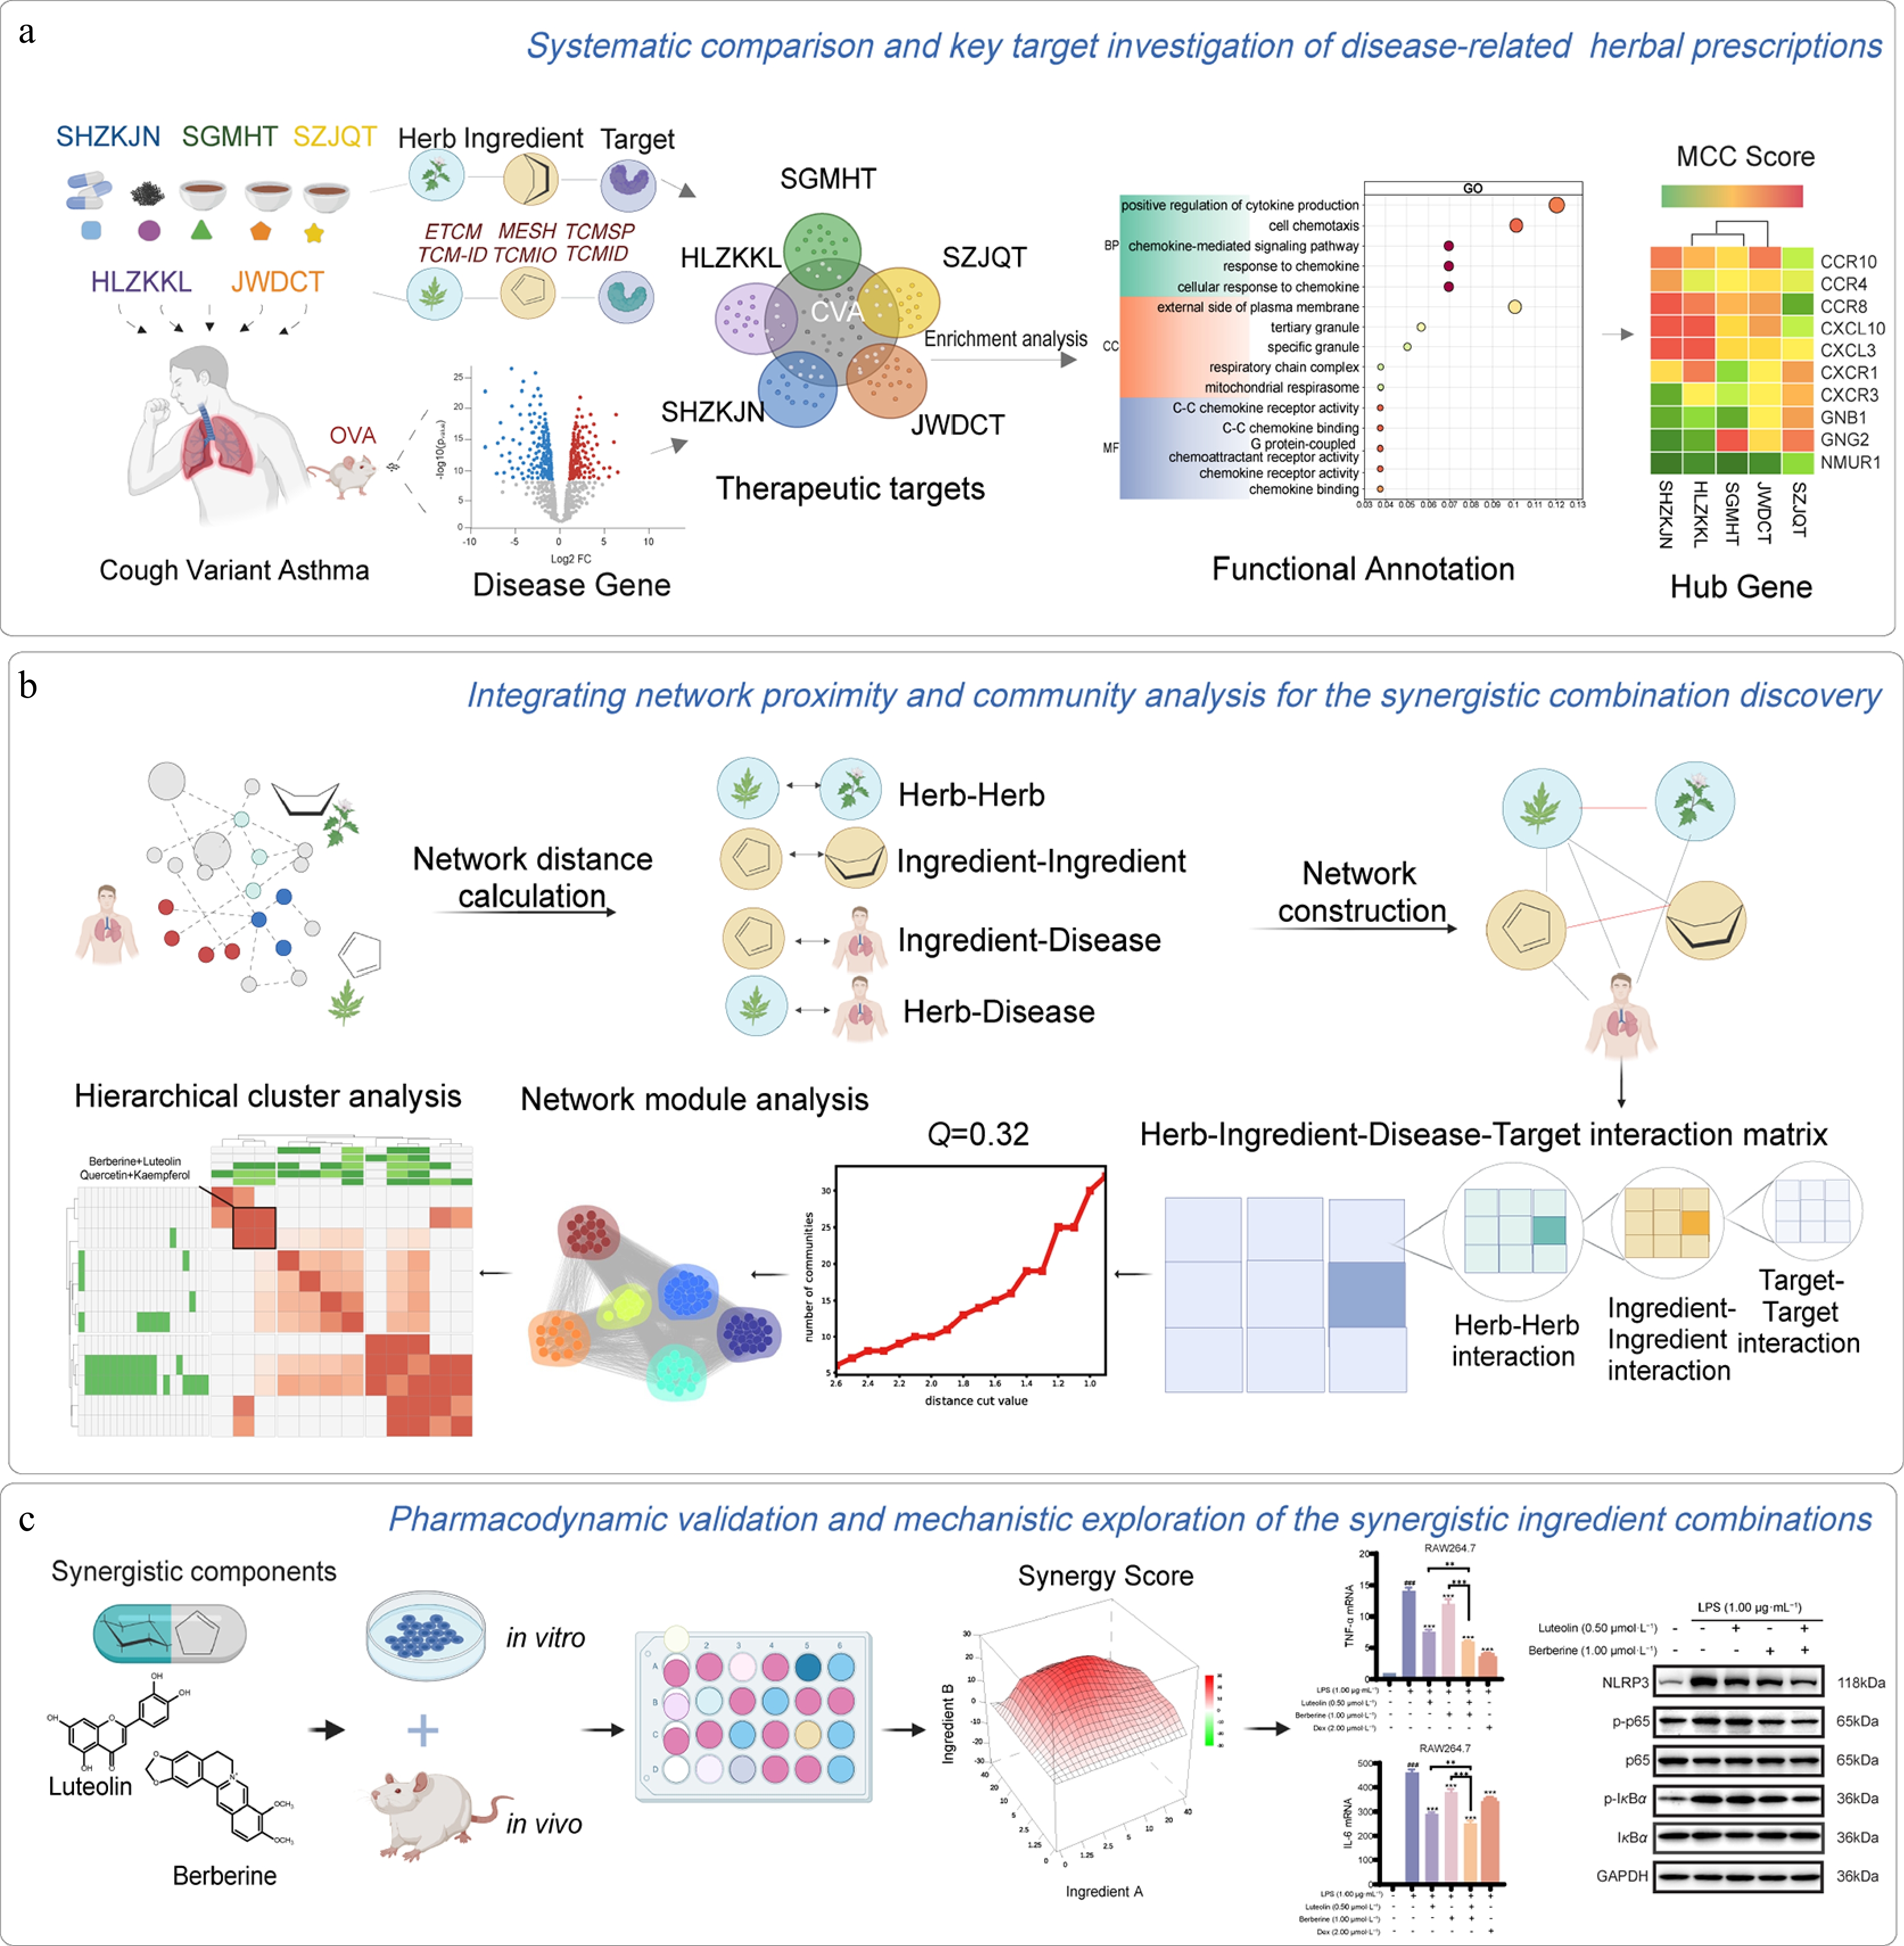
Figure 1.
Overview of our network models. (a) Systematic comparison and key target investigation of CVA-related herbal prescriptions. (b) Integrating network proximity and community analysis for the synergistic combination discovery. (c) Pharmacodynamic validation and mechanistic exploration of the synergistic ingredient combinations.
-
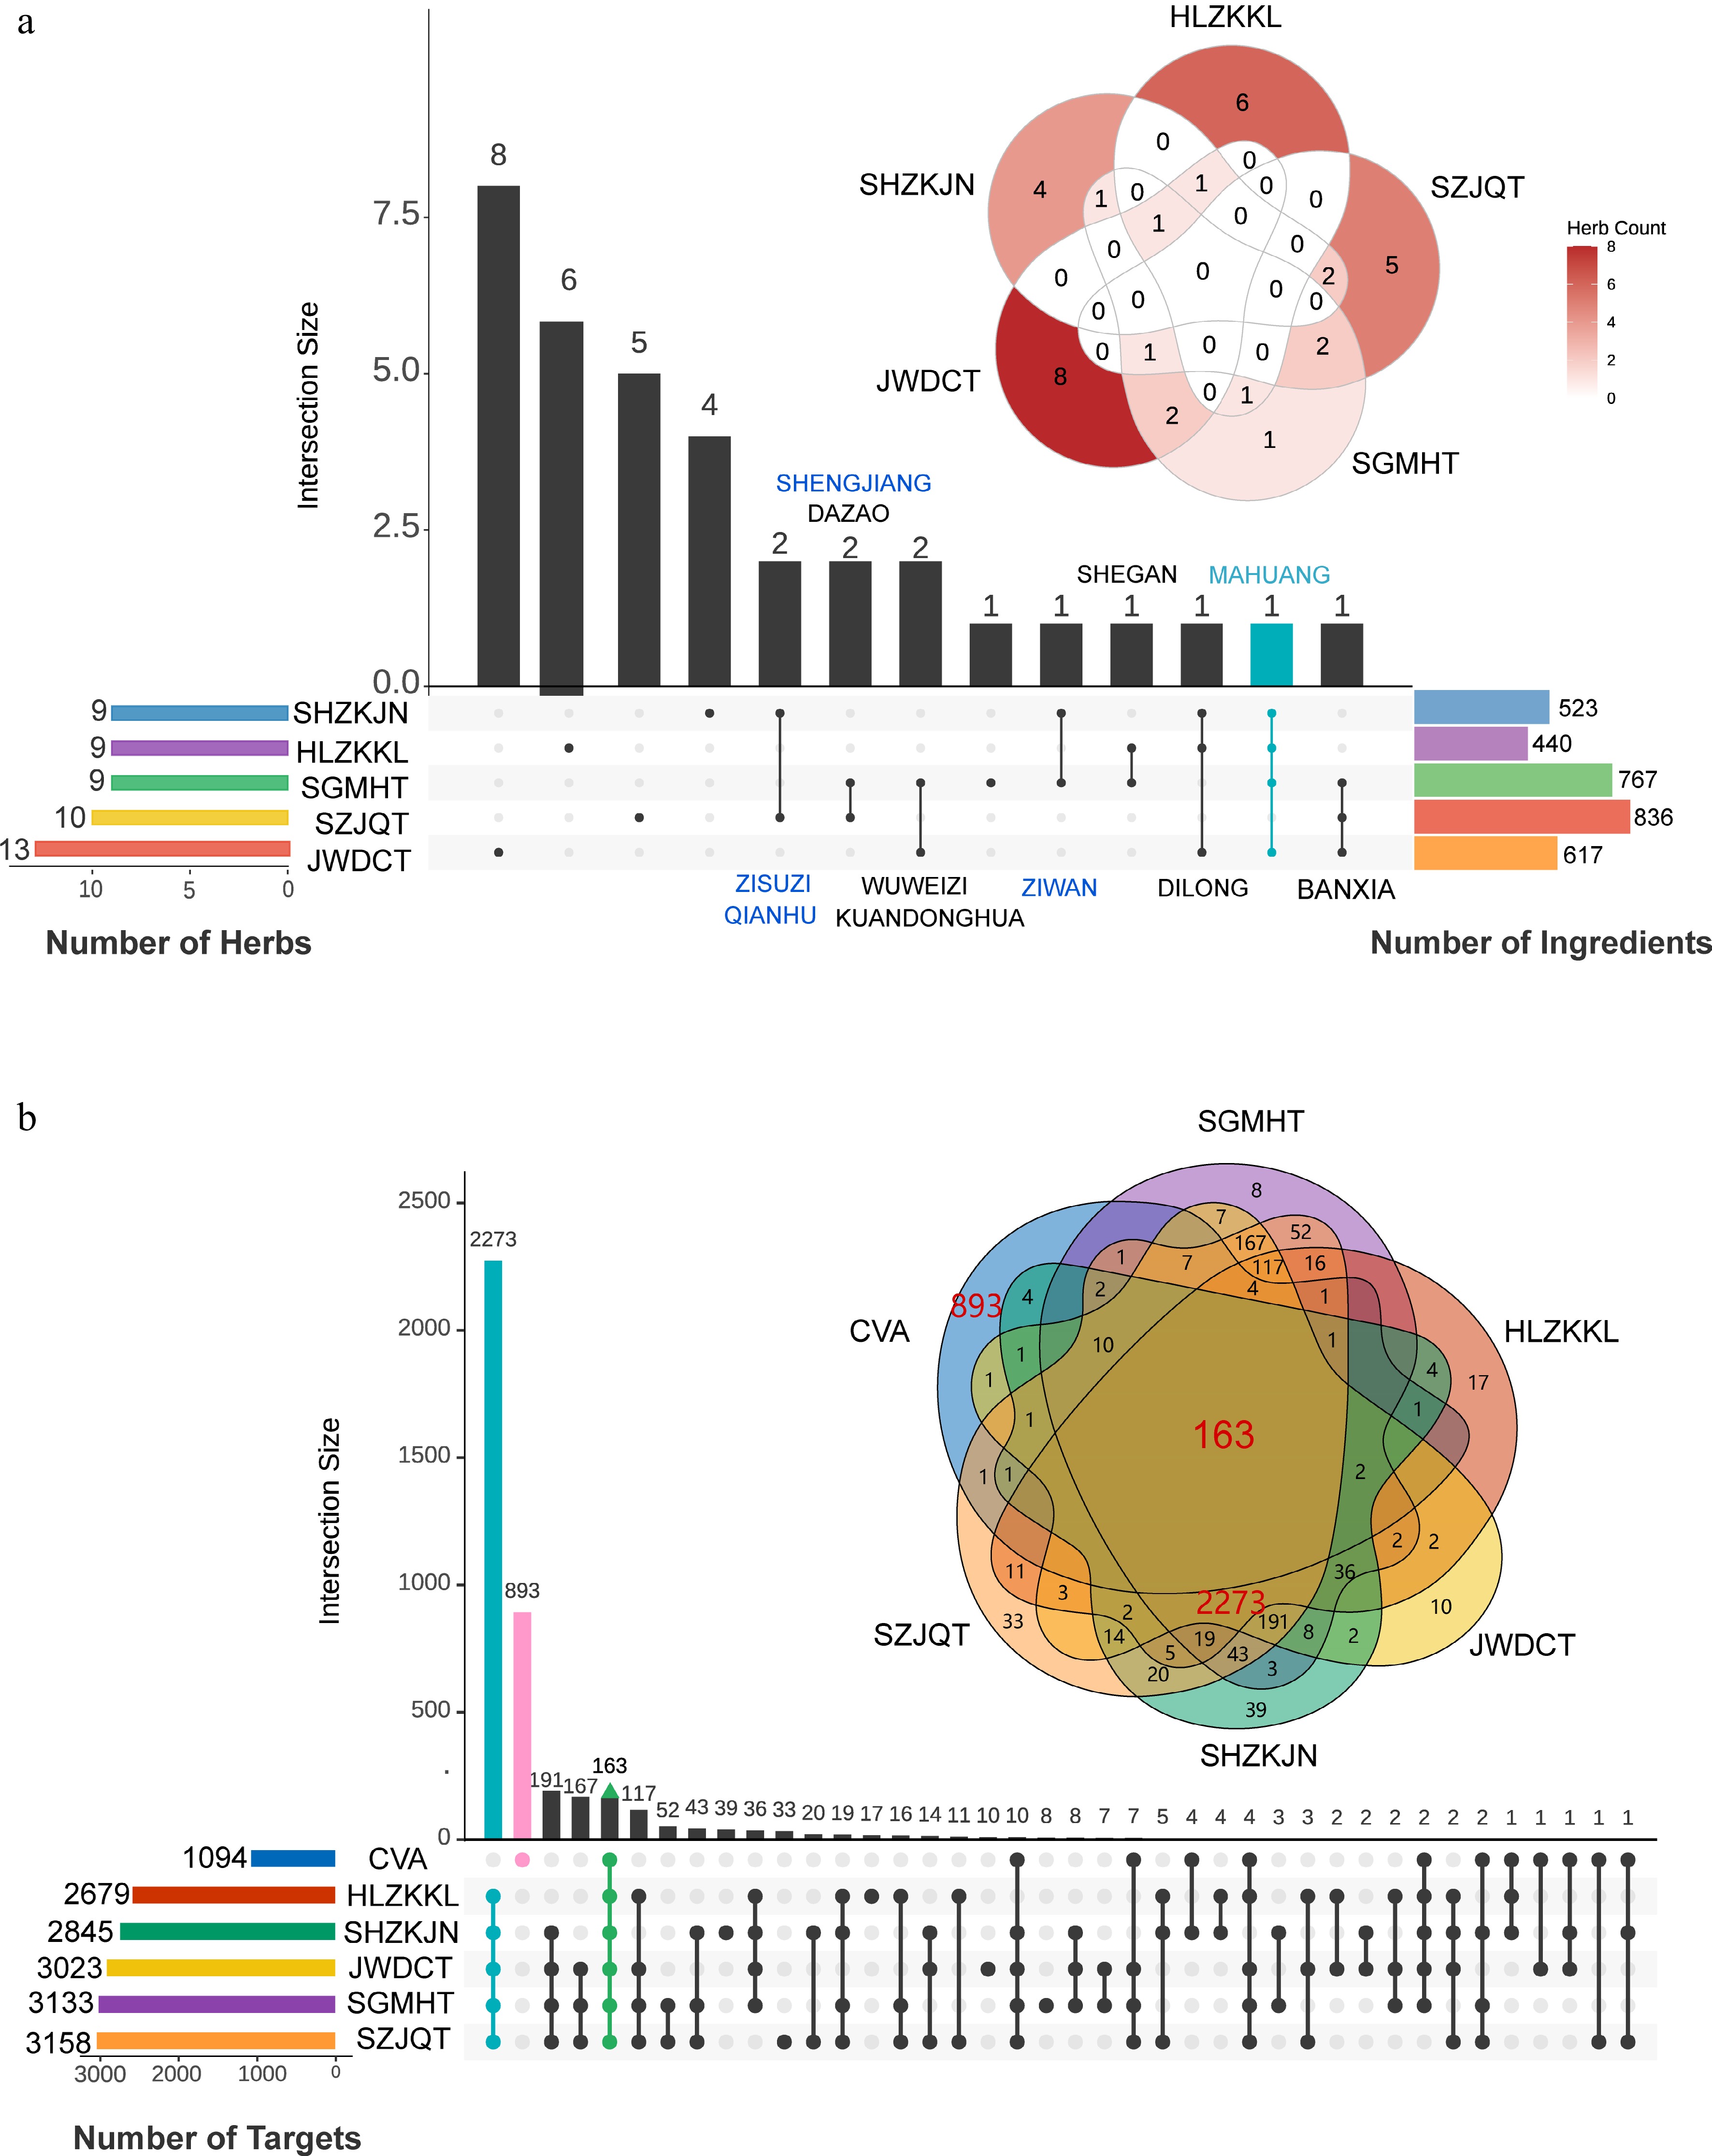
Figure 2.
Data collection for five prescriptions. (a) The overlap of herbs and ingredients among the five prescriptions. (b) The overlap of relevant targets between five prescriptions and CVA disease.
-
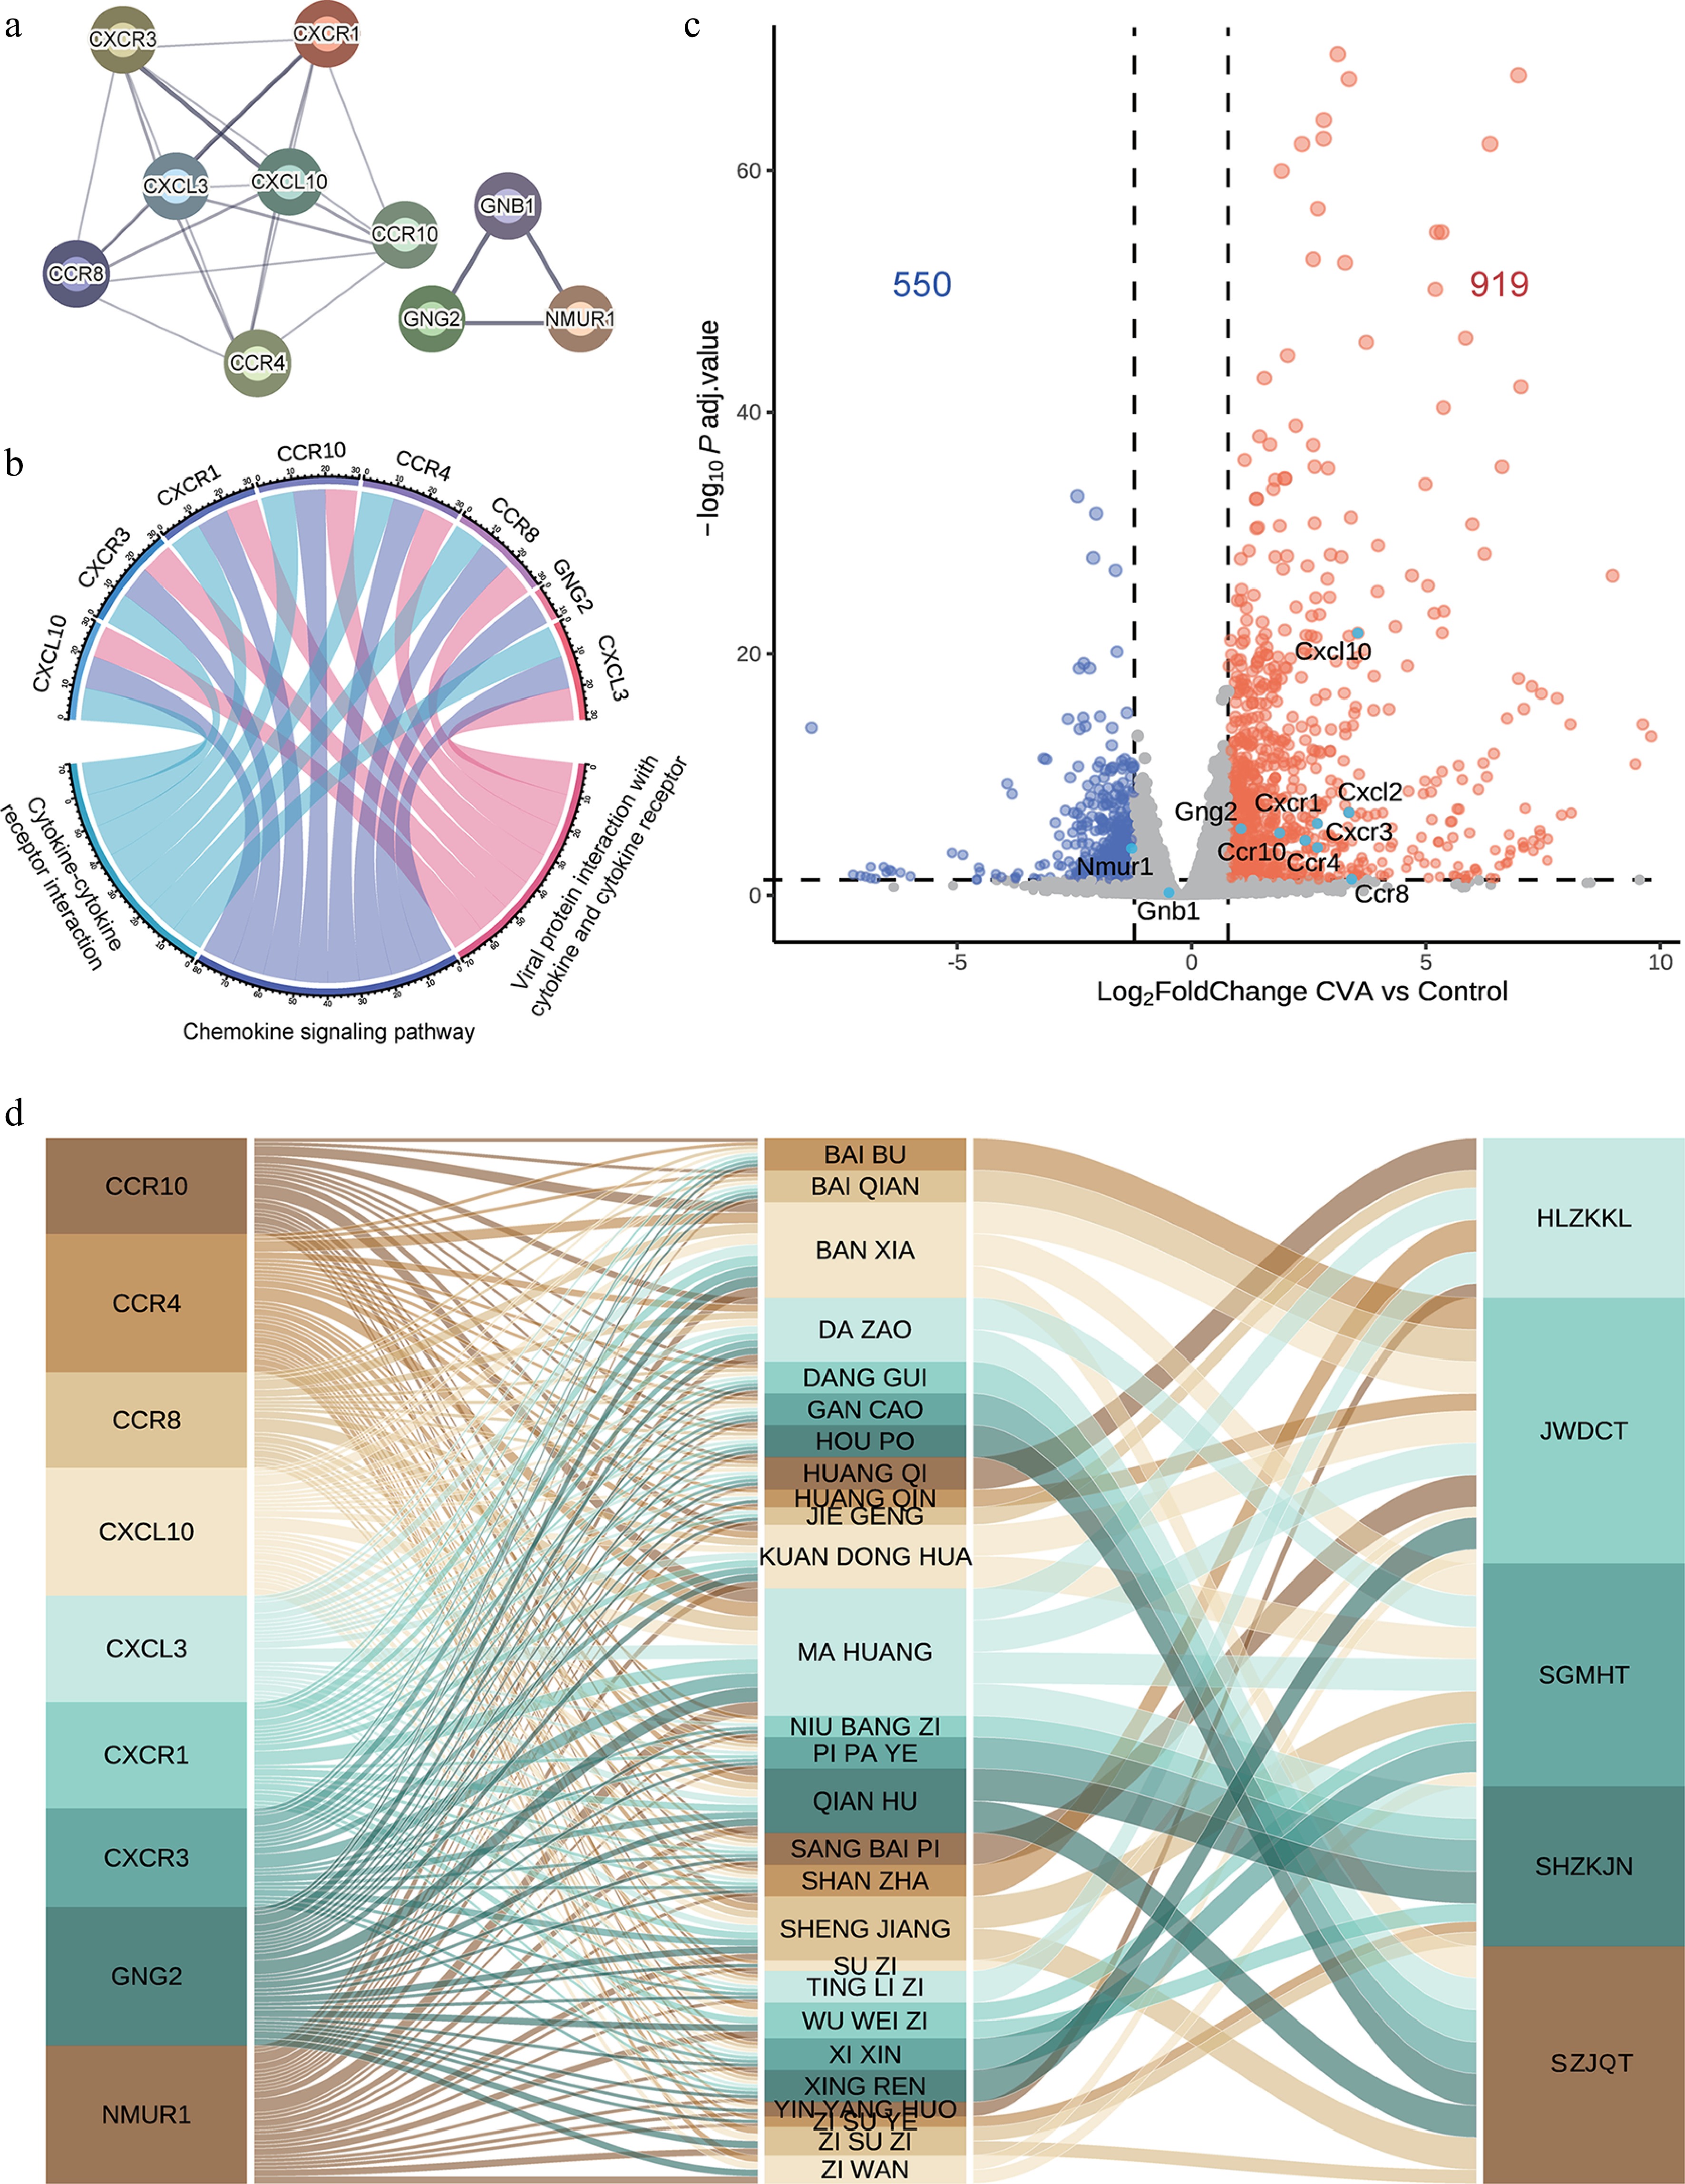
Figure 3.
Functional analysis of hub genes for CVA treatment. (a) The protein-protein interaction of the hub genes identified by MCC analysis. (b) A Sankey diagram illustrates the connections between hub-enriched genes and KEGG pathways. (c) Volcano plot showing DEGs in CVA animal models vs controls. (d) Mapping of hub genes to corresponding herbs and prescriptions.
-
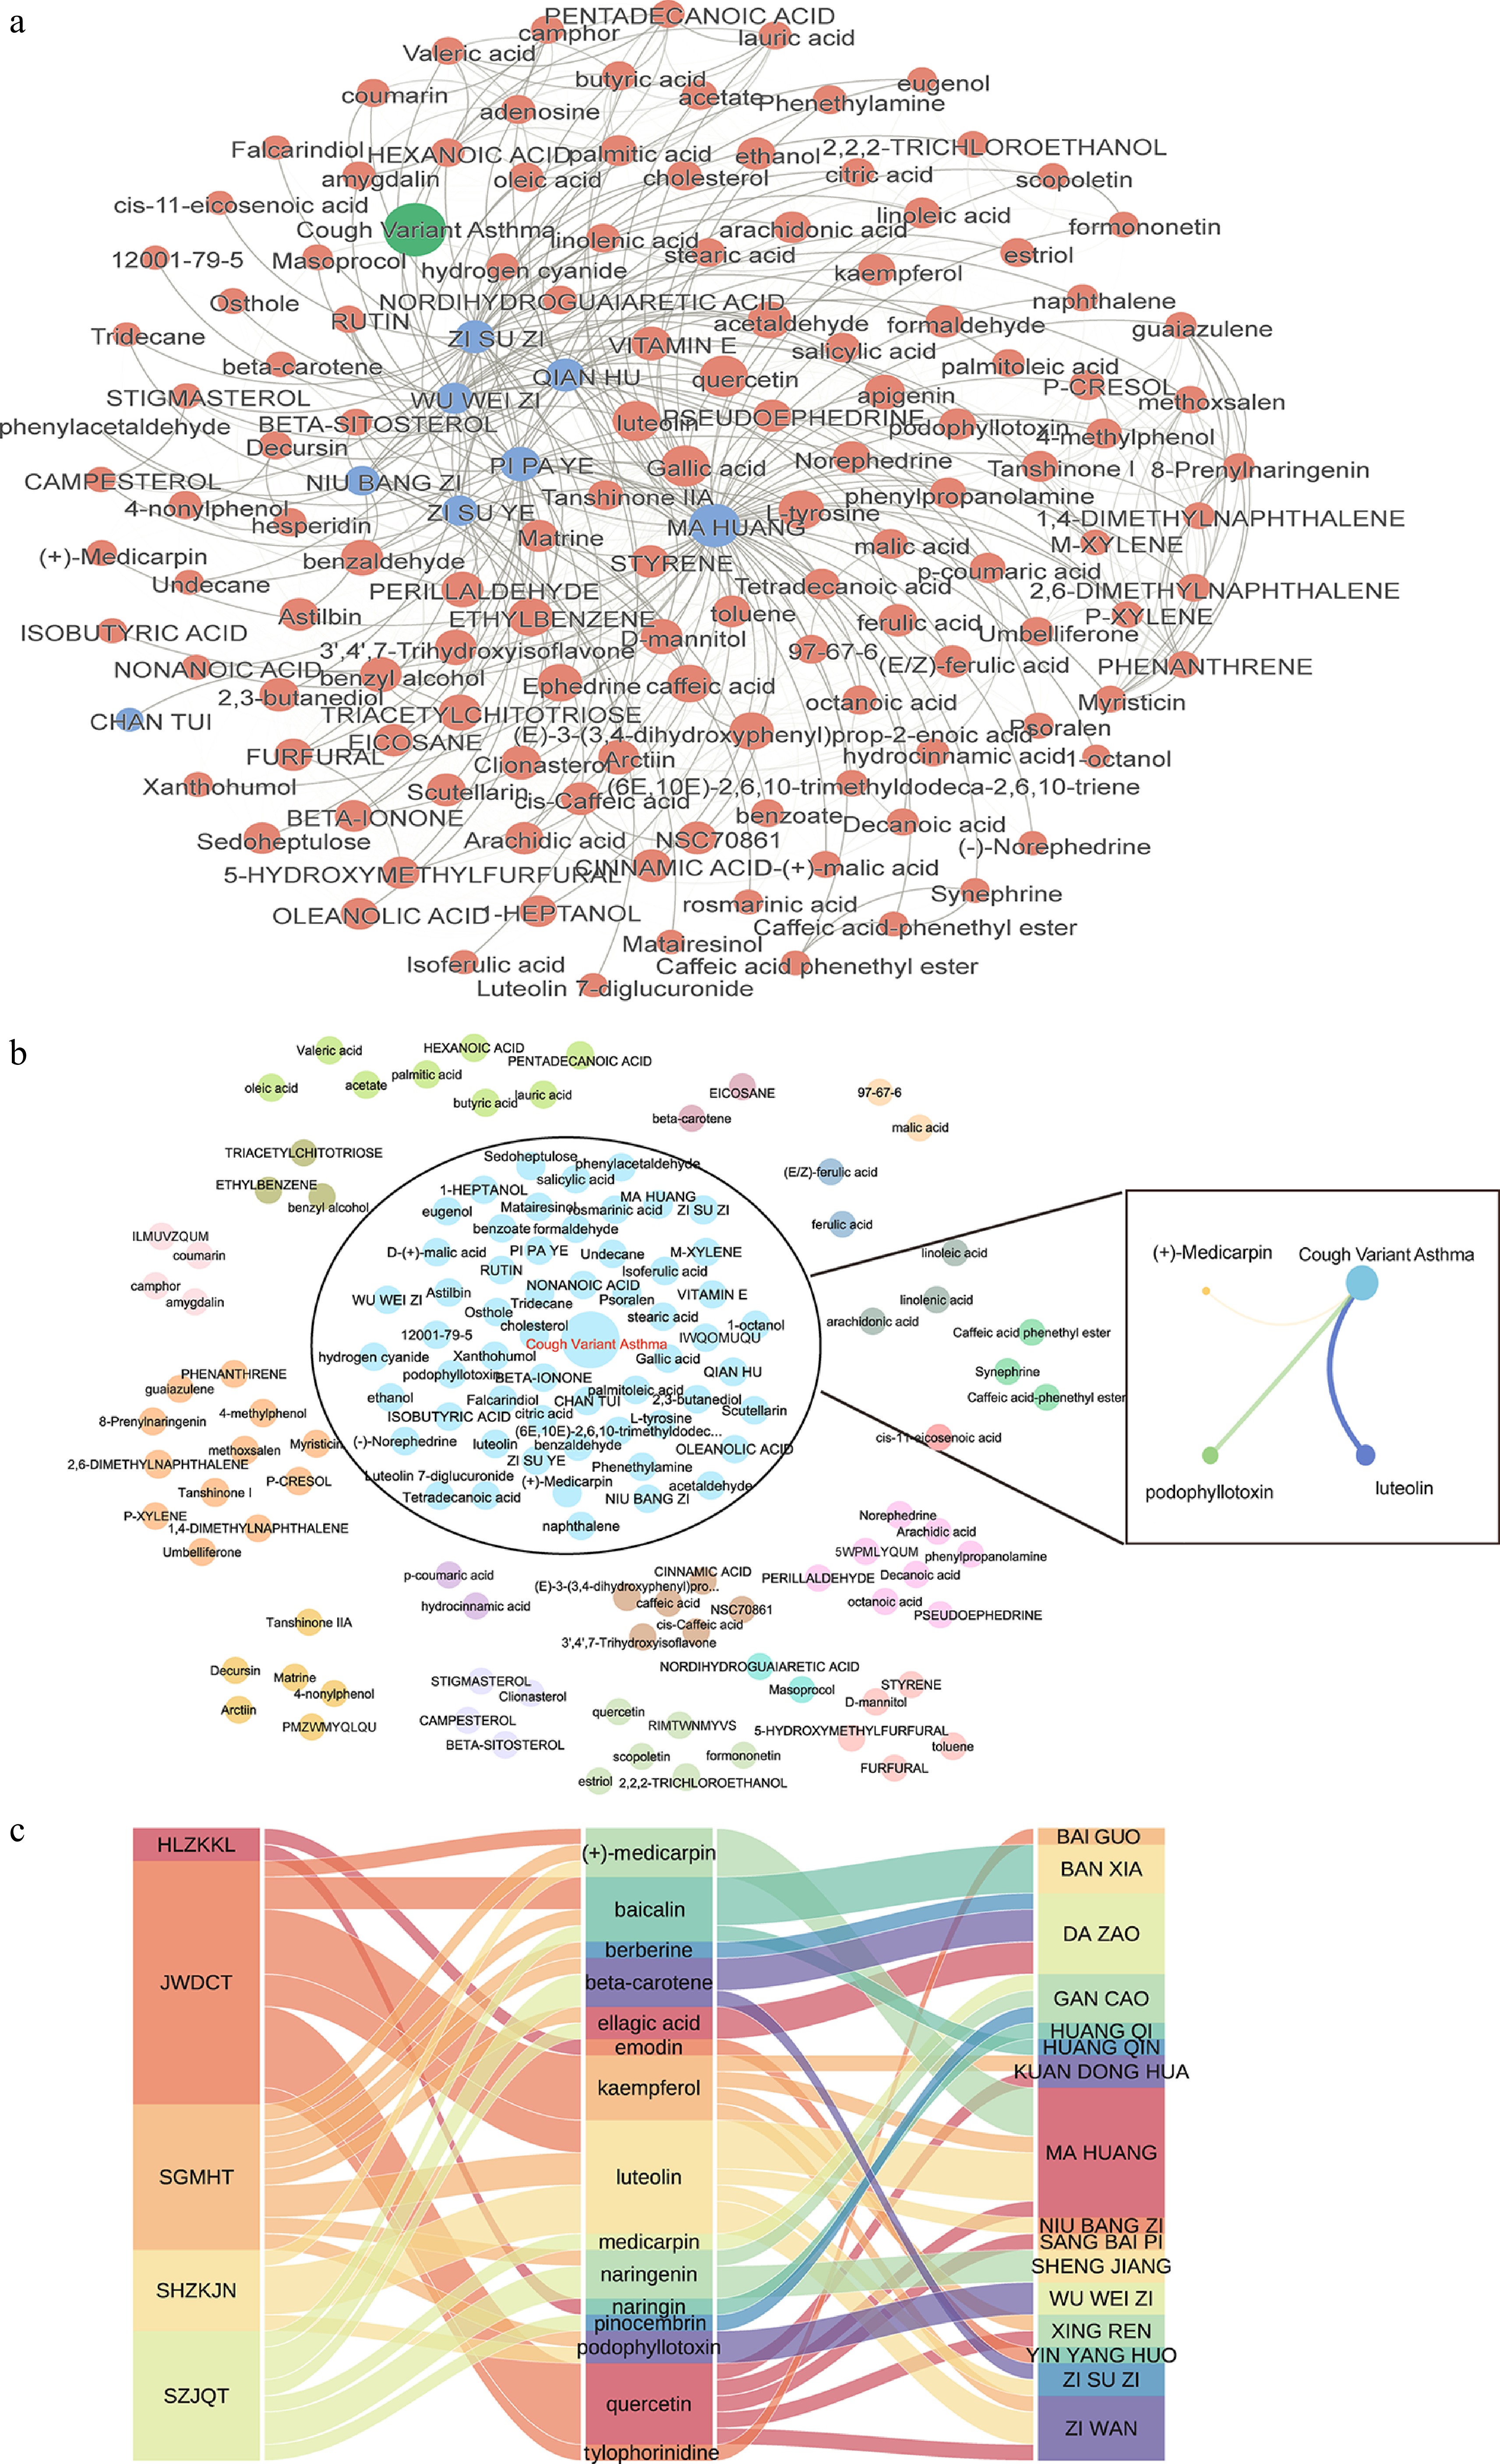
Figure 4.
Combinational landscape of SH. (a) Overview of the combinational network between herb-herb and ingredient-ingredient pairs, with network distance as edge weight. (b) Louvain community analysis of the proximity interaction network for SH. Ingredients clustered with the CVA disease, with OB ≥ 30% and DL ≥ 0.18, were used to construct an ingredient-disease interaction network. (c) Mapping synergistic ingredients to their respective prescriptions and herbs.
-
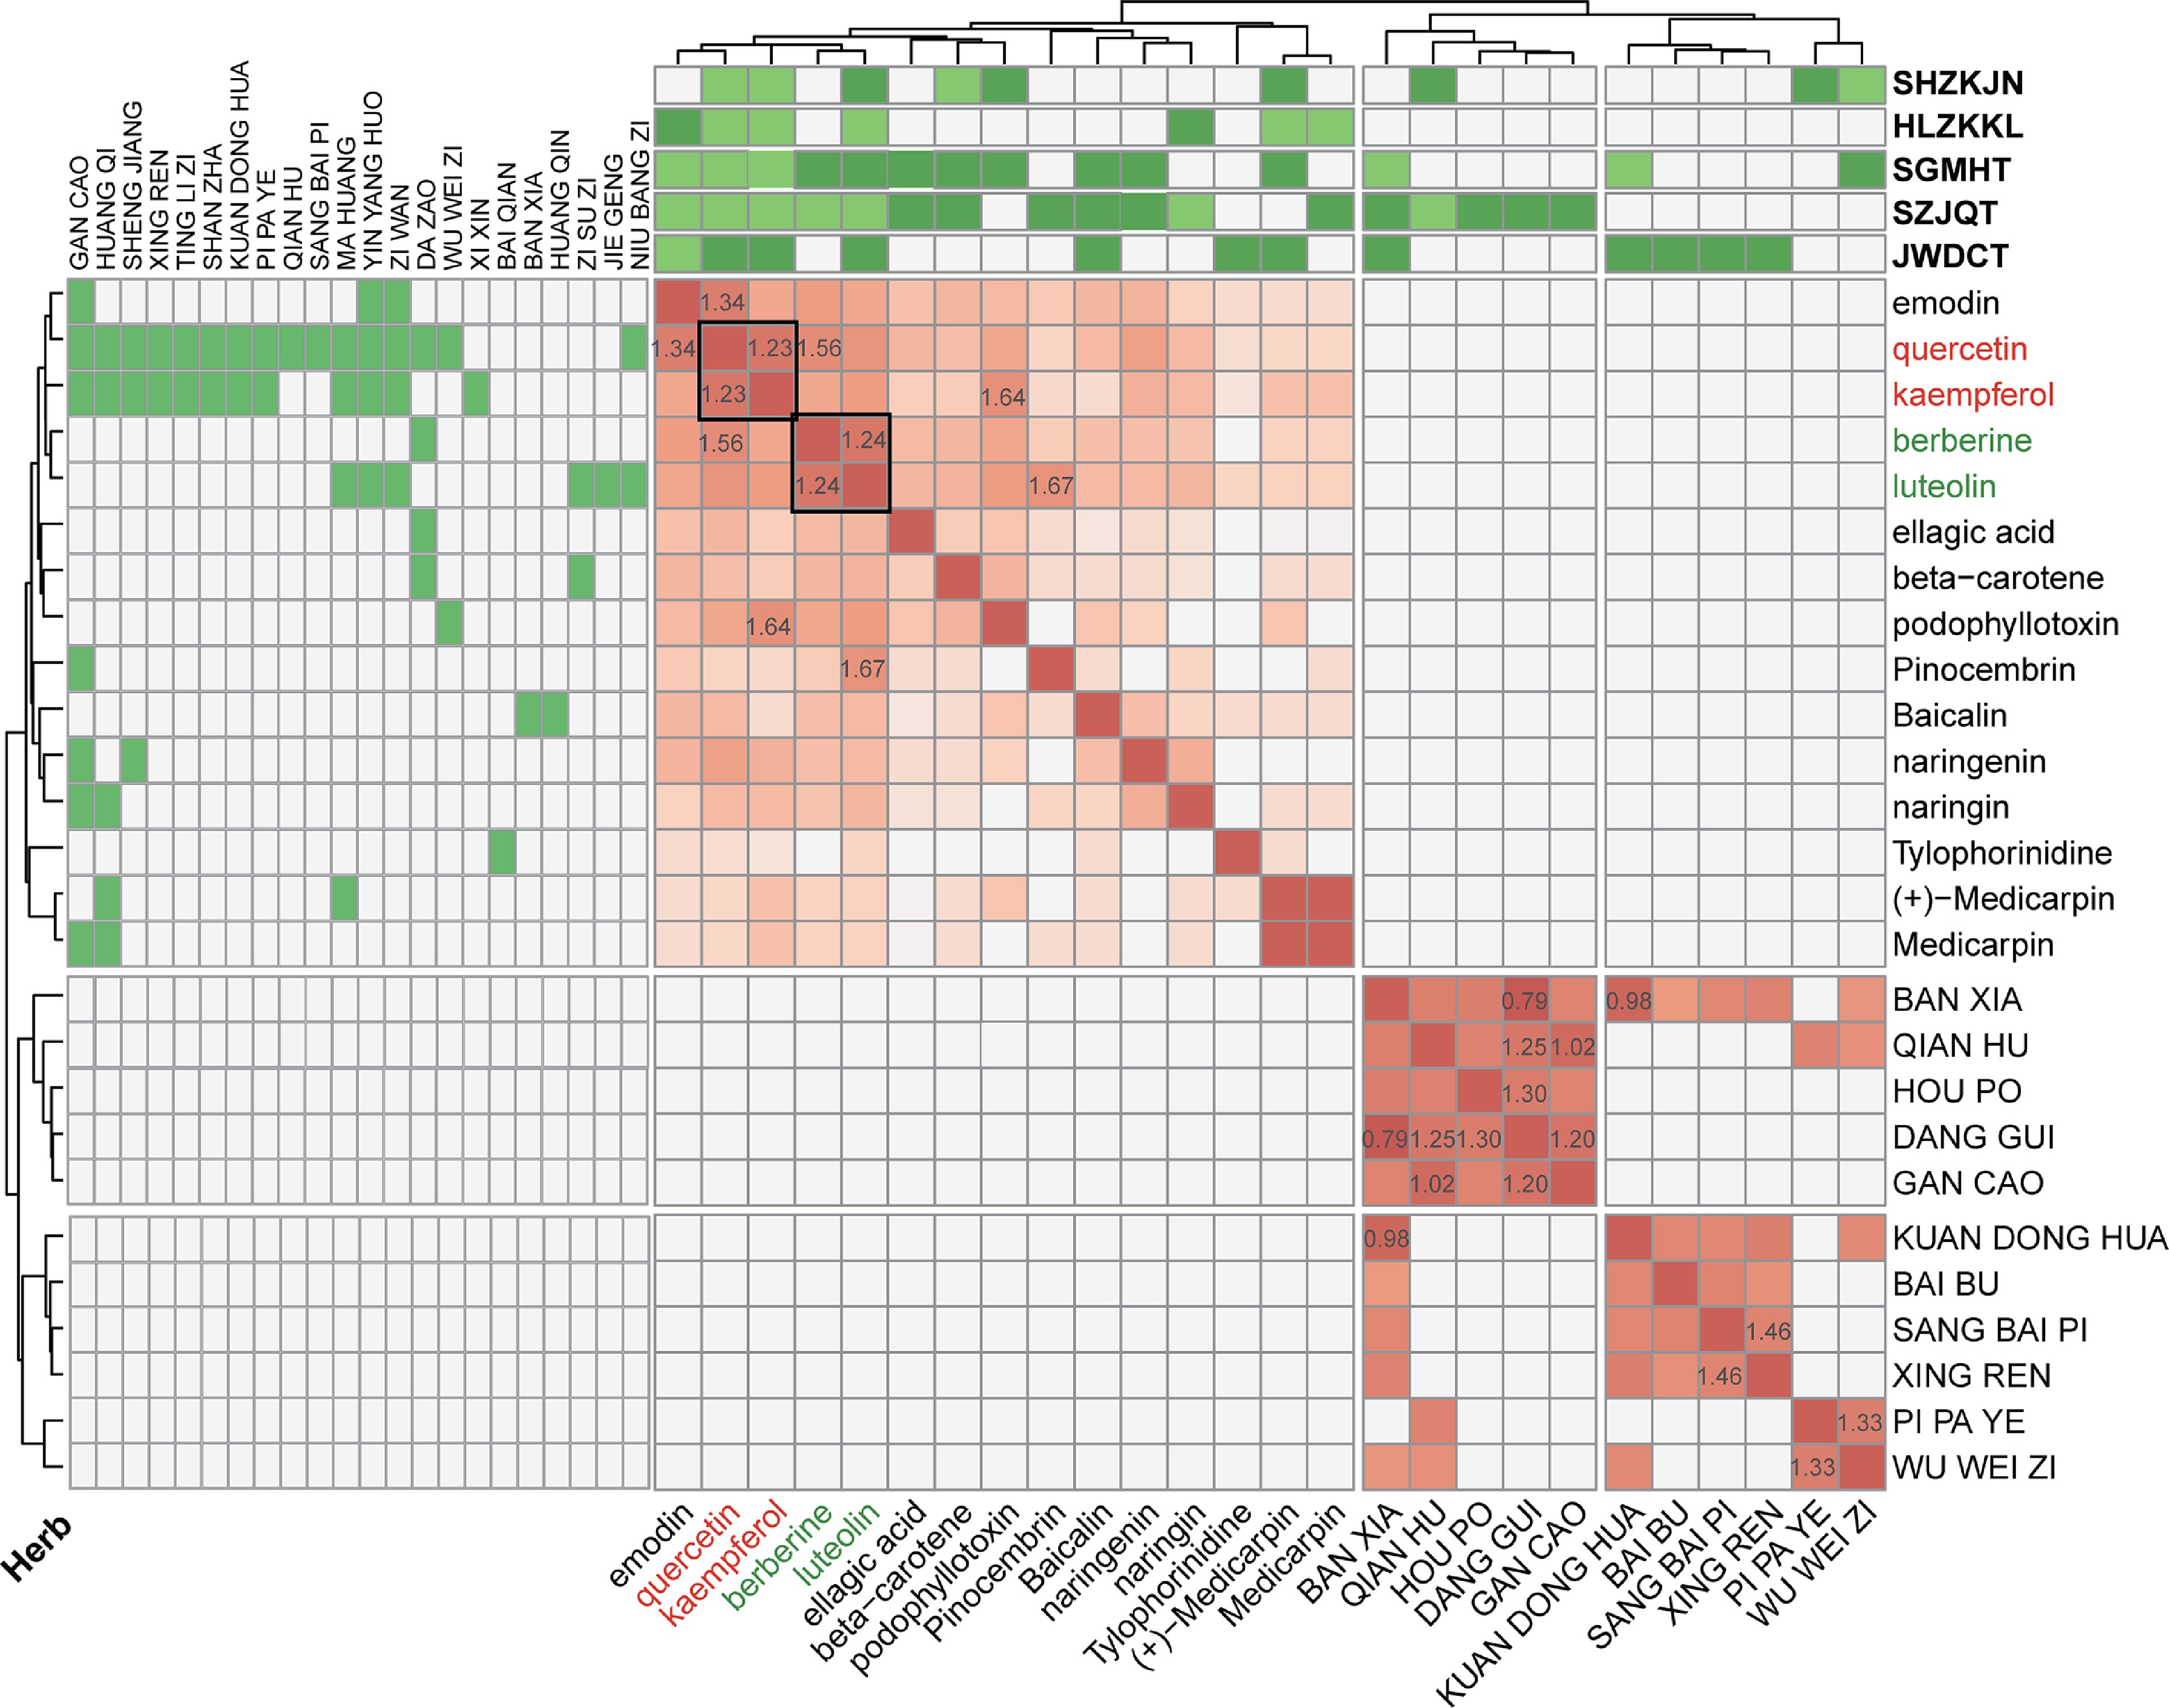
Figure 5.
Combinational characteristics via hierarchical clustering and network community analysis. The heatmap displays interaction scores for herb-herb and ingredient-ingredient pairs. The top and left panel show the corresponding herbs and prescriptions associated with these ingredients. The numerical values represent the actual distances, with smaller values indicating closer relationships.
-
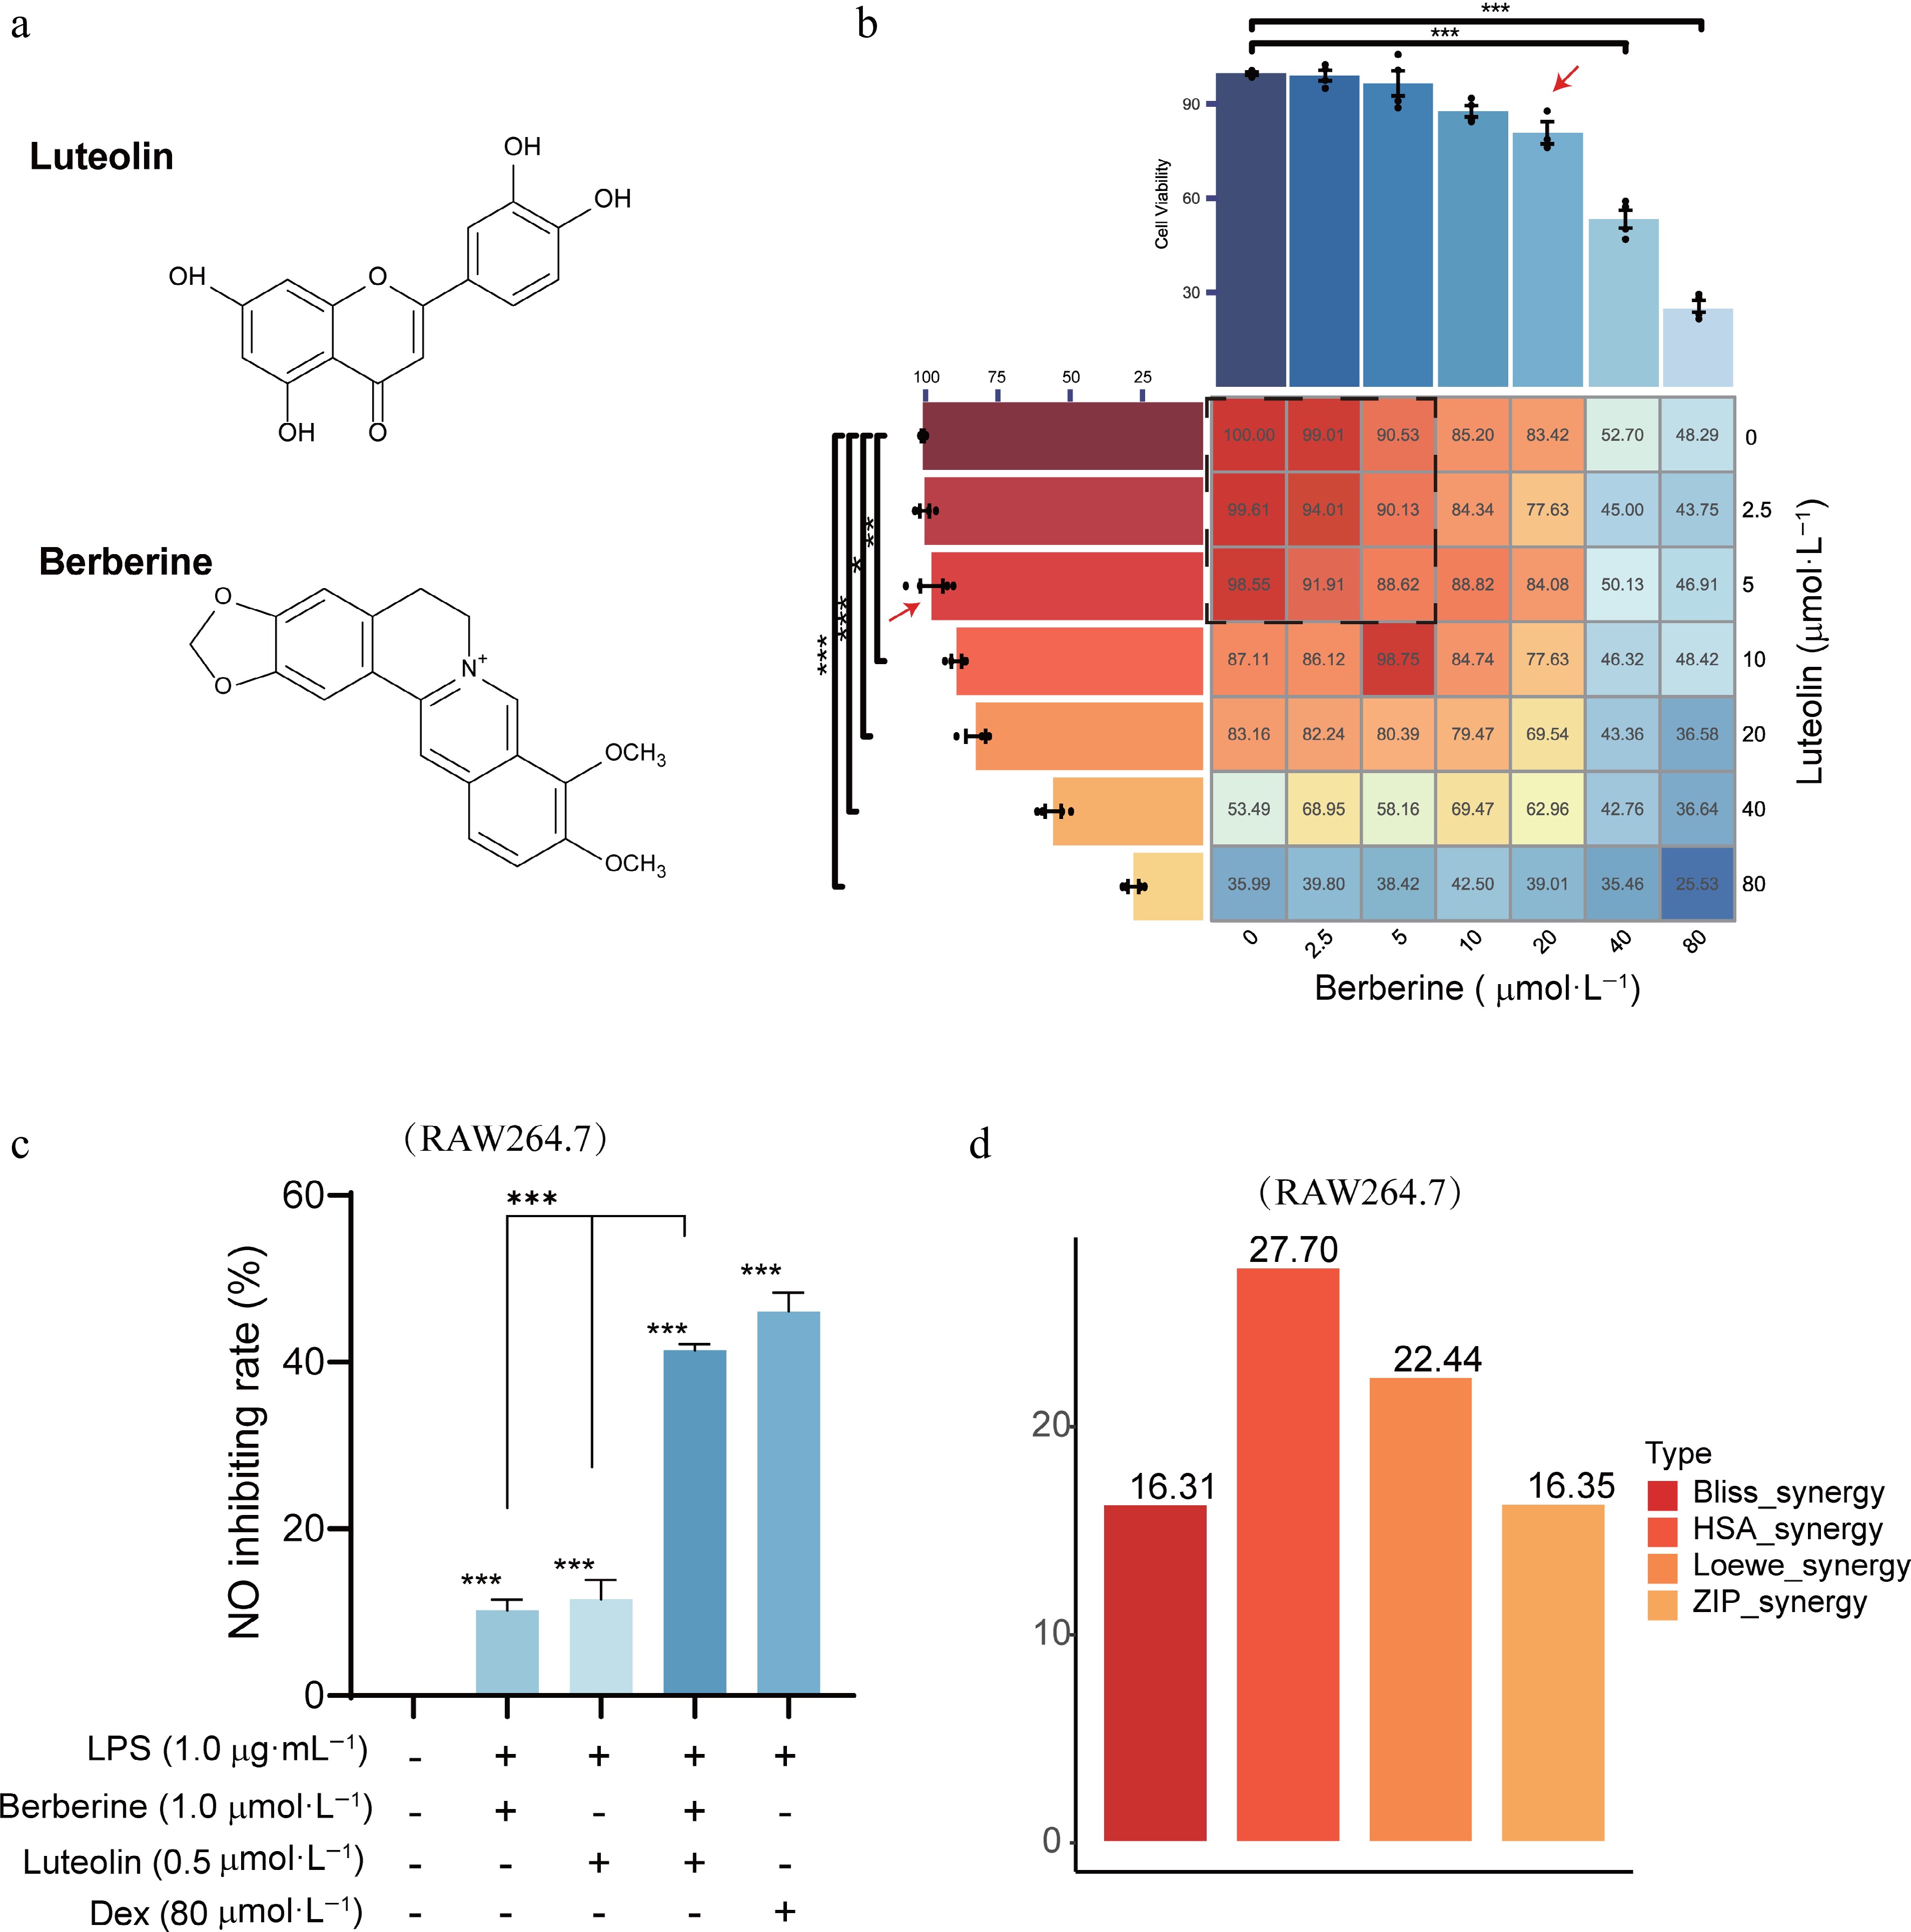
Figure 6.
MTT assay and synergy score of berberine and luteolin in RAW264.7 cells. (a) Chemical structures of berberine and luteolin. (b) Cellular viability with the MTT assay to determine the non-cytotoxic concentrations. (c) Comparison of no inhibition rates among berberine (1 μmol·L−1), luteolin (0.5 μmol·L−1), and Dex (80 μmol·L−1) following LPS stimulation for 24 h. Statistical significance is indicated as *** P < 0.001 vs the control group; and *** P < 0.001 vs the co-administration group. Data are presented as the mean ± SEM (n = 3). (d) Average synergy scores calculated using the HAS, Loewe, ZIP, and Bliss models of berberine and luteolin.
-
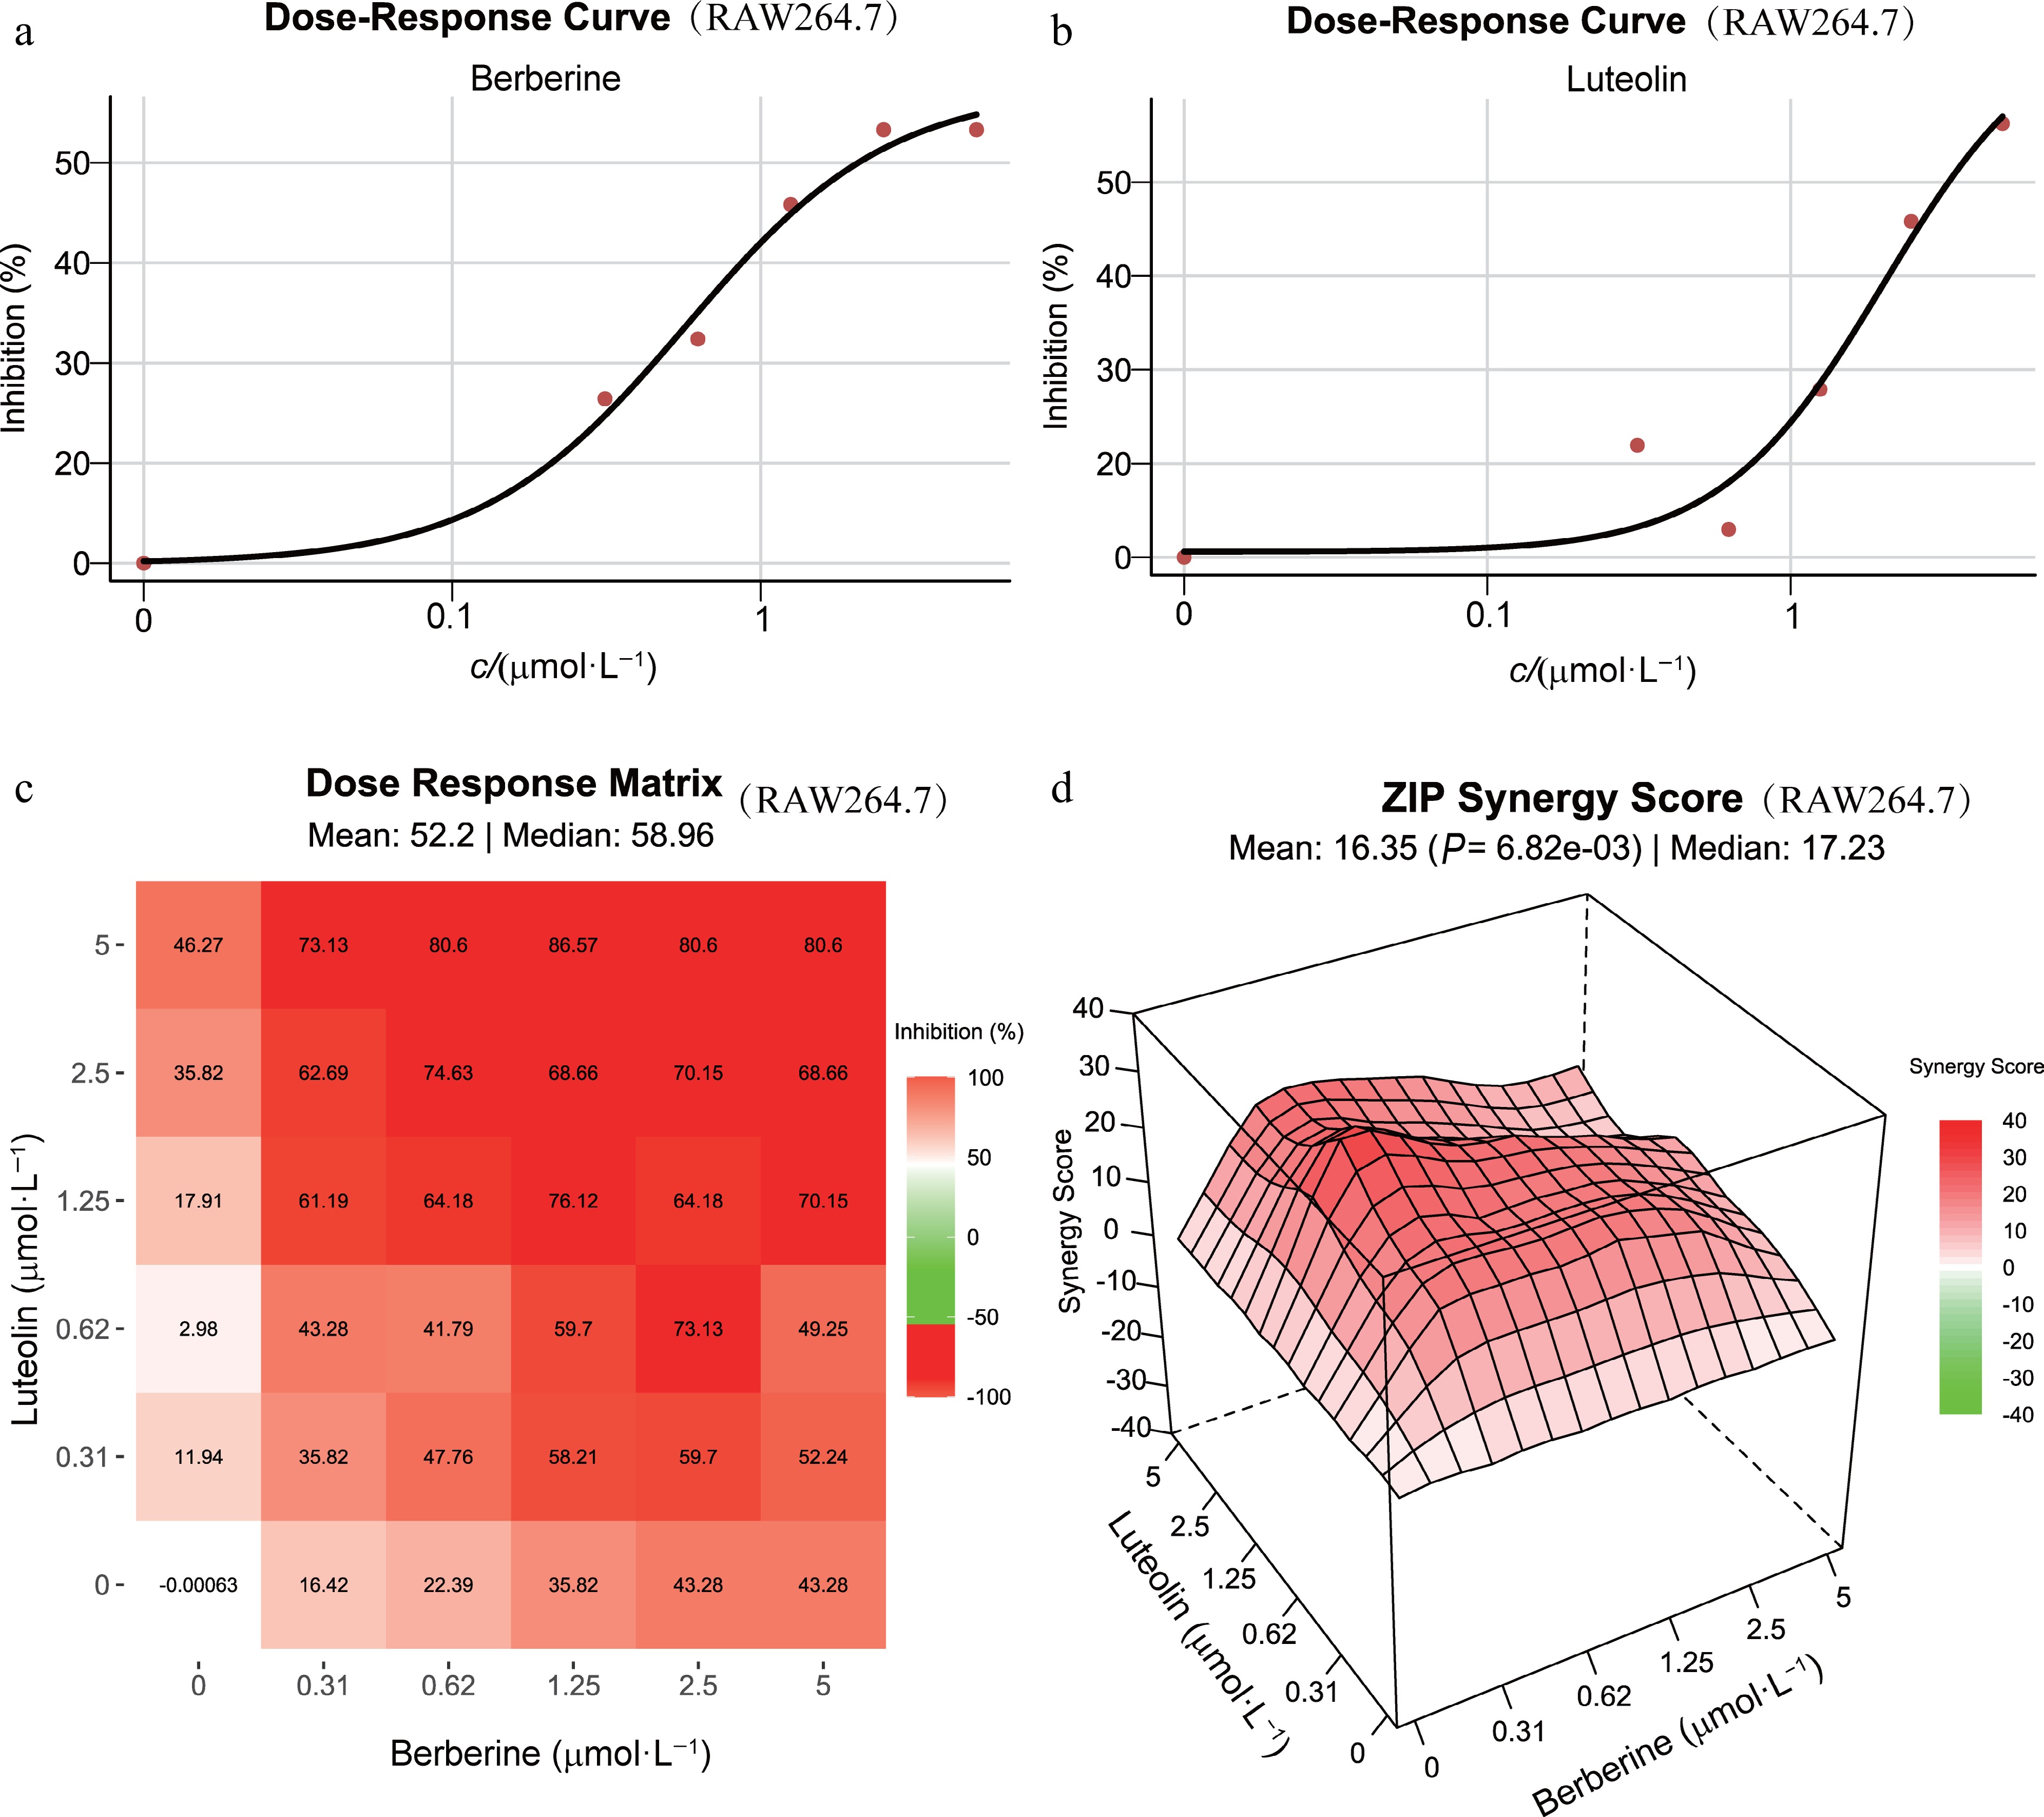
Figure 7.
Experimental validation of synergistic ingredients in LPS-stimulated RAW 264.7 cells. (a) and (b) Dose-response curves for berberine and luteolin at various concentrations in LPS-stimulated RAW 264.7 cells over 24 h. (c) Dose-response matrix showing the effects of combining different concentrations of berberine and luteolin. (d) 3D plot of combinational landscapes with ZIP synergy scores.
-
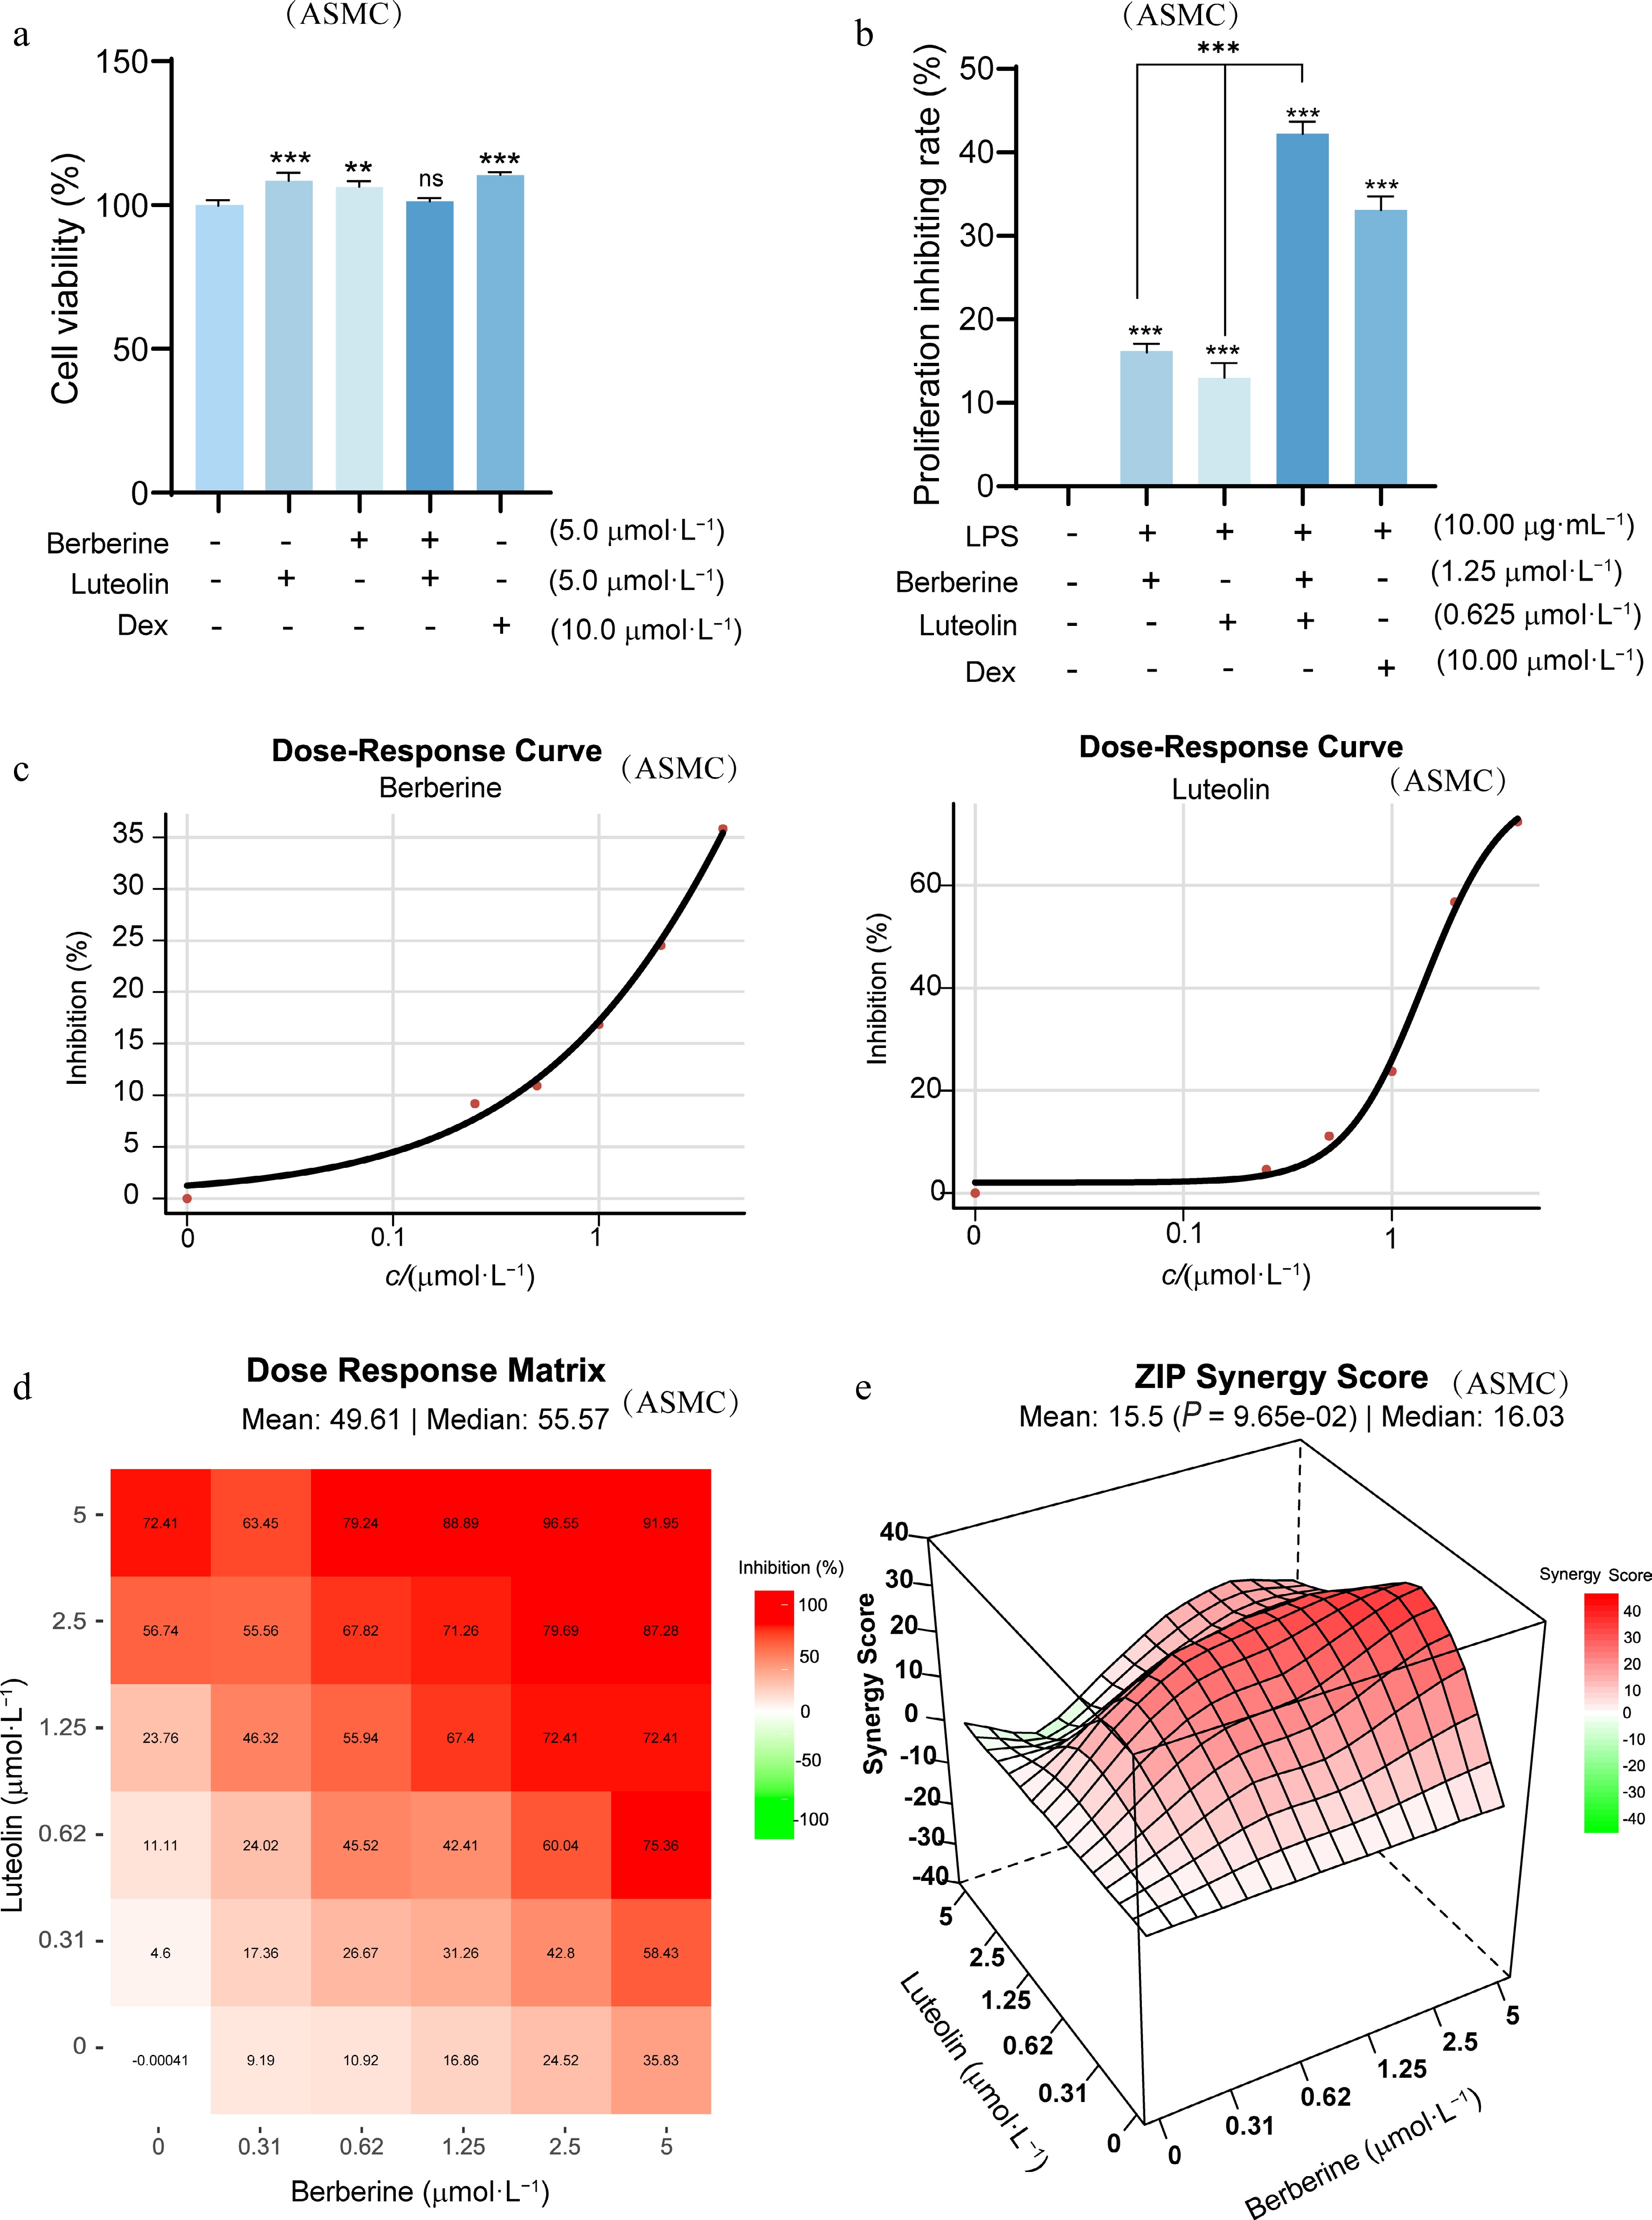
Figure 8.
Synergistic effects of berberine and luteolin on LPS-stimulated ASMCs. (a) Assessment of ASMC cell viability using the MTT assay to confirm that all concentrations tested are non-cytotoxic. ** P < 0.01, *** P < 0.001 vs the control group. (b) Comparison of cell proliferation inhibition rate among berberine (1.25 μmol·L−1), luteolin (0.625 μmol·L−1), and Dex (10 μmol·L−1) following LPS stimulation for 24 h. Statistical significance is indicated as *** P < 0.001 vs the control group and *** P < 0.001 vs the co-administration group. Data are presented as the mean ± SEM (n = 3). (c) Dose-response curves for berberine and luteolin at varying concentrations (0–5 μmol·L−1) in LPS-stimulated ASMCs. (d) Dose-response matrix of combined berberine and luteolin in LPS-stimulated ASMCs. (e) 3D plot of synergy landscape with ZIP scores.
-
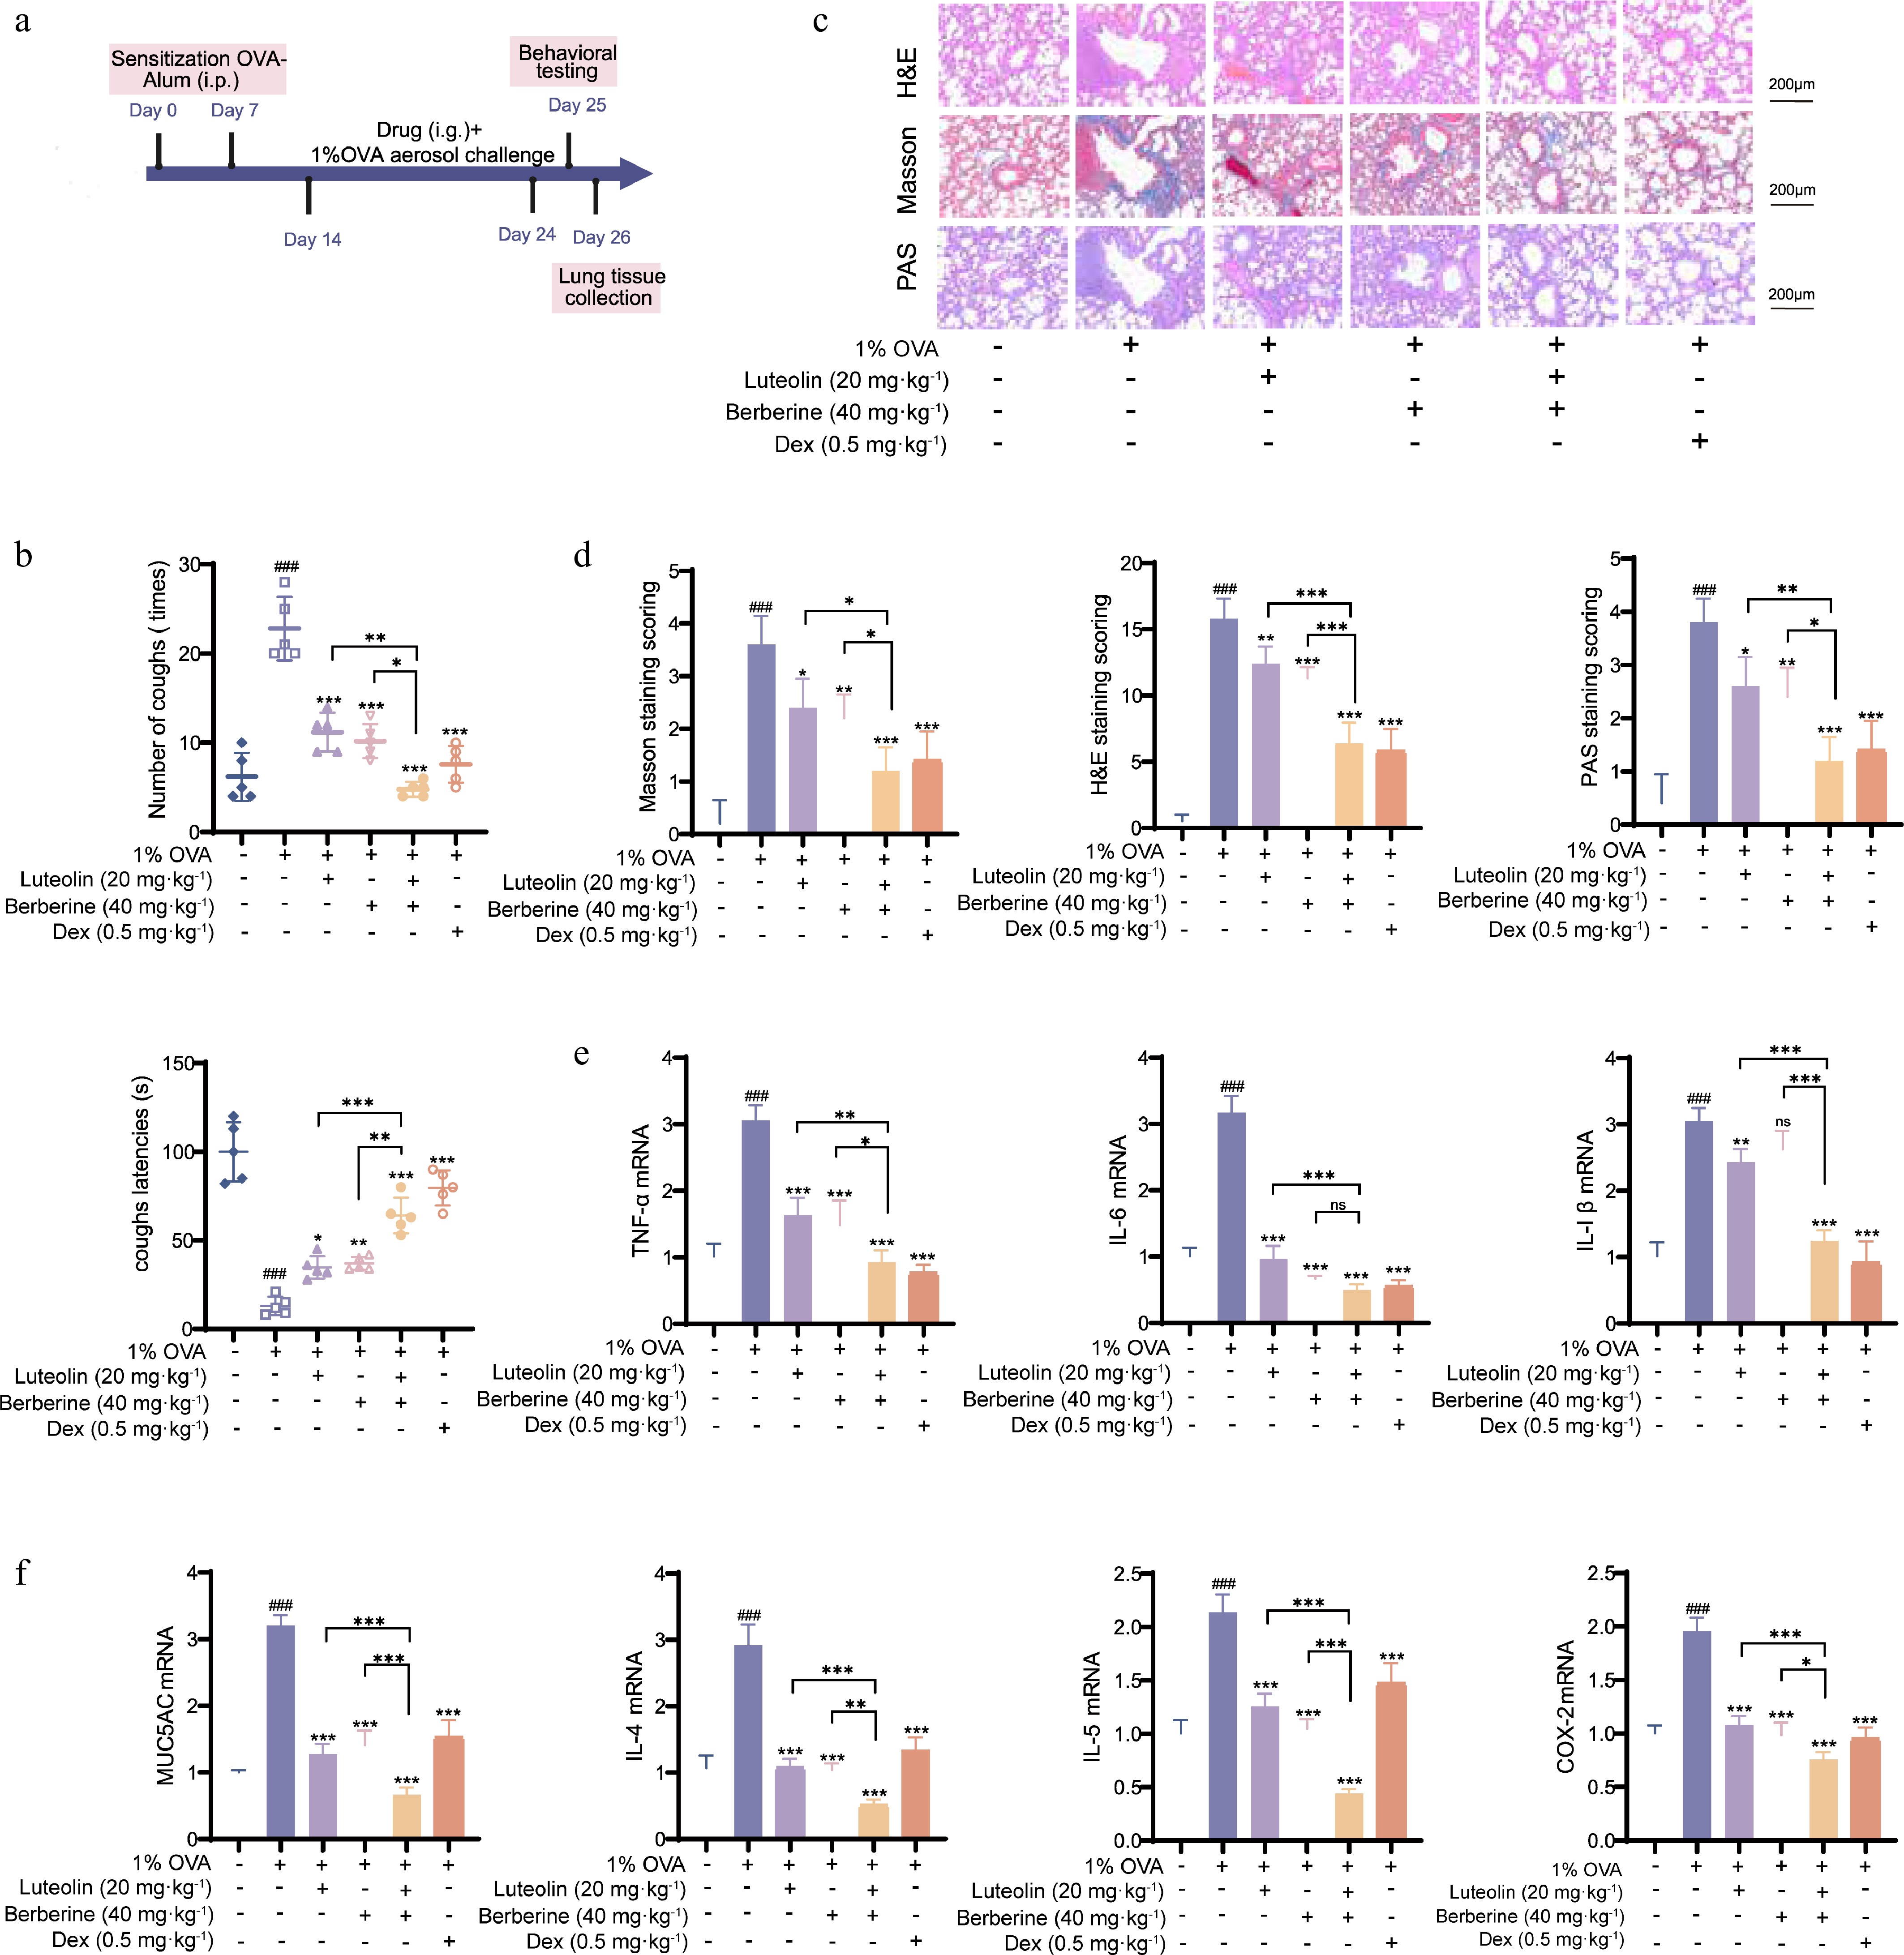
Figure 9.
Synergistic therapeutic effects of berberine and luteolin in OVA-induced CVA rats. (a) In vivo experimental procedure. (b) Measurement of cough frequency and cough latency in six groups of rats. (c), (d) Lung tissue pathological sections from rats were stained with H&E, Masson, and PAS, and lung injury was assessed. (e), (f) mRNA expression of CVA-related cytokines (TNF-α, IL-6, IL-1β, MUC5AC, IL-4, IL-5, and COX-2) in rat lung tissues determined by qPCR. Scale bars: 100 μm, ### P < 0.001 vs the control group; * P < 0.05, ** P < 0.01, *** P < 0.001 vs the OVA group; and * P < 0.05, ** P < 0.01, *** P < 0.001 vs the co-administration group. Data are presented as the mean ± SEM (n = 3).
-
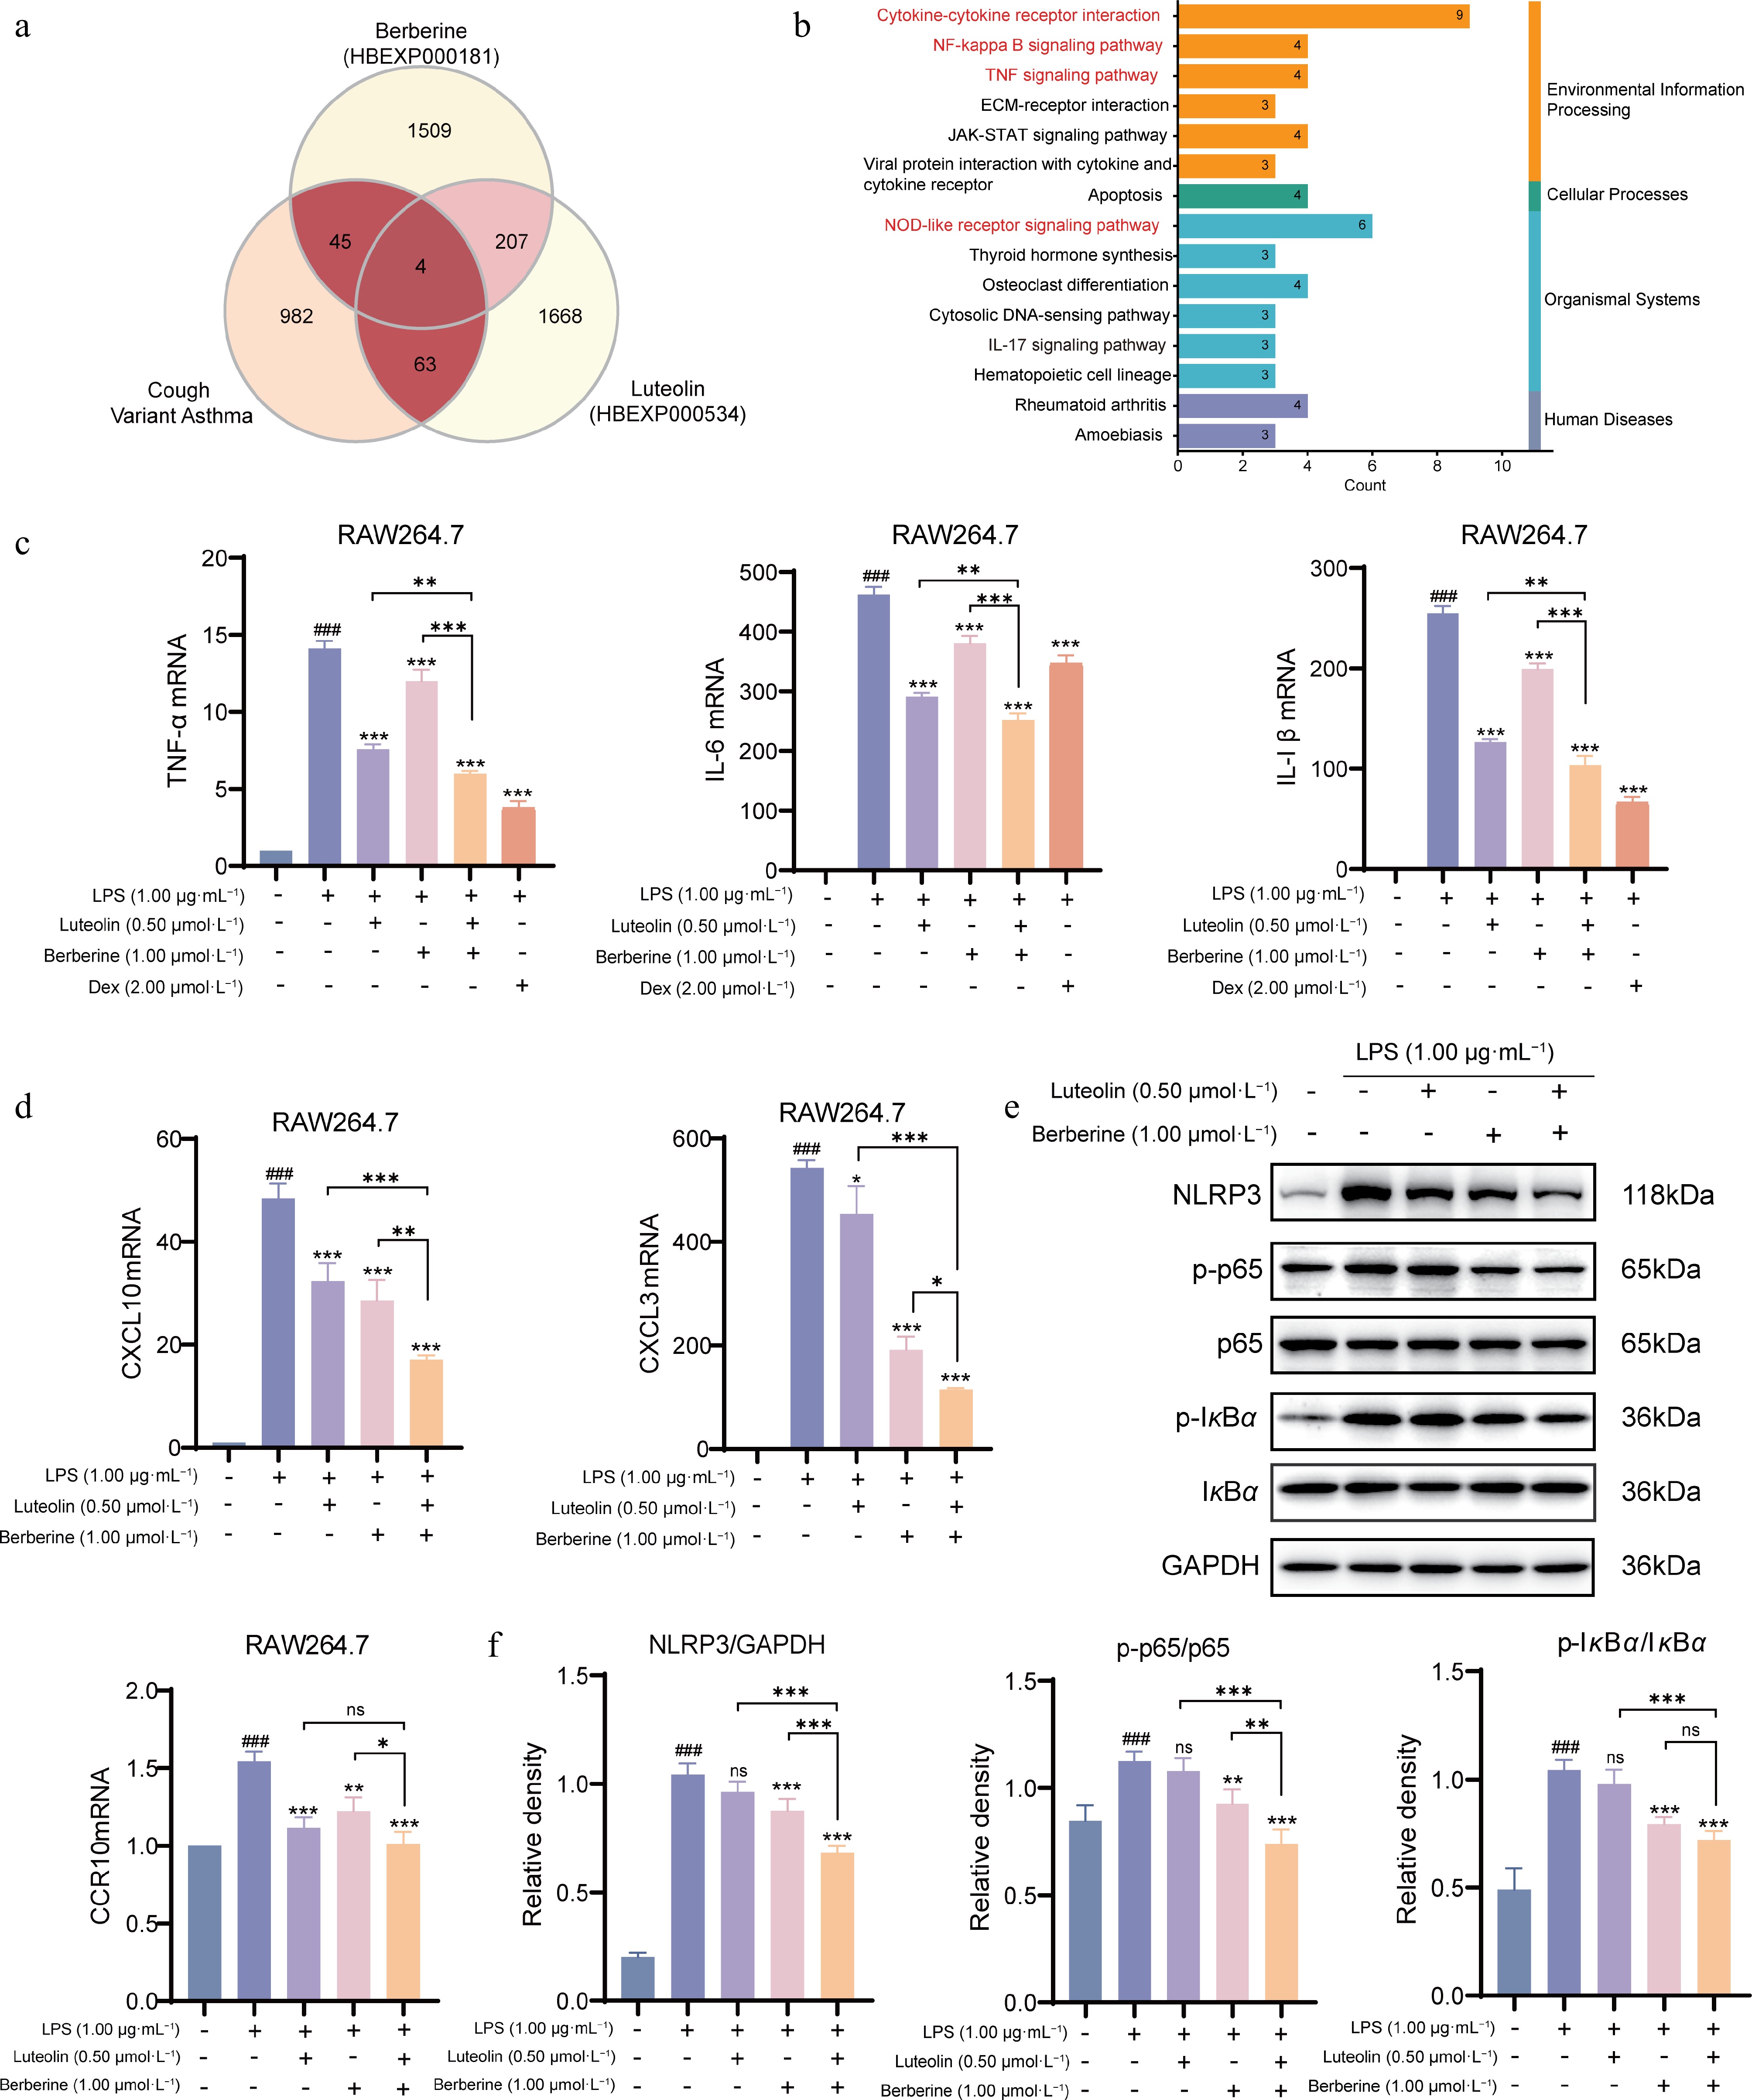
Figure 10.
The mechanism of synergistic treatment of CVA with berberine and luteolin in RAW264.7 cell. (a) Collection and analysis of the transcriptome data of berberine and luteolin from the HERB database. (b) KEGG pathway enrichment analysis of the synergistic components. (c) Measurement of mRNA expression of pro-inflammatory cytokines (TNF-α, IL-6, and IL-1β) in RAW264.7 cells by qPCR. (d) Measurement of mRNA expression of key chemokines and their receptors (CXCL10, CXCL3, and CCR10) in RAW264.7 cells by qPCR. (e), (f) Western blot analysis of the NLRP3 inflammasome and NF-κB signaling pathway. The protein expression levels of NLRP3, p-p65, p65, p-IκBα, and IκBα were detected by Western blot, and quantified using densitometric analysis. ### P < 0.001 vs the control group; * P < 0.05, ** P < 0.01, *** P < 0.001 vs the LPS group, and * P < 0.05, ** P < 0.01, *** P < 0.001 vs the co-administration group. Data are presented as the mean ± SEM (n = 3)
Figures
(10)
Tables
(0)