-

Figure 1.
Effect of salinity on fresh weight (FW) and dry weight (DW) of cilantro in experiments 1 and 2. Different uppercase letters indicate significant effect of salinity on FW whereas lowercase indicates significant effect of salinity on DW at p ≤ 0.05. The error bars represent ± 1 standard error of the mean (n = 10). The solid bar represents FW, and the striped bar represents DW. Italic text shows the significant impact of salinity on the measured parameters.
-
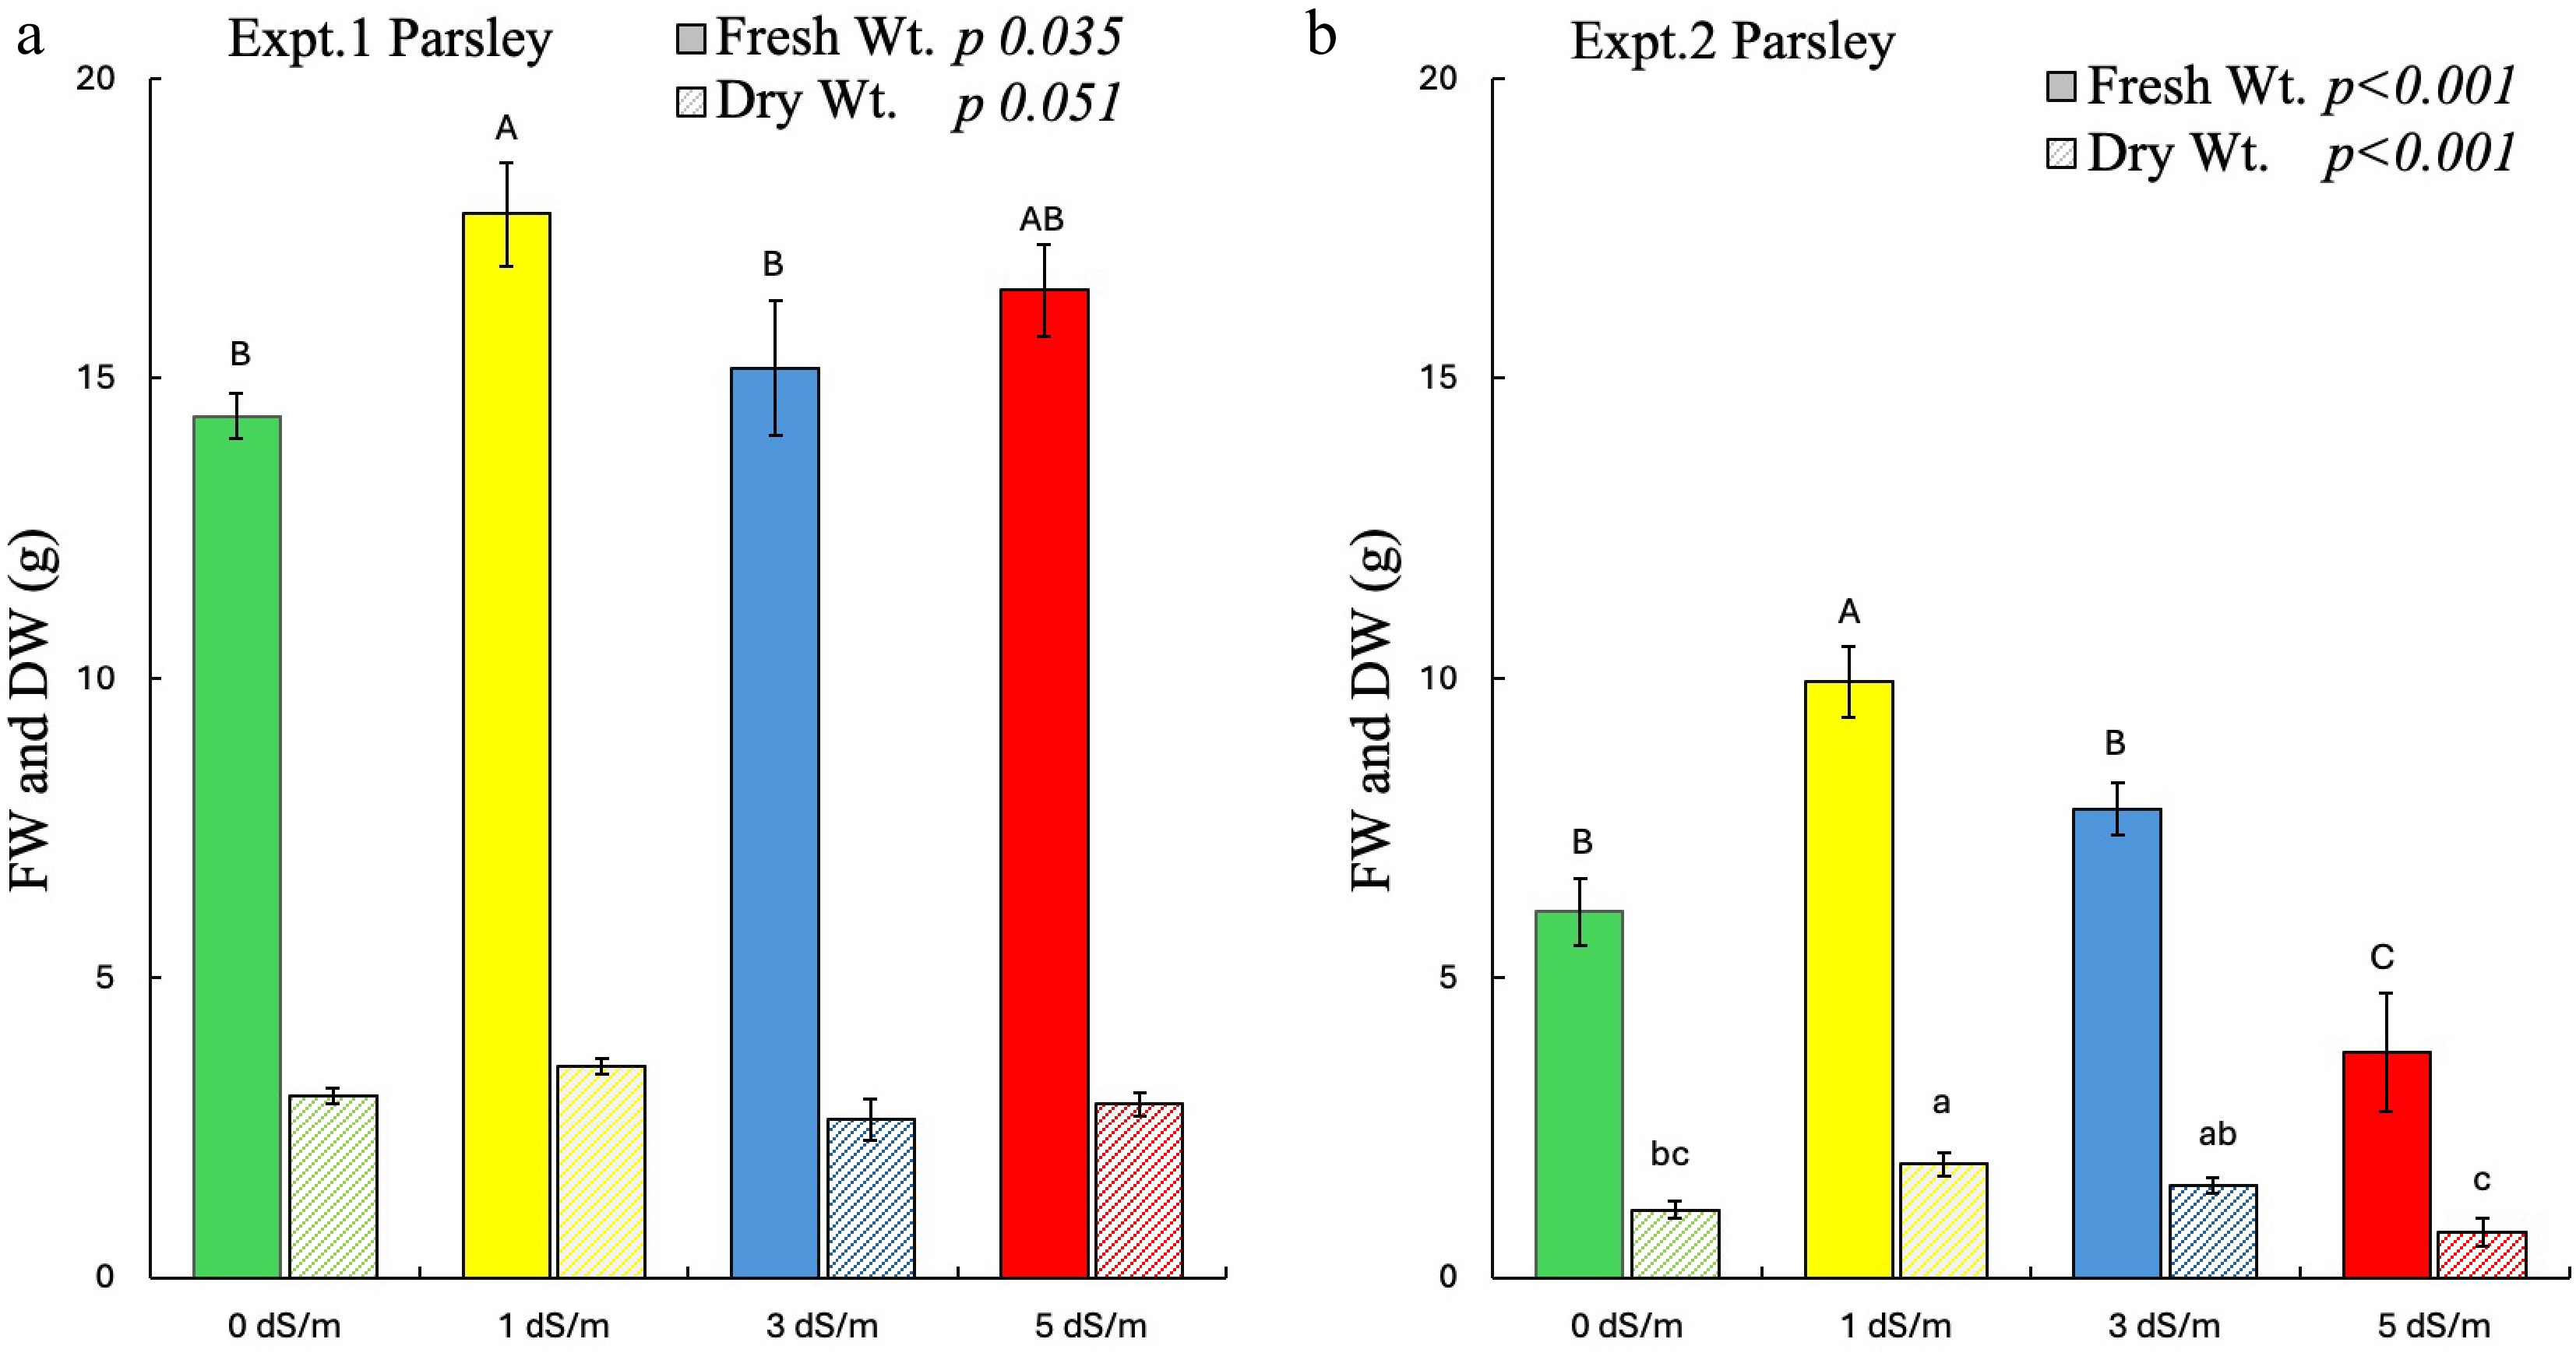
Figure 2.
Effect of salinity on fresh weight (FW) and dry weight (DW) of parsley in experiments 1 and 2. Different uppercase letters indicate significant effects of salinity on FW, whereas lowercase indicates significant effect of salinity on DW at p ≤ 0.05. The error bars represent ± 1 standard error of the mean (n = 10). The solid bar represents FW, and the striped bar represents DW. Italic text shows the significant impact of salinity on the measured parameters.
-
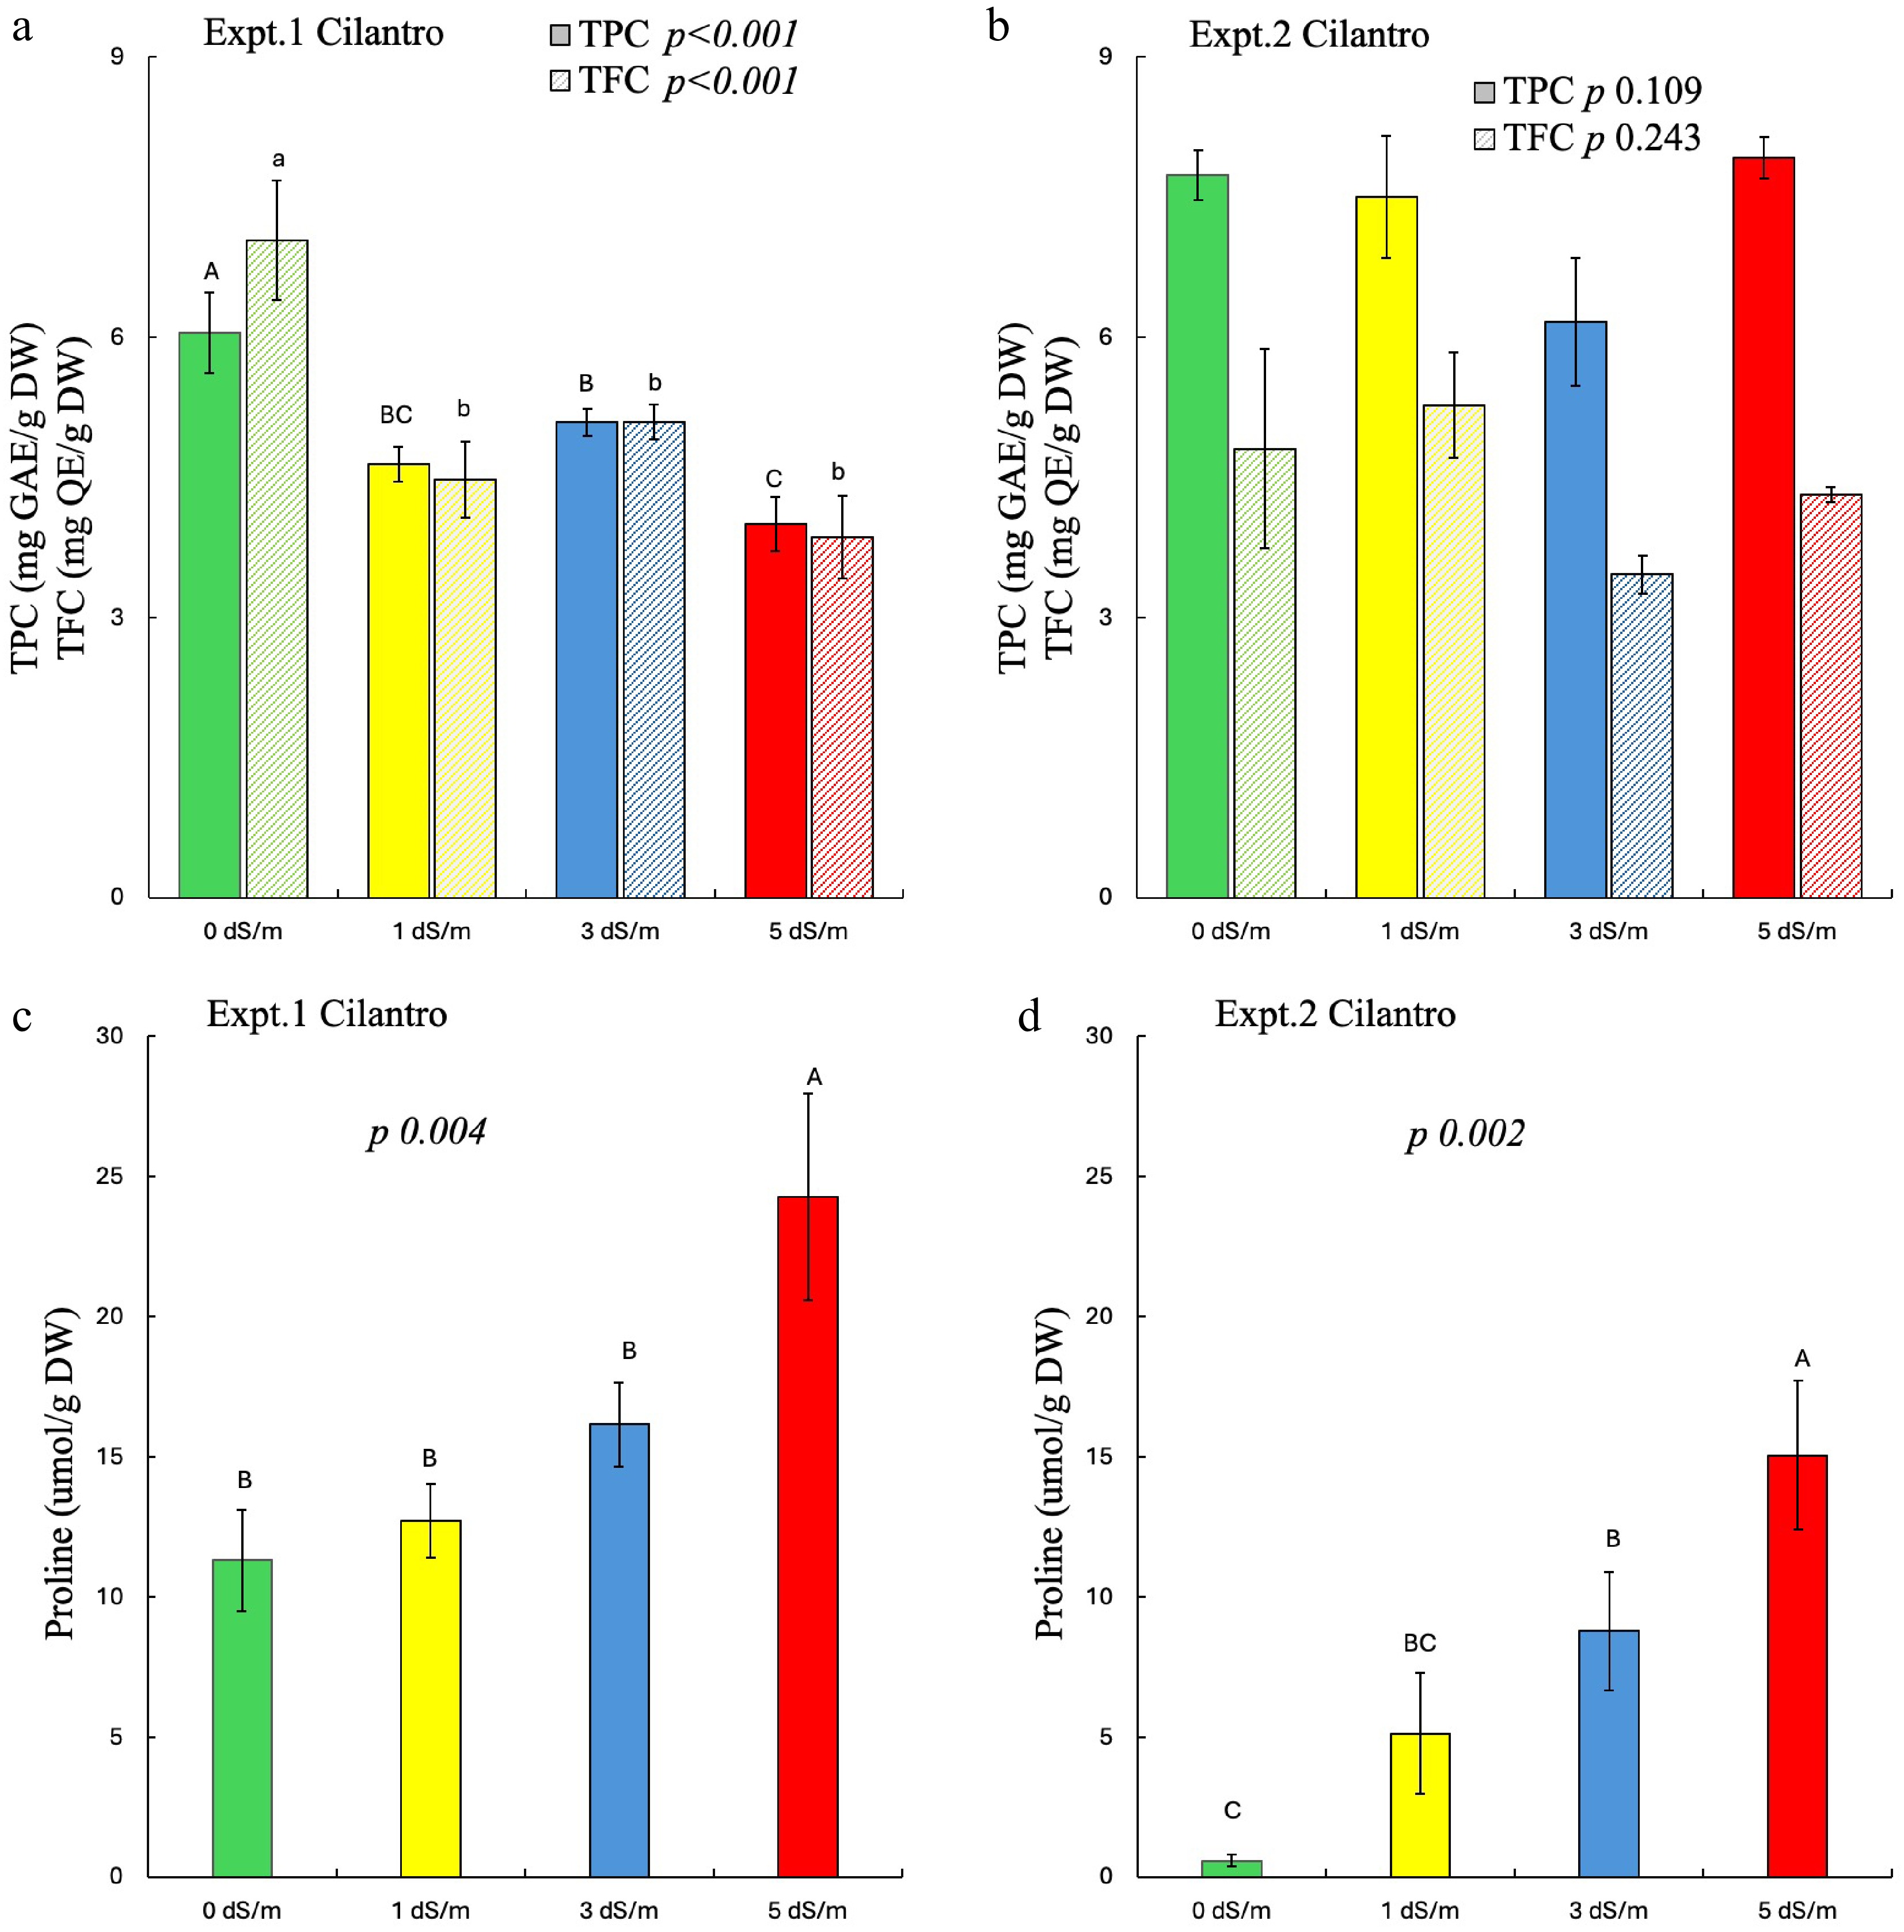
Figure 3.
Effect of salinity on phytochemicals and proline of cilantro in experiments 1 and 2. Different uppercase letters indicate significant effects of salinity on (a), (b) TPC and (c), (d) proline; whereas lowercase indicates significant effects of salinity on (a), (b) TFC at p ≤ 0.05. The error bars represent ± 1 standard error of the mean (n = 5). The solid bar represents TPC, and the striped bar represents TFC. Italic text shows the significant impact of salinity on the measured parameters.
-
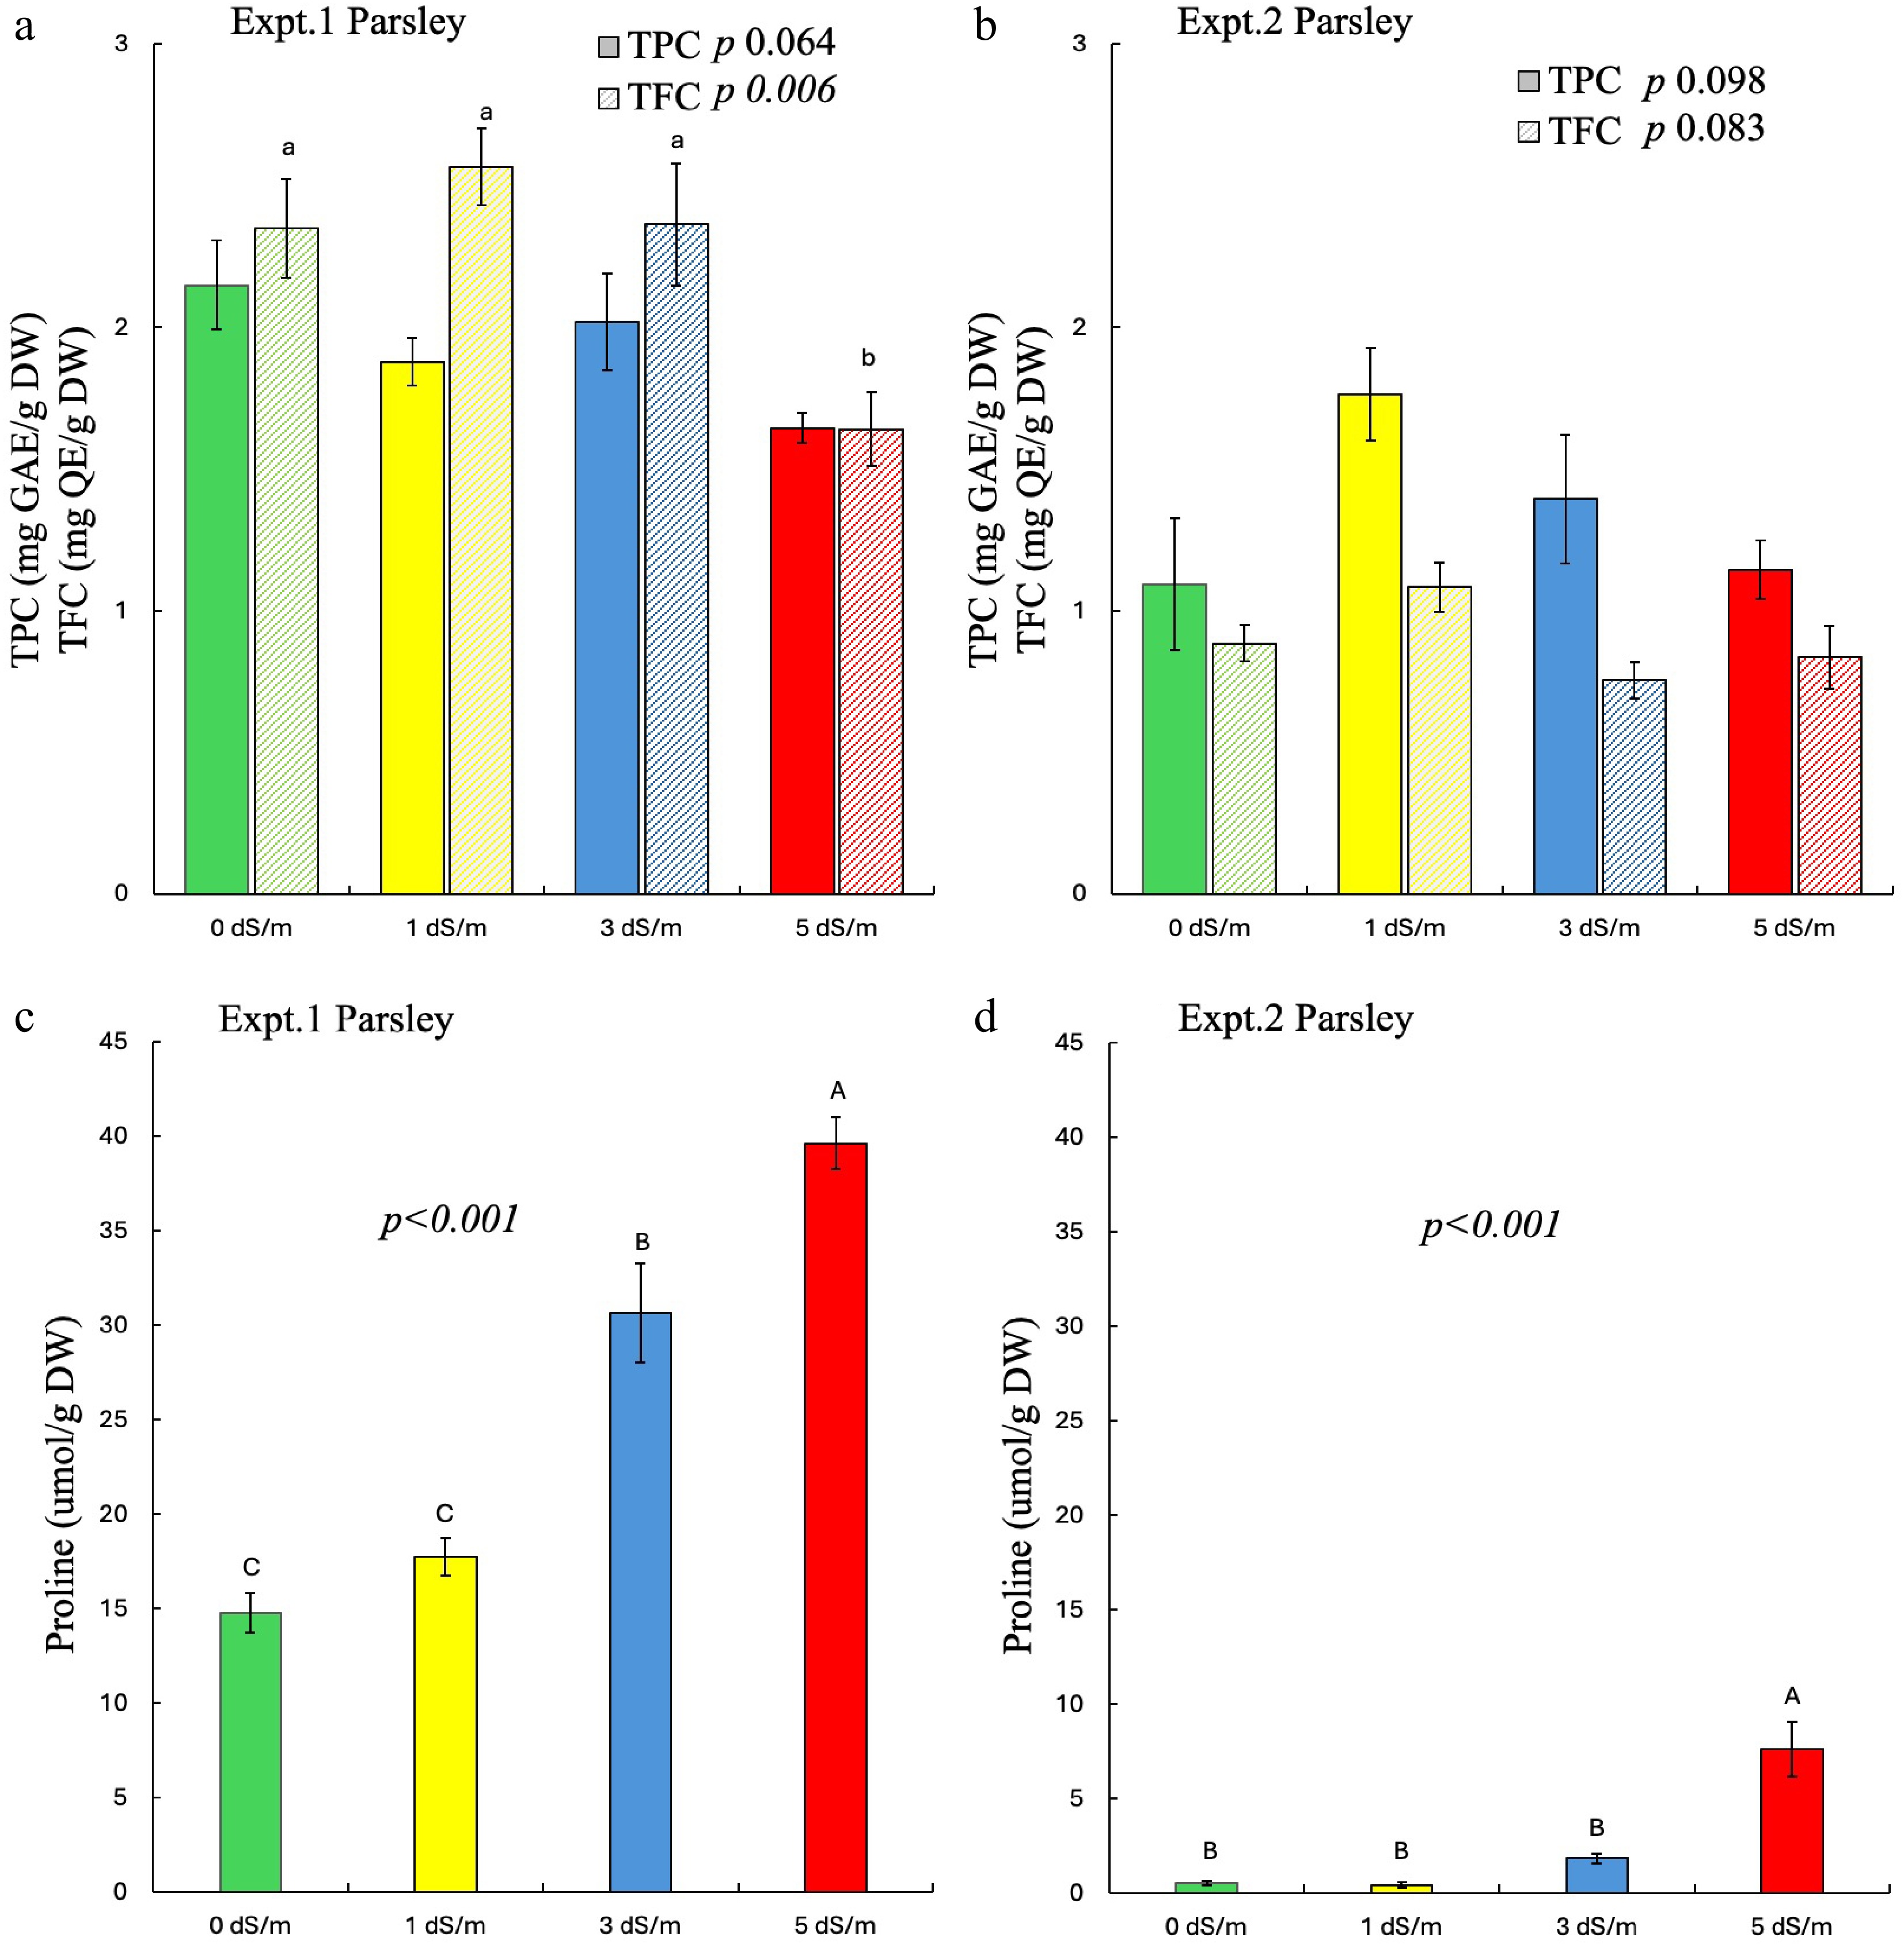
Figure 4.
Effect of salinity on phytochemicals and proline of parsley in experiments 1 and 2. Different uppercase letters indicate significant effects of salinity on (a), (b) TPC and (c), (d) proline whereas lowercase indicates significant effects of salinity on (a), (b) TFC at p ≤ 0.05. The error bars represent ± 1 standard error of the mean (n = 5). The solid bar represents TPC, and the striped bar represents TFC. Italic text shows the significant impact of salinity on the measured parameters.
-
Salinity level Amount of salt used
(mg/L of water)0 dS/m (control) 0 1 dS/m 650 3 dS/m 1,950 5 dS/m 3,350 Table 1.
Amount of Instant Ocean© sea salts used to prepare the desired salinity levels.
-
Salinity FW DW TPC TFC Proline Chl.-a Chl.-b Chl. a&b EC VWC N (%) P (%) K (%) Mg (%) Ca (%) S (%) B (ppm) Zn (ppm) Mn (ppm) Fe (ppm) Cu (ppm) Salinity 1 FW −0.434 1 DW −0.544 0.961 1 TPC −0.636 0.323 0.325 1 TFC −0.608 0.307 0.242 0.903 1 Proline 0.719 −0.301 −0.247 −0.402 −0.537 1 Chl. a 0.034 0.220 0.307 0.166 0.136 −0.115 1 Chl. b −0.267 0.130 0.105 0.214 0.254 −0.532 0.634 1 Chl. a & b 0.192 0.086 0.186 −0.025 −0.069 −0.006 0.920 0.646 1 EC 0.922 −0.426 −0.387 −0.775 −0.704 0.538 0.557 0.171 0.588 1 VWC 0.945 −0.369 −0.368 −0.853 −0.772 0.629 0.413 0.053 0.486 0.974 1 N (%) −0.138 0.314 0.381 0.019 −0.035 −0.082 −0.015 −0.009 0.057 −0.005 −0.006 1 P (%) 0.095 0.154 0.128 −0.133 0.013 −0.320 0.328 0.453 0.383 0.275 0.249 0.693 1 K (%) 0.274 −0.376 −0.360 −0.150 −0.069 −0.080 0.182 0.123 0.239 0.345 0.317 0.583 0.741 1 Mg (%) 0.414 −0.095 −0.112 −0.309 −0.296 0.605 0.117 −0.348 0.099 0.304 0.348 −0.410 −0.433 −0.364 1 Ca (%) −0.248 0.297 0.402 0.317 0.266 −0.201 0.227 0.014 −0.008 −0.153 −0.249 −0.204 −0.130 −0.386 0.346 1 S (%) 0.572 −0.069 −0.175 −0.319 −0.247 0.613 −0.174 −0.394 −0.174 0.439 0.523 −0.074 0.066 0.128 0.195 −0.040 1 B (ppm) −0.032 −0.019 0.144 0.353 0.187 0.094 −0.109 −0.385 −0.160 −0.056 −0.118 0.683 0.234 0.414 −0.309 −0.031 −0.002 1 Zn (ppm) 0.846 −0.266 −0.321 −0.537 −0.454 0.748 0.071 −0.257 0.110 0.712 0.790 0.001 0.157 0.186 0.225 −0.268 0.807 0.067 1 Mn (ppm) 0.855 −0.245 −0.273 −0.599 −0.540 0.743 0.042 −0.322 0.089 0.728 0.815 0.067 0.192 0.250 0.227 −0.258 0.791 0.116 0.983 1 Fe (ppm) 0.634 0.032 0.040 −0.550 −0.547 0.736 0.015 −0.343 −0.003 0.538 0.624 −0.150 −0.131 −0.246 0.382 0.104 0.768 −0.086 0.822 0.825 1 Cu (ppm) 0.880 −0.243 −0.205 −0.799 −0.750 0.545 0.415 0.062 0.456 0.955 0.963 0.150 0.374 0.363 0.209 −0.146 0.542 0.035 0.785 0.826 0.657 1 Bold and Italicized means Significant at p < 0.05; FW (fresh weight), DW (dry weight), TPC (Total phenolic content), TFC (Total flavonoid content), EC (Electrical conductivity), Chl. a (chlorophyll a), Chl. b (chlorophyll b), Chl. a & b (chlorophyll a and b), and VWC (Volumetric water content). Table 2.
Pairwise correlation between measured parameters in experiment 1 cilantro. Agronomic parameters (biomass), phytochemical (TPC, TFC, proline), chlorophyll content, environmental (EC, VWC) parameters, and nutrient elements were correlated using JMP Pro software.
-
Salinity FW DW TPC TFC Proline Chl.-a Chl.-b Chl. a&b EC VWC N (%) P (%) K (%) Mg (%) Ca (%) S (%) B (ppm) Zn (ppm) Mn (ppm) Fe (ppm) Cu (ppm) Salinity 1 FW −0.644 1 DW −0.510 0.957 1 TPC −0.043 −0.204 −0.208 1 TFC −0.306 0.266 0.385 0.363 1 Proline 0.827 −0.521 −0.412 −0.004 −0.282 1 Chl. a 0.470 −0.316 −0.295 −0.663 −0.428 0.298 1 Chl. b 0.523 −0.090 −0.004 0.158 −0.055 0.250 0.005 1 Chl. a & b 0.547 −0.283 −0.231 −0.545 −0.355 0.369 0.763 0.439 1 EC 0.958 −0.695 −0.547 0.105 −0.275 0.872 0.196 0.391 0.251 1 VWC 0.969 −0.698 −0.549 0.107 −0.291 0.861 0.181 0.438 0.258 0.996 1 N (%) 0.518 −0.364 −0.181 −0.150 0.150 0.340 0.225 0.130 0.150 0.442 0.476 1 P (%) 0.522 −0.351 −0.173 −0.099 0.107 0.422 0.158 0.023 0.071 0.483 0.503 0.928 1 K (%) 0.659 −0.391 −0.185 −0.145 0.027 0.627 0.125 0.150 0.116 0.614 0.640 0.871 0.864 1 Mg (%) 0.323 −0.545 −0.546 −0.207 −0.222 0.195 0.336 −0.301 0.202 0.268 0.257 0.335 0.517 0.165 1 Ca (%) −0.185 −0.083 −0.267 −0.475 −0.607 −0.239 0.430 −0.252 0.489 −0.273 −0.297 −0.501 −0.384 −0.574 0.422 1 S (%) −0.554 0.511 0.552 0.302 0.693 −0.542 −0.524 −0.066 −0.608 −0.532 −0.498 0.310 0.242 0.085 −0.177 −0.478 1 B (ppm) −0.615 0.570 0.550 −0.108 0.488 −0.555 0.105 −0.533 −0.148 −0.560 −0.605 −0.189 −0.069 −0.356 0.050 0.166 0.306 1 Zn (ppm) 0.748 −0.741 −0.606 −0.130 −0.157 0.602 0.150 0.109 0.146 0.716 0.729 0.685 0.758 0.725 0.657 −0.126 −0.170 −0.471 1 Mn (ppm) 0.830 −0.781 −0.648 −0.082 −0.224 0.694 0.161 0.159 0.171 0.809 0.818 0.573 0.662 0.661 0.636 −0.100 −0.320 −0.529 0.975 1 Fe (ppm) 0.625 −0.514 −0.390 −0.396 −0.264 0.411 0.476 0.068 0.449 0.458 0.495 0.824 0.825 0.714 0.615 −0.073 0.003 −0.287 0.737 0.686 1 Cu (ppm) 0.787 −0.603 −0.469 −0.398 −0.400 0.662 0.380 0.160 0.432 0.672 0.695 0.640 0.705 0.730 0.560 0.003 −0.278 −0.502 0.868 0.872 0.866 1 Bold and Italicized means Significant at p < 0.05; FW (fresh weight), DW (dry weight), TPC (Total phenolic content), TFC (Total flavonoid content), EC (Electrical conductivity), Chl-a (chlorophyll a), Chl-b (chlorophyll b), Chl a&b (chlorophyll a and b), and VWC (Volumetric water content). Table 3.
Pairwise correlation between measured parameters in experiment 2 cilantro. Agronomic parameters (biomass), phytochemical (TPC, TFC, proline), chlorophyll content, environmental (EC, VWC) parameters, and nutrient elements were correlated using JMP Pro software.
-
Salinity FW DW TPC TFC Proline Chl.-a Chl.-b Chl. a&b EC VWC N (%) P (%) K (%) Mg (%) Ca (%) S (%) B (ppm) Zn (ppm) Mn (ppm) Fe (ppm) Cu (ppm) Salinity 1 FW 0.100 1 DW −0.293 0.817 1 TPC −0.475 −0.251 −0.255 1 TFC −0.593 0.191 0.005 0.551 1 Proline 0.946 −0.182 −0.265 −0.483 −0.624 1 Chl. a −0.049 0.028 −0.192 0.314 −0.027 −0.136 1 Chl. b −0.014 0.164 0.020 0.000 −0.238 −0.111 0.747 1 Chl. a & b −0.050 0.080 −0.116 0.218 −0.108 −0.134 0.895 0.939 1 EC 0.813 0.178 0.150 −0.664 −0.765 0.764 0.029 0.464 0.296 1 VWC 0.829 0.332 0.226 −0.787 −0.672 0.747 −0.014 0.455 0.259 0.949 1 N (%) −0.653 0.334 0.409 0.364 0.272 −0.690 0.049 −0.071 −0.032 −0.438 −0.396 1 P (%) −0.098 0.168 −0.029 0.245 0.437 −0.273 −0.157 −0.289 −0.263 −0.425 −0.285 0.362 1 K (%) −0.145 −0.222 0.041 0.226 −0.380 −0.090 0.365 0.115 0.222 −0.017 −0.090 0.230 −0.159 1 Mg (%) 0.429 −0.439 −0.464 0.271 −0.231 0.437 −0.136 −0.144 −0.074 0.167 0.023 −0.188 0.365 0.003 1 Ca (%) 0.172 −0.300 −0.334 0.183 −0.120 0.251 −0.107 −0.142 −0.089 −0.056 −0.098 −0.113 0.332 0.306 0.668 1 S (%) −0.256 0.249 0.247 0.159 −0.106 −0.442 0.504 0.400 0.388 −0.026 −0.024 0.476 0.158 0.536 −0.196 −0.055 1 B (ppm) −0.729 0.187 0.145 0.360 0.362 −0.763 0.540 0.281 0.364 −0.465 −0.453 0.686 0.118 0.402 −0.391 −0.088 0.670 1 Zn (ppm) 0.871 0.097 0.063 −0.491 −0.716 0.735 0.023 0.315 0.198 0.861 0.848 −0.364 −0.015 0.122 0.398 0.107 0.113 −0.492 1 Mn (ppm) 0.494 −0.295 −0.270 −0.109 −0.090 0.492 −0.403 −0.427 −0.386 0.050 0.183 −0.264 0.300 −0.026 0.257 0.108 −0.361 −0.619 0.354 1 Fe (ppm) 0.181 −0.222 0.004 0.017 −0.162 0.196 −0.463 −0.407 −0.401 0.213 0.131 0.151 −0.057 −0.102 0.248 −0.339 −0.181 −0.396 0.284 0.433 1 Cu (ppm) 0.768 0.022 −0.208 −0.420 −0.333 0.647 −0.020 0.164 0.096 0.431 0.581 −0.321 0.379 0.004 0.348 0.270 0.030 −0.393 0.704 0.675 0.068 1 Bold and Italicized means Significant at p < 0.05; FW (fresh weight), DW (dry weight), TPC (Total phenolic content), TFC (Total flavonoid content), EC (Electrical conductivity), Chl. a (chlorophyll a), Chl. b (chlorophyll b), Chl. a & b (chlorophyll a and b), and VWC (Volumetric water content). Table 4.
Pairwise correlation between measured parameters in experiment 1 parsley. Agronomic parameters (biomass), phytochemical (TPC, TFC, proline), chlorophyll content, environmental (EC, VWC) parameters, and nutrient elements were correlated using JMP Pro software.
-
Salinity FW DW TPC TFC Proline Chl.-a Chl.-b Chl. a&b EC VWC N (%) P (%) K (%) Mg (%) Ca (%) S (%) B (ppm) Zn (ppm) Mn (ppm) Fe (ppm) Cu (ppm) Salinity 1 FW −0.428 1 DW −0.353 0.938 1 TPC −0.145 0.164 0.129 1 TFC −0.334 −0.048 −0.118 0.398 1 Proline 0.835 −0.462 −0.400 −0.331 −0.364 1 Chl. a −0.220 0.010 −0.108 0.587 0.388 −0.282 1 Chl. b 0.339 0.033 0.161 −0.519 −0.526 0.316 −0.958 1 Chl. a & b 0.358 0.052 0.183 −0.496 −0.524 0.312 −0.947 0.998 1 EC 0.956 −0.377 −0.311 0.217 −0.166 0.865 −0.050 0.142 0.166 1 VWC 0.873 −0.047 0.018 0.251 −0.335 0.634 −0.021 0.193 0.230 0.881 1 N (%) 0.092 0.040 0.150 −0.430 −0.354 −0.047 −0.429 0.531 0.561 −0.095 0.161 1 P (%) 0.402 −0.174 −0.020 −0.418 −0.647 0.342 −0.501 0.651 0.671 0.237 0.360 0.775 1 K (%) −0.755 0.242 0.269 −0.317 0.023 −0.673 −0.212 0.164 0.157 −0.840 −0.705 0.488 0.154 1 Mg (%) −0.196 0.316 0.279 −0.340 −0.531 −0.371 −0.113 0.223 0.230 −0.296 0.018 0.509 0.418 0.370 1 Ca (%) −0.060 0.086 0.029 0.210 −0.295 −0.240 0.264 −0.153 −0.159 0.004 0.158 −0.027 0.183 −0.059 0.673 1 S (%) −0.397 −0.031 0.055 −0.221 0.090 −0.311 −0.340 0.291 0.293 −0.475 −0.445 0.446 0.211 0.803 0.216 −0.050 1 B (ppm) −0.437 −0.175 −0.124 −0.057 0.488 −0.238 −0.113 −0.055 −0.064 −0.398 −0.618 −0.036 −0.117 0.552 −0.140 −0.101 0.751 1 Zn (ppm) 0.818 −0.345 −0.242 −0.201 −0.416 0.658 −0.271 0.425 0.455 0.688 0.767 0.555 0.717 −0.422 0.160 0.047 −0.281 −0.503 1 Mn (ppm) 0.594 −0.479 −0.423 −0.030 −0.474 0.536 −0.137 0.261 0.257 0.591 0.514 0.085 0.573 −0.437 0.223 0.598 −0.242 −0.229 0.609 1 Fe (ppm) 0.595 −0.487 −0.424 −0.258 −0.562 0.552 −0.284 0.408 0.406 0.516 0.471 0.231 0.653 −0.326 0.395 0.572 −0.108 −0.186 0.666 0.942 1 Cu (ppm) 0.564 −0.026 0.098 −0.050 −0.483 0.391 −0.231 0.429 0.469 0.467 0.683 0.708 0.734 −0.093 0.175 −0.082 −0.065 −0.485 0.803 0.326 0.335 1 Bold and Italicized means Significant at p < 0.05; FW (fresh weight), DW (dry weight), TPC (Total phenolic content), TFC (Total flavonoid content), EC (Electrical conductivity), Chl. a (chlorophyll a), Chl. b (chlorophyll b), Chl. a & b (chlorophyll a and b), and VWC (Volumetric water content). Table 5.
Pairwise correlation between measured parameters in experiment 2 parsley. Agronomic parameters (biomass), phytochemical (TPC, TFC, proline), chlorophyll content, environmental (EC, VWC) parameters, and nutrient elements were correlated using JMP Pro software.
Figures
(4)
Tables
(5)