-
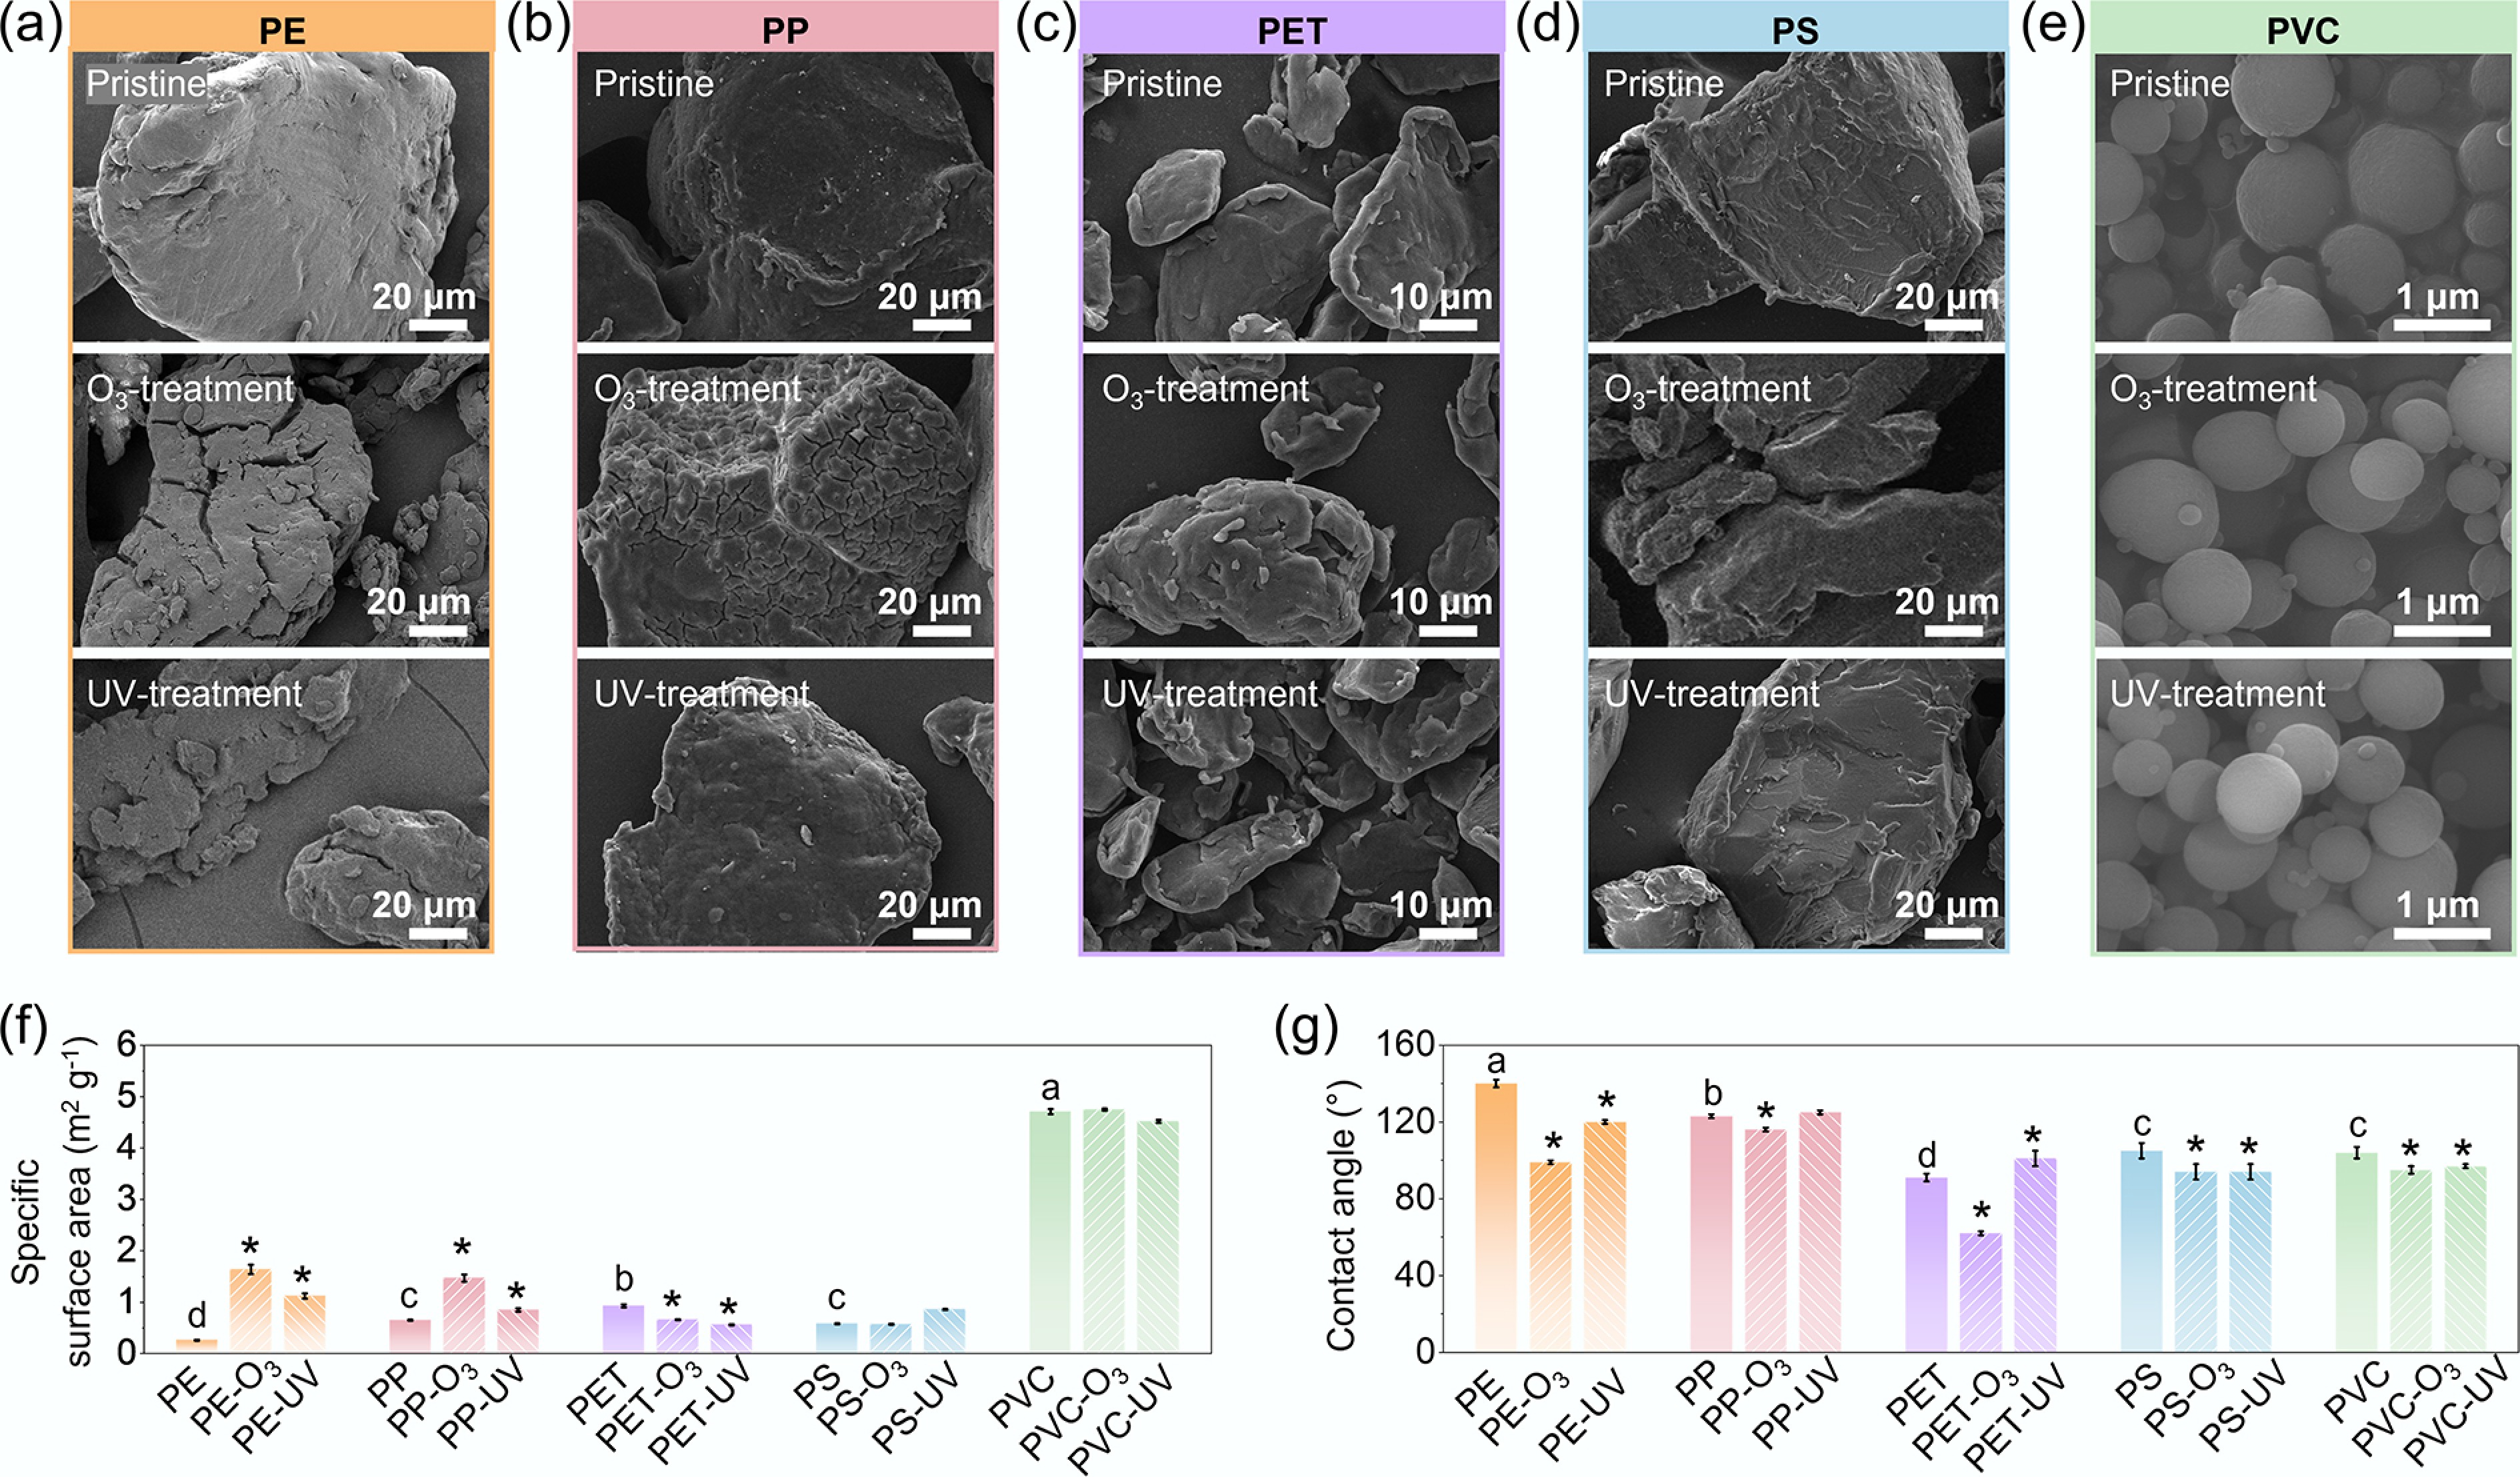
Figure 1.
Physicochemical properties of pristine, O3-aged, and UV-aged MPs. (a)–(e) Scanning electron microscopy (SEM) images, (f) specific surface area (SSA), and (g) water contact angle for pristine and aged MPs. Suffixes '-O3' and '-UV' denote ozone- and UV-aged samples, respectively. Error bars indicate ±1 standard deviation from triplicate measurements. In panels (f) and (g), lowercase letters indicate significant differences among pristine MPs (one-way ANOVA, p < 0.05), whereas asterisks denote significant differences between aged samples and their pristine counterparts (two-sample t-test, p < 0.05).
-
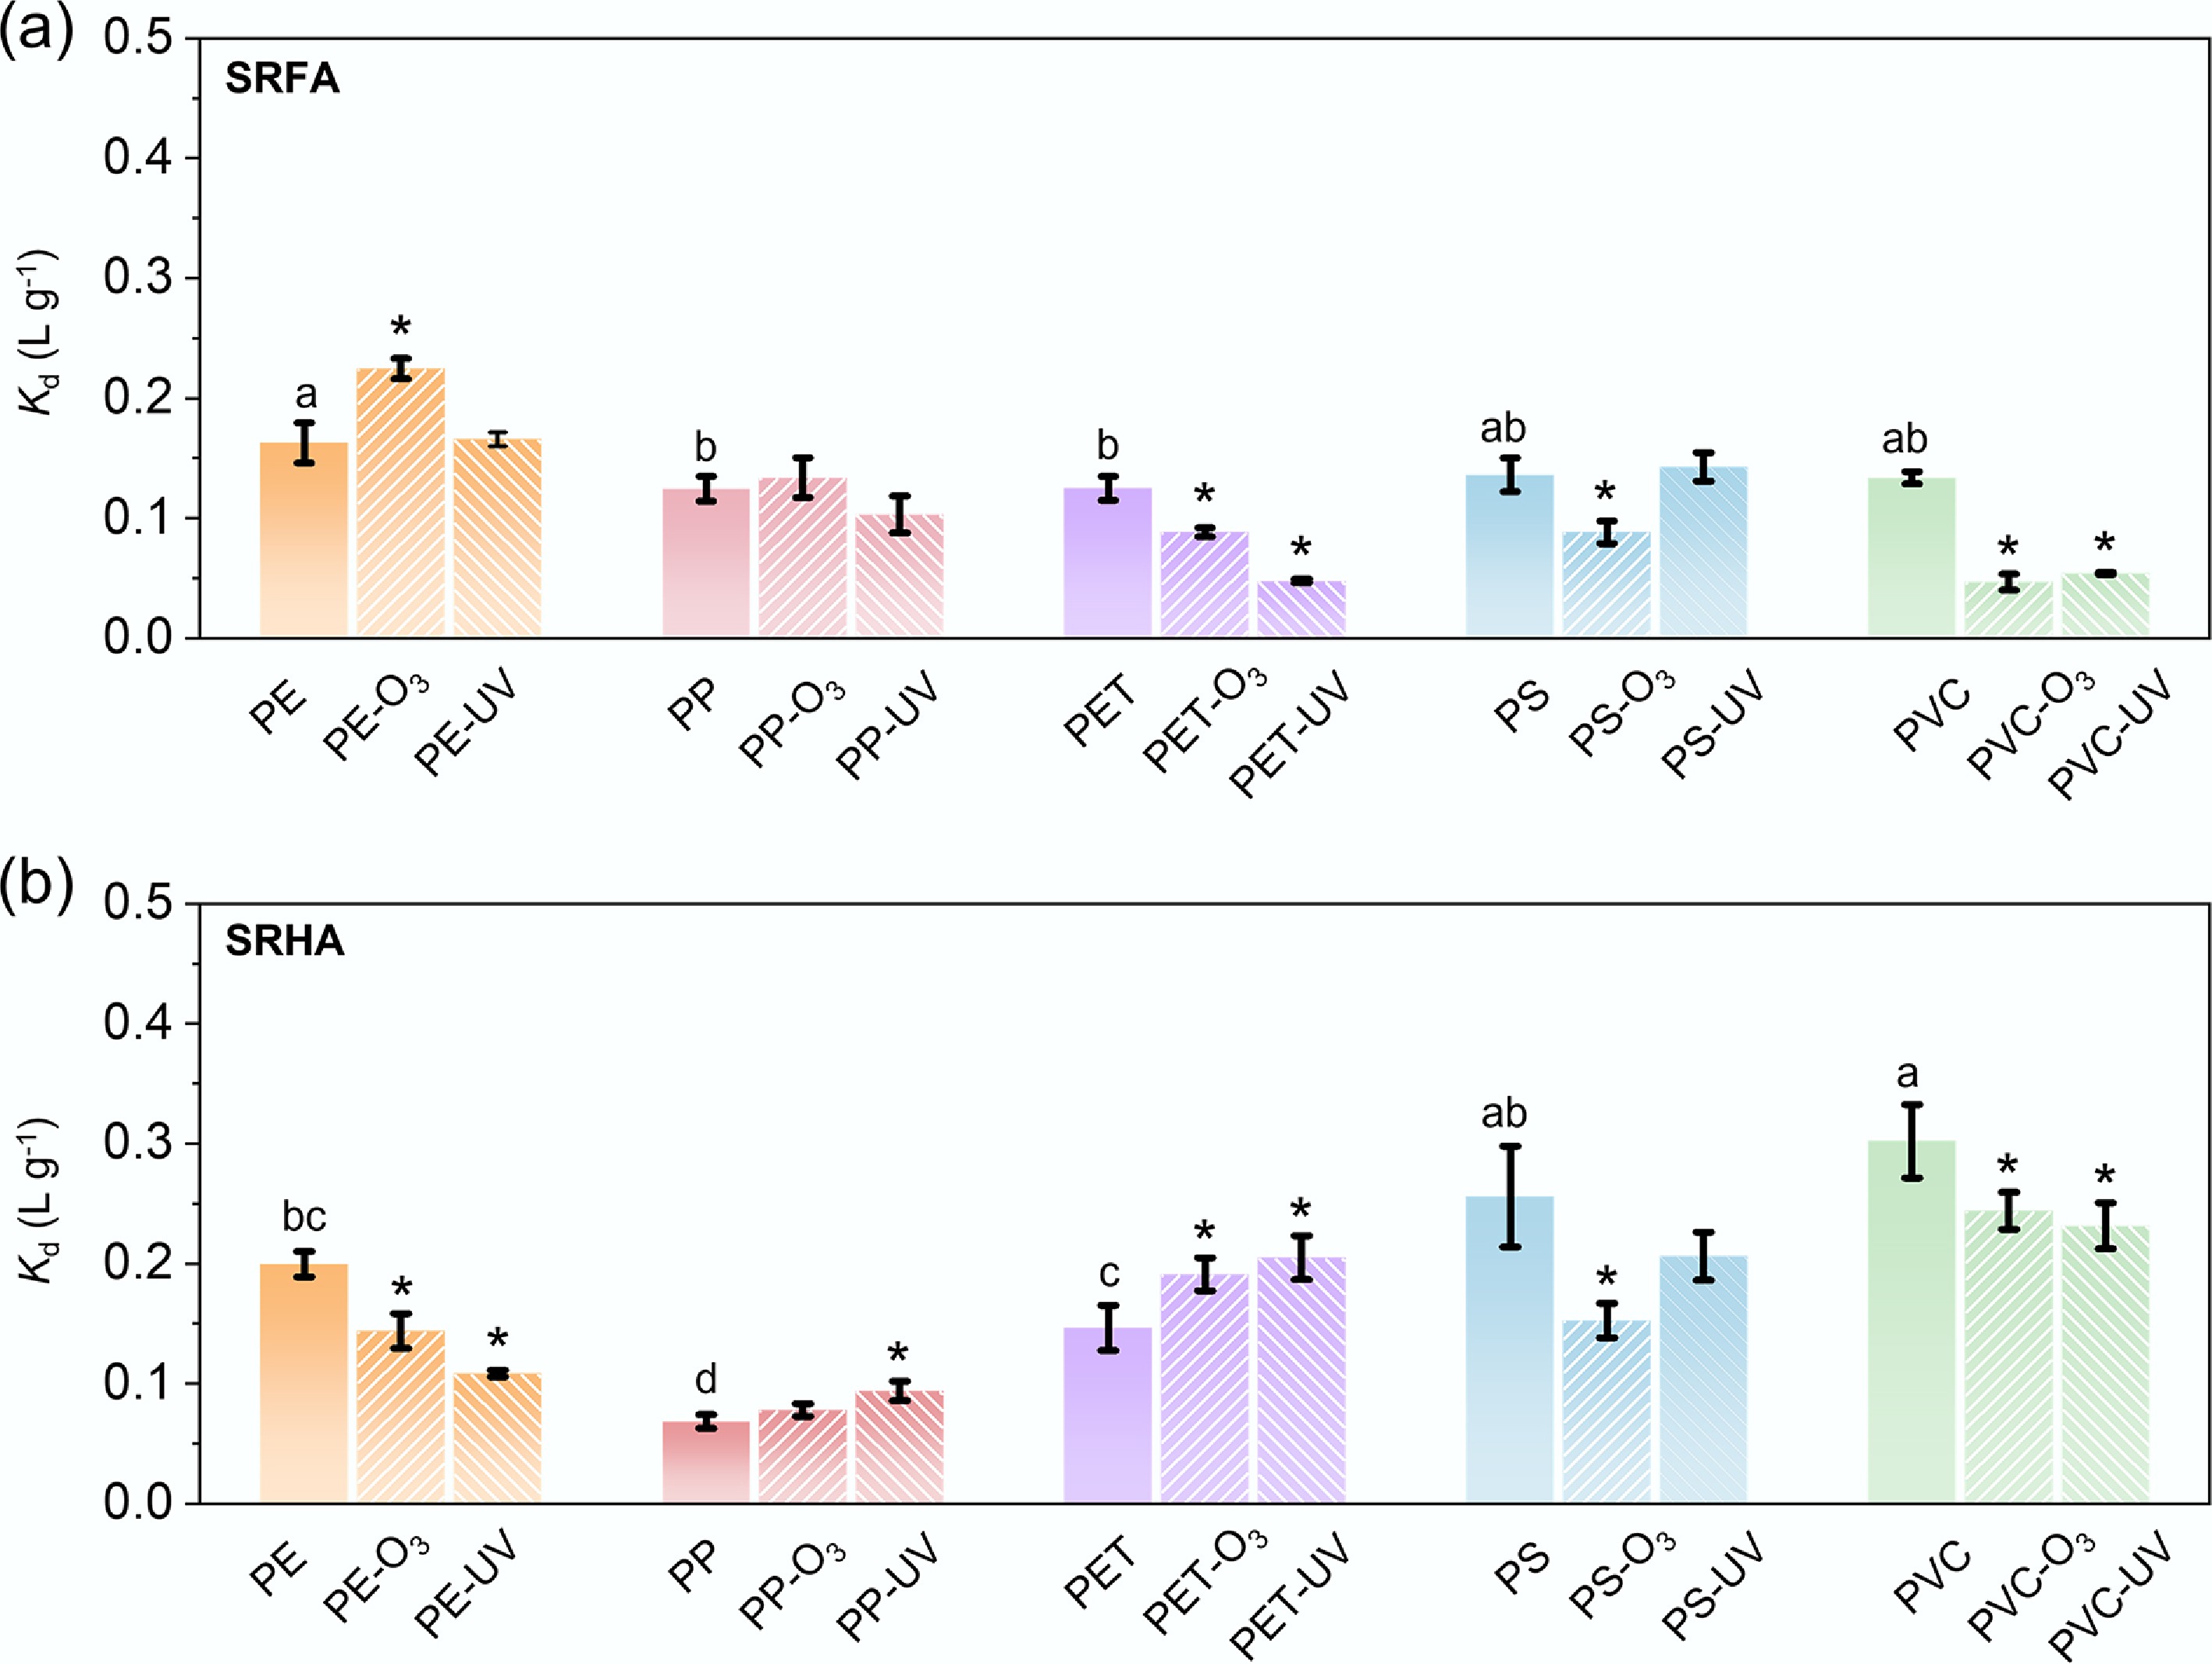
Figure 2.
Distribution coefficient (Kd) of (a) SRFA, and (b) SRHA obtained from the sorption experiments. Error bars indicate ±1 standard deviation from three replicate measurements. Suffixes '-O3' and '-UV' denote ozone- and UV-aged MPs, respectively. Lowercase letters denote significant differences among pristine MPs (one-way ANOVA, p < 0.05). Significant differences between aged and corresponding pristine samples are denoted by asterisks (two-sample t-test, p < 0.05).
-
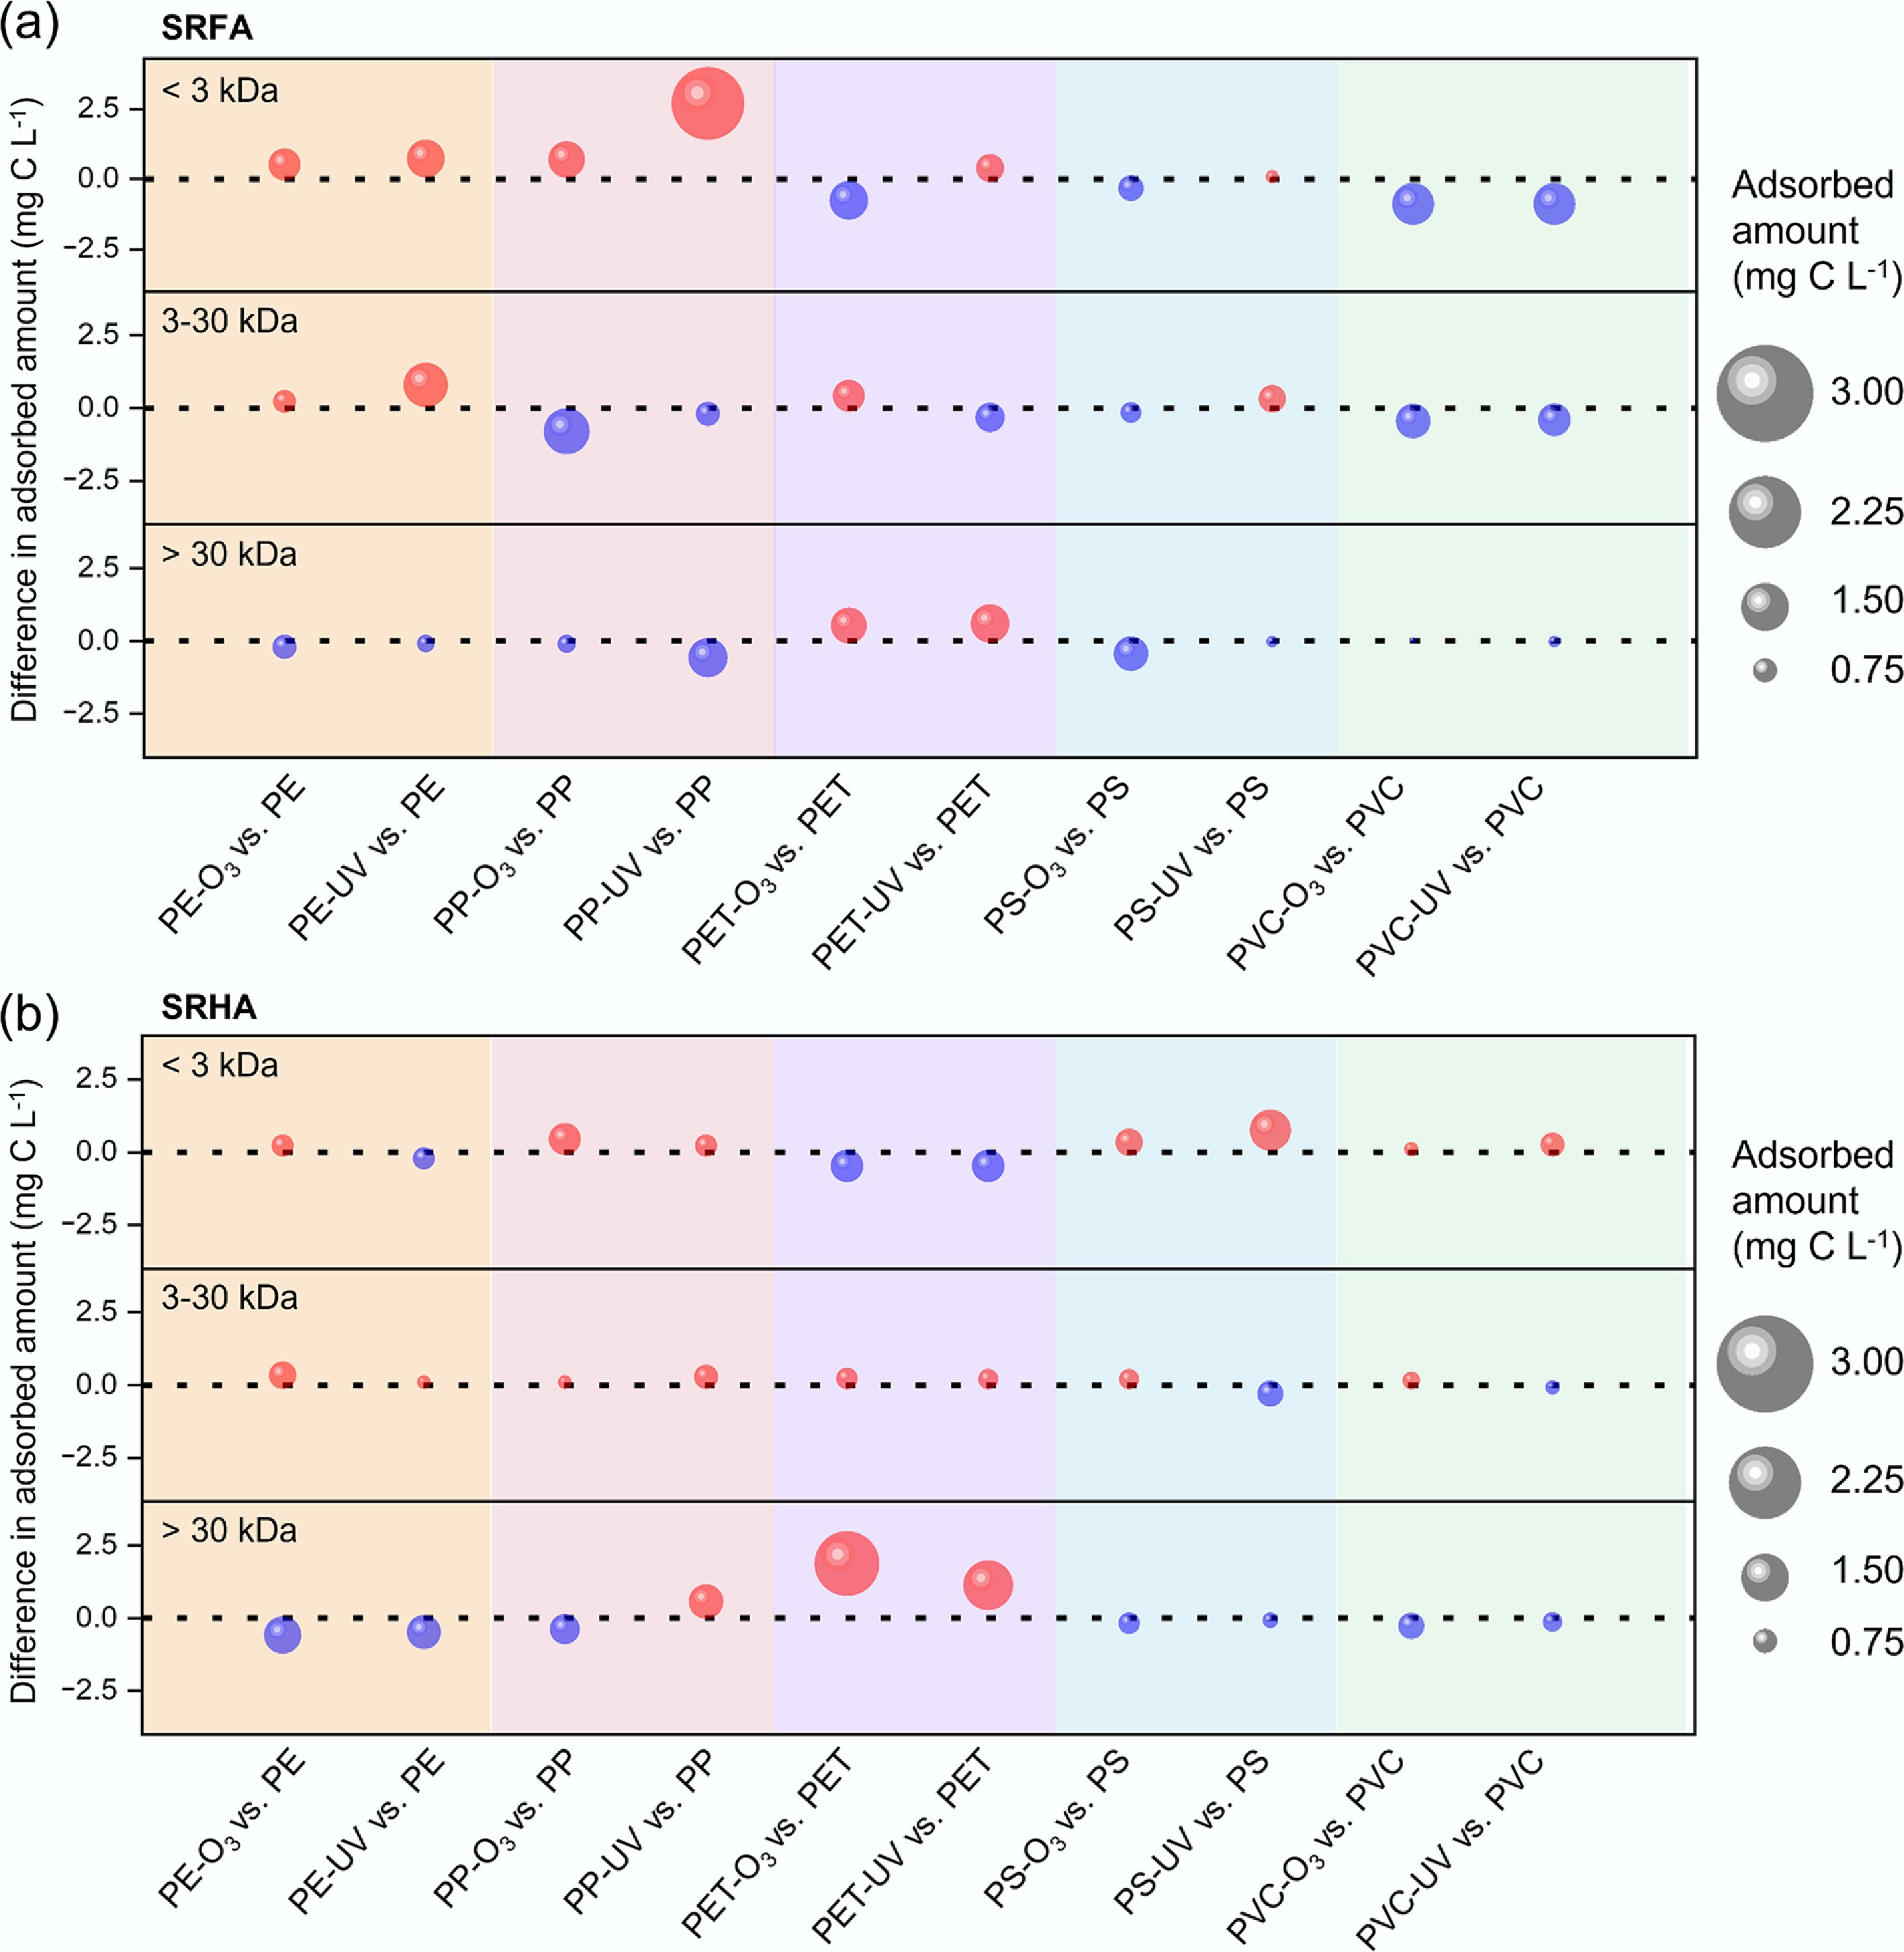
Figure 3.
Aging-induced changes in fluorescent components of (a) SRFA, and (b) SRHA adsorbed on MPs. Differences in PARAFAC component intensities between aged and pristine MPs are shown for each polymer and aging mode. Red markers indicate positive changes (greater adsorption after aging); blue markers indicate negative changes. Marker size is proportional to the absolute change in PARAFAC component intensity between aged and pristine MPs. Suffixes '-O3' and '-UV' denote ozone- and UV-aged MPs, respectively.
-
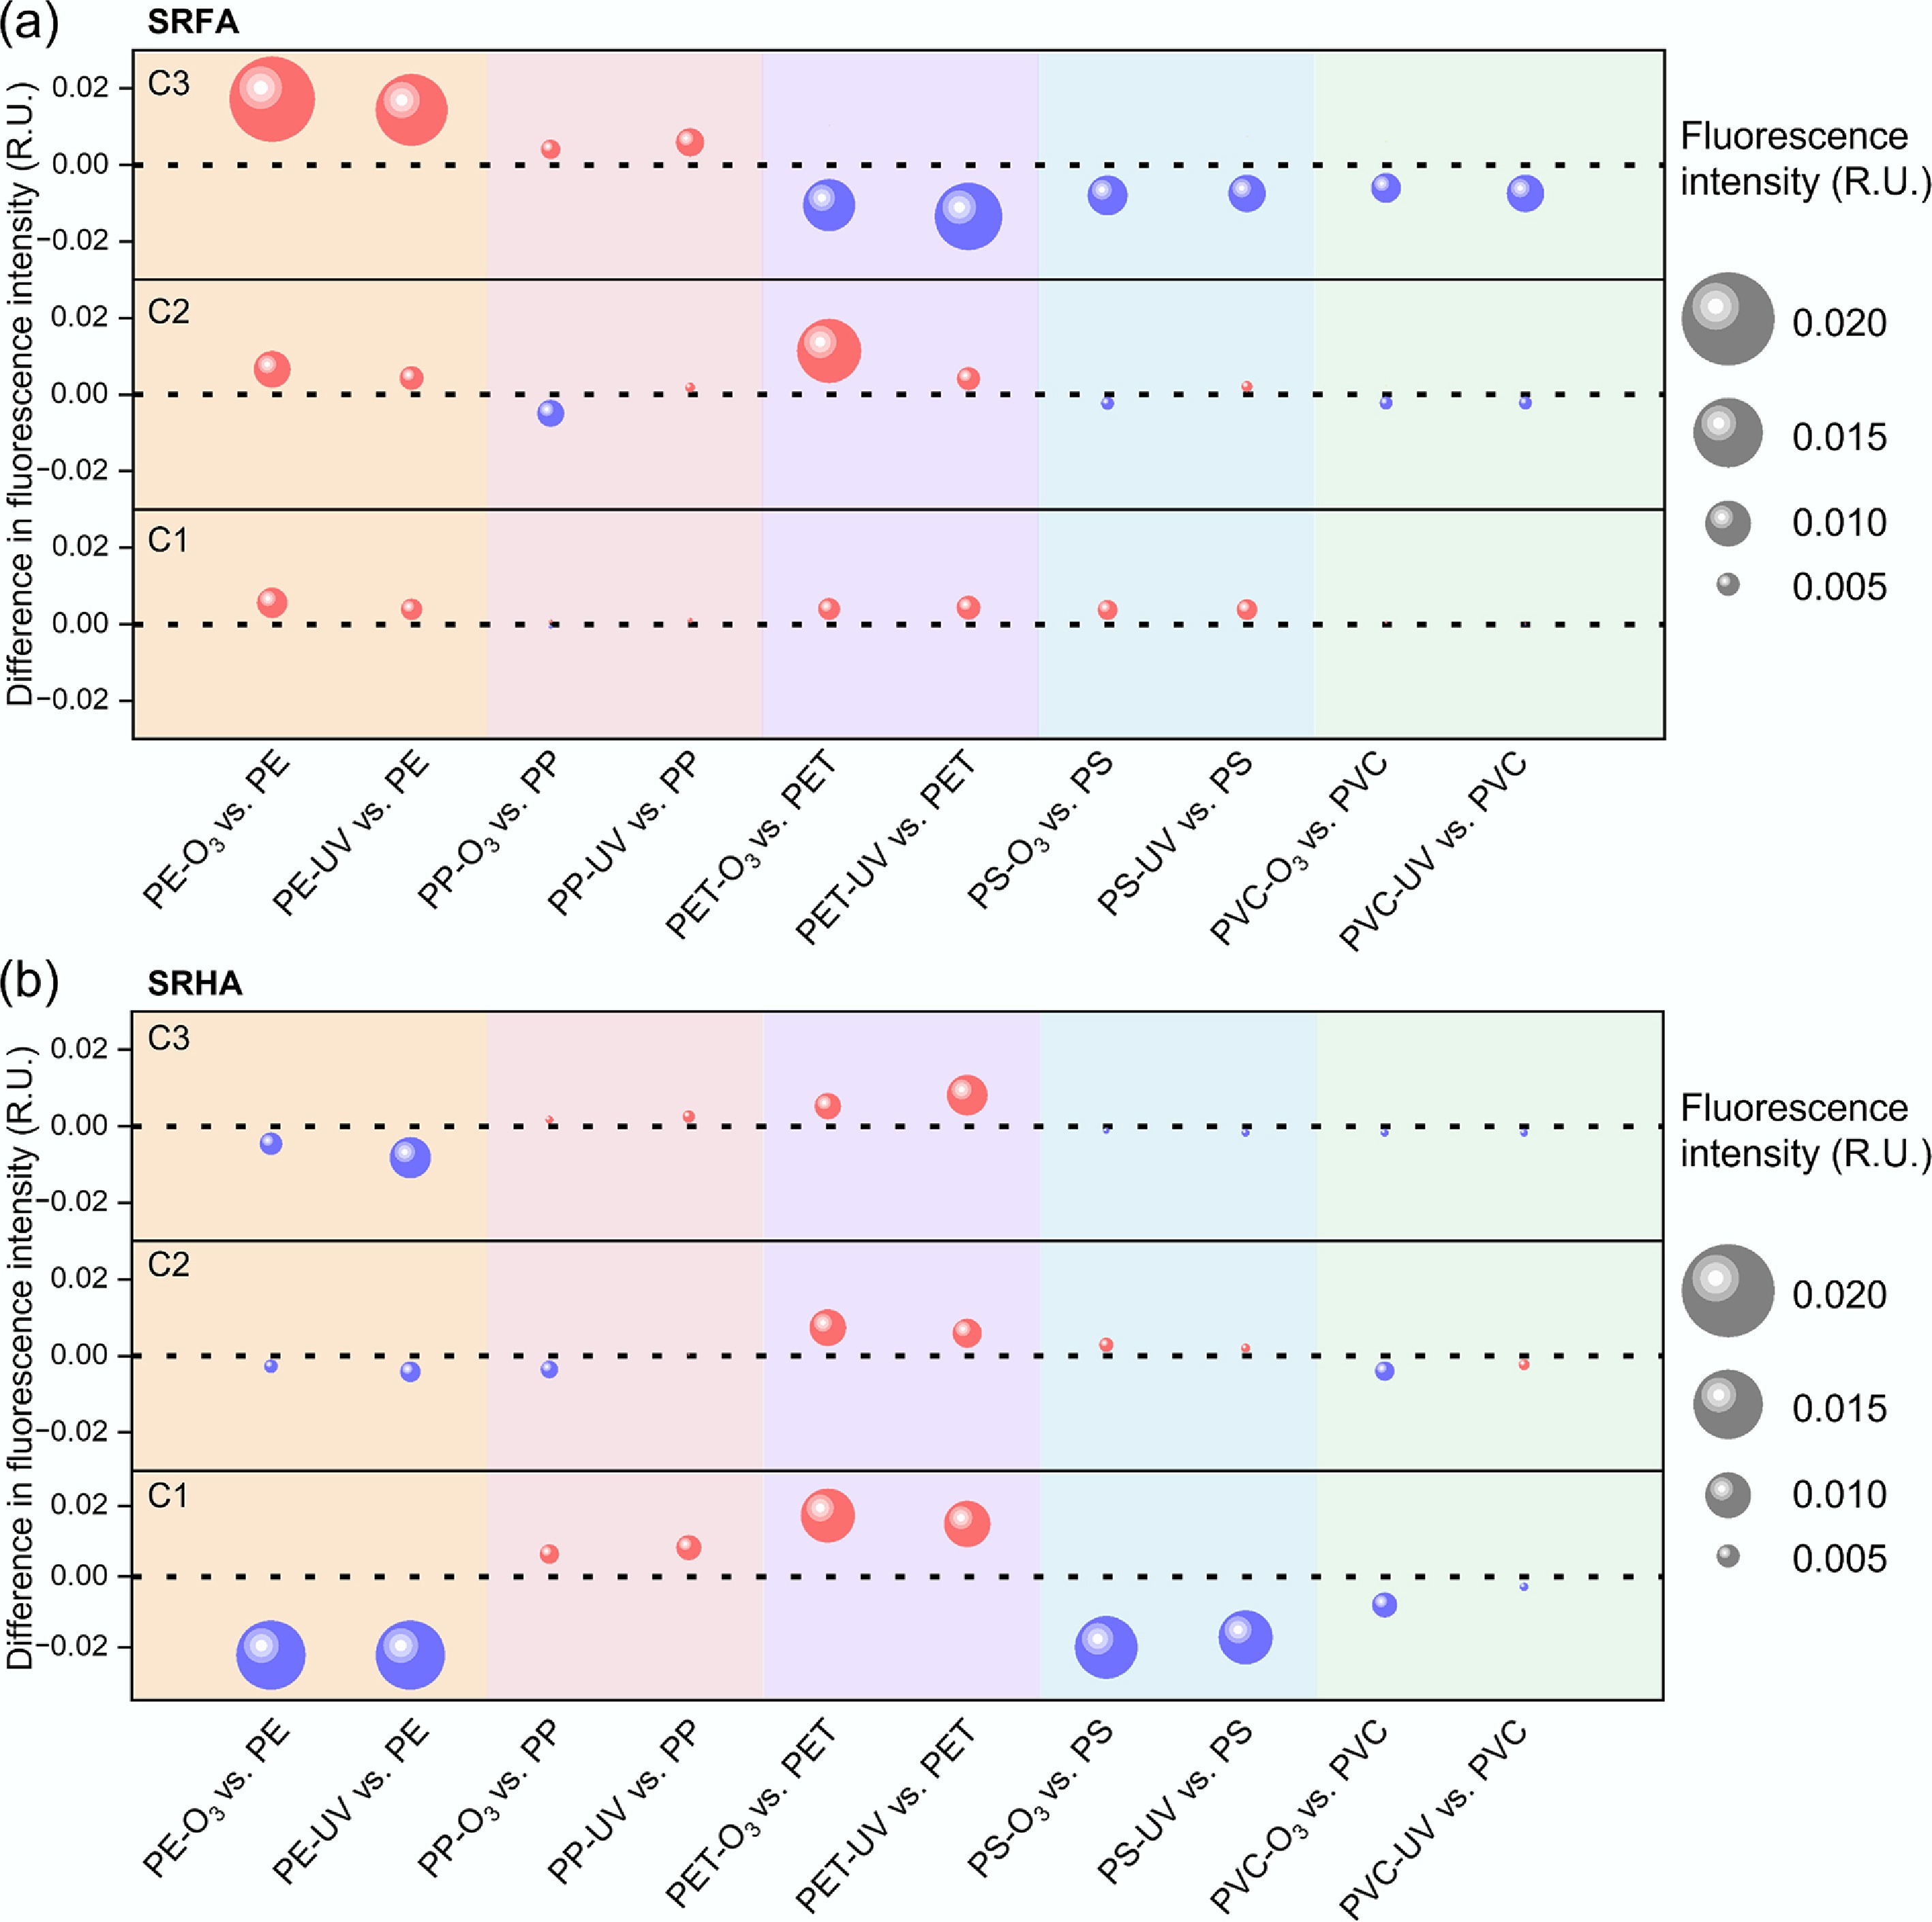
Figure 4.
Aging-induced changes in molecular-weight components of (a) SRFA, and (b) SRHA adsorbed on MPs. Differences in the adsorbed amounts of each molecular-weight fraction (< 3, 3–30, and > 30 kDa) between aged and pristine MPs are shown. Red markers indicate increased adsorption after aging, while blue markers indicate decreased adsorption. Marker size is proportional to the absolute change in adsorbed amount of each molecular-weight fraction between aged and pristine MPs. Suffixes '-O3' and '-UV' denote ozone- and UV-aged MPs, respectively.
-
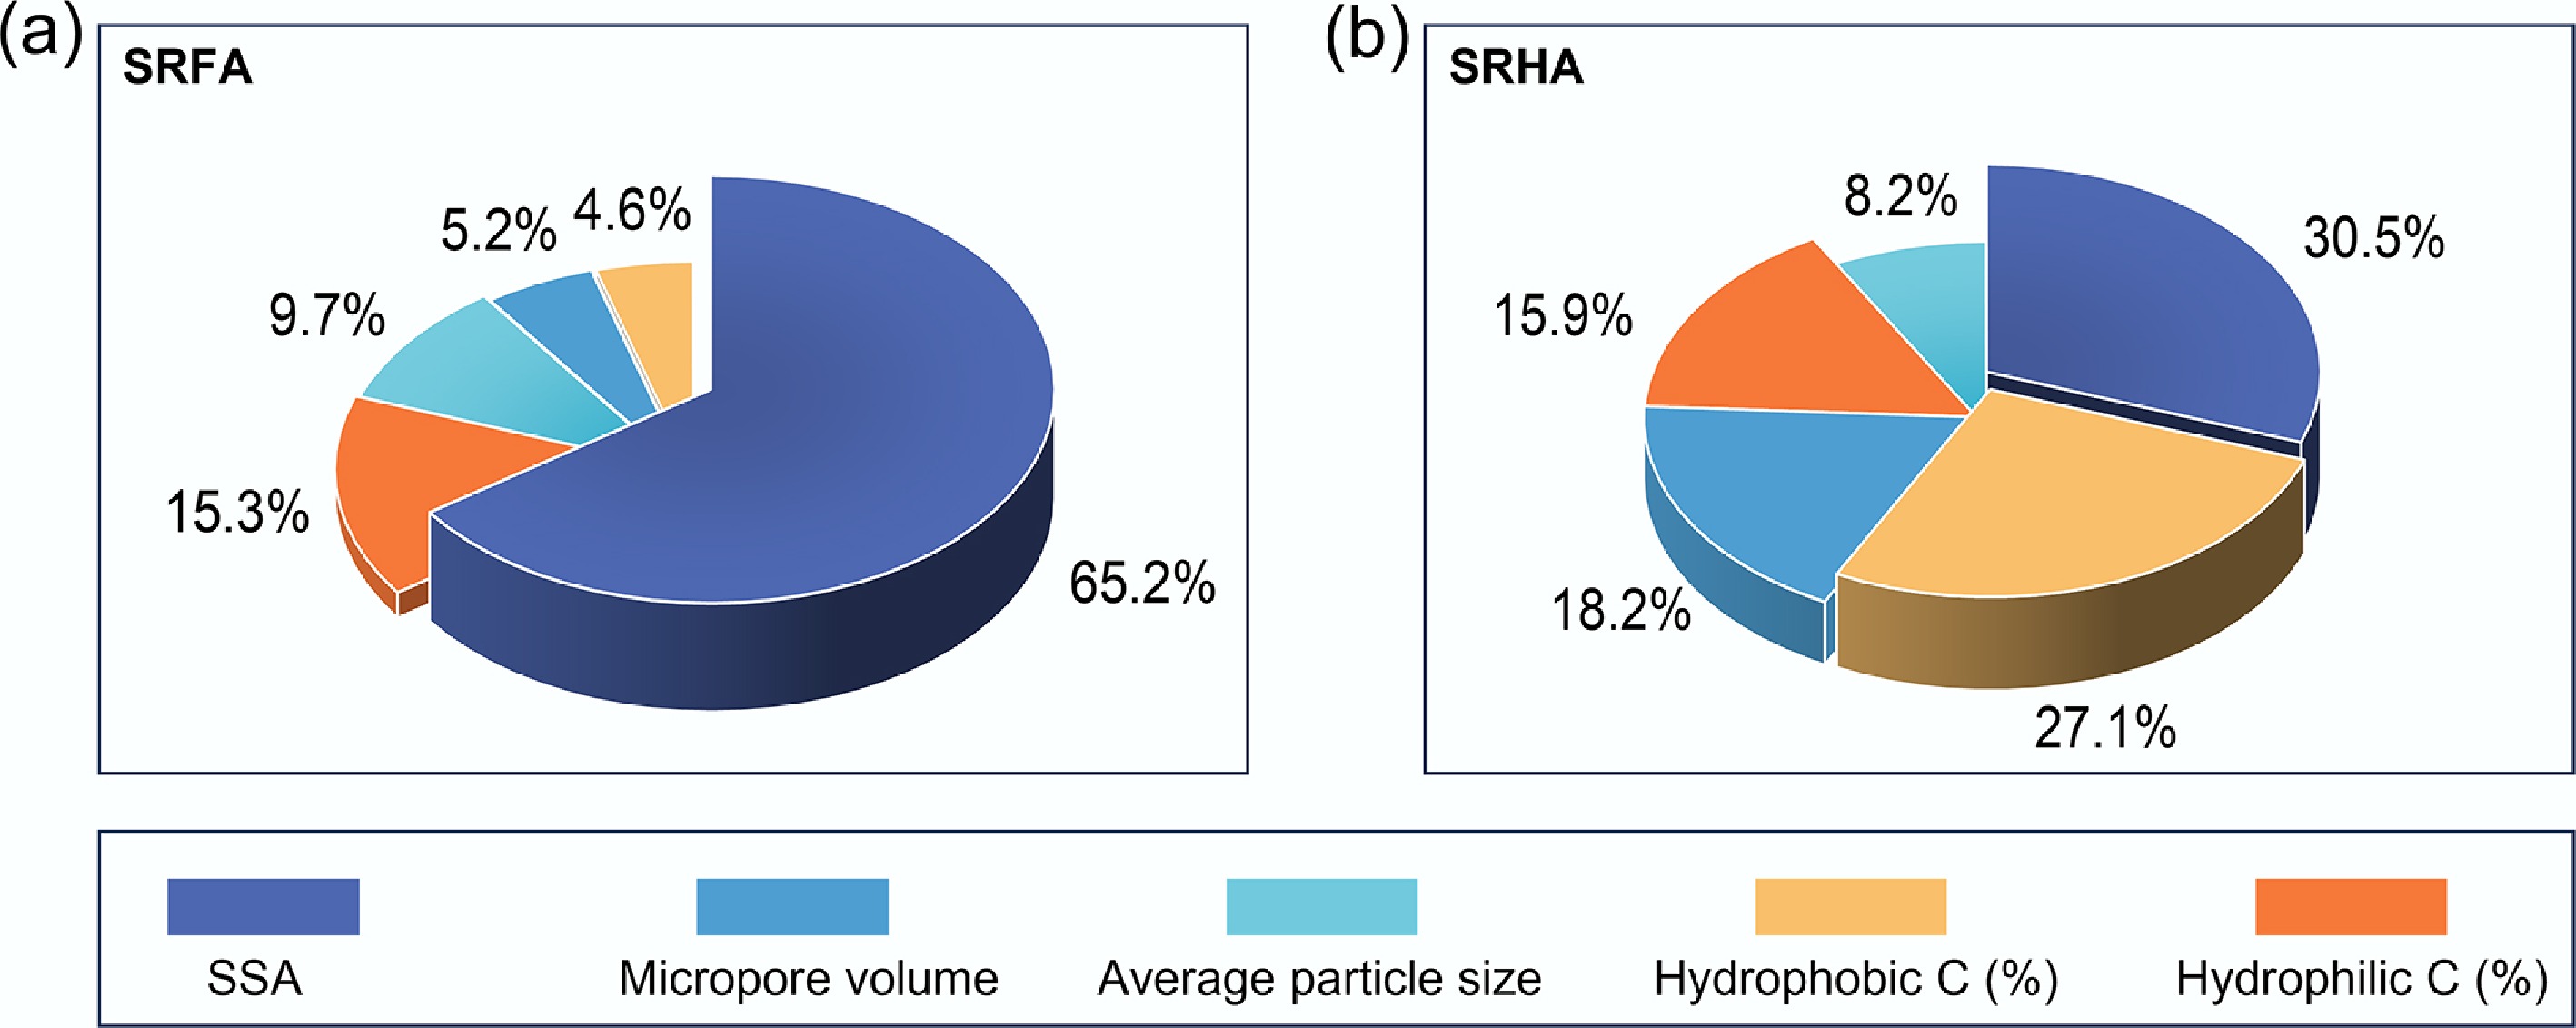
Figure 5.
Factors controlling the distribution coefficient (Kd) of (a) SRFA, and (b) SRHA on pristine and aged MPs. Pie charts show the contribution of each physicochemical property of pristine and aged MPs to the distribution coefficient derived from a neural-network model. Factors contributing less than 3% were omitted for clarity.
Figures
(5)
Tables
(0)