-
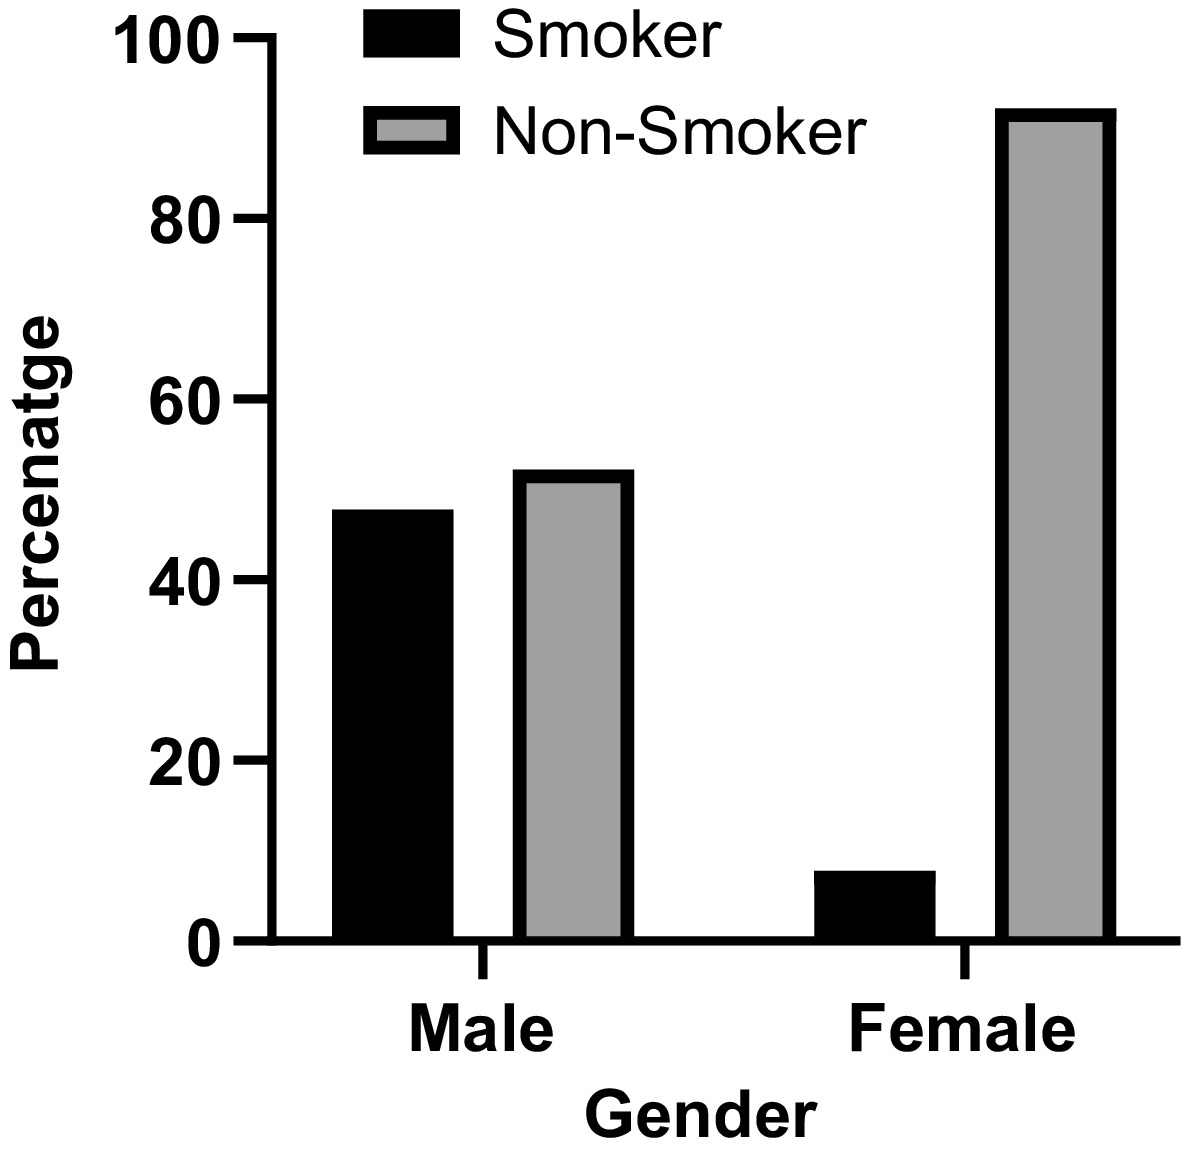
Figure 1.
Prevalence of smoking according to gender.
-
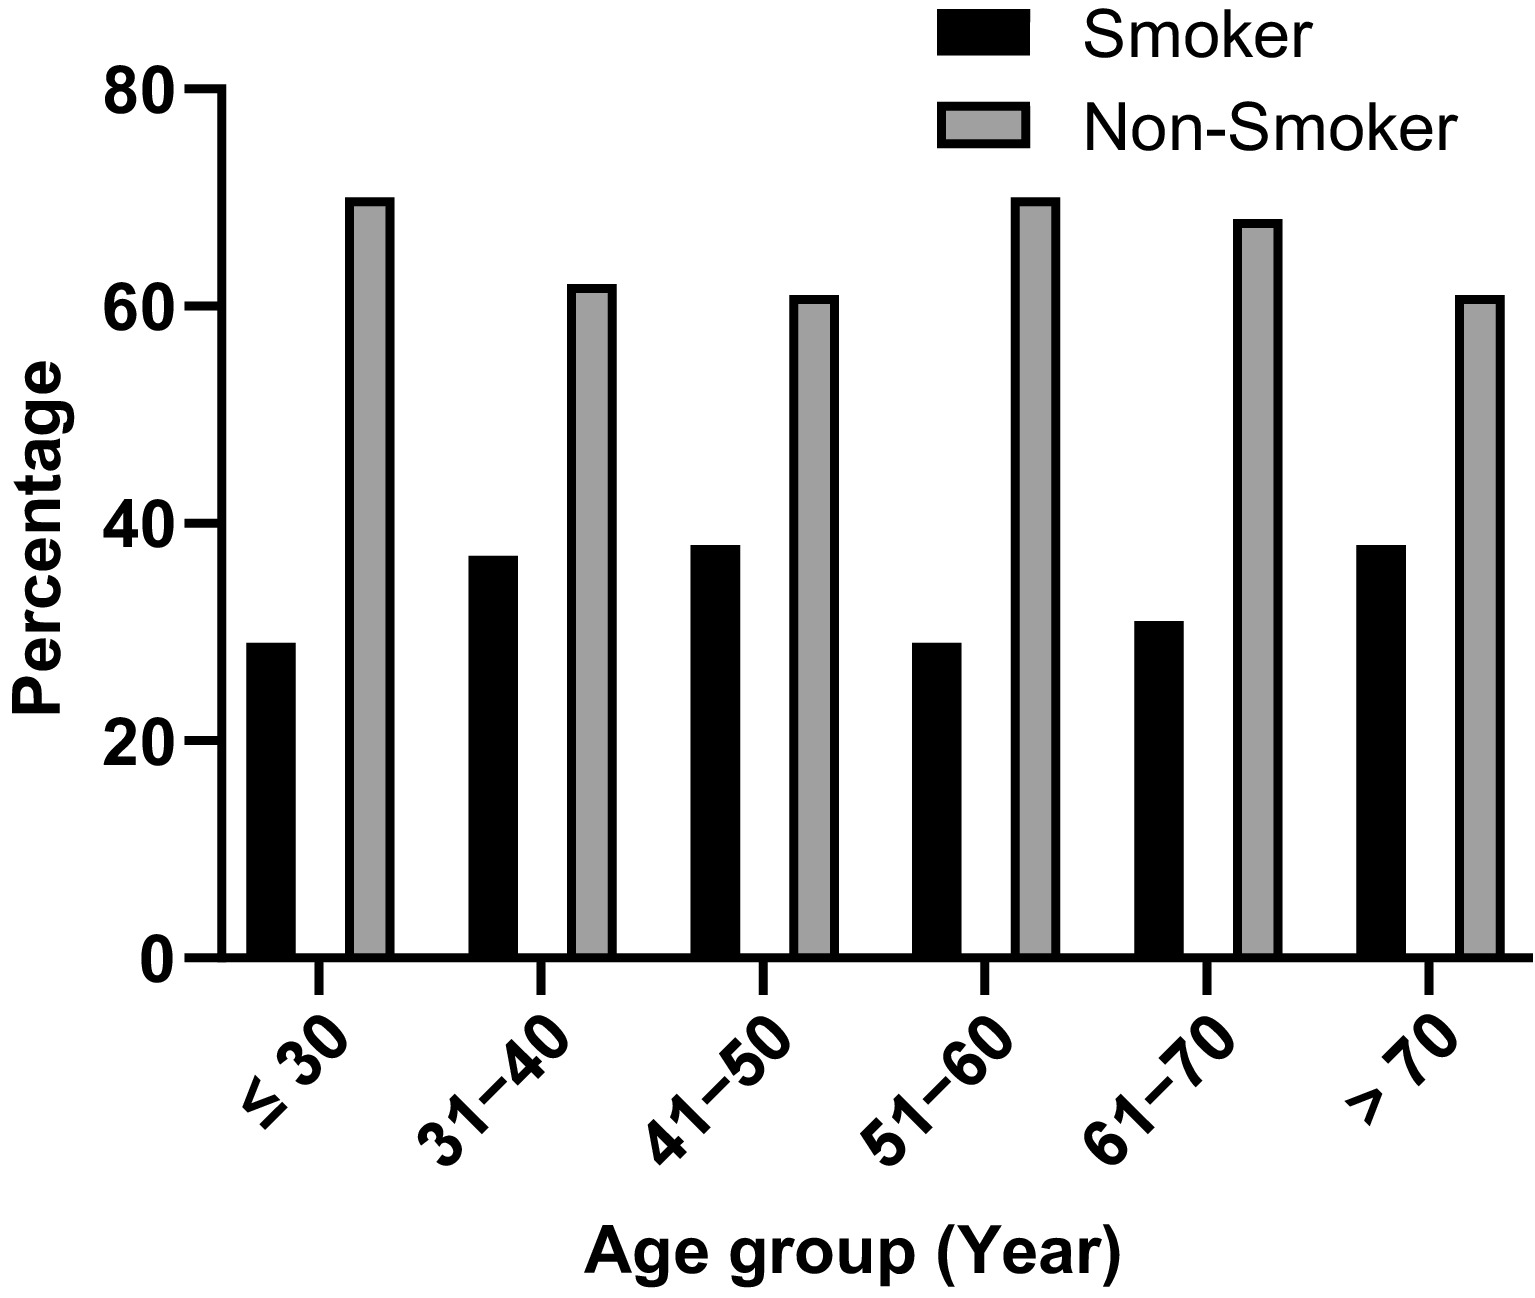
Figure 2.
Prevalence of smoking according to age group.
-
Variables Male n (%) Female n (%) Total n (%) Smoking status Smoker 165 (47.8%) 15 (7.8%) 180 (33.5%) Non-smoker 180 (52.2%) 177 (92.2%) 357 (66.5%) Age (years) 18–30 126 (36.5%) 93 (48.4%) 219 (40.8%) 31–40 97 (28.1%) 50 (26%) 147 (27.4%) 41–50 69 (20%) 26 (13.5%) 95 (17.7%) 51–60 36 (10.4%) 11 (5.7%) 47 (8.8%) 61–70 10 (2.9%) 6 (3.1%) 16 (3%) > 70 7 (2%) 6 (3.1%) 13 (2.4%) Education status Uneducated 111 (32.2%) 61 (31.8%) 172 (32%) Educated 234 (67.8%) 131 (68.2%) 365 (68%) Marital status Single 114 (33%) 99 (51.6%) 213 (39.7%) Married 231 (67%) 93 (48.4%) 324 (60.3%) Employment status Unemployed 112 (32.5%) 140 (72.9%) 252 (46.9%) Employed 233 (67.5%) 52 (27.1%) 285 (53.1%) Physical activity Yes 154 (44.6%) 64 (33.3%) 218 (40.6%) No 191 (55.4%) 128 (66.7%) 319 (59.4%) Sleep disturbance Yes 127 (36.8%) 69 (35.9%) 196 (36.5%) No 218 (63.2%) 123 (64.1%) 341 (63.5%) Hypertension Yes 31 (9%) 20 (10.4%) 51 (9.5%) No 314 (91%) 172 (89.6%) 486 (90.5%) Hyperlipidemia Yes 58 (16.8%) 17 (8.9%) 75 (14%) No 287 (83.2%) 175 (91.1%) 462 (86%) Ischemic heart disease Yes 15 (4.3%) 5 (2.6%) 20 (3.7%) No 330 (95.7%) 187 (97.4%) 517 (96.3%) Thyroid disease Yes 10 (2.9%) 6 (3.1%) 16 (3%) No 335 (97.1%) 186 (96.9%) 521 (97%) Waist circumference Normal 188 (54.5%) 75 (39.1%) 263 (49%) High 157 (45.5%) 117 (60.9%) 274 (51%) Body mass index (BMI) Underweight 10 (2.9%) 8 (4.2%) 18 (3.4%) Normal 116 (33.6%) 63 (32.8%) 179 (33.3%) Overweight 146 (42.3%) 63 (32.8%) 209 (38.9%) Obese 73 (21.2%) 58 (30.2%) 131 (24.4%) Diabetes Non-diabetic 10 (2.9%) 8 (4.2%) 18 (3.4%) Diabetic 335 (97.1%) 184 (95.8%) 519 (96.6%) Table 1.
Characteristics of study participants.
-
Univariate analysis Multivariate analysis Factors Non smoker Smoker Crude OR (95% CI) p-Value Adjusted OR (95% CI) p-Value Gender Female 177 (92.2%) 15 (7.8%) 1 1 Male 180 (52.2%) 165 (47.8%) 10.817 (6.13−19.085) 0.001 8.594 (4.673−15.803) 0.001 Age (years) ≤ 30 155 (70.8%) 64 (29.2%) 1 1 31–40 92 (62.6%) 55 (37.4%) 1.448 (0.93−2.255) 0.102 0.963 (0.5−1.856) 0.911 41–50 58 (61.1%) 37 (38.9%) 1.545 (0.933−2.56) 0.091 0.704 (0.329 1.509) 0.367 51–60 33 (70.2%) 14 (29.8%) 1.027 (0.516−2.048) 0.939 0.523 (0.207−1.32) 0.17 61–70 11 (68.8%) 5 (31.3%) 1.101 (0.368−3.296) 0.864 0.847 (0.218−3.296) 0.81 > 70 8 (61.5%) 5 (38.5%) 1.514 (0.477−4.803) 0.482 1.434 (0.306−6.73) 0.648 Education status Educated 255 (69.9%) 110 (30.1%) 1 1 Uneducated 102 (59.3%) 70 (40.7%) 1.591 (1.091−2.321) 0.016 2.416 (1.457−4.006) 0.001 Marital status Single 158 (74.2%) 55 (25.8%) 1 1 Married 199 (61.4%) 125 (38.6%) 1.804 (1.234−2.638) 0.002 1.286 (0.695−2.379) 0.423 Employment status Unemployed 201 (79.8%) 51 (20.2%) 1 1 Employed 156 (54.7%) 129 (45.3%) 3.259 (2.216−4.793) 0.001 2.177 (1.315−3.606) 0.002 Physical activity No 225 (70.5%) 94 (29.5%) 1 1 Yes 132 (60.6%) 86 (39.4%) 1.559 (1.085−2.242) 0.016 1.655 (1.07−2.562) 0.024 Sleep disturbance No 229 (67.2%) 112 (32.8%) 1 1 Yes 128 (65.3%) 68 (34.7%) 1.086 (0.75−1.574) 0.662 1.112 (0.718−1.724) 0.634 Hypertension Yes 41 (80.4%) 10 (19.6%) 1 1 No 316 (65%) 170 (35%) 2.206 (1.078−4.513) 0.03 2.457 (1.044−5.779) 0.039 Hyperlipidemia No 312 (67.5%) 150 (32.5%) 1 1 Yes 45 (60%) 30 (40%) 1.387 (0.84−2.289) 0.201 1.155 (0.613−2.178) 0.656 Ischemic heart disease Yes 14 (70%) 6 (30%) 1 1 No 343 (66.3%) 174 (33.7%) 1.184 (0.447−3.134) 0.734 2.014 (0.568−7.15) 0.279 Thyroid disease No 347 (66.6%) 174 (33.4%) 1 1 Yes 10 (62.5%) 6 (37.5%) 1.197 (0.428−3.346) 0.732 1.555 (0.437−5.532) 0.496 Waist circumference High 189 (69%) 85 (31%) 1 1 Normal 168 (63.9%) 95 (36.1%) 1.257 (0.878−1.8) 0.211 0.896 (0.519−1.544) 0.691 Body mass index (BMI) Normal 118 (65.9%) 61 (34.1%) 1 1 Underweight 12 (66.7%) 6 (33.3%) 0.967 (0.346−2.703) 0.949 1.263 (0.368−4.336) 0.711 Overweight 133 (63.6%) 76 (36.4%) 1.105 (0.728−1.679) 0.639 0.728 (0.42−1.26) 0.257 Obese 94 (71.8%) 37 (28.2%) 0.761 (0.466−1.243) 0.276 0.639 (0.311−1.315) 0.224 Diabetes Non-diabetic 346 (66.7%) 173 (33.3%) 1 1 Diabetic 11 (61.1%) 7 (38.9%) 1.273 (0.485−3.341) 0.624 2.15 (0.62−7.456) 0.228 Table 2.
Factors related to smoking.
Figures
(2)
Tables
(2)