-
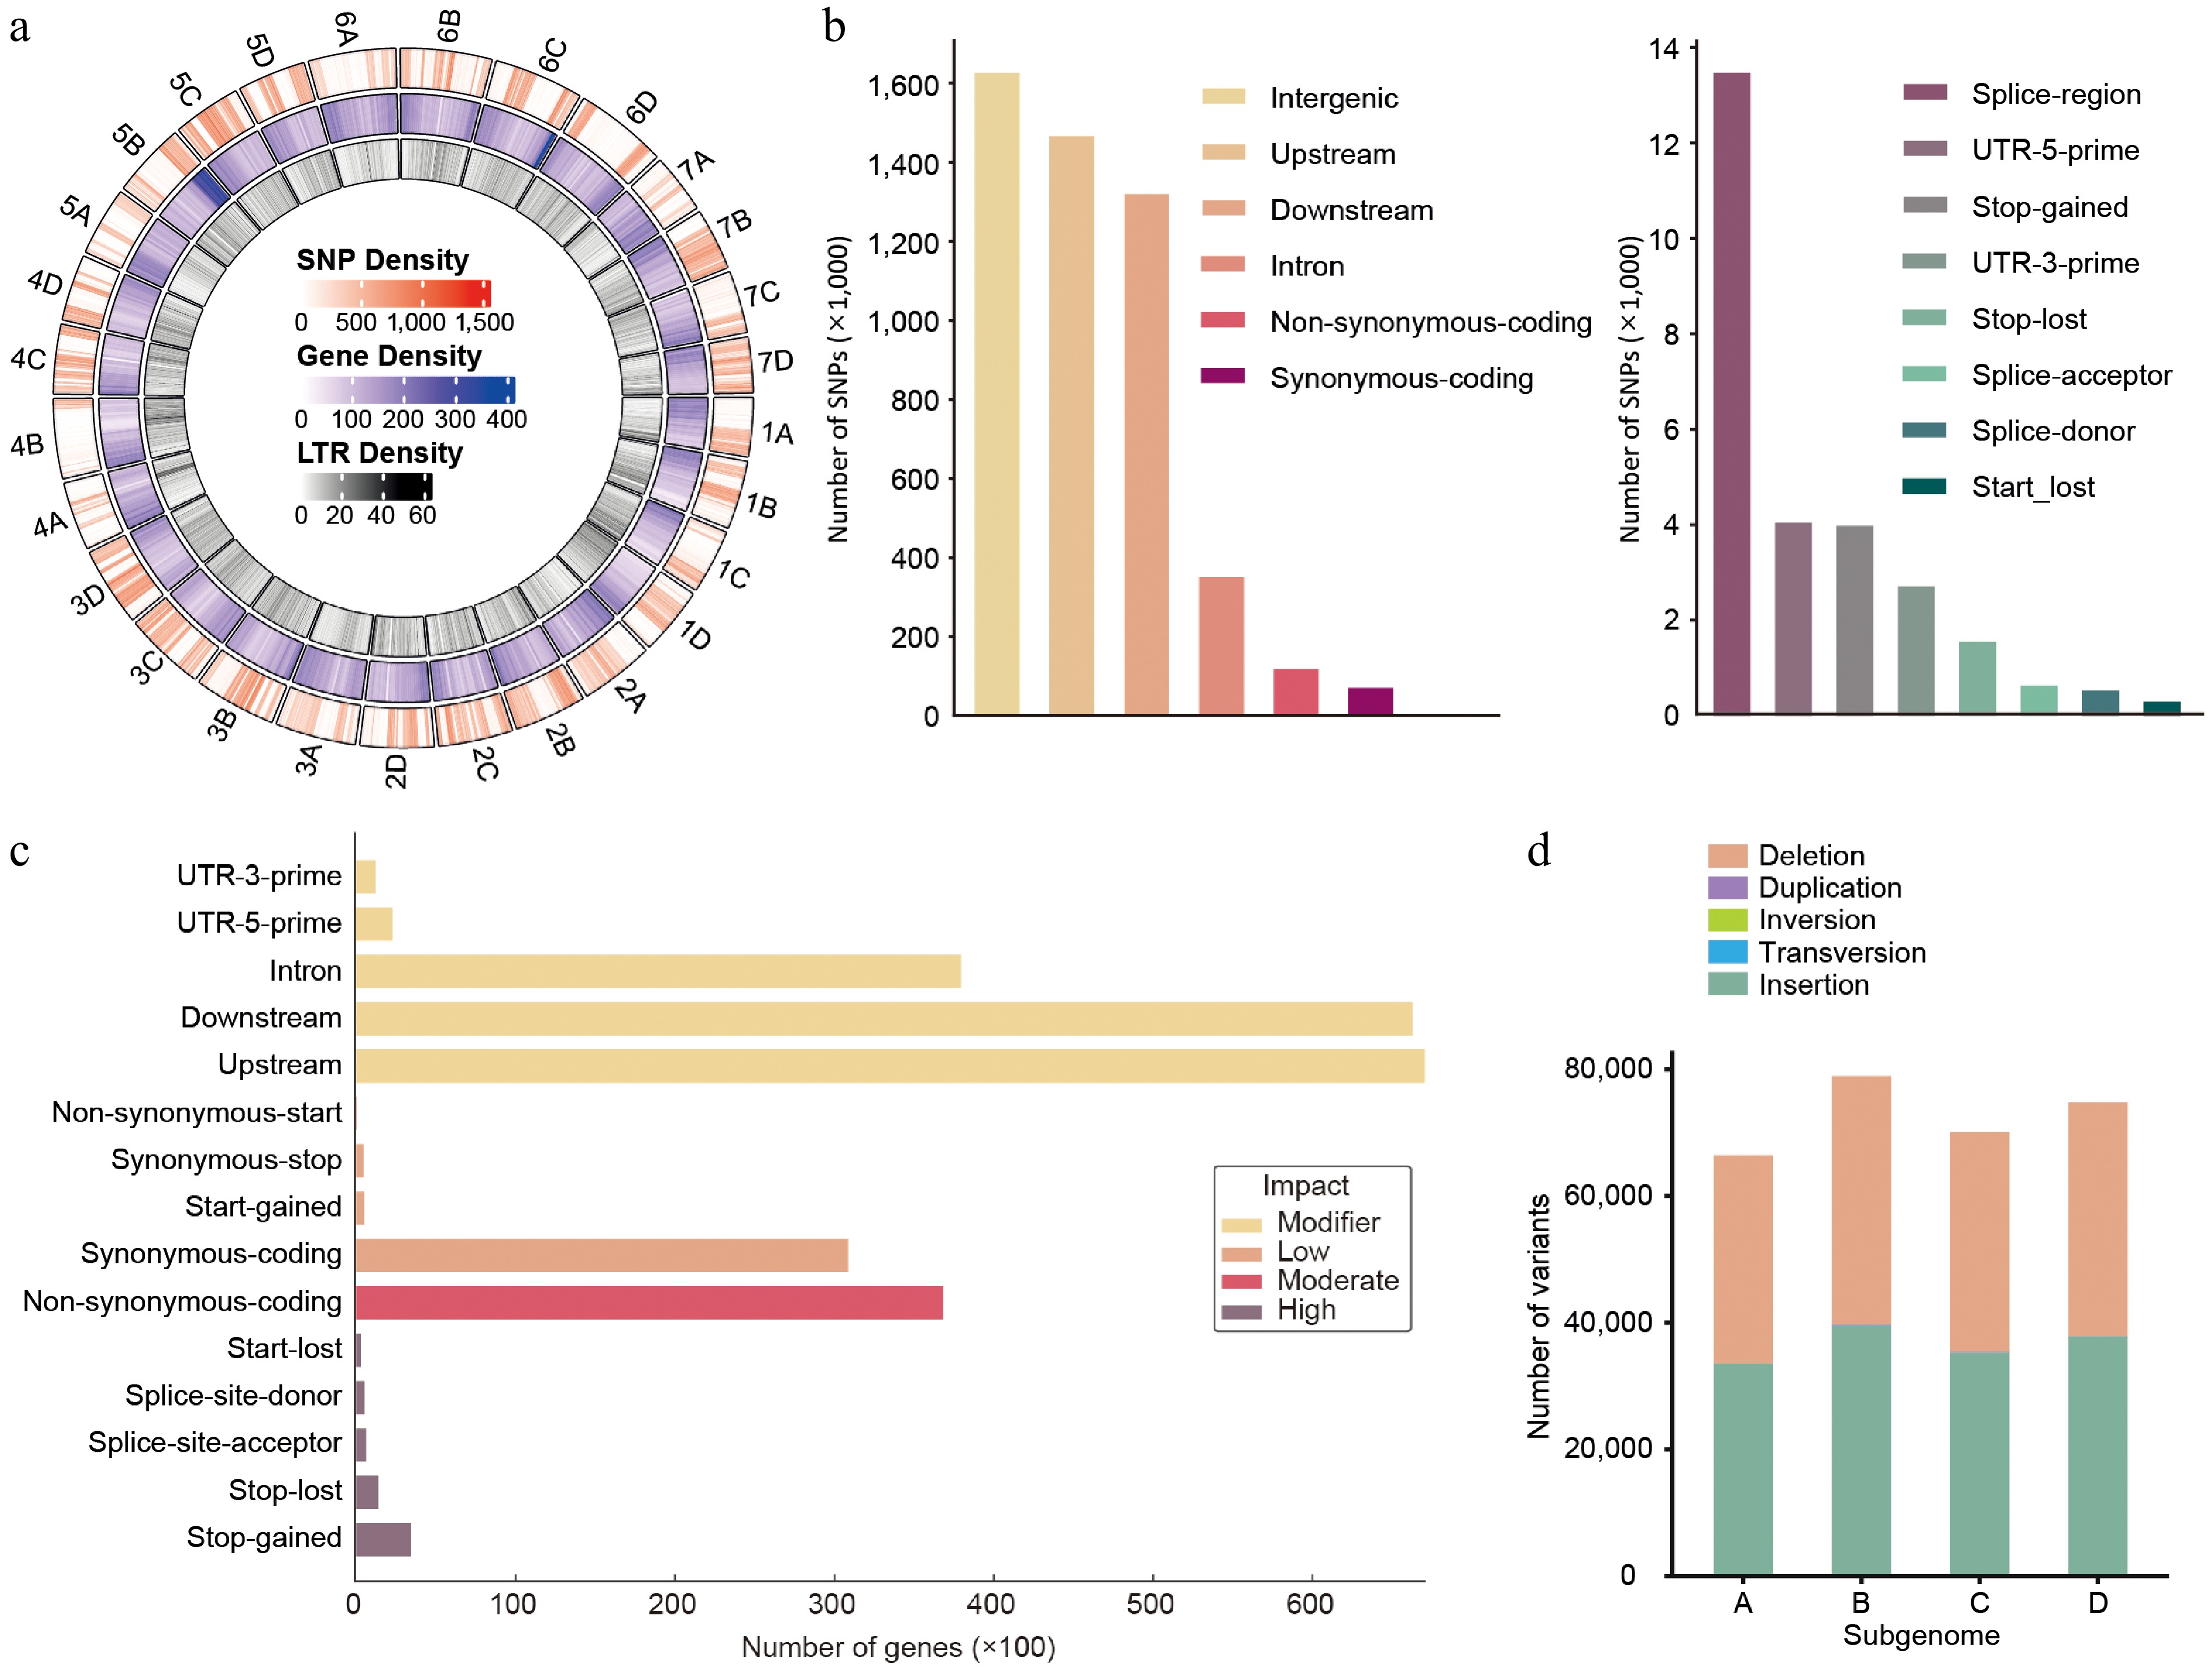
Figure 1.
Genome-wide distribution and annotation of SNPs and structural variants between 'Florida Brilliance' and 'Seolhyang' strawberries. (a) Circos plot showing genome-wide distributions of SNP density (outermost ring, red), gene density (middle ring, blue), and LTR density (innermost ring, green) across the chromosomes of the analyzed Seolhyang reference genome. Whole-genome resequencing (WGS) data of Brilliance was aligned to the Seolhyang reference genome for this analysis. (b) Functional classification of SNPs according to genomic context. Left panel: most SNPs are located in intergenic, upstream, or downstream regions. Right panel: SNPs within coding and regulatory regions, including splice sites and UTRs. (c) The number of genes harboring SNPs, classified based on their predicted functional impact into four categories: modifier, low, moderate, and high. (d) Distribution of structural variants (SVs), including deletions, duplications, inversions, transversions, and insertions across four subgenomes A–D.
-
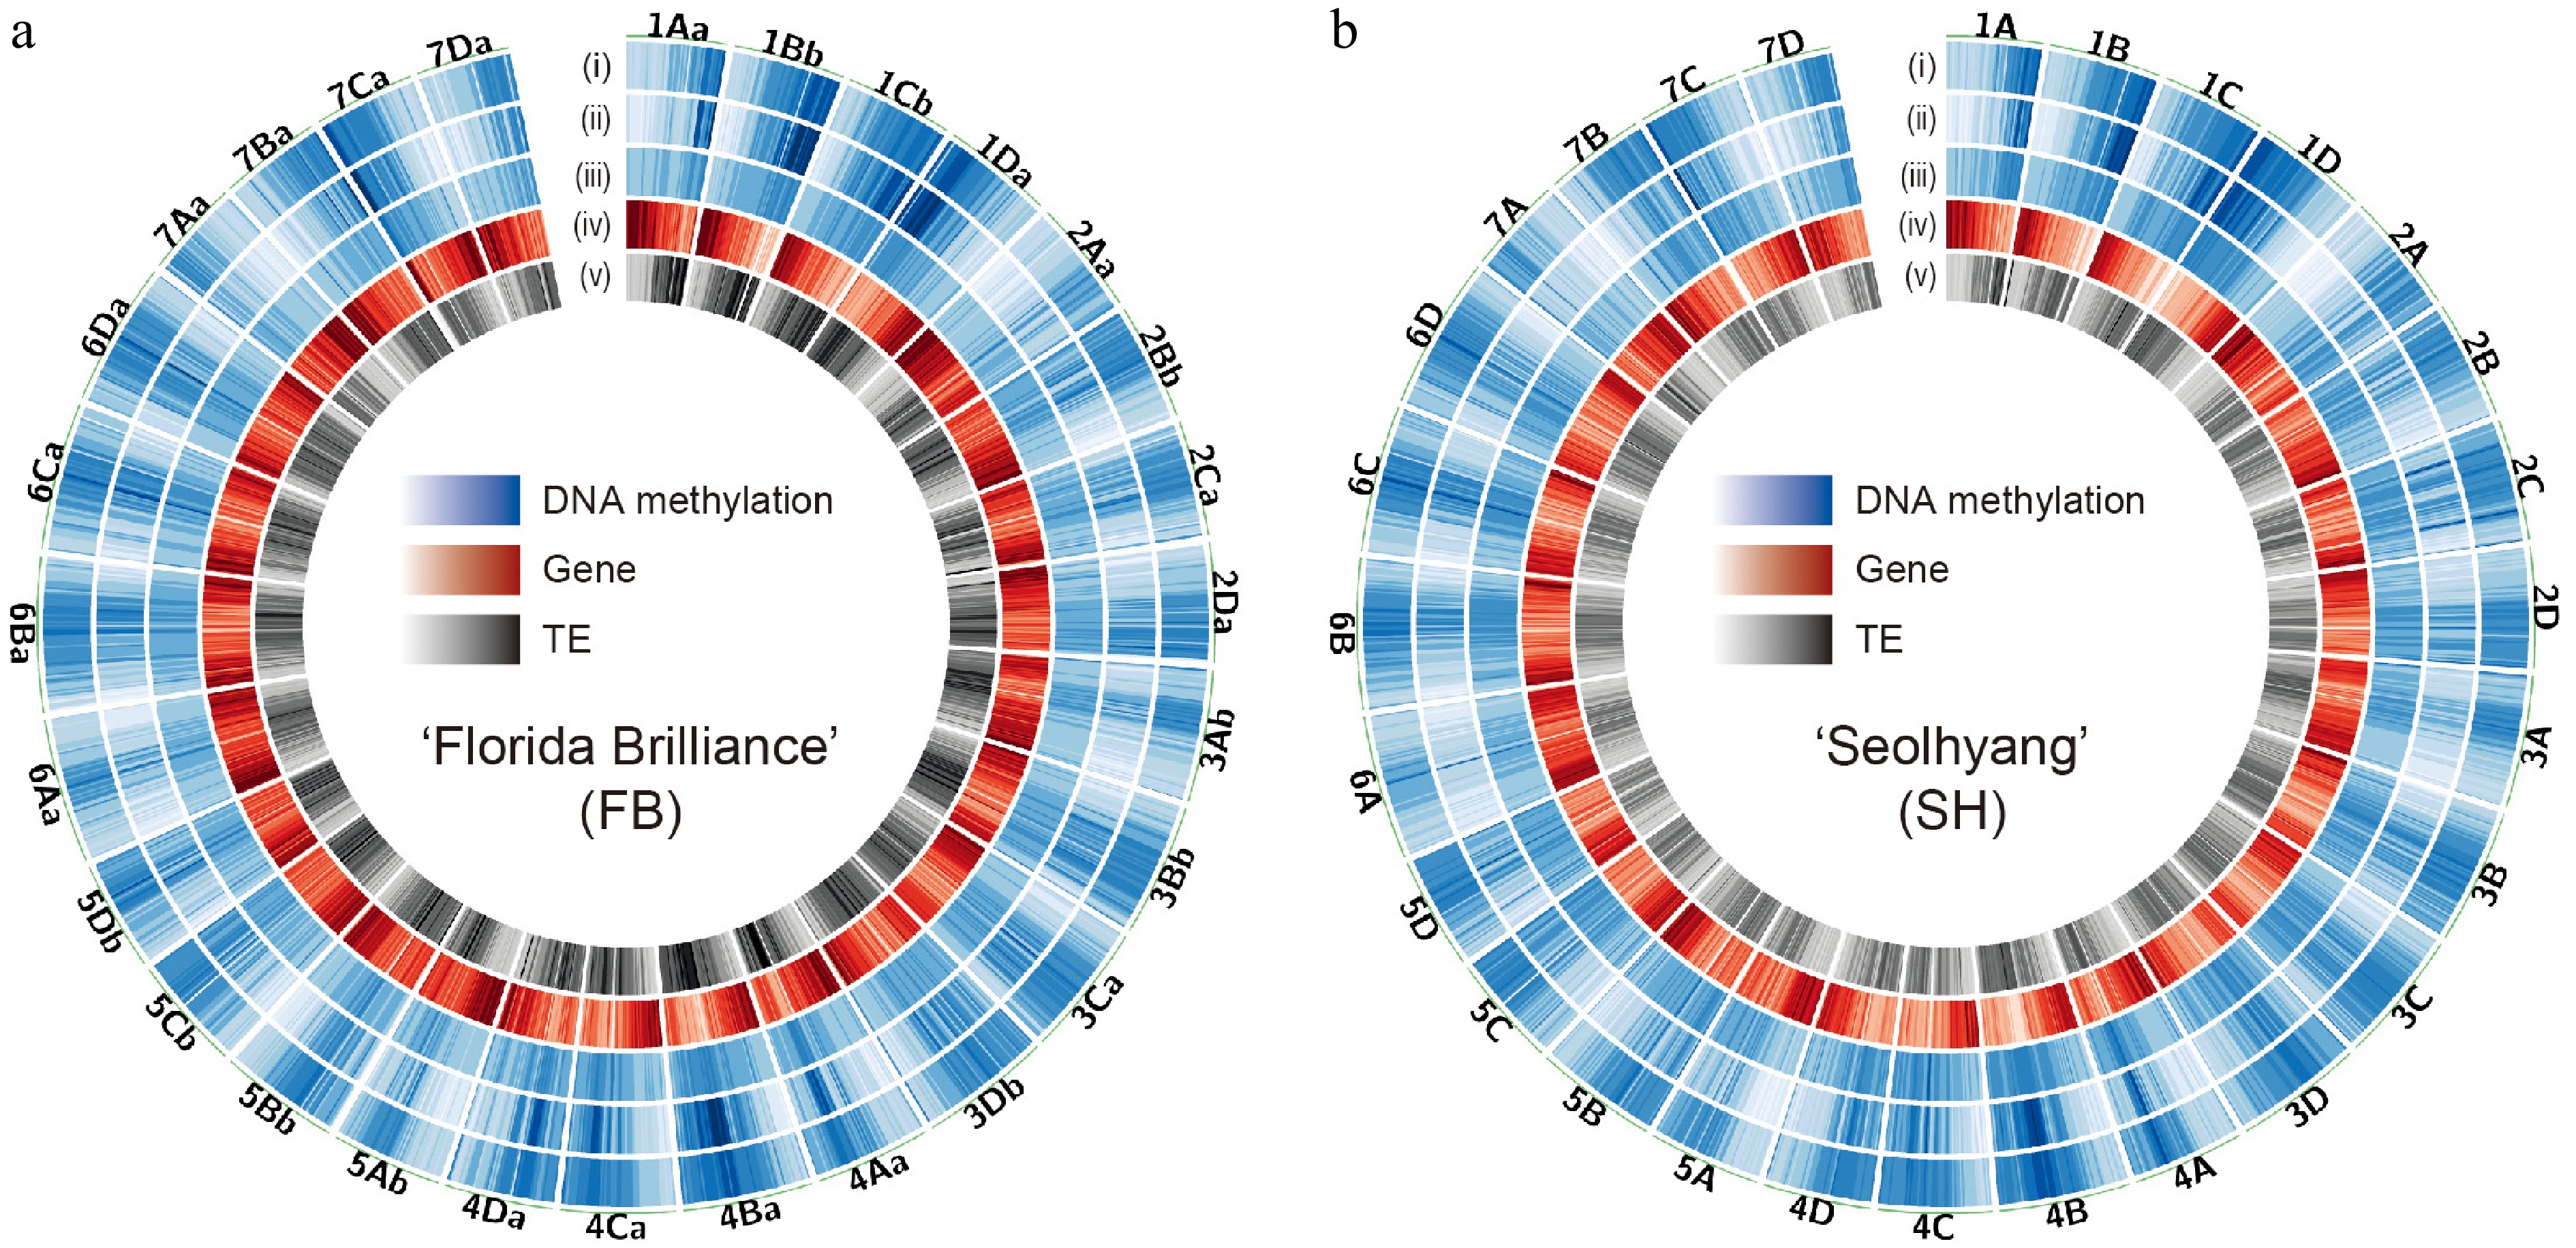
Figure 2.
Genome-wide DNA methylation landscape of octoploid strawberry cultivars. Circos plots showing the genome-wide distribution of DNA methylation in (a) 'Florida Brilliance' (FB), and (b) 'Seolhyang' (SH). Each track indicates the density of (i) mCG, (ii) mCHG, (iii) mCHH, (iv) genes, and (v) TEs from the outside. The density scales are as follows: mCG (0–1), mCHG (0–0.6), mCHH (0–0.1), genes (0–100), and TEs (0–774). Methylation levels and feature densities were calculated in non-overlapping 500-kb windows across the genome.
-
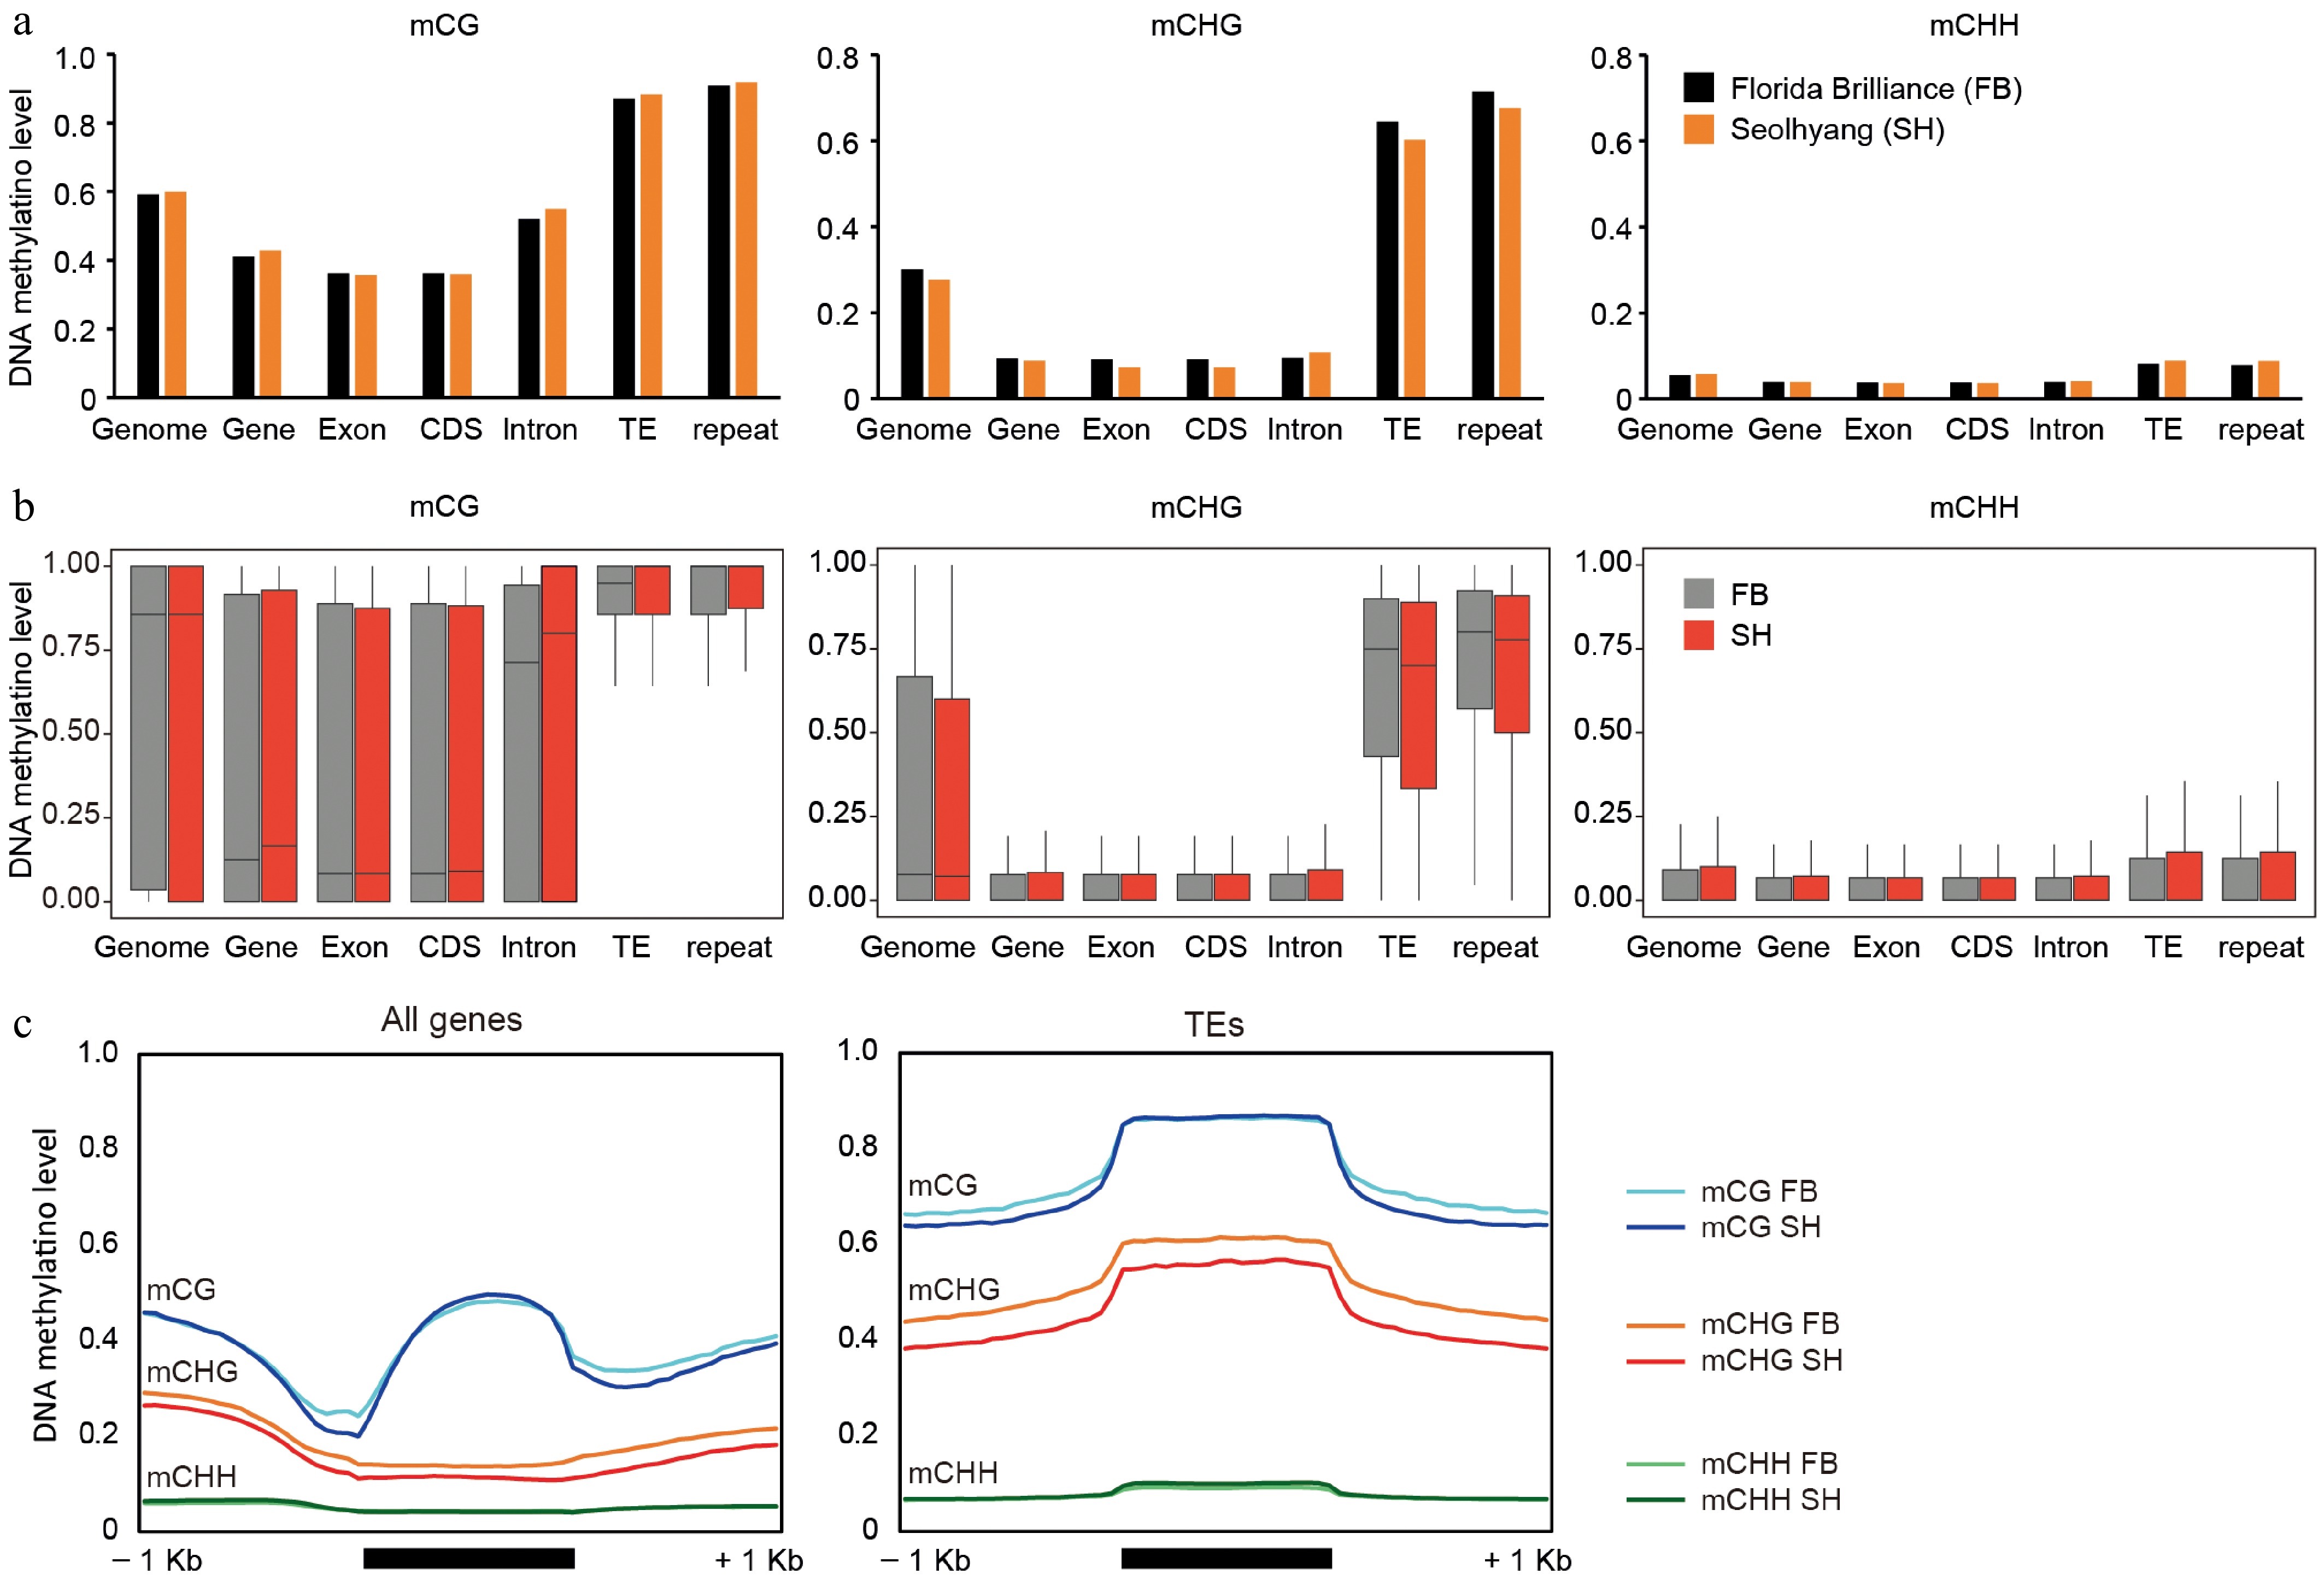
Figure 3.
Comparative analysis of DNA methylation levels across genomic features in octoploid strawberry cultivars. (a) Average DNA methylation levels in CG, CHG, and CHH contexts across various genomic features, including whole genome, genes, exons, coding sequences (CDS), introns, TEs, and repetitive elements. (b) Distribution of DNA methylation levels in CG, CHG, and CHH contexts across the same genomic features shown in (a), with variation represented as boxplots for FB (gray) and SH (red). (c) Metaplots illustrating DNA methylation patterns over genes and TEs. To generate the metaplots, each region comprising the 1-kb upstream, the gene/TE body, and the 1-kb downstream was divided into 20 equal-sized bins. For each bin, the number of methylated cytosine reads and the total cytosine reads were counted, and the average methylation level was calculated based on these values.
-
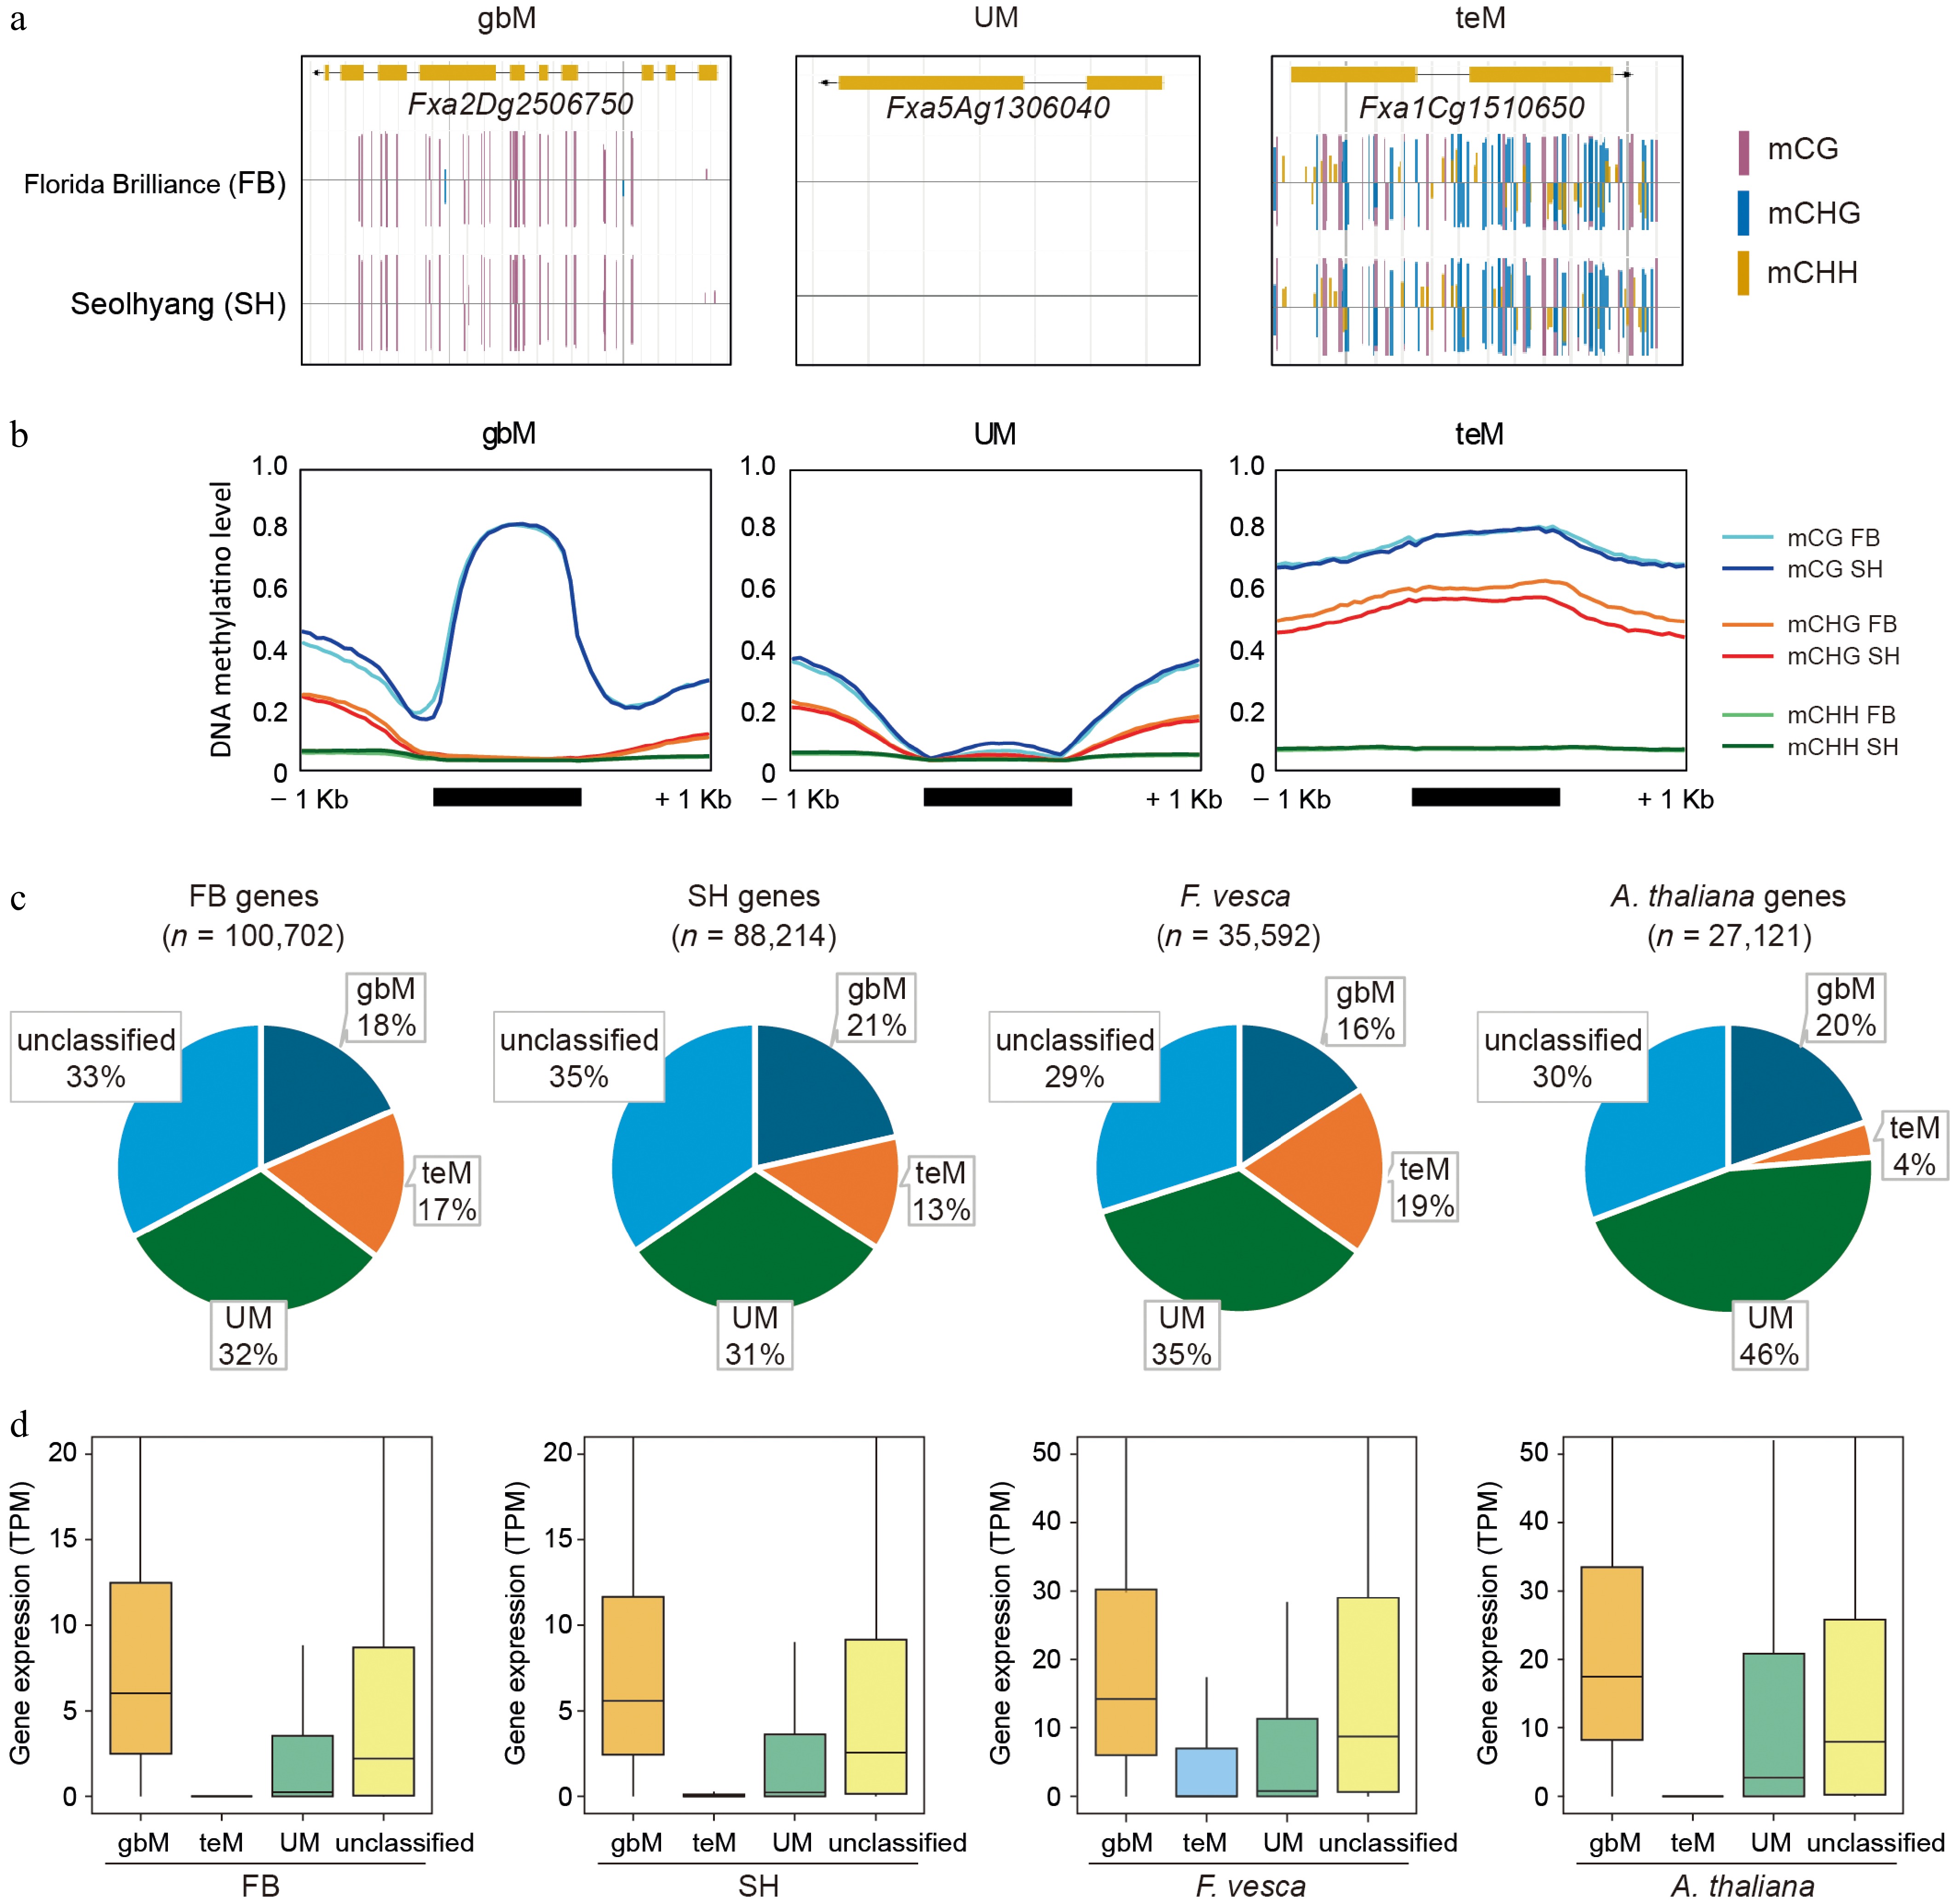
Figure 4.
Classification and comparison of gene methylation patterns in octoploid strawberry cultivars. (a) Representative genome browser views of genes classified as CG gene body methylated (gbM), unmethylated (UM), and TE-like methylated (teM) in FB and SH. Methylation contexts are indicated by colored bars: mCG (magenta), mCHG (blue), and mCHH (yellow). (b) Metaplots showing DNA methylation levels across 1-kb upstream and downstream regions of gbM, UM, and teM genes, where average methylation levels were calculated by dividing each region into 20 equal bins and computing the mean ratio of methylated to total cytosine reads within each bin. (c) Pie charts representing the proportions of gbM, teM, UM, and unclassified genes in FB, SH, Fragaria vesca, and Arabidopsis thaliana. (d) Boxplots showing gene expression levels (TPM) for each methylation category (gbM, teM, UM, and unclassified) in FB, SH, F. vesca, and A. thaliana.
-
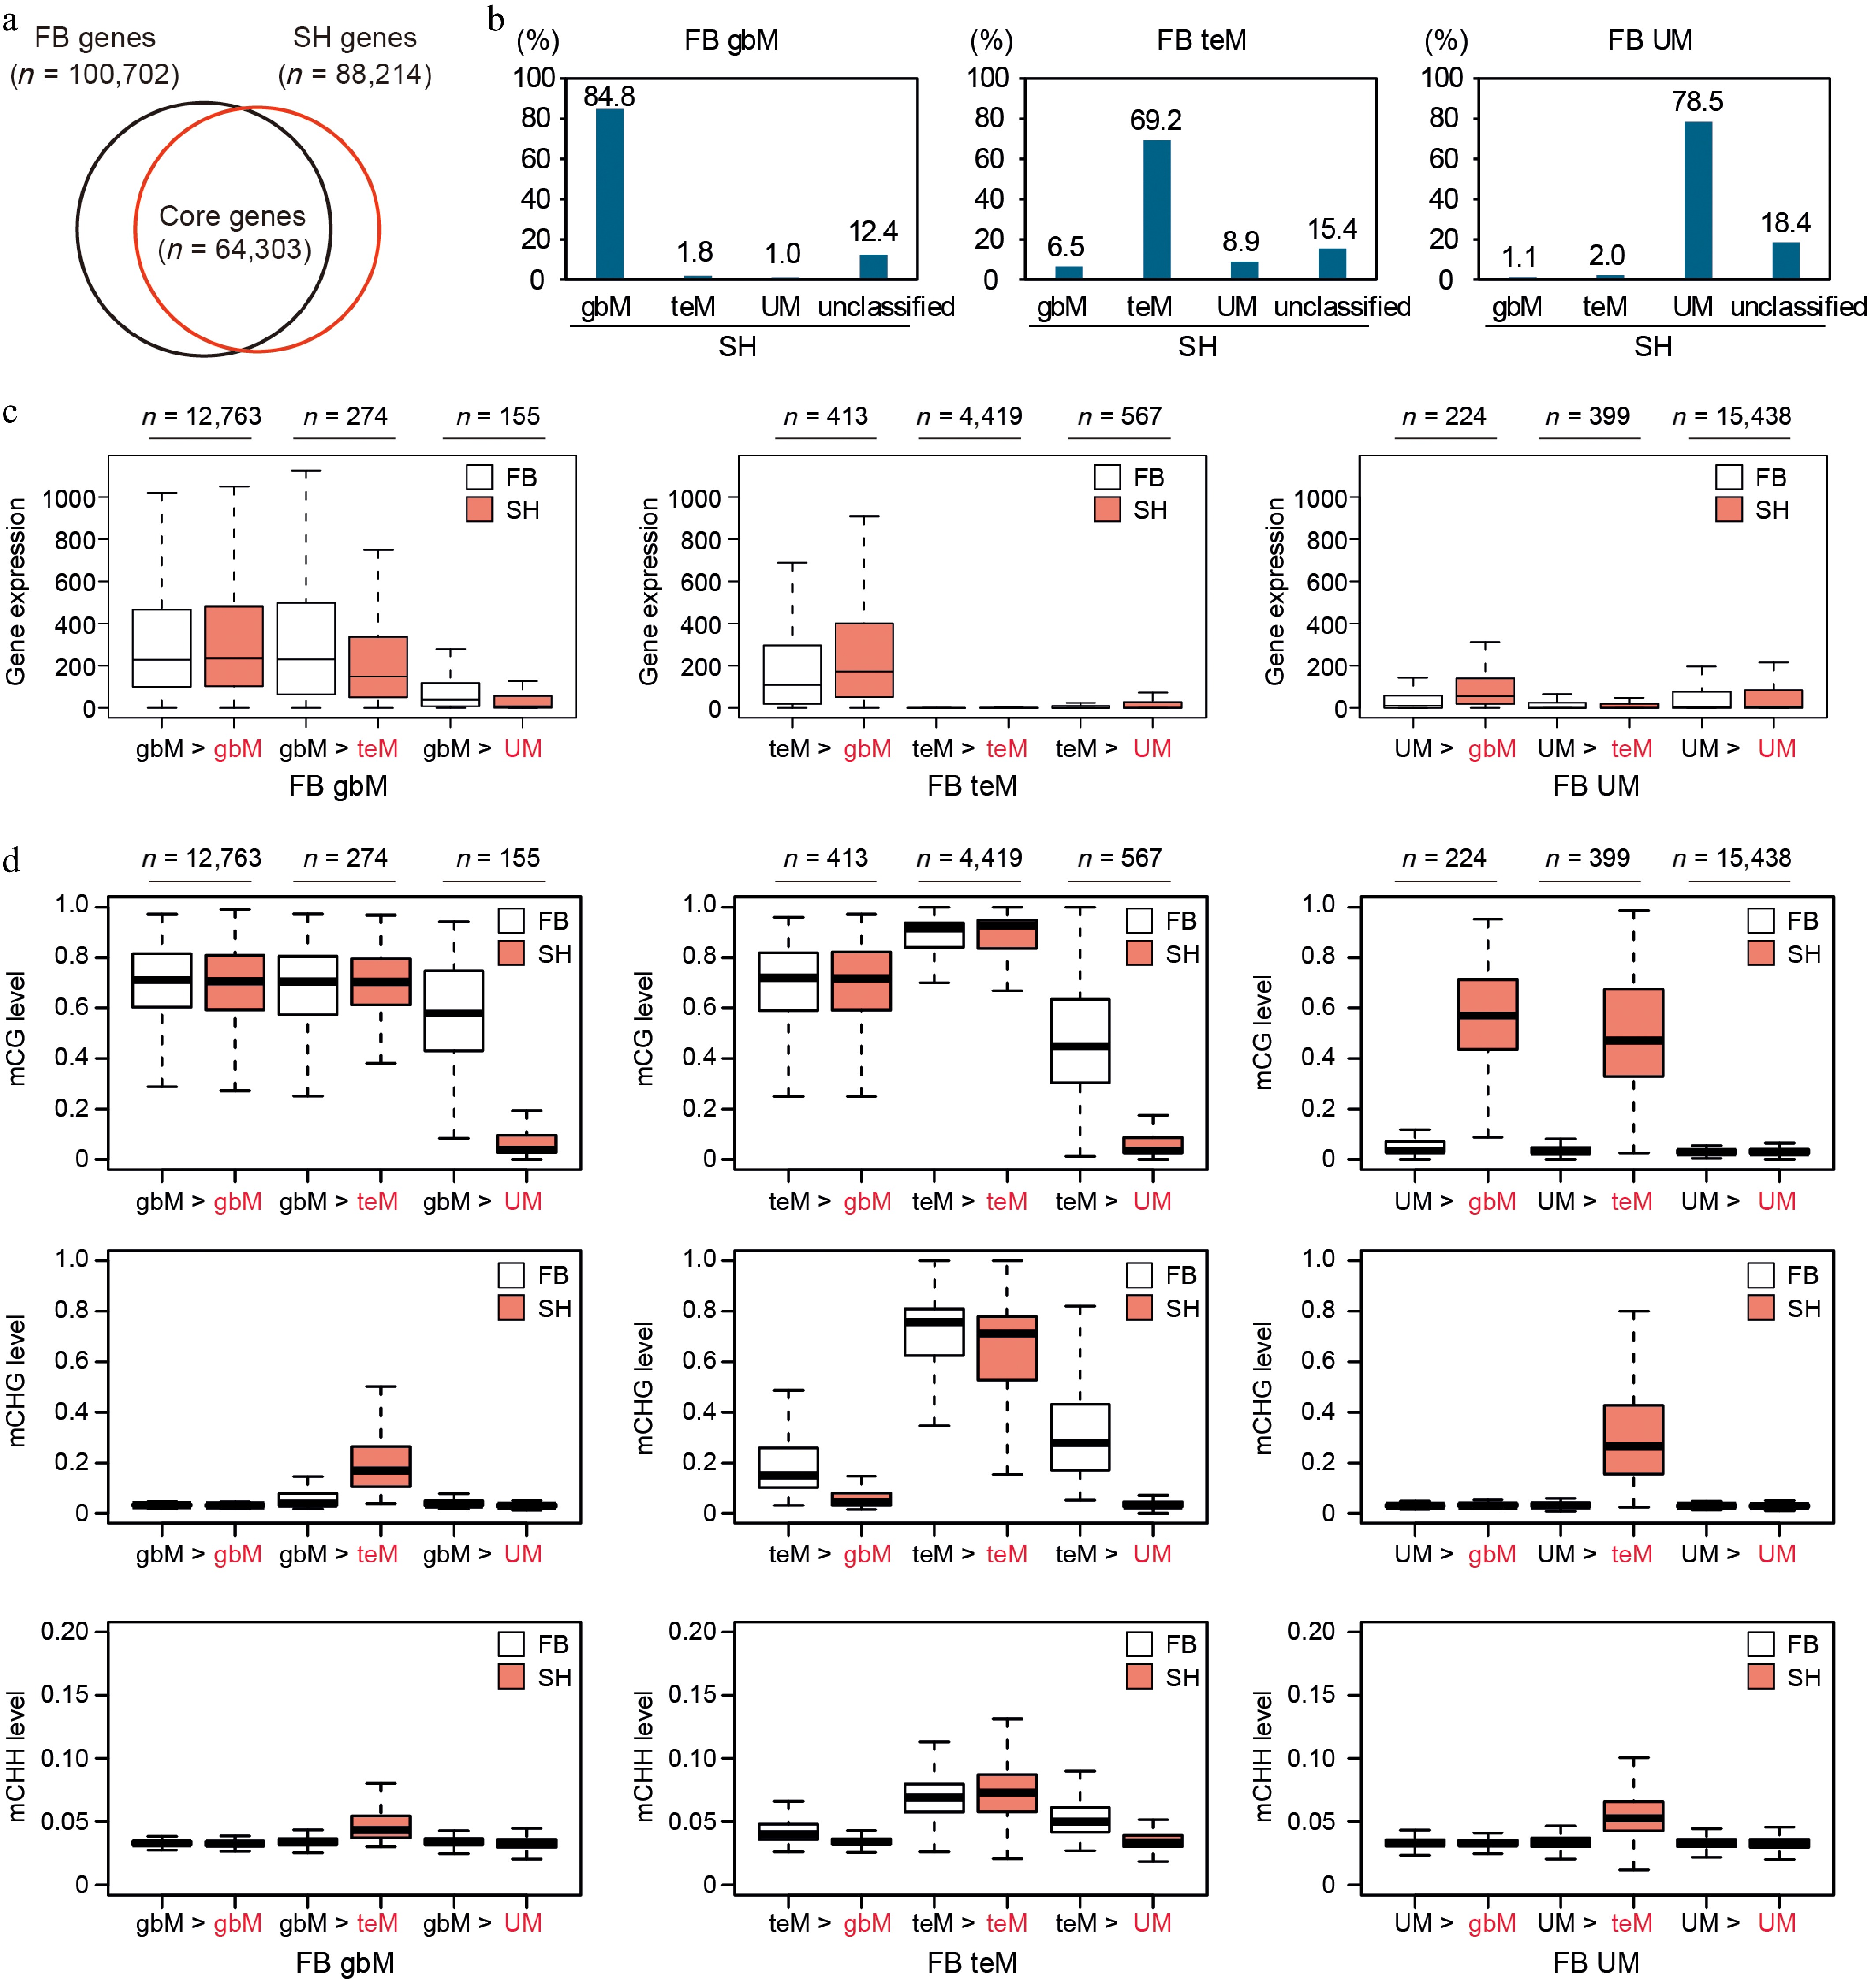
Figure 5.
Conservation and dynamics of gene body methylation and gene expression between FB and SH. (a) Venn diagram showing the overlap of predicted genes between FB and SH. A total of 64,303 genes with one-to-one reciprocal best BLAST hits at the protein level were defined as core genes and used for the analyses in panels (b)–(d). (b) Transition of DNA methylation classification (gbM, teM, UM) of FB genes in SH. For each methylation category in FB (gbM, teM, and UM), the percentage of genes that retained or shifted their methylation classification in SH is shown. (c) Gene expression levels normalized for gene length and library size, and (d) DNA methylation levels in FB (white) and SH (red) across transition categories. Each panel compares the expression of genes classified as gbM, teM, or UM in FB, grouped by their corresponding methylation category in SH.
-
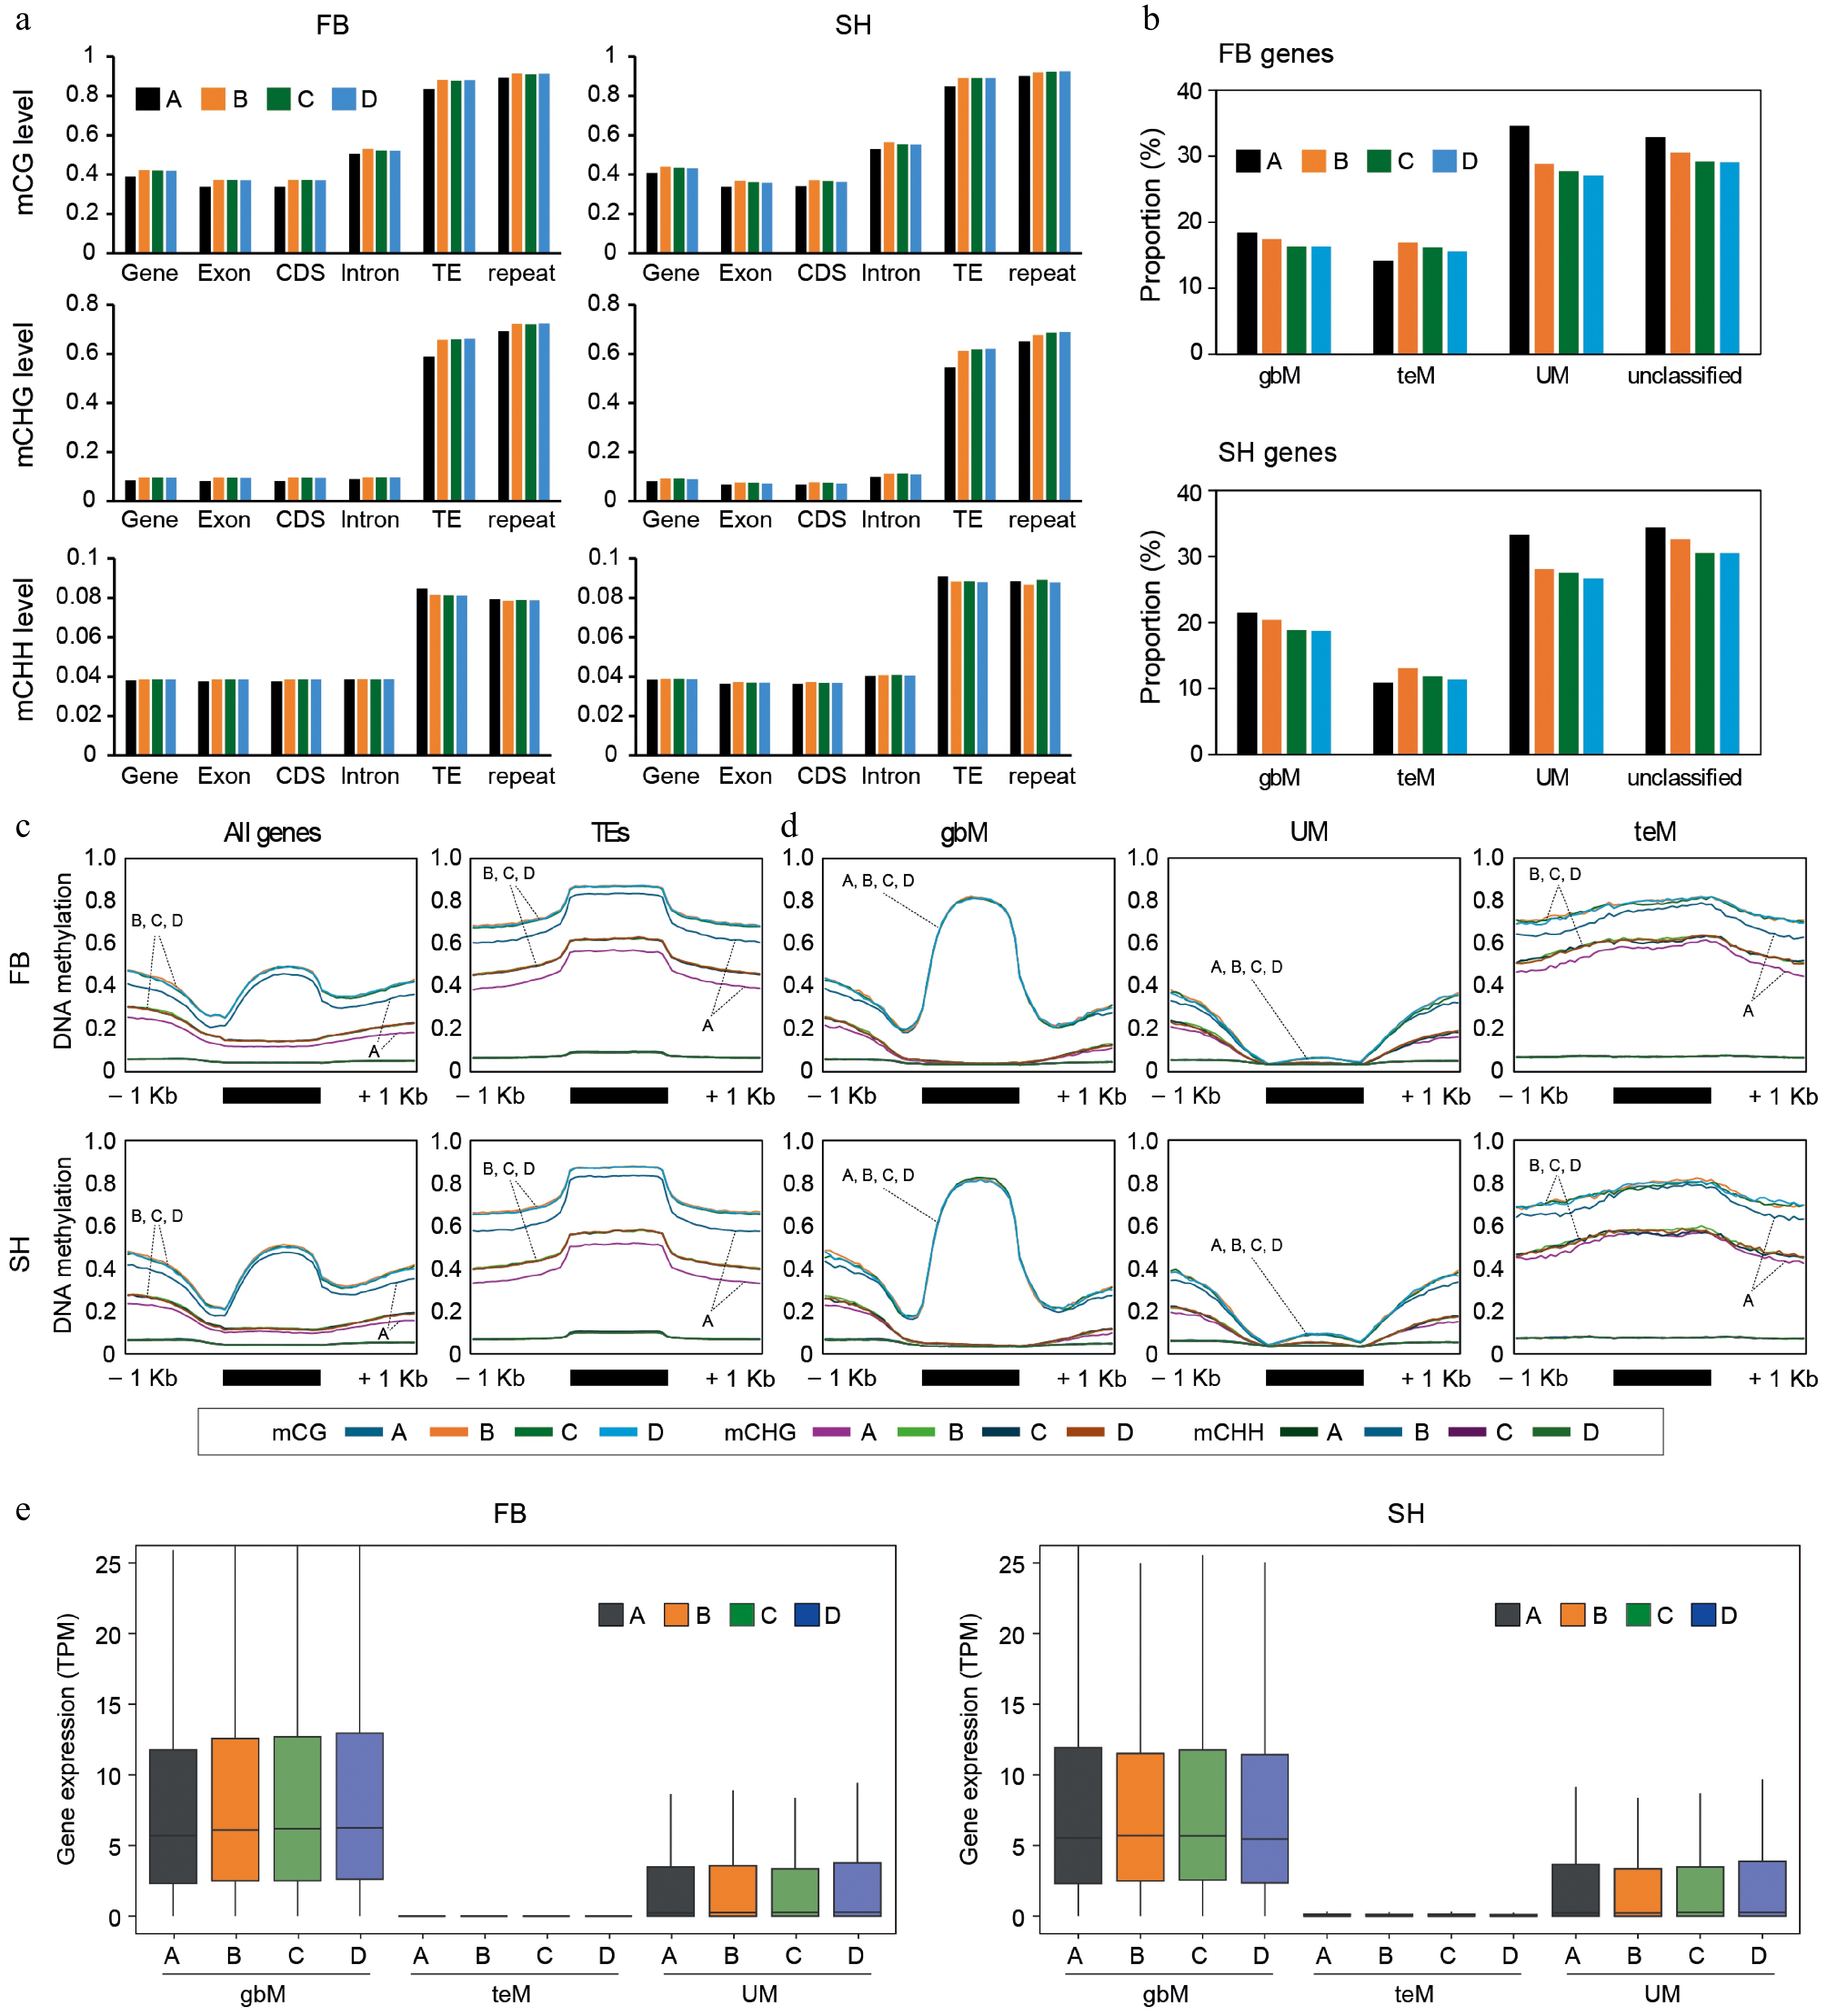
Figure 6.
DNA methylation and gene expression profiles across subgenomes in octoploid strawberry cultivars. (a) DNA methylation levels (mCG, mCHG, mCHH) across genomic features, including genes, exons, CDS, introns, TEs, and repeats, were analyzed for each subgenome (A, B, C, D). (b) Proportion of gene groups (gbM, UM, teM, and unclassified) for each subgenome in FB and SH. Subgenome-specific proportions revealed subtle differences between the cultivars. (c) Metaplots showing DNA methylation patterns across genes and TEs for each subgenome. (d) DNA methylation metaplots for gbM, UM, and teM genes across subgenomes. (e) Gene expression levels of gbM, UM, and teM genes were compared across subgenomes.
-
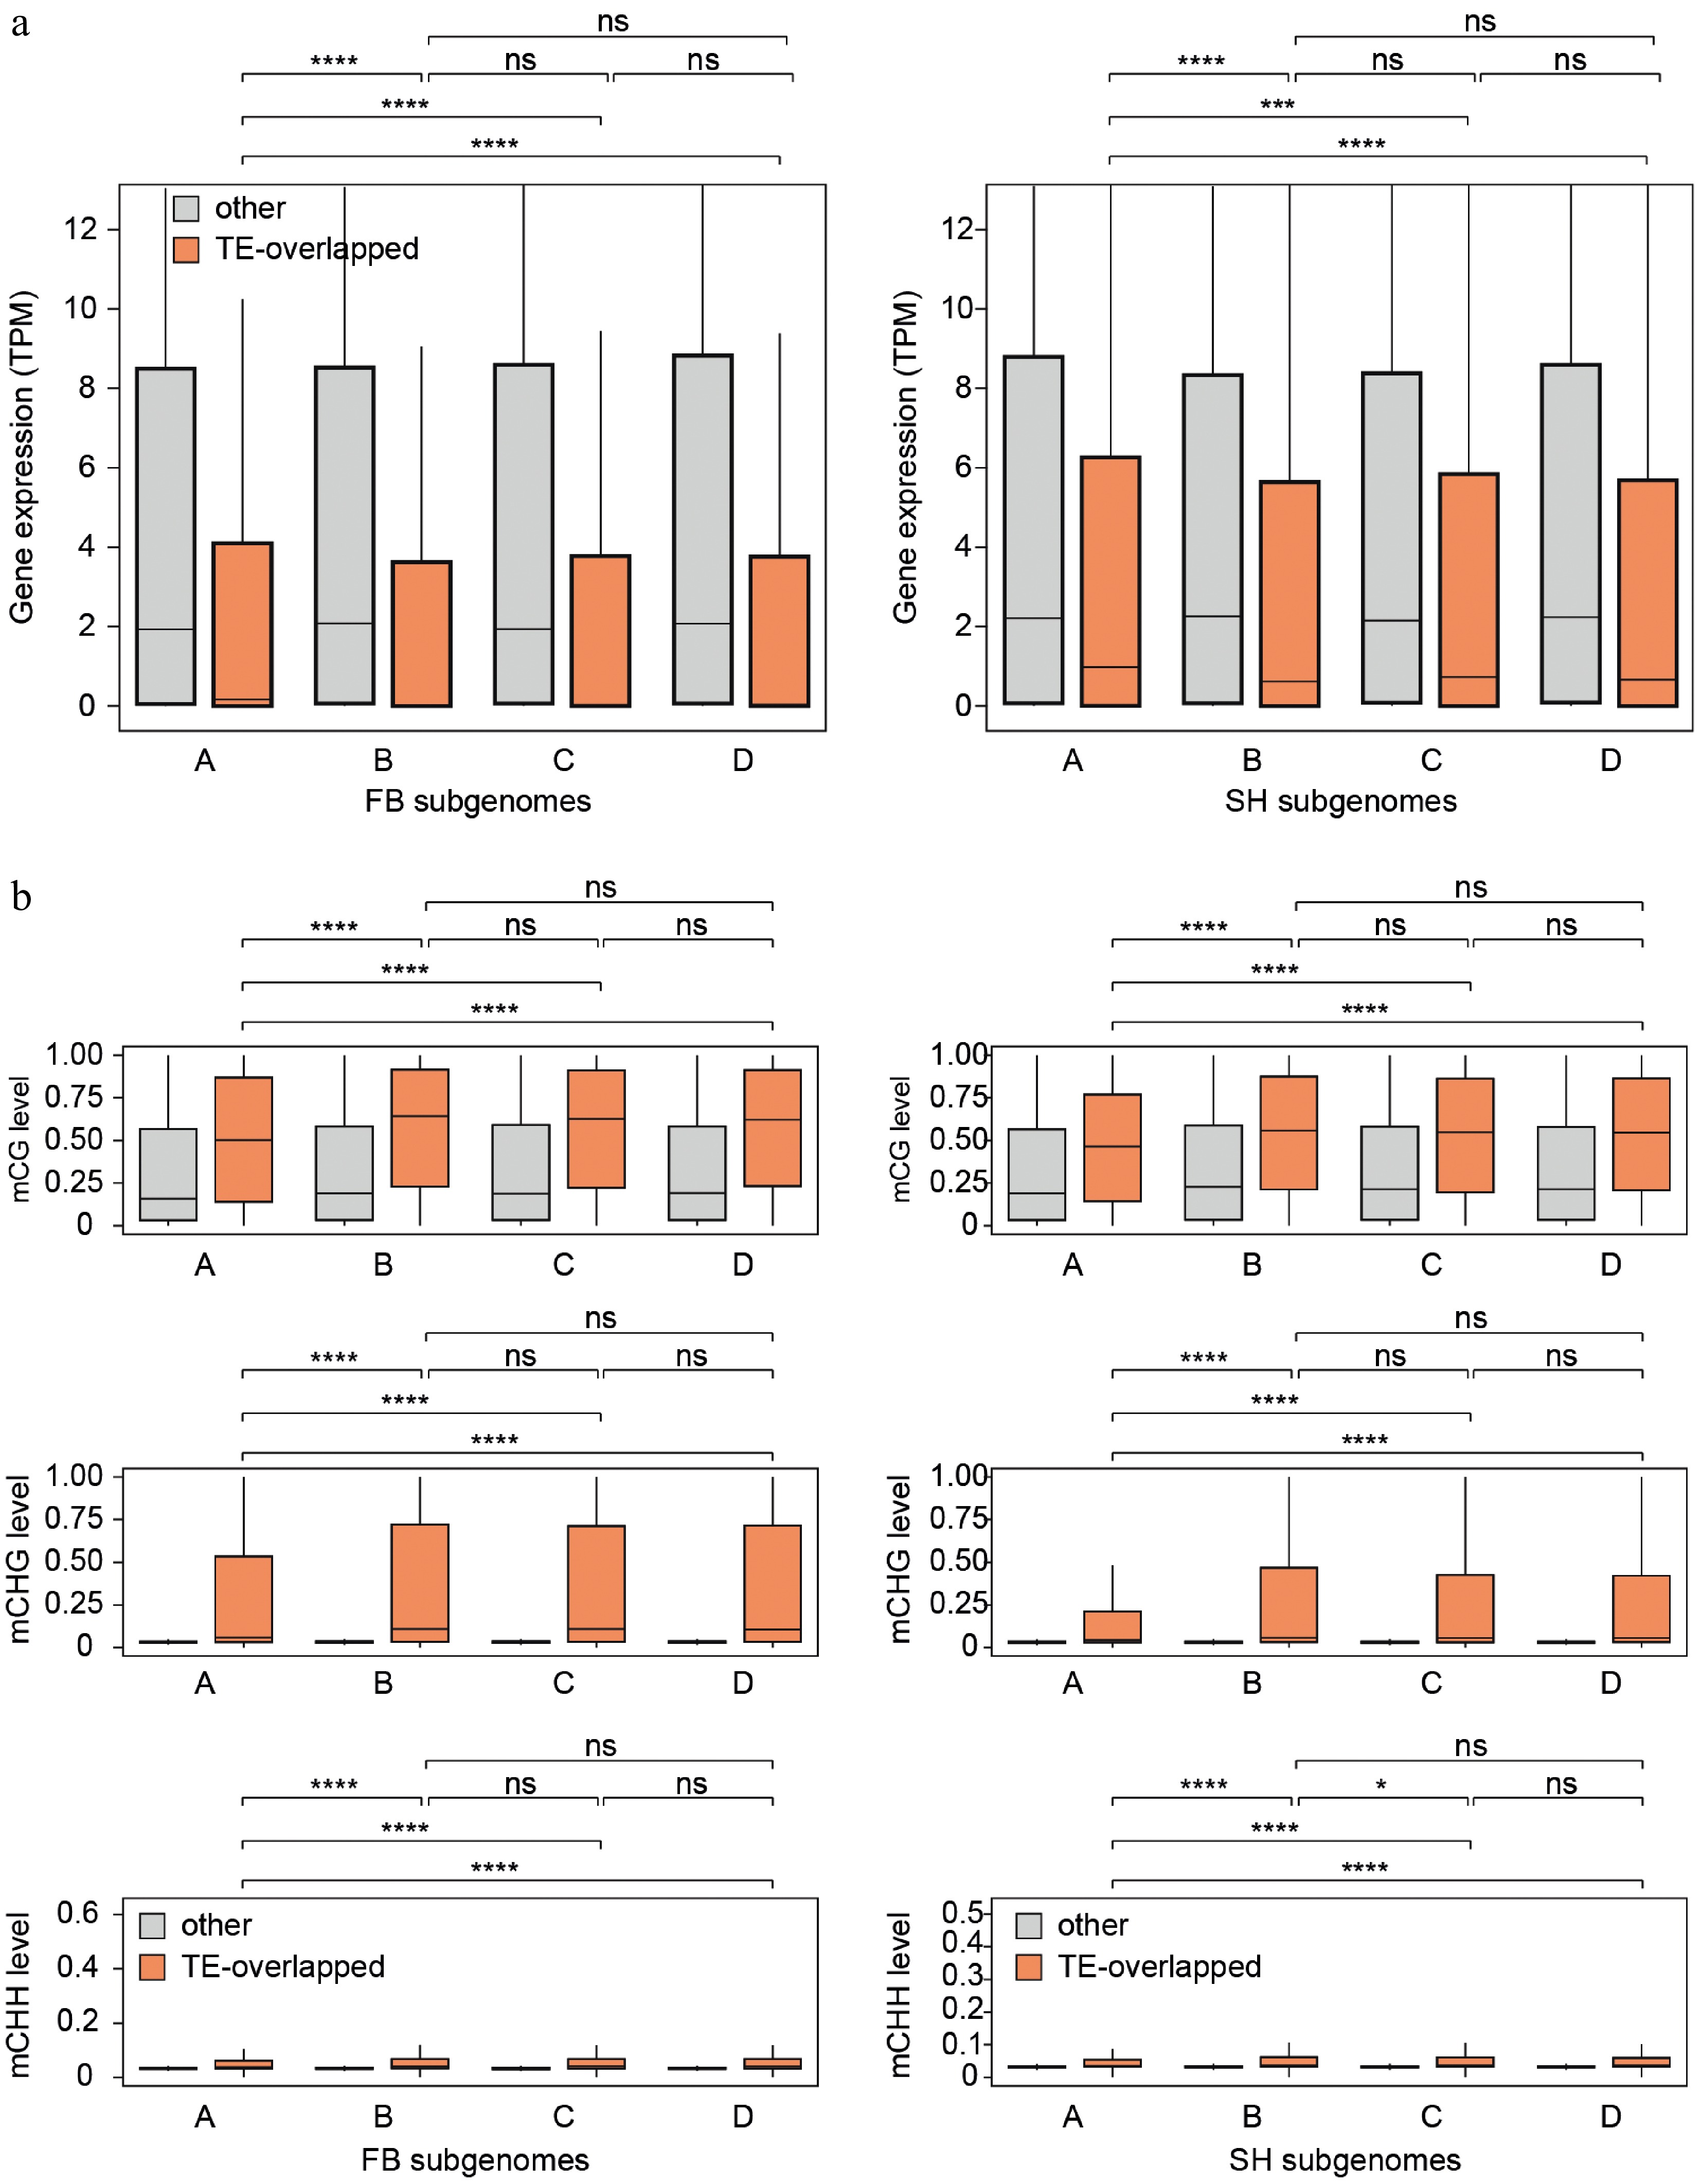
Figure 7.
Differences in gene expression and DNA methylation between TE-overlapping and non-overlapping genes across subgenomes. (a) Boxplots showing gene expression levels (TPM) of TE-overlapping genes (orange) and non-overlapping genes (gray) in each subgenome (A–D) for FB (left) and SH (right). (b) Boxplots of CG, CHG, and CHH methylation levels at gene bodies for TE-overlapping and non-overlapping genes across subgenomes in both cultivars. Notably, only subgenome A exhibited significantly higher gene expression and lower DNA methylation levels in TE-overlapping genes compared to subgenomes B–D. Statistical comparisons were performed using the Wilcoxon test. * p ≤ 0.05, ** p ≤ 0.01, *** p ≤ 0.001, **** p ≤ 0.0001, ns = not significant.
Figures
(7)
Tables
(0)