-
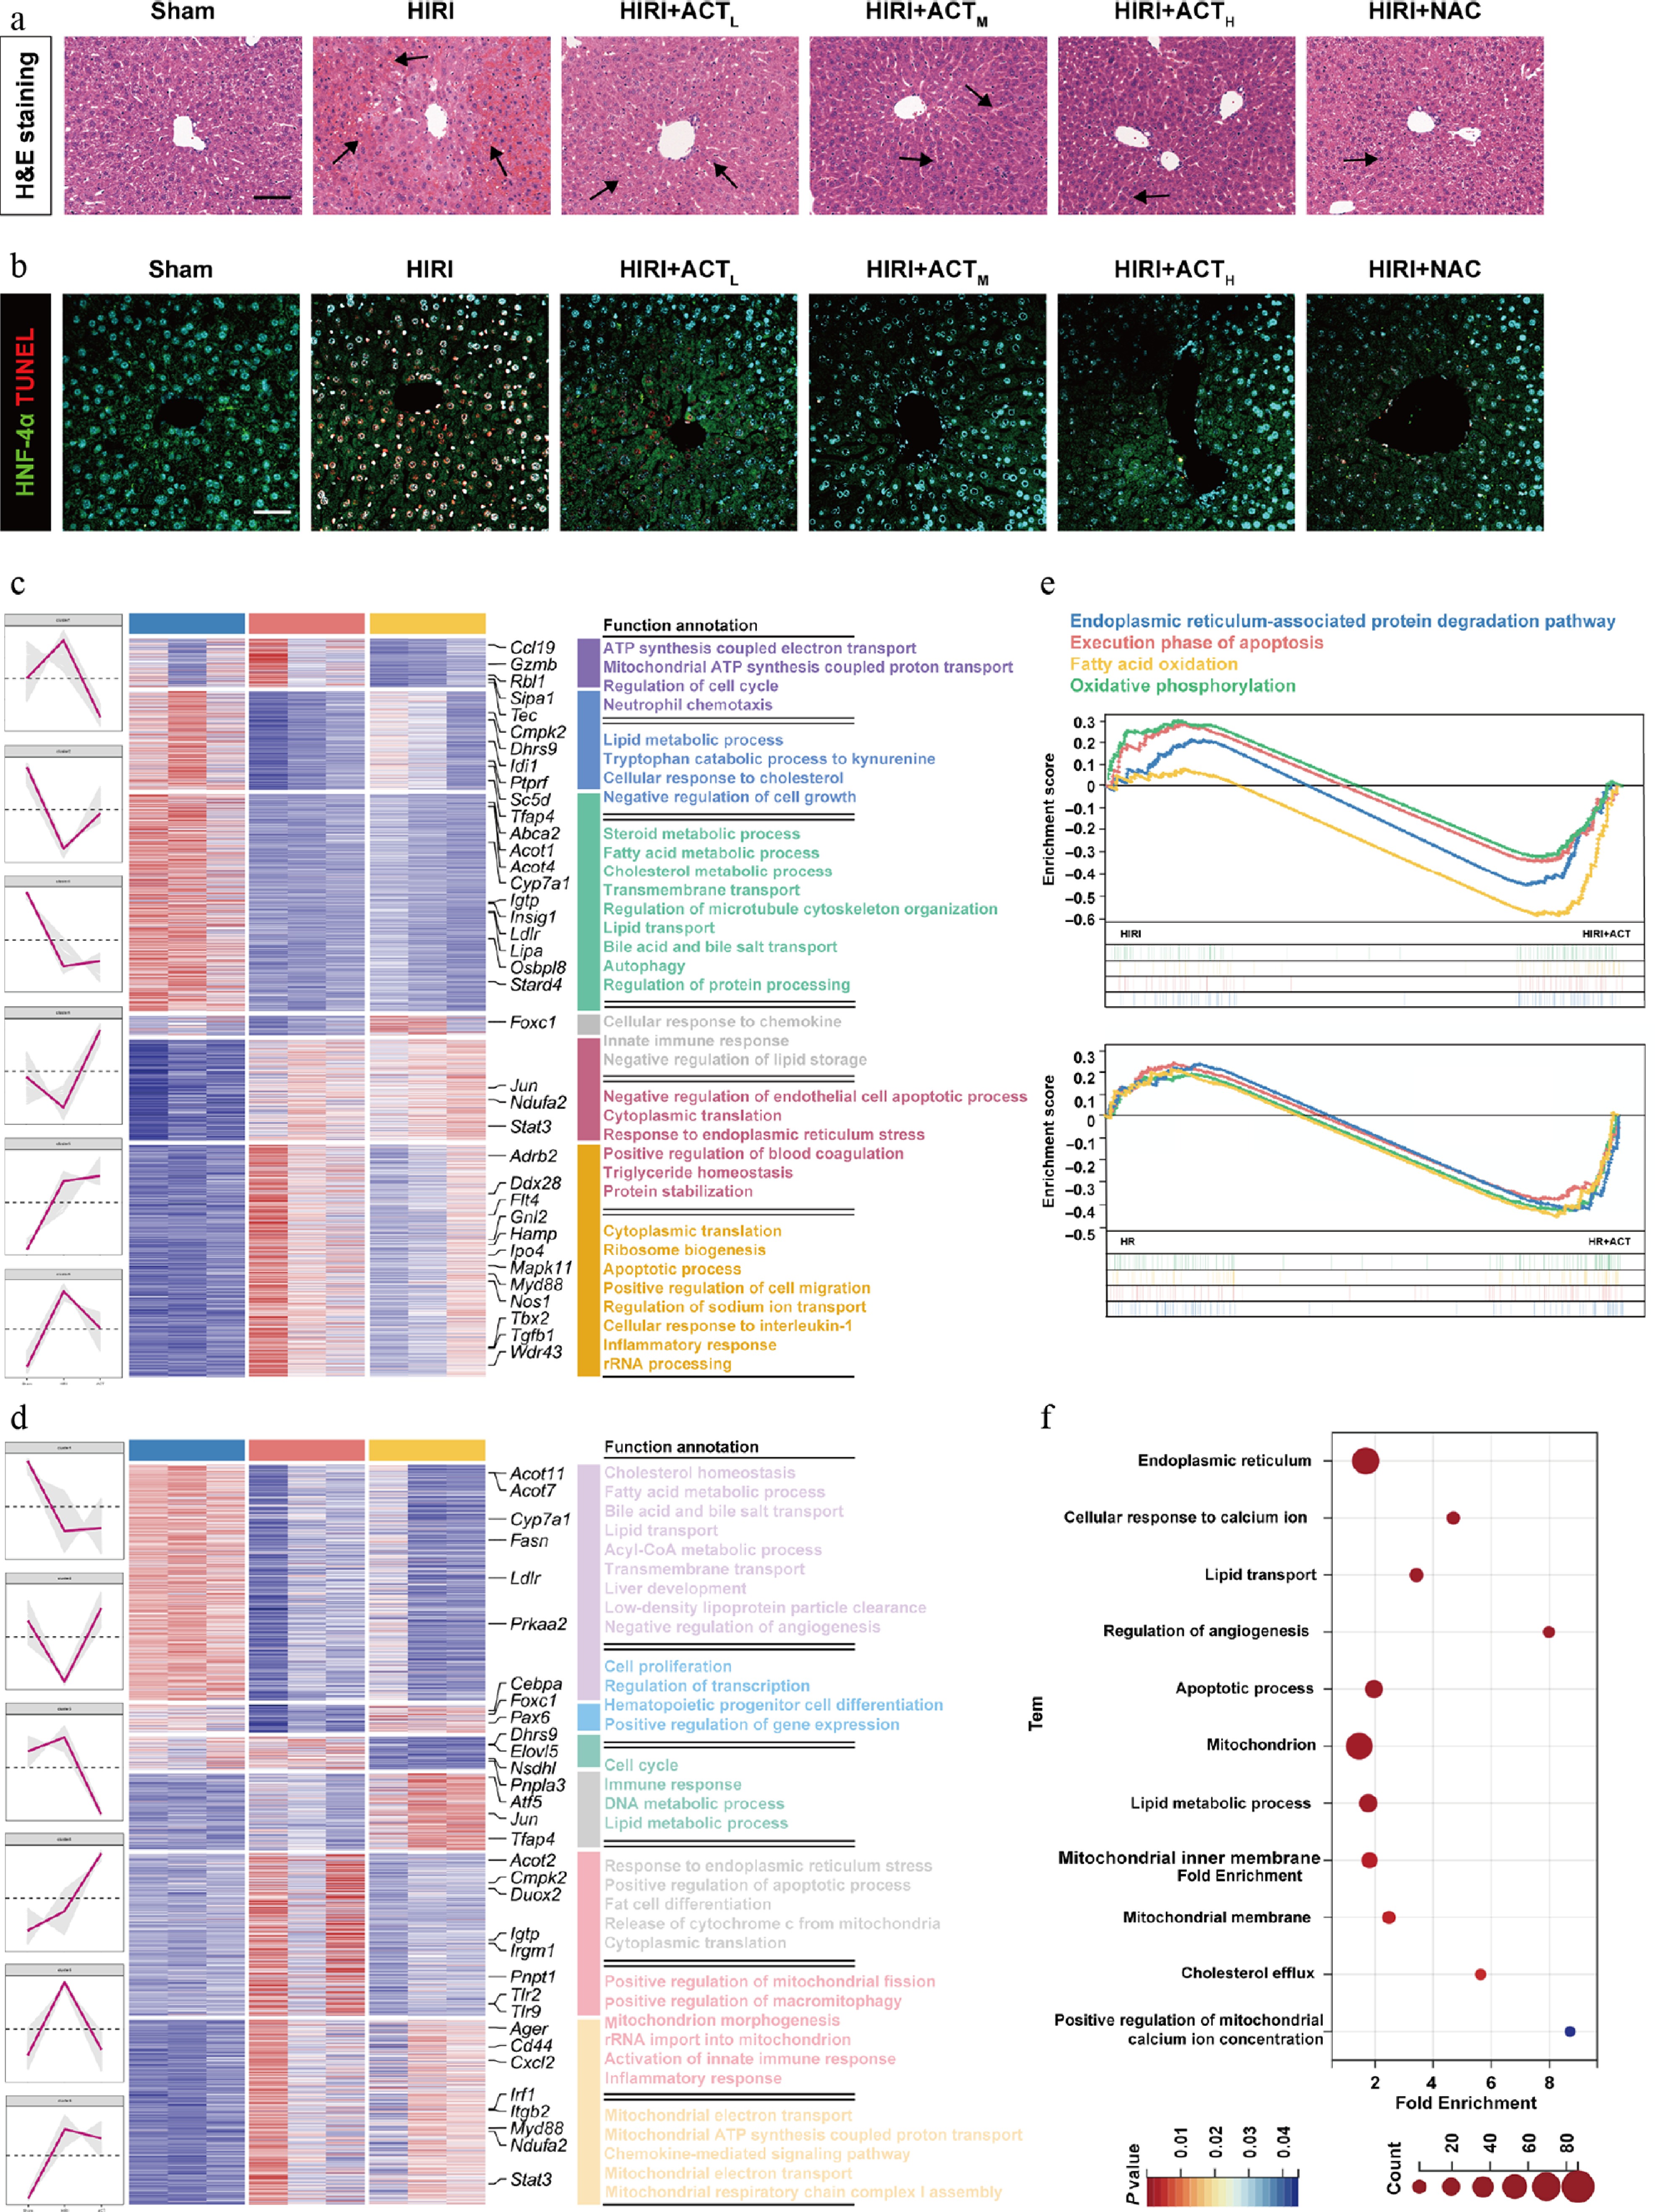
Figure 1.
ACT alleviated liver damage in HIRI mice, and HR-stimulated hepatocytes. (a) Representative images of H&E staining in different groups (arrows indicate regions of liver injury, including inflammatory foci). Scale bar = 100 μm. (b) Representative images of immunohistochemistry staining for HNF-4α and TUNEL in different groups. Scale bar = 100 μm. The heatmap of critical DEGs with red lines indicating different clusters in the (c) whole livers and (d) primary hepatocytes, isolated from different mice groups. (e) GSEA analysis from HIRI and HIRI + ACT groups in mouse livers (upper panel), and primary hepatocytes (below panel). (f) GO enrichment analysis results of the whole liver, and primary hepatocyte DEGs visualized with a bubble diagram.
-
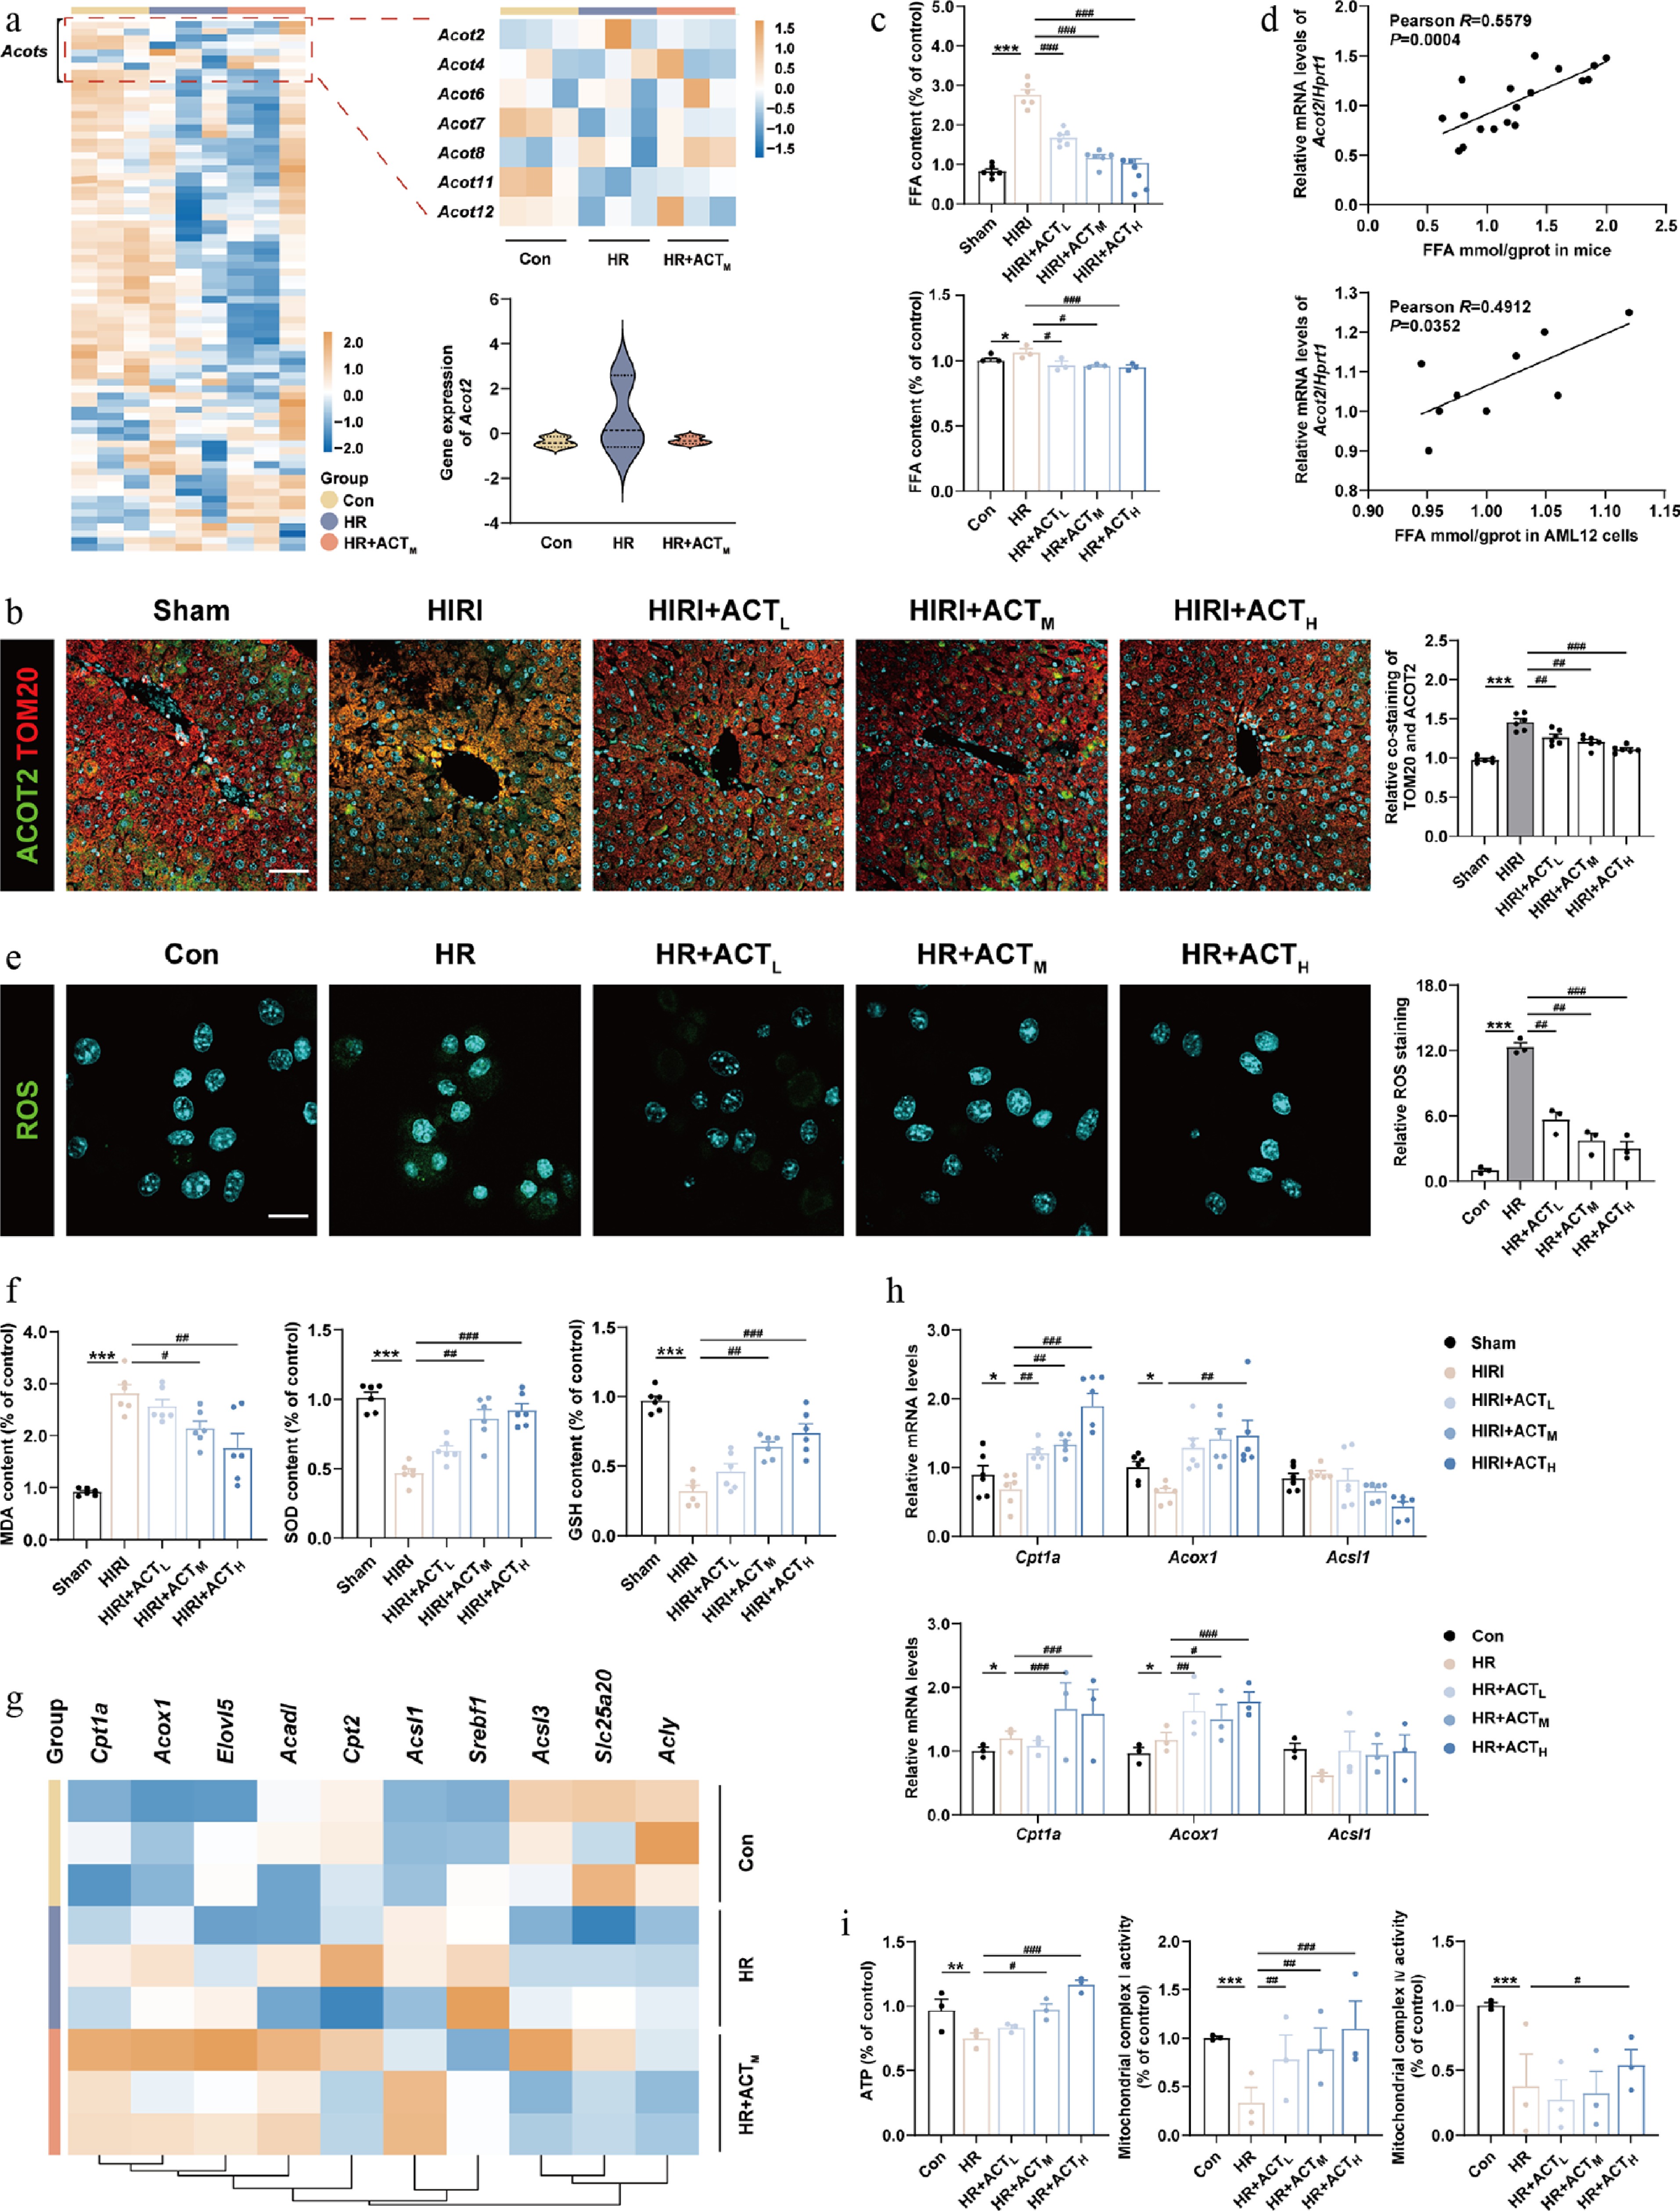
Figure 2.
ACT suppressed ACOT2 expression and subsequently mitochondrial oxidative metabolism disorder. (a) The heatmap of genes involved in mitochondrial metabolism in primary hepatocytes. (b) Representative images of immunofluorescence staining for TOM20 (594 nm), ACOT2 (488 nm), and DAPI (405 nm) in mouse livers. Scale bar = 100 μm. (c) The FFA level and (d) correlation analysis between FFA levels and Acot2 gene expression in mouse livers and AML12 cells. (e) Representative images of immunofluorescence staining for ROS (488 nm) and DAPI (405 nm) in AML12 cells. Scale bar = 20 μm. (f) The level of MDA, SOD, and GSH in mouse livers. (g) The heatmap of genes involved in fatty acid β-oxidation, and Acyl-CoA metabolism in primary hepatocytes. (h) The mRNA levels of Cpt1a, Acox1, and Acsl1 were normalized with Hprt1 in mouse livers and AML12 cells treated with ACT. (i) The level of ATP, and mitochondrial complex Ι and IV activities in AML12 cells. Statistical significance: * P < 0.05, ** P < 0.01, *** P < 0.001, compared with control group; # P < 0.05, ## P < 0.01, ### P < 0.001, compared with the model group (Data are presented as the mean ± SEM, n = 3 for cell experiments, n = 6 for mice experiments).
-
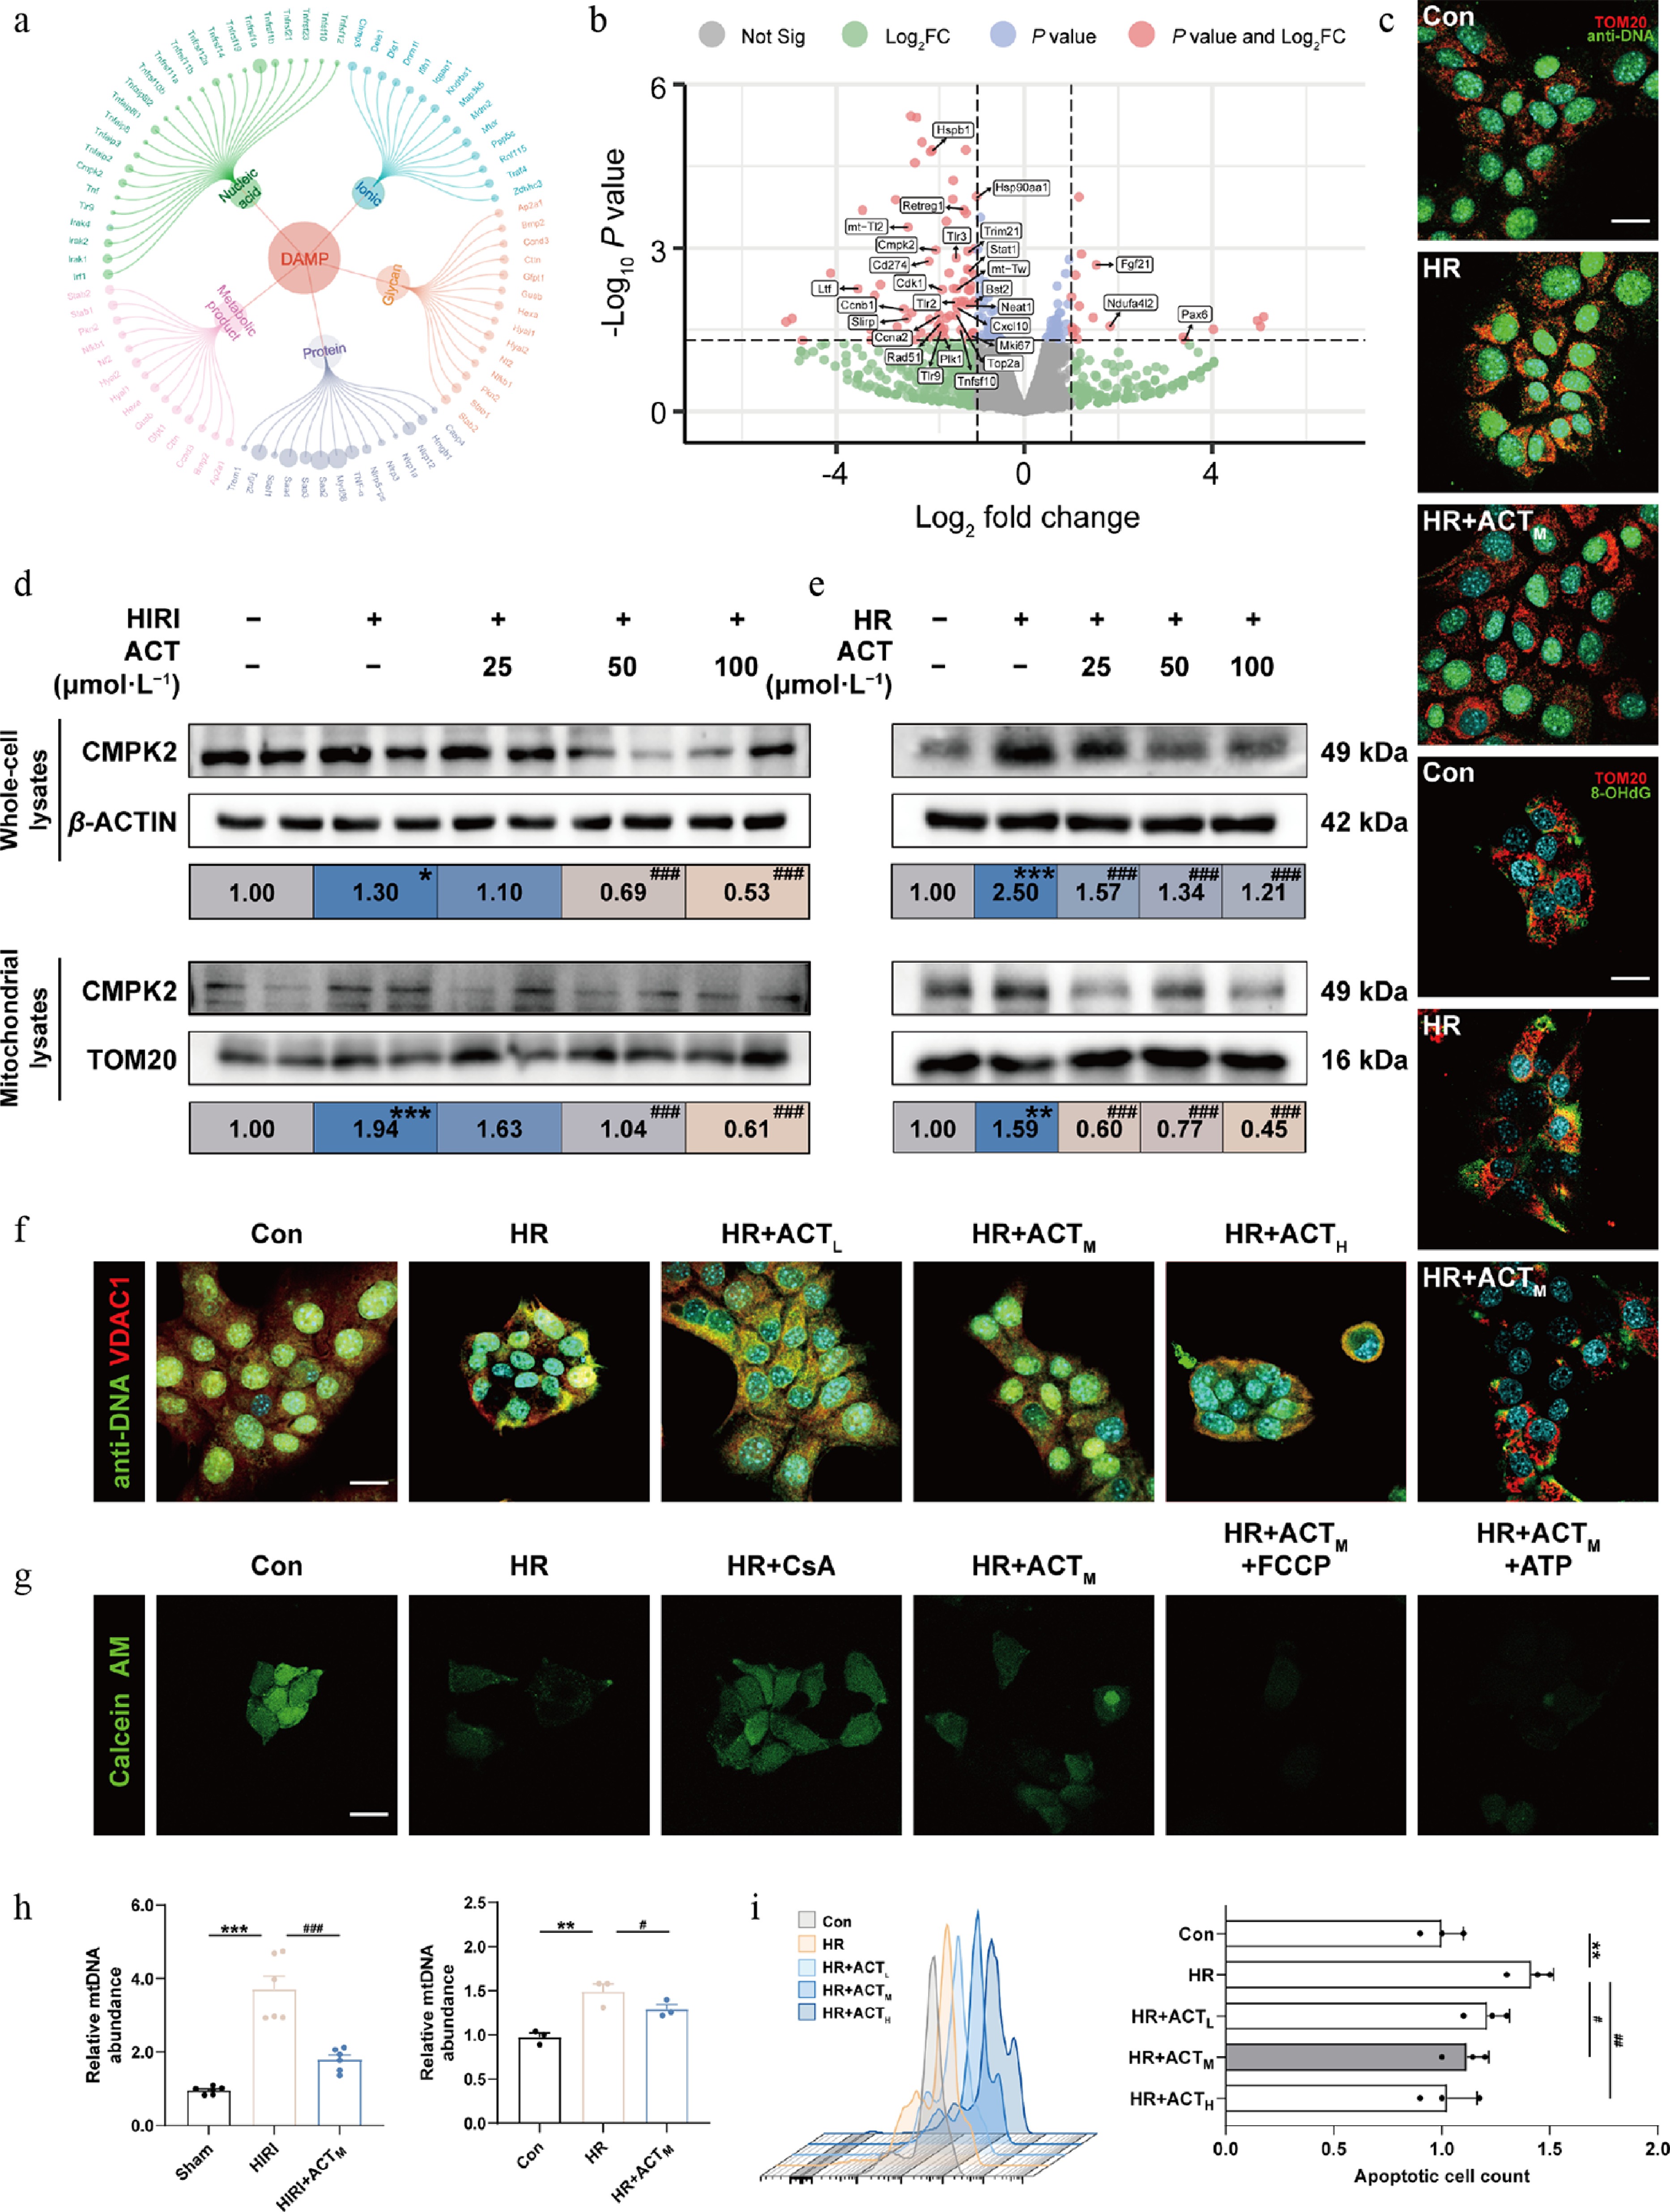
Figure 3.
ACT inhibited the synthesis and release of mtDNA in hypoxic hepatocytes by suppressing CMPK2. (a) Circle network of DAMP molecules. (b) Volcano plots of DEG expression in primary hepatocytes from HIRI, and HIRI + ACT groups. (c) Representative images of immunofluorescence staining for TOM20 (594 nm), anti-DNA (488 nm), 8-OHdG (488 nm), and DAPI (405 nm) in AML12 cells. Scale bar = 20 μm. (d), (e) The protein expression levels of CMPK2 in whole cells and mitochondria of mouse livers and AML12 cells were normalized with β-ACTIN or TOM20. (f) Representative images of immunofluorescence staining for VDAC1 (594 nm), anti-DNA (488 nm), and DAPI (405 nm) in AML12 cells. Scale bar = 20 μm. (g) Representative images of immunofluorescence staining for Calcein AM (488 nm) and in AML12 cells. Scale bar = 20 μm. (h) Left panel, mtDNA level in mouse serum; right panel, mtDNA level in the culture medium of AML12 cells. (i) The flow cytometry results of JC-1 analysis in AML12 cells. Statistical significance: * P < 0.05, ** P < 0.01, *** P < 0.001, compared with control group; # P < 0.05, ## P < 0.01, ### P < 0.001, compared with the model group (Data are presented as the mean ± SEM, n = 3 for cell experiments, n = 6 for mice experiments).
-
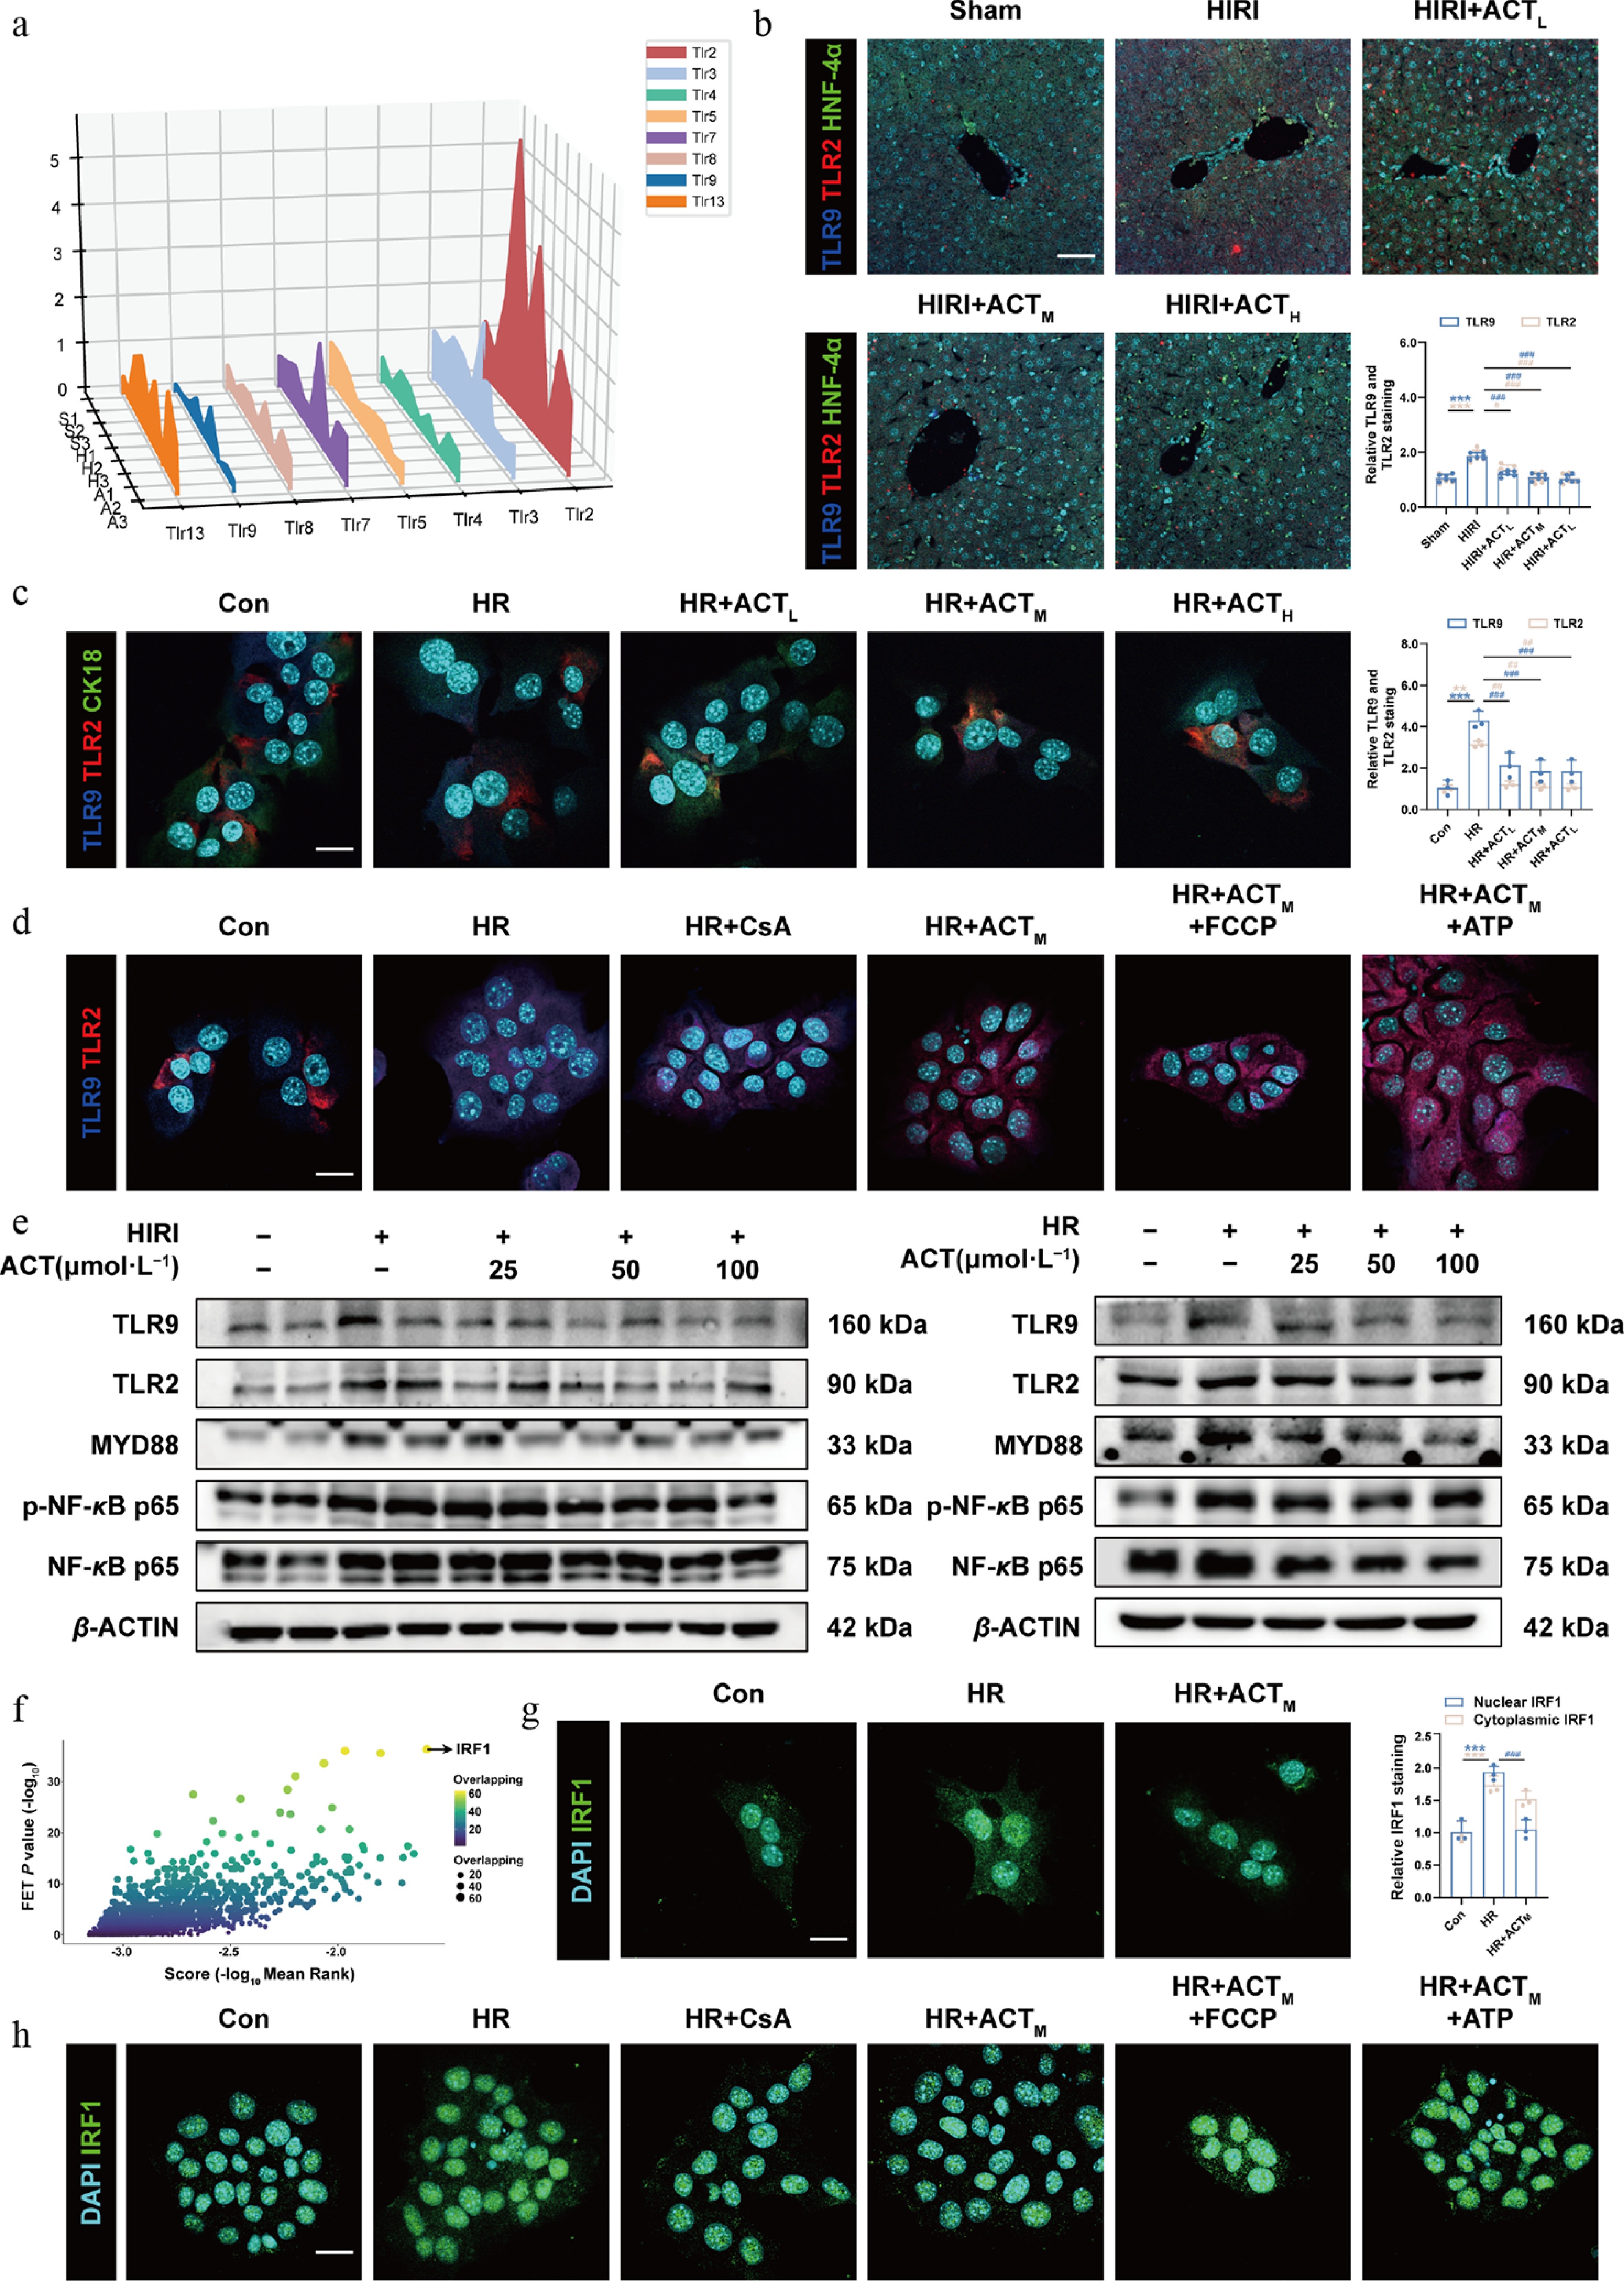
Figure 4.
ACT inhibited the nuclear translocation of IRF1 by regulating the TLR9-MYD88-NF-κB cascade. (a) The three-dimensional graph of gene expression of TLRs in primaryhepatocytes. Representative images of immunofluorescence staining for TLR9 (647 nm), TLR2 (594 nm), HNF-4α (488 nm), CK18 (488 nm), and DAPI (405 nm) in (b) mouse livers, and (c) AML12 cells. Scale bar = 100 and 20 μm, respectively. (d) Representative images of immunofluorescence staining for TLR9 (647 nm), TLR2 (594 nm), and DAPI (405 nm) in AML12 cells. Scale bar = 20 μm. (e) The protein expression of TLR9, TLR2, MYD88, p-NF-κB p65, and NF-κB p65 in the mouse livers and AML12 cells were normalized with β-ACTIN. (f) Screening for transcription factors regulating CMPK2 genes. (g), (h) Representative images of immunofluorescence staining for IRF1 (488 nm), and DAPI (405 nm) in AML12 cells. Scale bar = 20 μm. Statistical significance: *** P < 0.001, compared with control group; # P < 0.05, ## P < 0.01, ### P < 0.001, compared with the model group (Data are presented as the mean ± SEM, n = 3 for cell experiments, n = 6 for mice experiments).
-
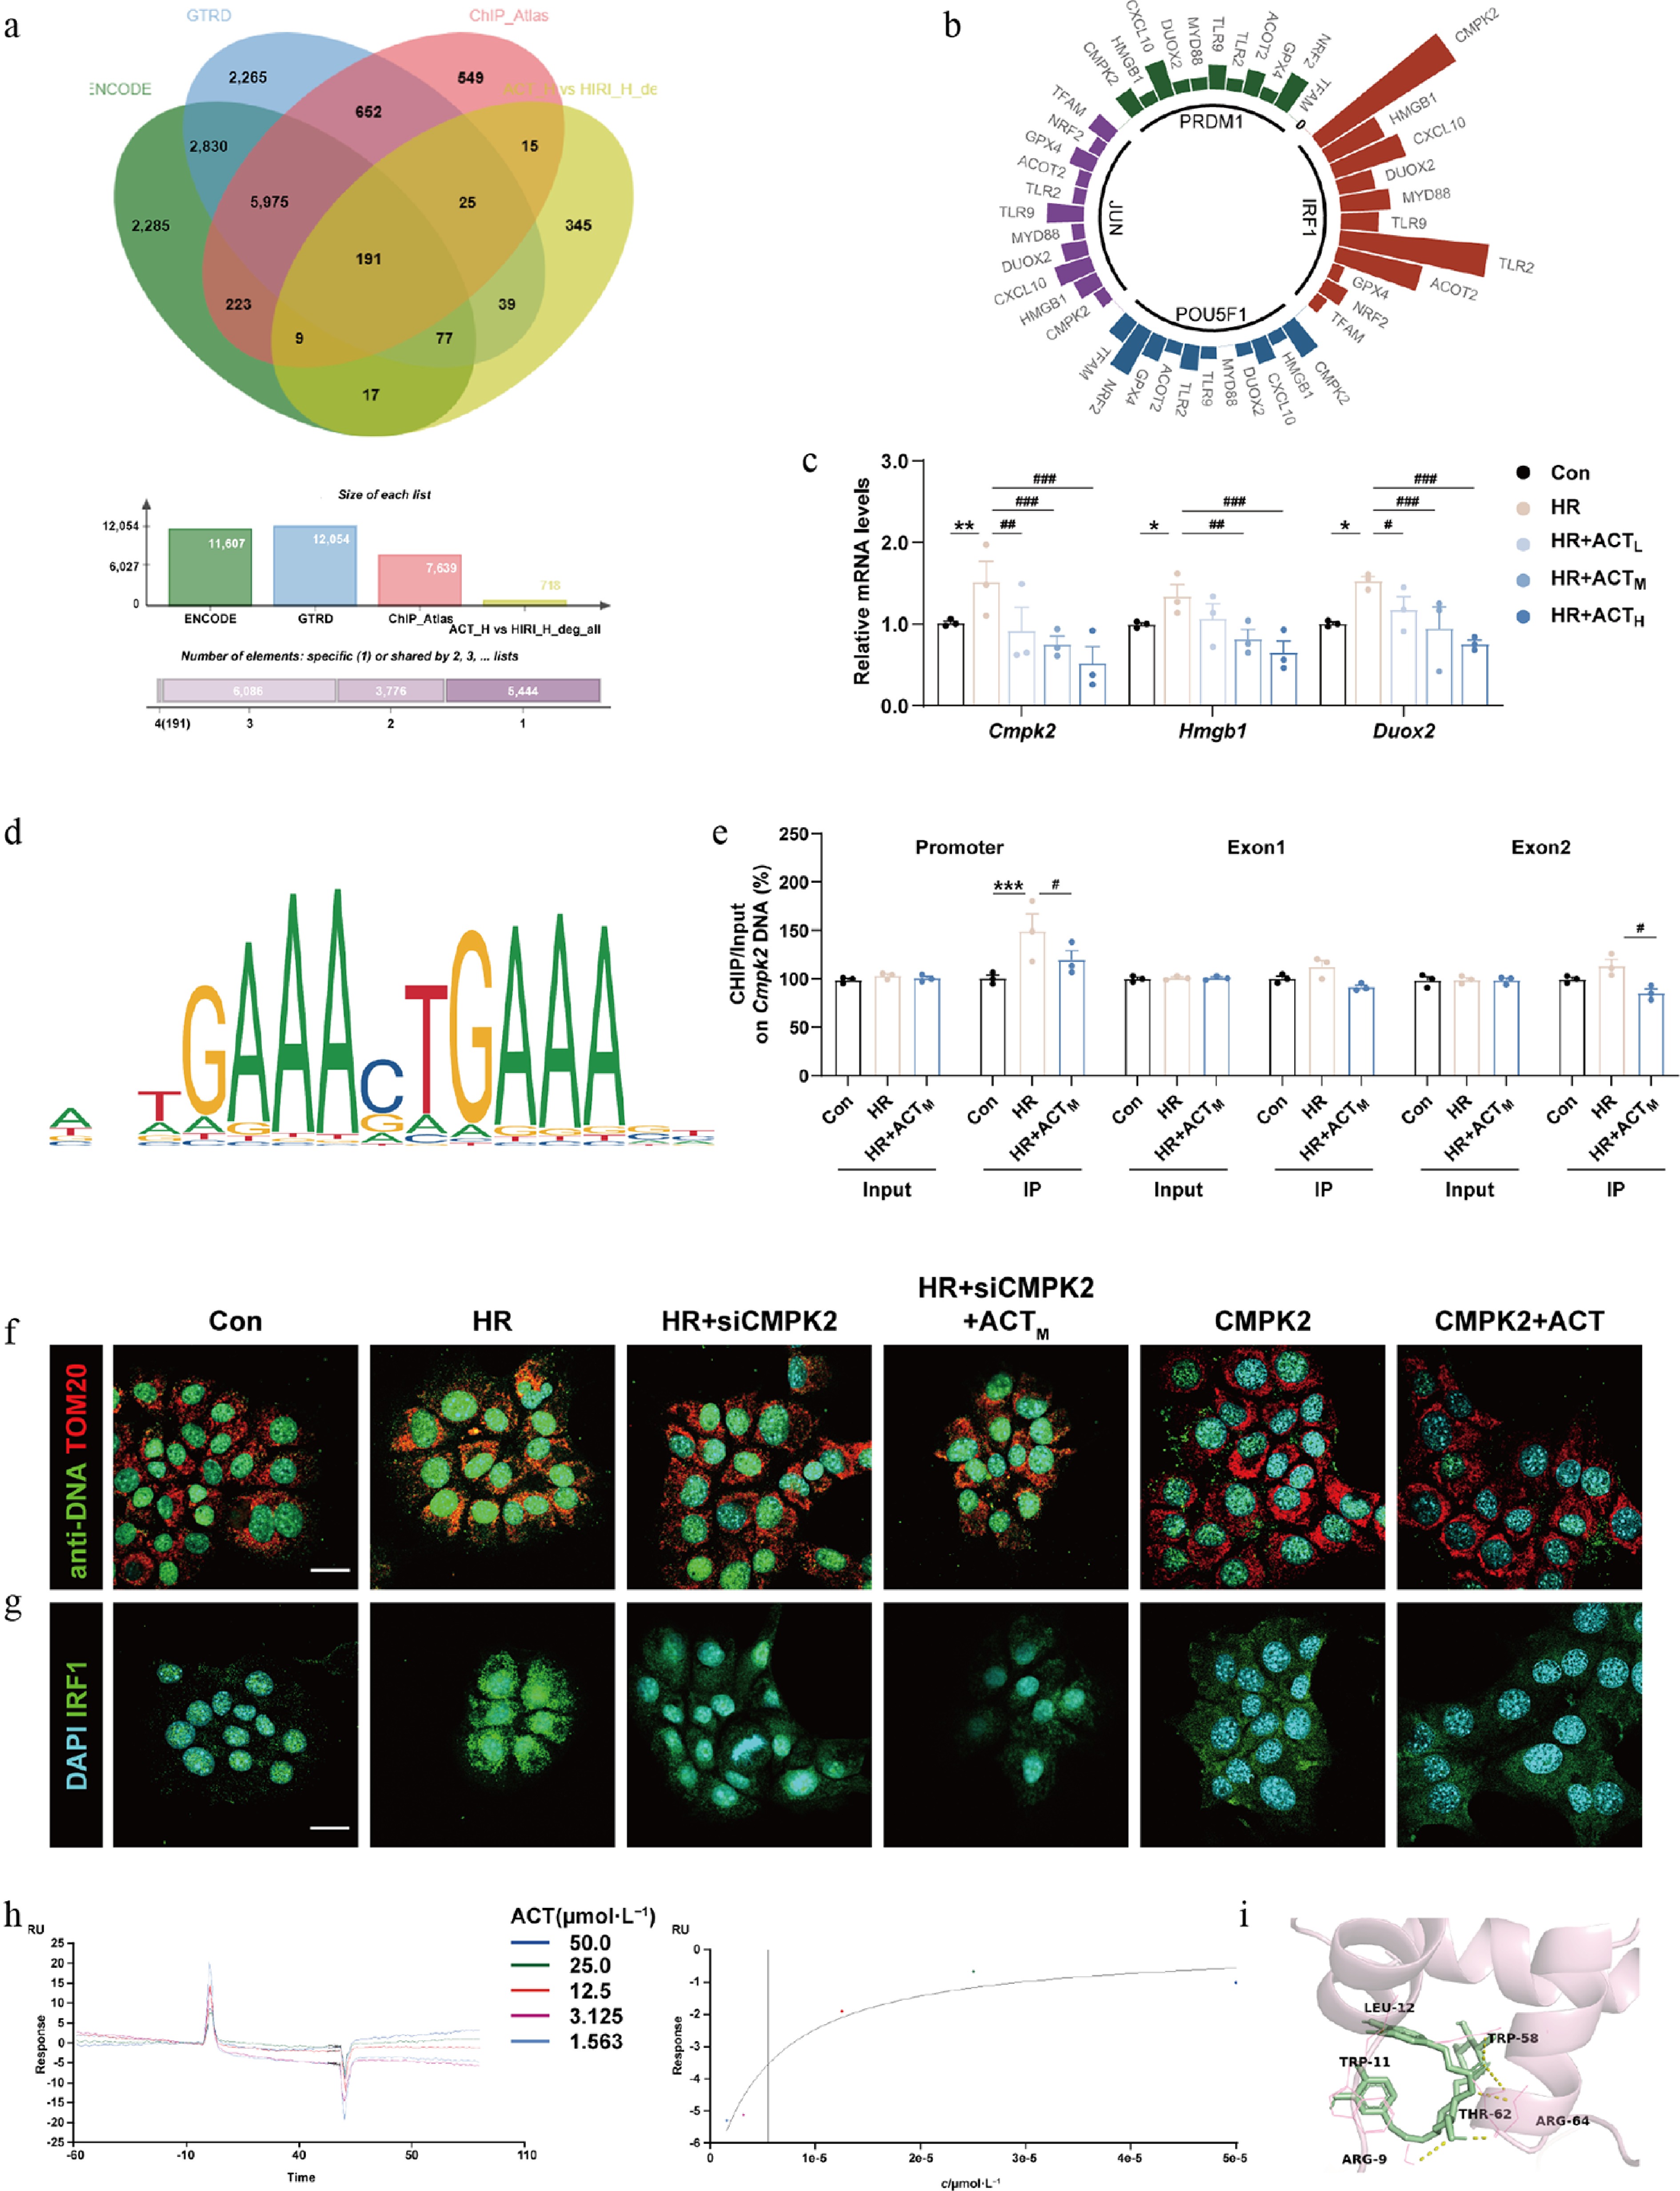
Figure 5.
The inhibition of CMPK2 and ACT administration synergetically reduced the mtDNA synthesis and nuclear translocation of IRF1. (a) The vein diagram of potential IRF1 downstream targets in primary hepatocytes. (b) Prediction analysis of major potential transcription factors. (c) The mRNA levels of Cmpk2, Hmgb1, and Duox2 were normalized with Hprt1 in AML12 cells. (d) The predicted transcription sequence of CMPK2. (e) The IRF1 binding sites on the Cmpk2 promoter and exons were measured by ChIP analysis. Representative images of immunofluorescence staining for (f) TOM20 (594 nm), anti-DNA (488 nm), (g) IRF1 (488 nm), and DAPI (405 nm) in AML12 cells treated with ACT, siCMPK2, or a recombinant CMPK2 protein. Scale bar = 20 μm. (h) The SPR result of ACT binding to IRF1. (i) Molecular docking result of ACT and IRF1. Statistical significance: * P < 0.05, ** P < 0.01, *** P < 0.001, compared with control group; # P < 0.05, ## P < 0.01, ### P < 0.001, compared with the model group (Data are presented as the mean ± SEM, n = 3).
-
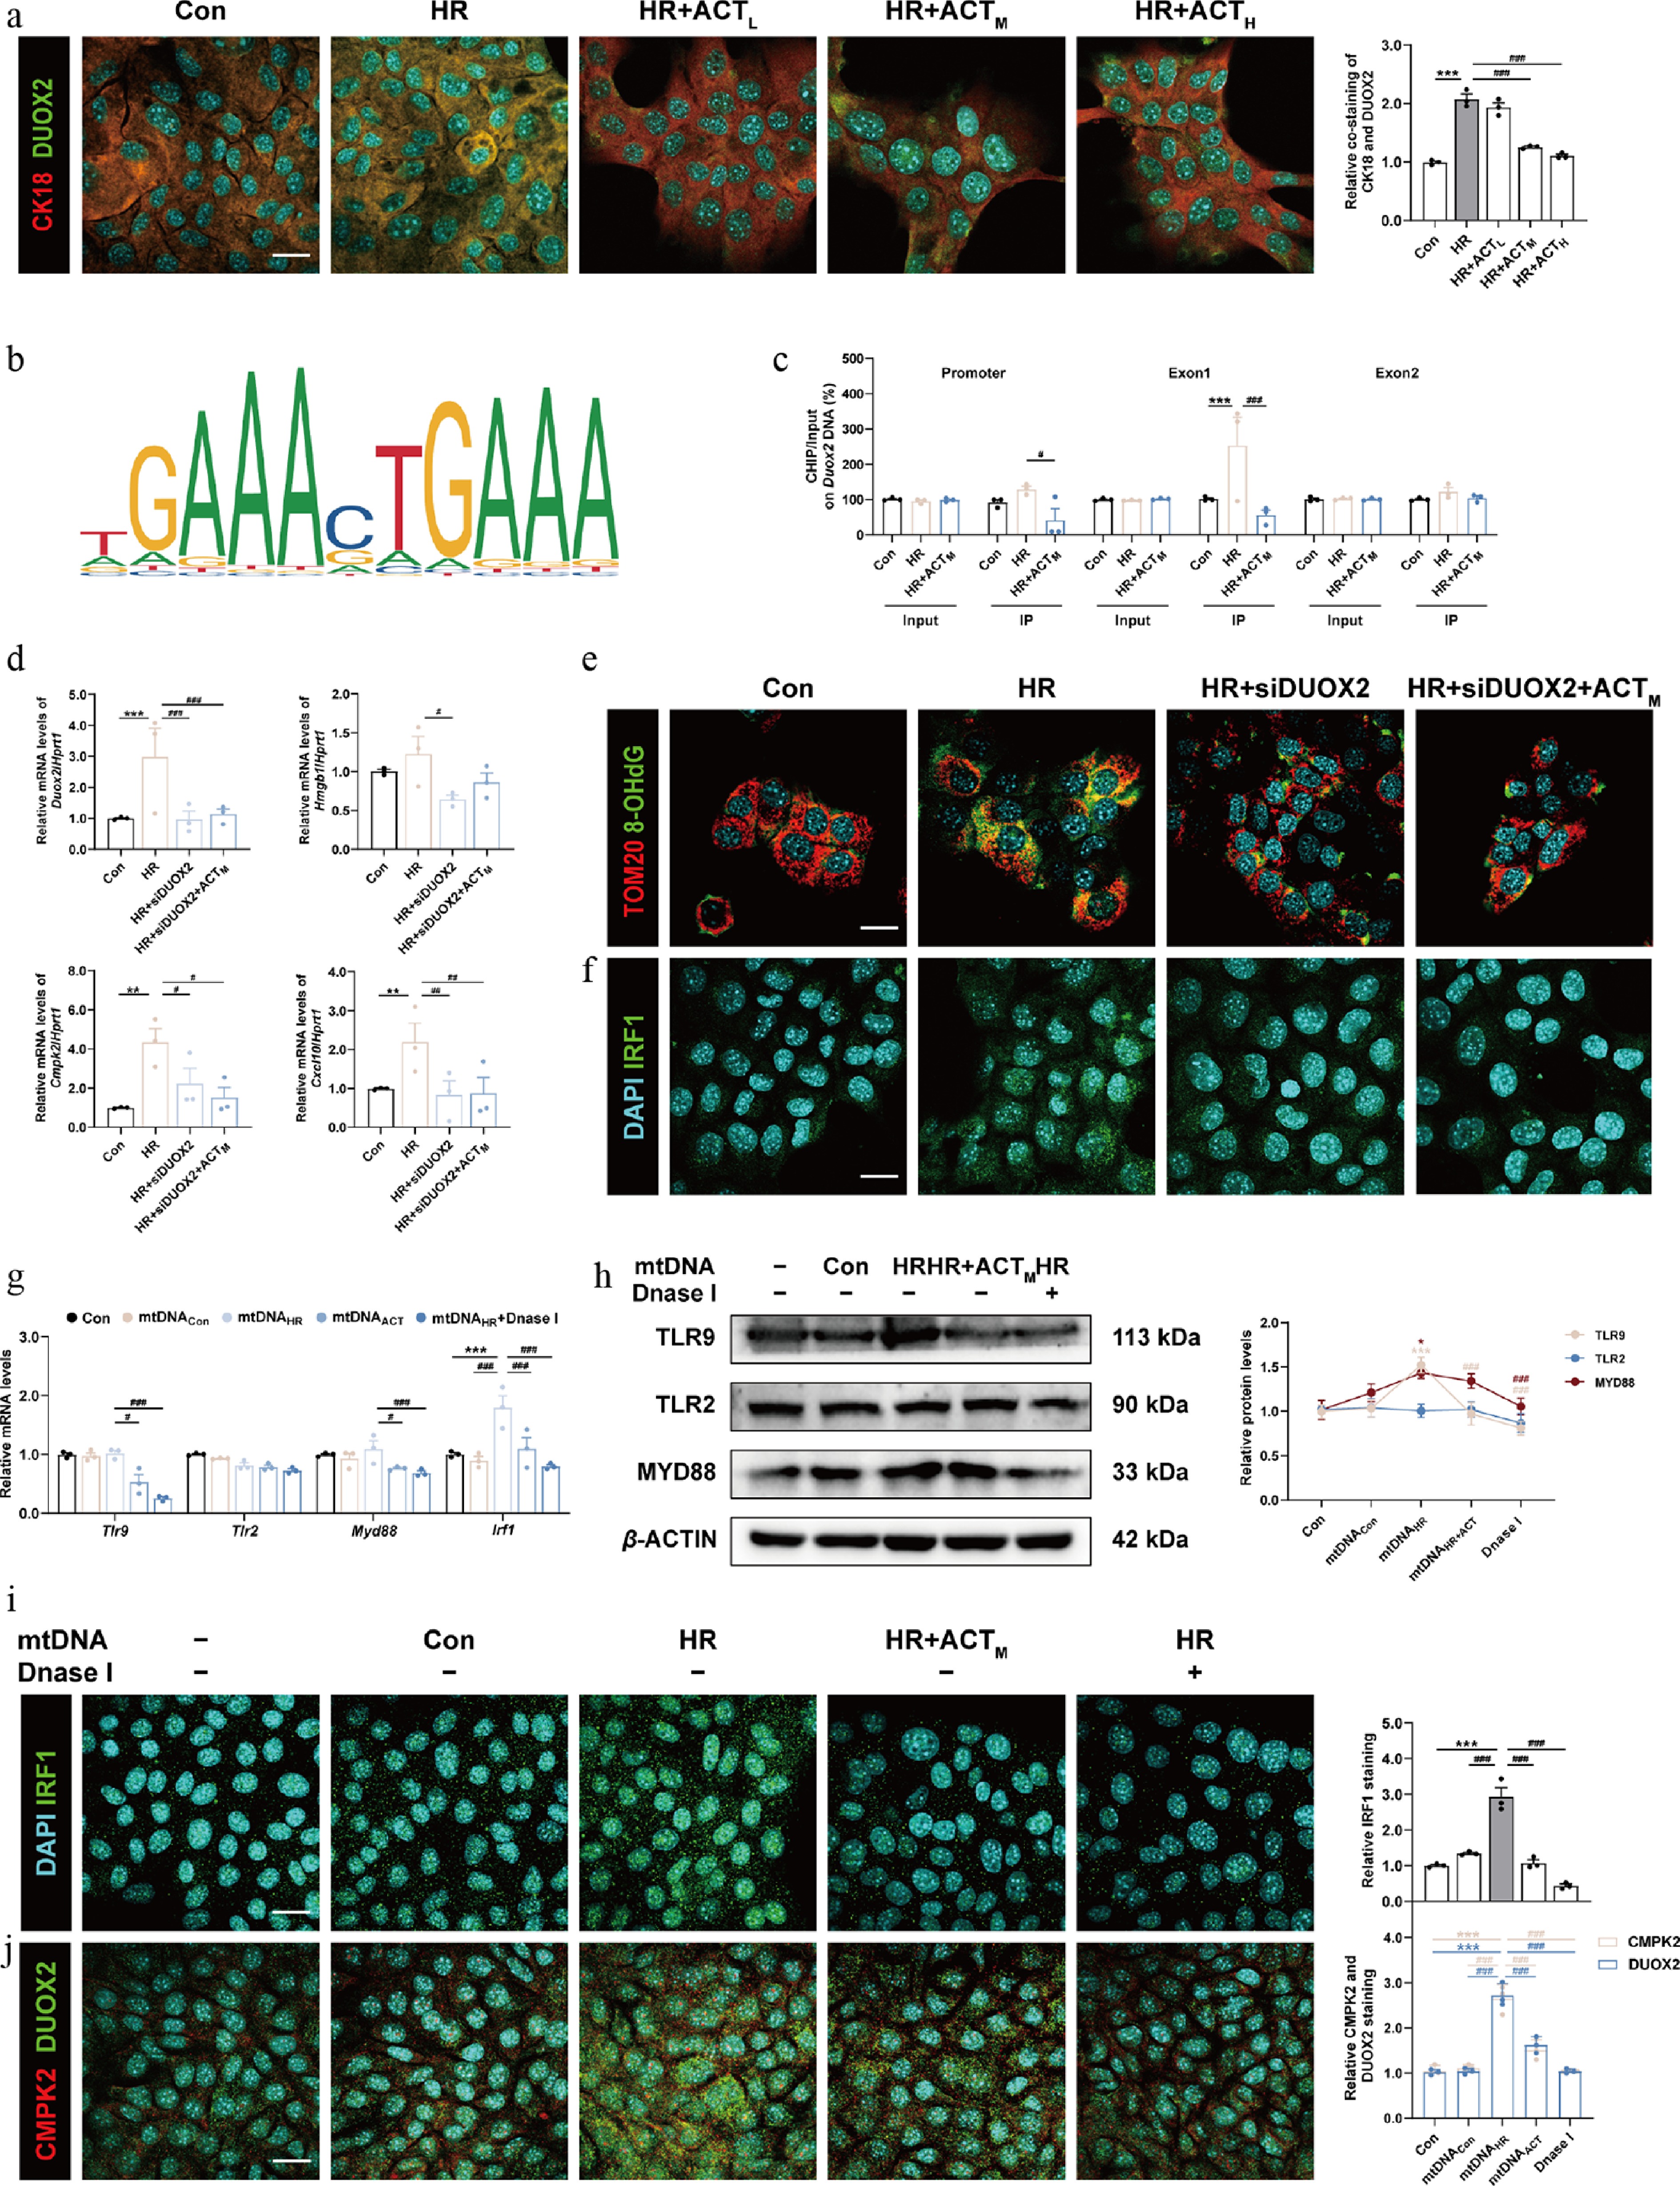
Figure 6.
The inhibition of DUOX2 and ACT administration complementarily reduced the generation and oxidation of mtDNA, which was crucial for the activation of the TLRs-IRF1 pathway. (a) Representative images of immunofluorescence staining for CK18 (594 nm), DUOX2 (488 nm), and DAPI (405 nm) in AML12 cells. Scale bar = 20 μm. (b) The predicted transcription sequence of Duox2. (c) The IRF1 binding sites on the Duox2 promoter and exons were measured by ChIP analysis. (d) The mRNA levels of Duox2, Hmgb1, Cmpk2, and Cxcl10 were normalized with Hprt1 in AML12 cells. Representative images of immunofluorescence staining for (e) TOM20 (594 nm) and 8-OHdG (488 nm), (f) IRF1 (488 nm) and DAPI (405 nm), in AML12 cells treated with siDuox2 and ACT. Scale bar = 20 μm. (g) The mRNA levels of Tlr9, Tlr2, Myd88, and Irf1 were normalized with Hprt1 in AML12 cells transfected with purified mtDNA isolated from different groups. (h) The protein expression of TLR9, TLR2, and MYD88 in AML12 cells were normalized with β-ACTIN. Representative images of immunofluorescence staining for (i) IRF1 (488 nm), (j) CMPK2 (594 nm), DUOX2 (488 nm), and DAPI (405 nm) in AML12 cells. Scale bar = 20 μm. Statistical significance: * P < 0.05, ** P < 0.01, *** P < 0.001, compared with control group; # P < 0.05, ## P < 0.01, ### P < 0.001, compared with the HR or mtDNAHR group (Dataare presented as the mean ± SEM, n = 3).
-
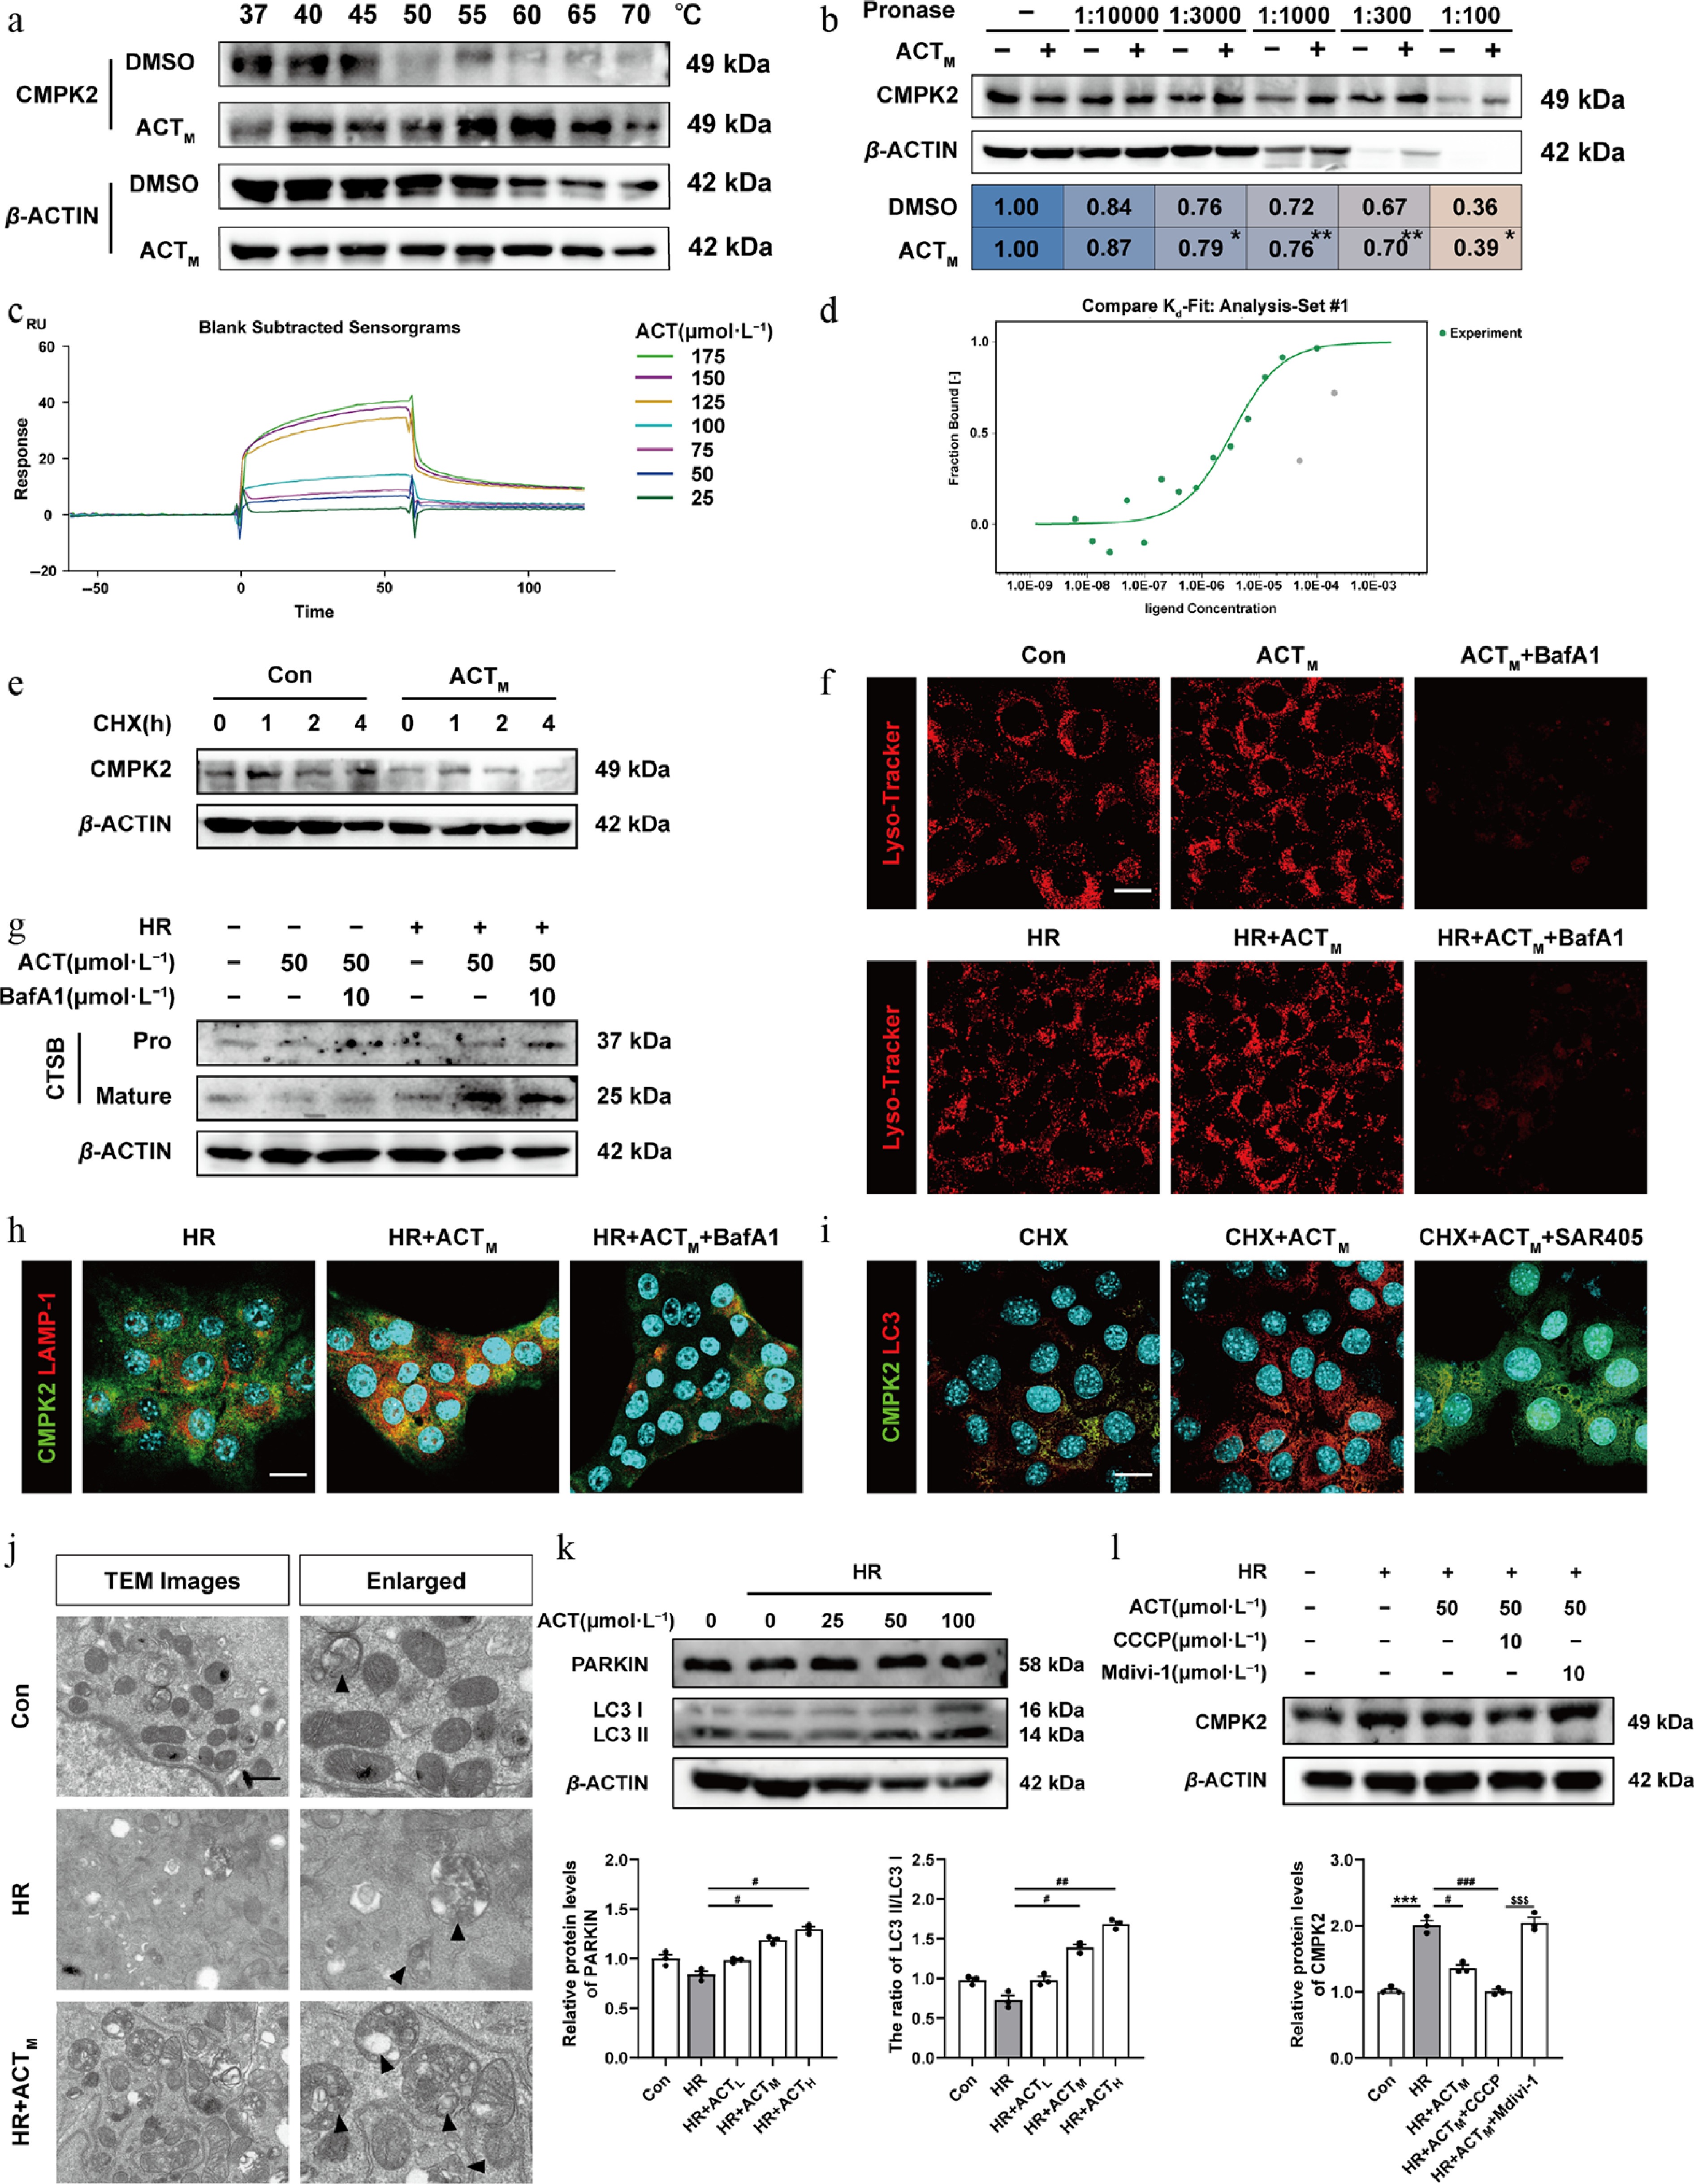
Figure 7.
ACT directly combined to, and induced the degradation of CMPK2 via activating mitophagy. The (a) CETSA, and (b) DARTS assay. The (c) SPR result, and (d) MST analysis of ACT binding to CMPK2. (e) The protein expression of CMPK2 in the CHX chase assay of AML12 cells was normalized with β-ACTIN. (f) Representative images of immunofluorescence staining for Lyso-Tracker (594 nm), and DAPI (405 nm) in AML12 cells. Scale bar = 20 μm. (g) The protein expressions of pro-and mature-CTSB in AML12 cells were normalized with β-ACTIN. (h), (i) Representative images of immunofluorescence staining for CMPK2 (488 nm), LAMP-1 (594 nm), LC3 (594 nm), and DAPI (405 nm) in AML12 cells. Scale bar = 20 μm. (j) Representative TEM images of mitochondria in AML12 cells. Scale bar = 20 μm. The protein expressions of (k) PARKIN, LC3-I, LC3-II, and (l) CMPK2 in AML12 cells were normalized with β-ACTIN. Statistical significance: * P < 0.05, ** P < 0.01, *** P < 0.001, compared with relative control groups; # P < 0.05, ## P < 0.01, ### P < 0.001, compared with the HR group;
$^{{\$}{\$}{\$}} $ -
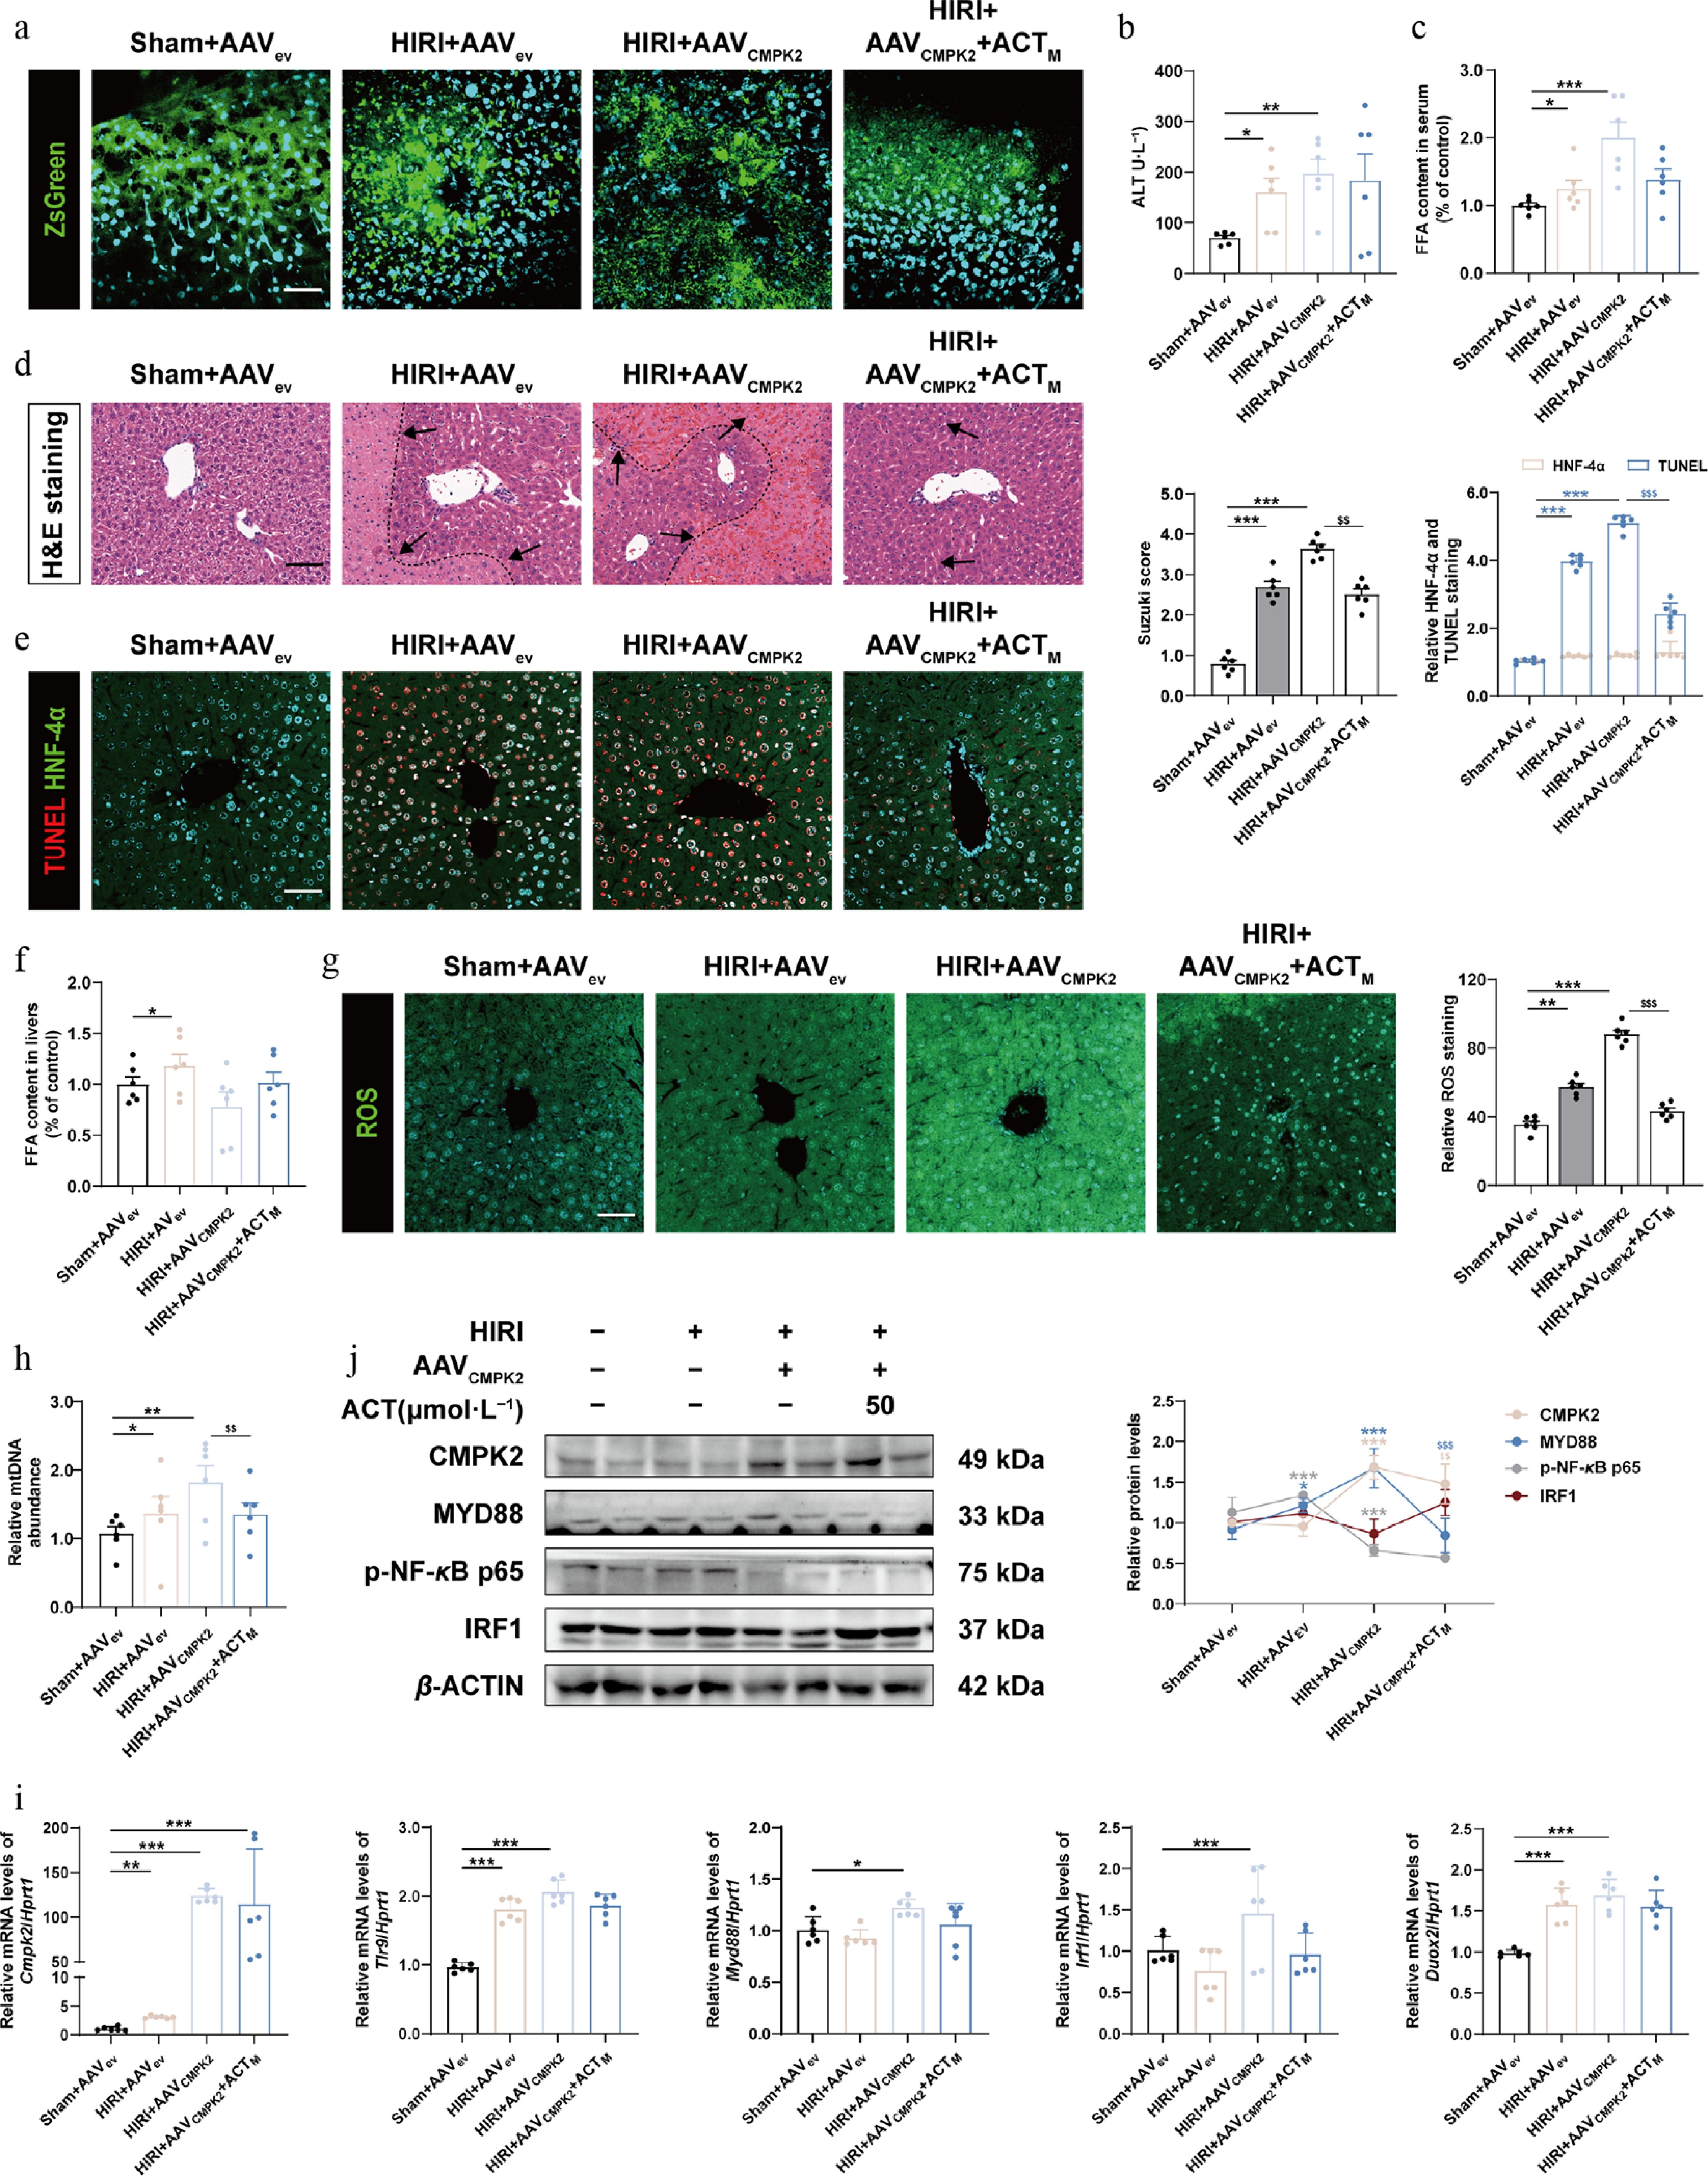
Figure 8.
Hepatocyte specific overexpression of CMPK2 largely blocked the anti-HIRI effects of ACT on mouse livers. (a) Representative images of immunofluorescence staining for ZsGreen (488 nm) and DAPI (405 nm) in mouse livers. Scale bar = 100 μm. The serum level of (b) ALT and (c) FFA in different groups of mice. (d) Representative images of H&E staining were quantified using Image J software. Scale bar = 100 μm. (e) Representative images of immunofluorescence staining for TUNEL (594 nm), HNF-4α (488 nm), and DAPI (405 nm) in mouse livers. Scale bar = 100 μm. (f) The level of FFA in different groups of mouse livers. (g) Representative images of immunofluorescence staining for ROS (488 nm) and DAPI (405 nm) in mouse livers. Scale bar = 100 μm. (h) The serum level of mtDNA in different groups. (i) The mRNA levels of Cmpk2, Tlr9, Myd88, Irf1, and Duox2 were normalized with Hprt1 in mouse livers. (j) The protein expression of CMPK2, MYD88, p-NF-κB, and IRF1 in the mouse livers were normalized with β-ACTIN. Statistical significance: * P < 0.05, ** P < 0.01, *** P < 0.001, compared with Sham + AAVev groups;
$^{{\$}{\$}} $ $^{{\$}{\$}{\$}} $
Figures
(8)
Tables
(0)