-
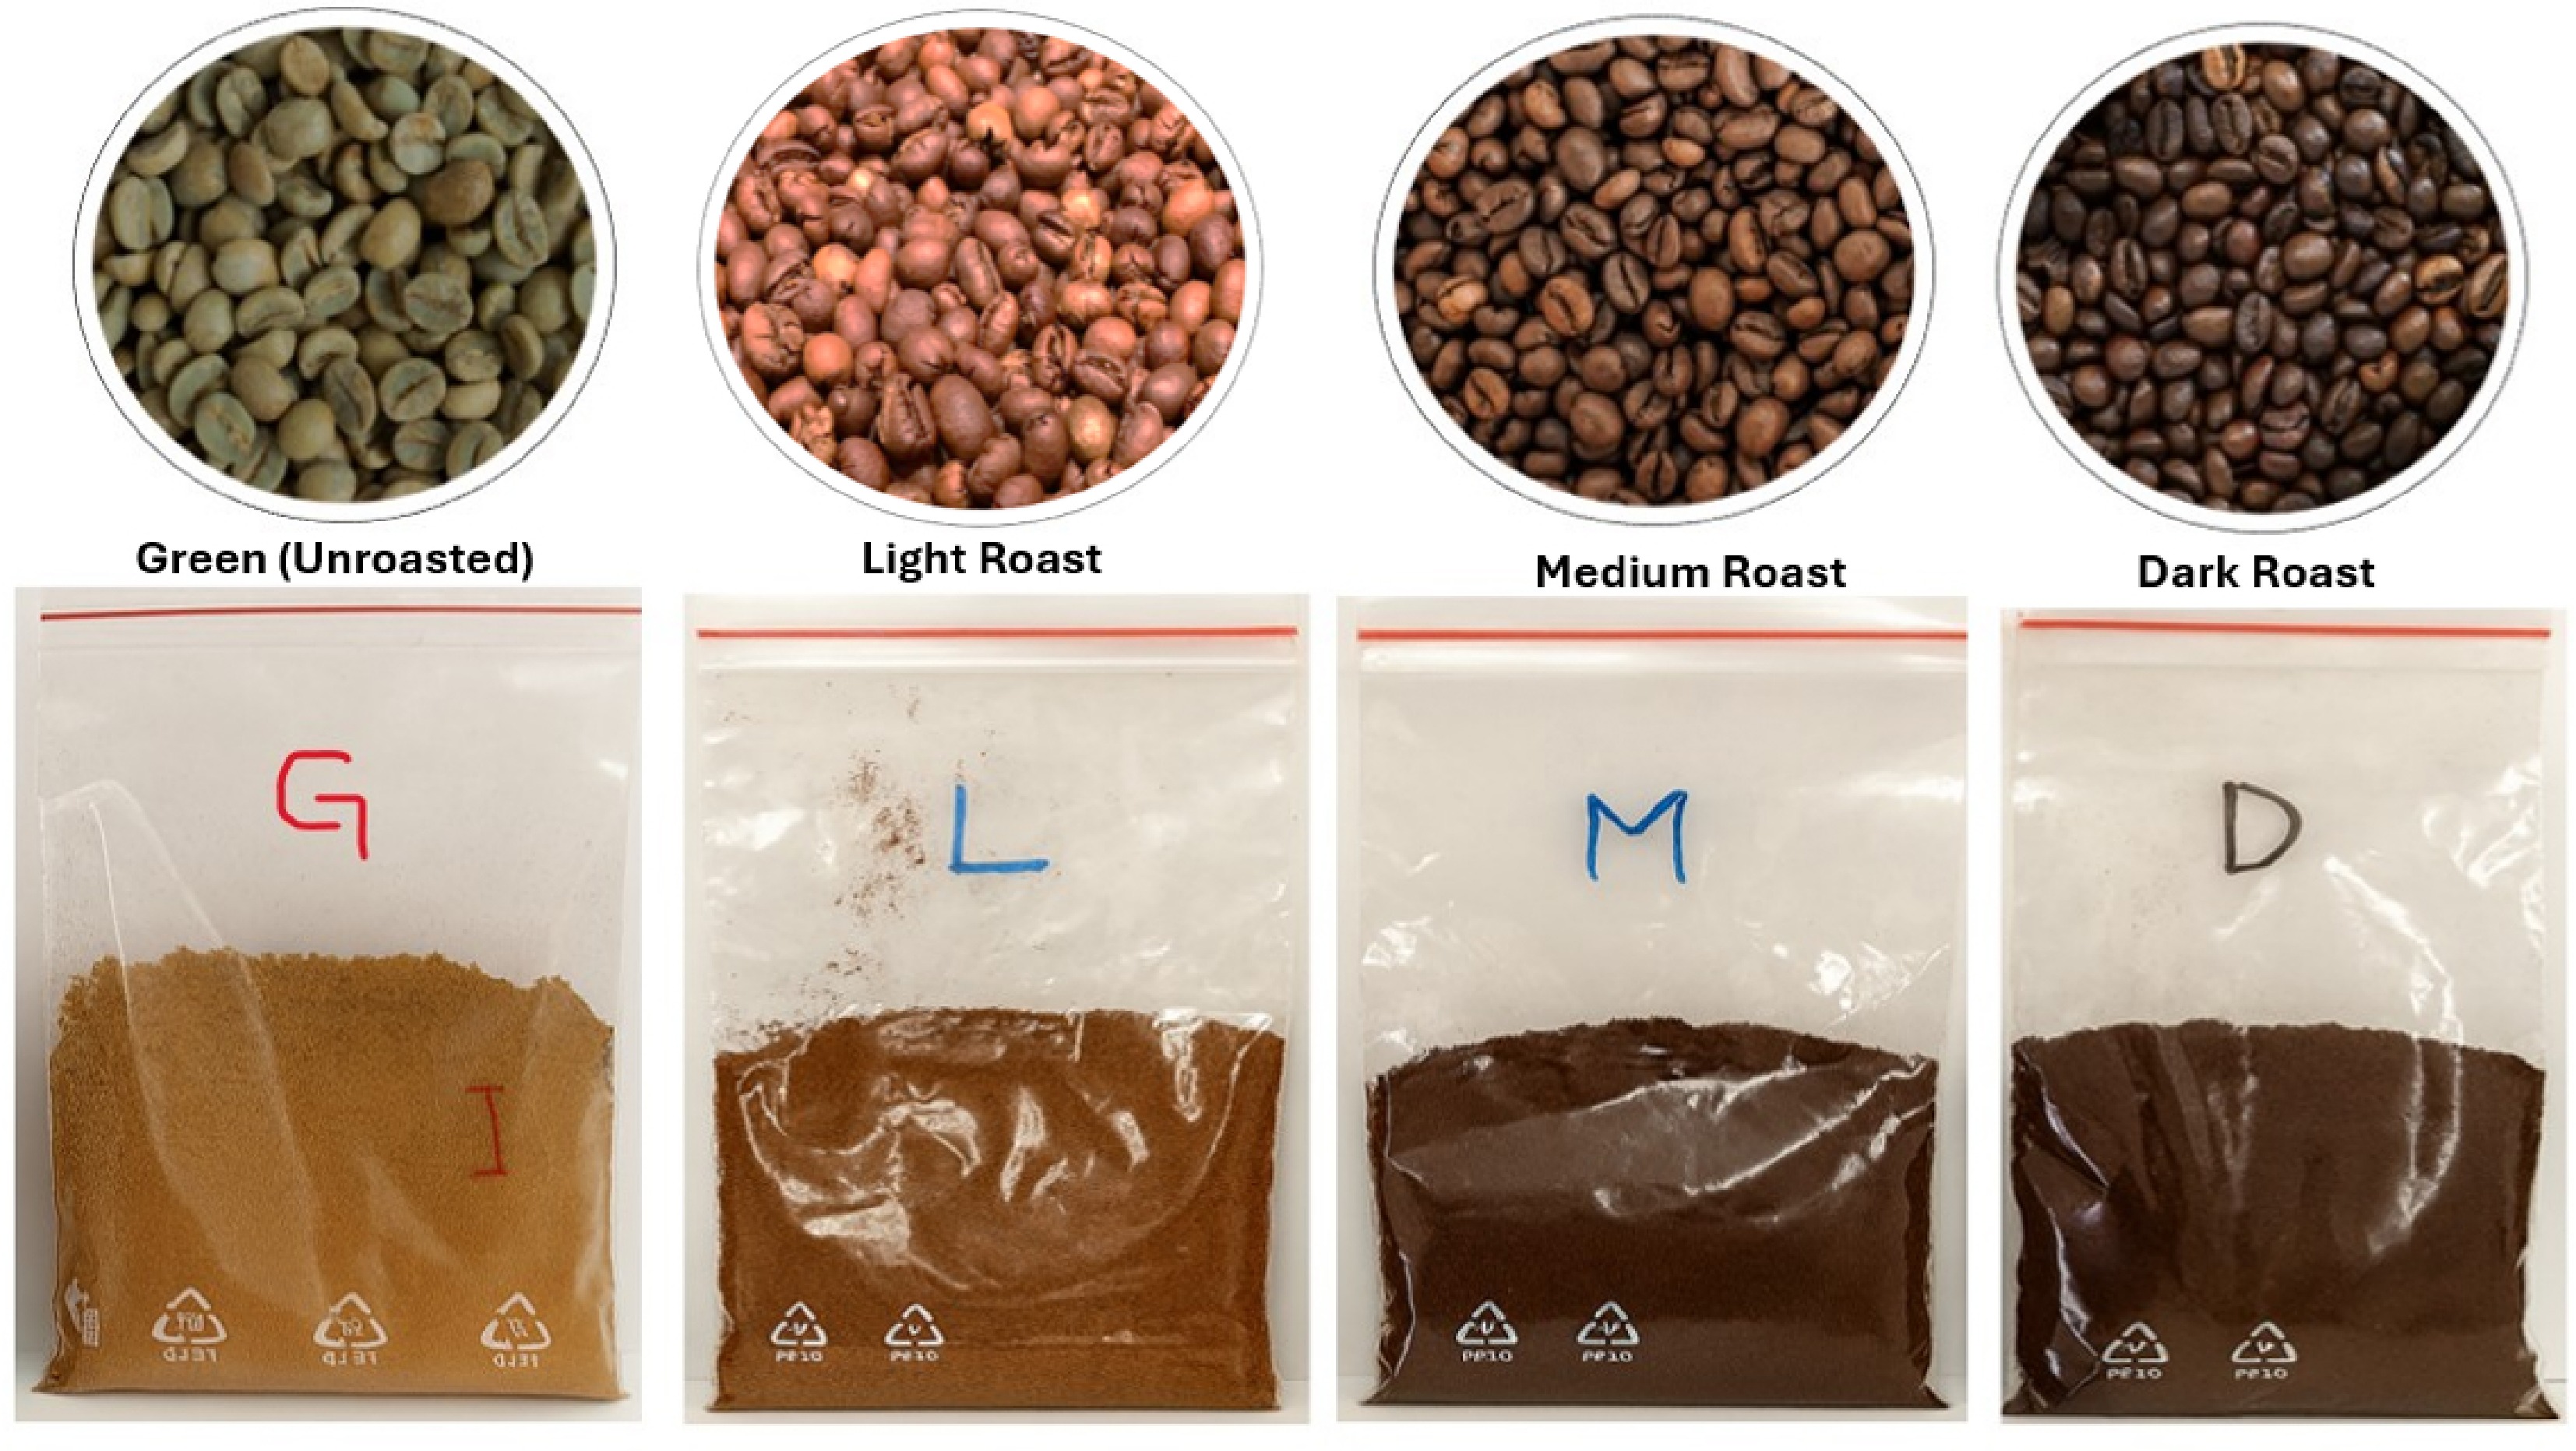
Figure 1.
Green and roasted Robusta coffee samples: whole beans and ground (image by Emmanuel Duah Osei).
-
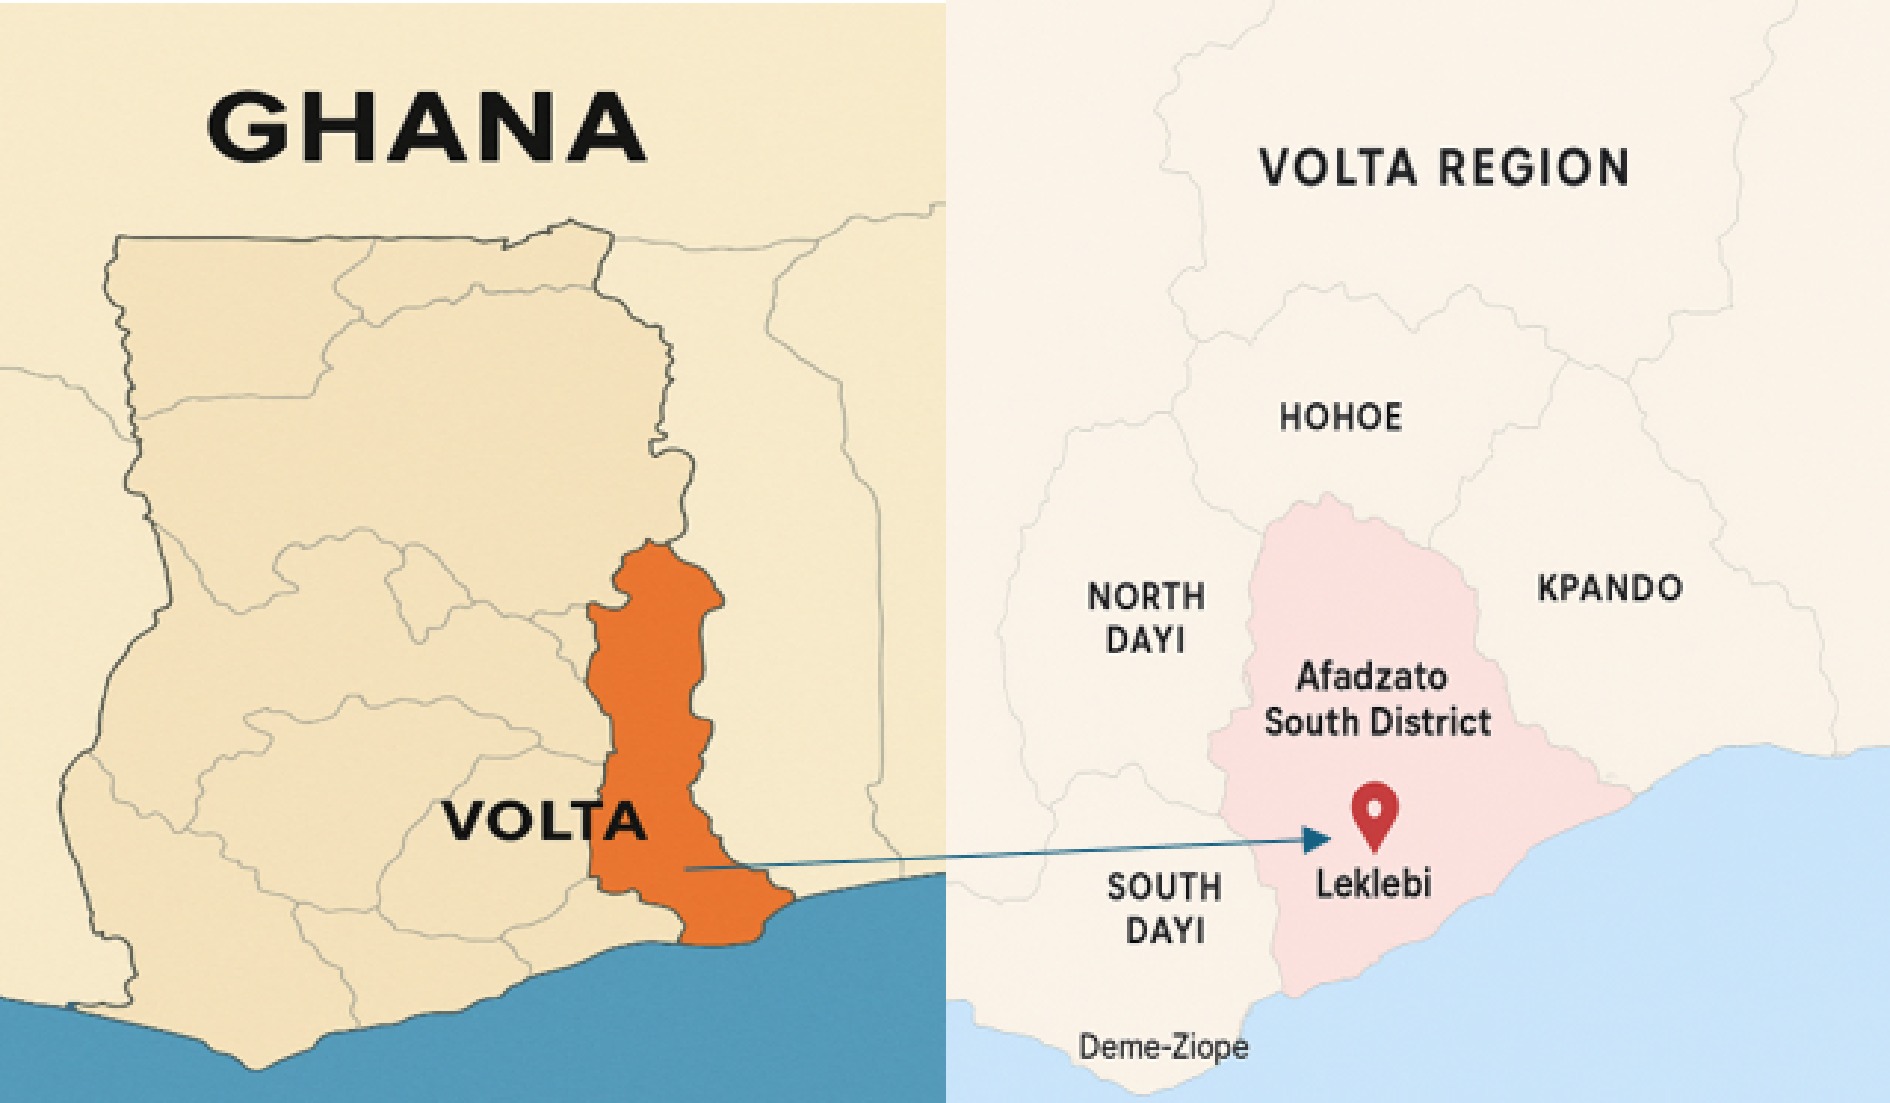
Figure 2.
Map showing the cultivation and processing location of the coffee (image by Emmanuel Duah Osei).
-
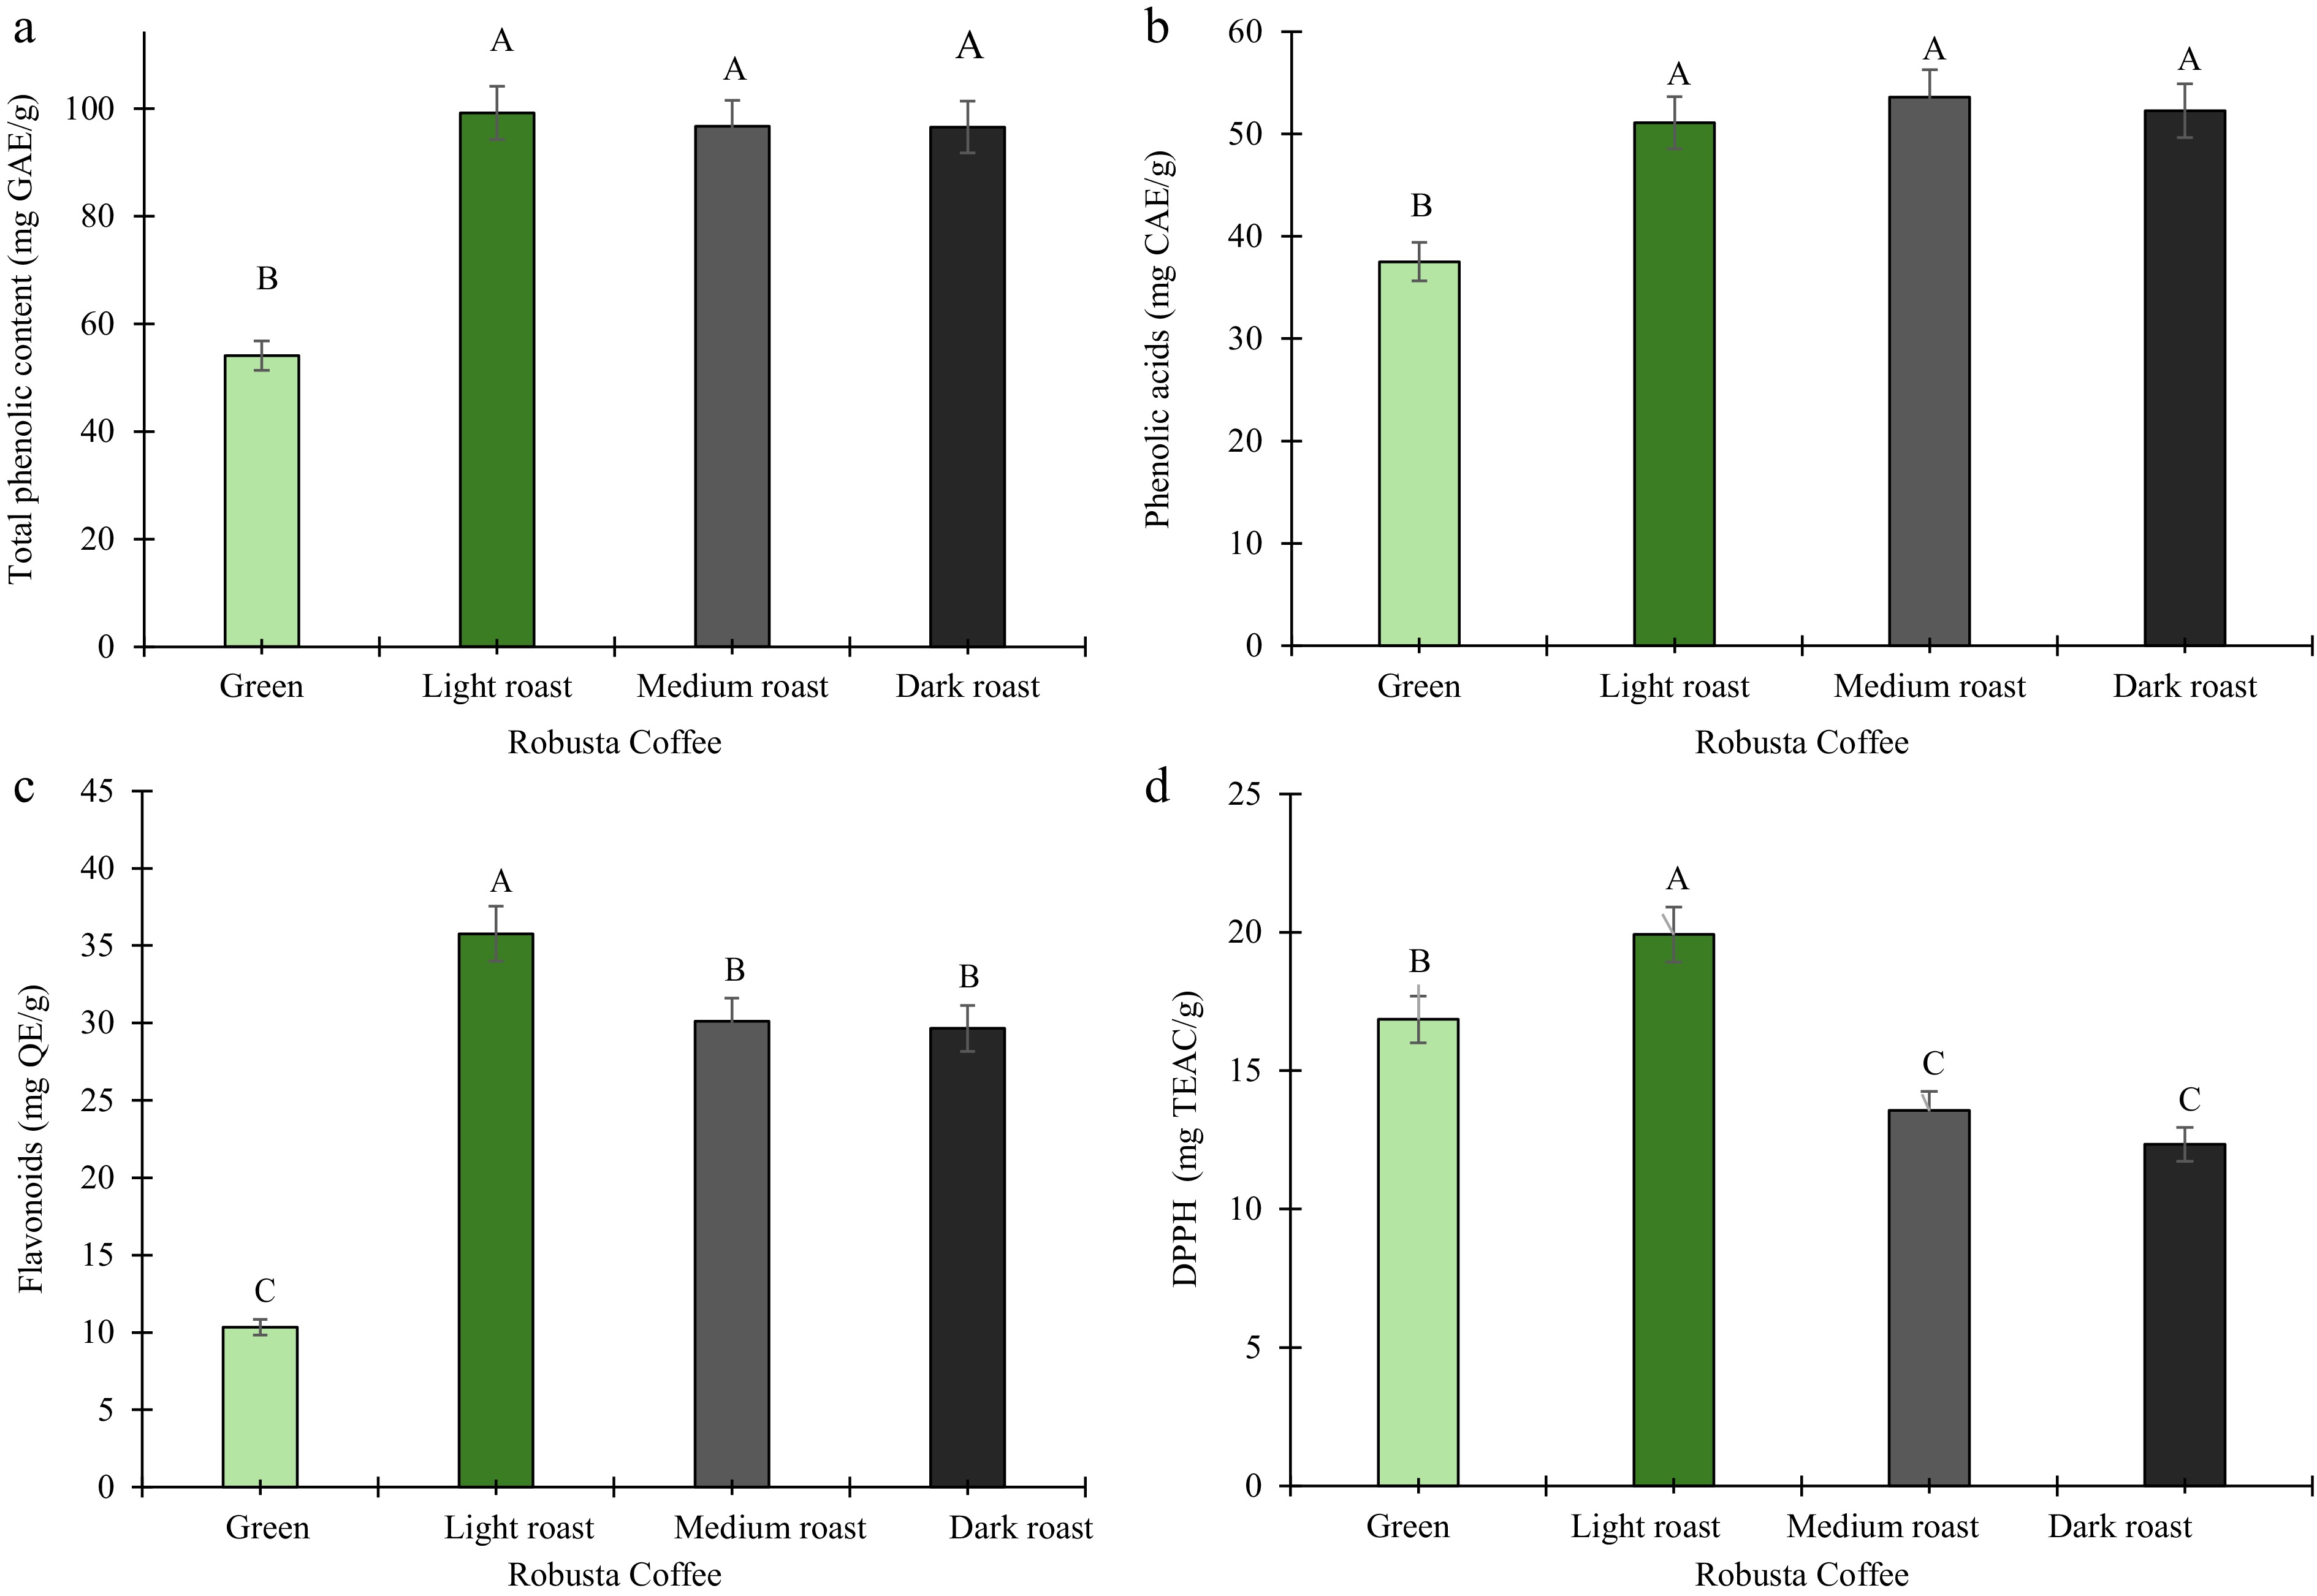
Figure 3.
Phytochemical and antioxidant activity of green, light, medium, and dark roasted robusta coffee beans. (a) Total phenolic content. (b) Total phenolic acids. (c) Total flavonoid content. (d) DPPH radical scavenging activity. Results are expressed as means (n = 3). Error bars represent standard deviation. Different capital letters (A, B, C) above the bars represent significant differences (p ≤ 0.05).
-
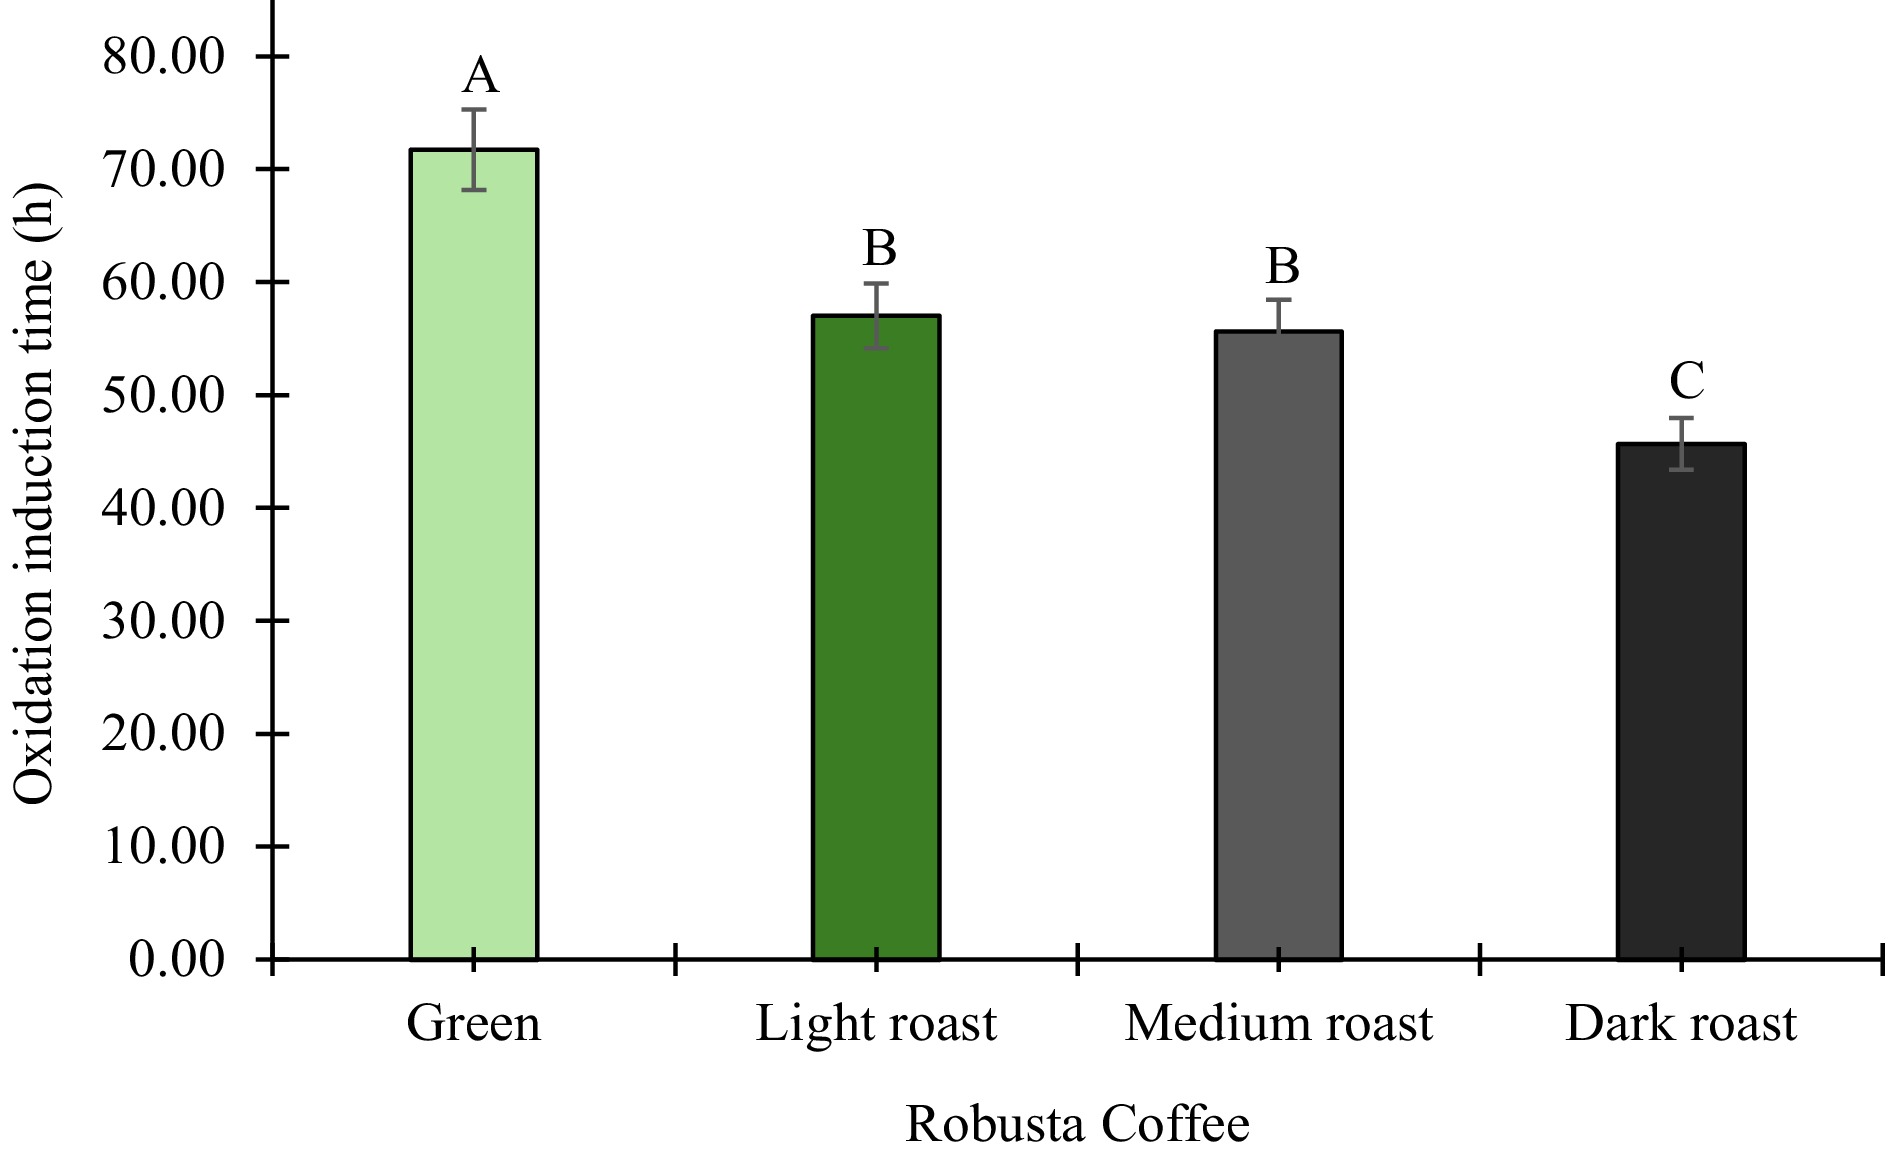
Figure 4.
Oxidative stability of green, light, medium, and dark roasted robusta coffee beans. Results are expressed as means (n = 3). Error bars represent standard deviation. Different capital letters (A, B, C) above the bars represent significant differences (p ≤ 0.05).
-
Robusta coffee Proximate composition (g/100 g) Moisture Ash Protein Fat CHO Energy (kcal) Green 9.81 ± 0.02c 3.27 ± 0.09a 14.70 ± 1.26a 2.48 ± 0.24a 69.74 ± 1.445a 360.1 ± 1.480a Light roast 3.32 ± 0.04b 3.28 ± 0.02a 18.05 ± 0.32b 5.94 ± 0.05b 69.40 ± 0.350a 403.3 ± 0.336b Medium roast 1.84 ± 0.28a 3.69 ± 0.06b 20.70 ± 1.56b 7.40 ± 0.68bc 66.37 ± 2.468a 414.9 ± 2.530c Dark roast 1.92 ± 0.08a 4.11 ± 0.12c 18.06 ± 1.15b 8.60 ± 0.33c 67.31 ± 1.279a 418.9 ± 2.452c p-value < 0.001 0.001 0.030 < 0.001 0.239 < 0.001 Values are means ± standard deviation (n = 3). Means along the same row with different superscripts are significantly different (p ≤ 0.05). CHO, total carbohydrates. Table 1.
Effect of roasting on the proximate composition of Robusta coffee.
-
Elements (mg/kg) Robusta coffee beans Green Light roast Medium roast Dark roast Cobalt (Co) nd nd nd nd Calcium (Ca) 193 ± 9.53d 1,726 ± 6.90b 1,631 ± 3.55a 1,790 ± 8.42c Sodium (Na) 454.0 ± 4.09d 384.3 ± 1.20c 373.2 ± 0.38b 325.8 ± 1.71a Potassium (K) 17,480 ± 4.03d 15,848.7 ± 2.71c 14,690 ± 3.03a 15,062 ± 1.77b Aluminium (Al) 0.95 ± 0.77a 8.66 ± 1.04c 2.89 ± 0.46b 2.72 ± 0.38ab Silver (Ag) 0.08 ± 0.03b 0.01 ± 0.02a 0.02 ± 0.01a 0.01 ± 0.017a Magnesium (Mg) 245.8 ± 0.84d 235.8 ± 0.48c 225.9 ± 0.07b 204.7 ± 0.61a Barium (Ba) 5.37 ± 0.01d 4.33 ± 0.01b 3.60 ± 0.00a 4.84 ± 0.03c Cadmium (Cd) nd nd nd nd Chromium (Cr) nd nd nd nd Copper (Cu) 17.63 ± 0.09c 14.03 ± 0.01a 17.69 ± 0.03c 15.62 ± 0.12b Iron (Fe) 42.29 ± 0.24bc 41.74 ± 0.23b 42.61 ± 0.19c 35.70 ± 0.42a Lithium (Li) 0.09 ± 0.02b 0.03 ± 0.00a 0.03 ± 0.00a 0.02 ± 0.00a Manganese (Mn) 13.08 ± 0.05d 12.81 ± 0.07c 11.46 ± 0.02a 11.76 ± 0.02b Nickel (Ni) nd 2.29 ± 0.21a 2.53 ± 0.04b 3.14 ± 0.14c Strontium (Sr) 7.85 ± 0.05d 6.63 ± 0.02b 6.22 ± 0.01a 7.07 ± 0.05c Lead (Pb) nd nd nd nd Zinc (Zn) 5.90 ± 0.62b 4.70 ± 0.53b 2.49 ± 0.58a 3.01 ± 0.80a Antimony (Sb) 0.32 ± 0.60a 0.49 ± 0.10a nd 0.21 ± 0.52a Arsenic (As) nd nd nd nd Mercury (Hg) nd nd nd nd Selenium (Se) nd nd nd nd Values are means ± standard deviation (n = 3). Means along the same row with different superscripts are significantly different (p ≤ 0.05). nd, not detected. Table 2.
Impact of roasting on minerals, including risk elements of coffee beans.
-
Microorganism Zone of inhibition (mm) Green coffee Light roast coffee Medium roast coffee Dark roast coffee CCM 8270 3.58 ± 0.71b 3.84 ± 0.87a 3.58 ± 0.72b 3.04 ± 0.44c CCM 8186 3.84 ± 0.87a 2.78 ± 0.29c 2.78 ± 0.29c 3.58 ± 0.72b CCM 8223 3.04 ± 0.44a 3.04 ± 0.44a 3.04 ± 0.44a 2.78 ± 0.29b CCM 4224 7.58 ± 0.93a 5.18 ± 0.60b 5.18 ± 0.60b 2.78 ± 0.29a CCM 3954 4.38 ± 0.16d 5.44 ± 0.75a 4.64 ± 0.31c 5.18 ± 0.60b CCM 4699 5.98 ± 0.04a 3.84 ± 0.87b 3.84 ± 0.87b 5.98 ± 0.04a CCM 1959 5.18 ± 0.60a 4.38 ± 0.16b 3.85 ± 0.87c 3.85 ± 0.87c CCM 3807 4.64 ± 0.31b 5.44 ± 0.75a 4.38 ± 0.16c 3.84 ± 0.87d CCM 2461 6.78 ± 0.49a 3.84 ± 0.87 3.84 ± 0.87 5.98 ± 0.04b Candida glabrata CCM 8270, Candida albicans CCM 8186, Candida tropicalis CCM 8223, Enterococcus faecalis CCM 4224, Escherichia coli CCM 3954, Listeria monocytogenes CCM 4699, Pseudomonas aeruginosa CCM 1959, Salmonella enterica subs. Enterica CCM 3807, Staphylococcus aureus subs. aureus CCM 2461. Values are means ± standard deviation (n = 3). Means along the same row with different superscripts are significantly different (p ≤ 0.05). nd, not detected. Table 3.
Antimicrobial activity of green, light, medium, and dark roasted robusta coffee.
Figures
(4)
Tables
(3)