-
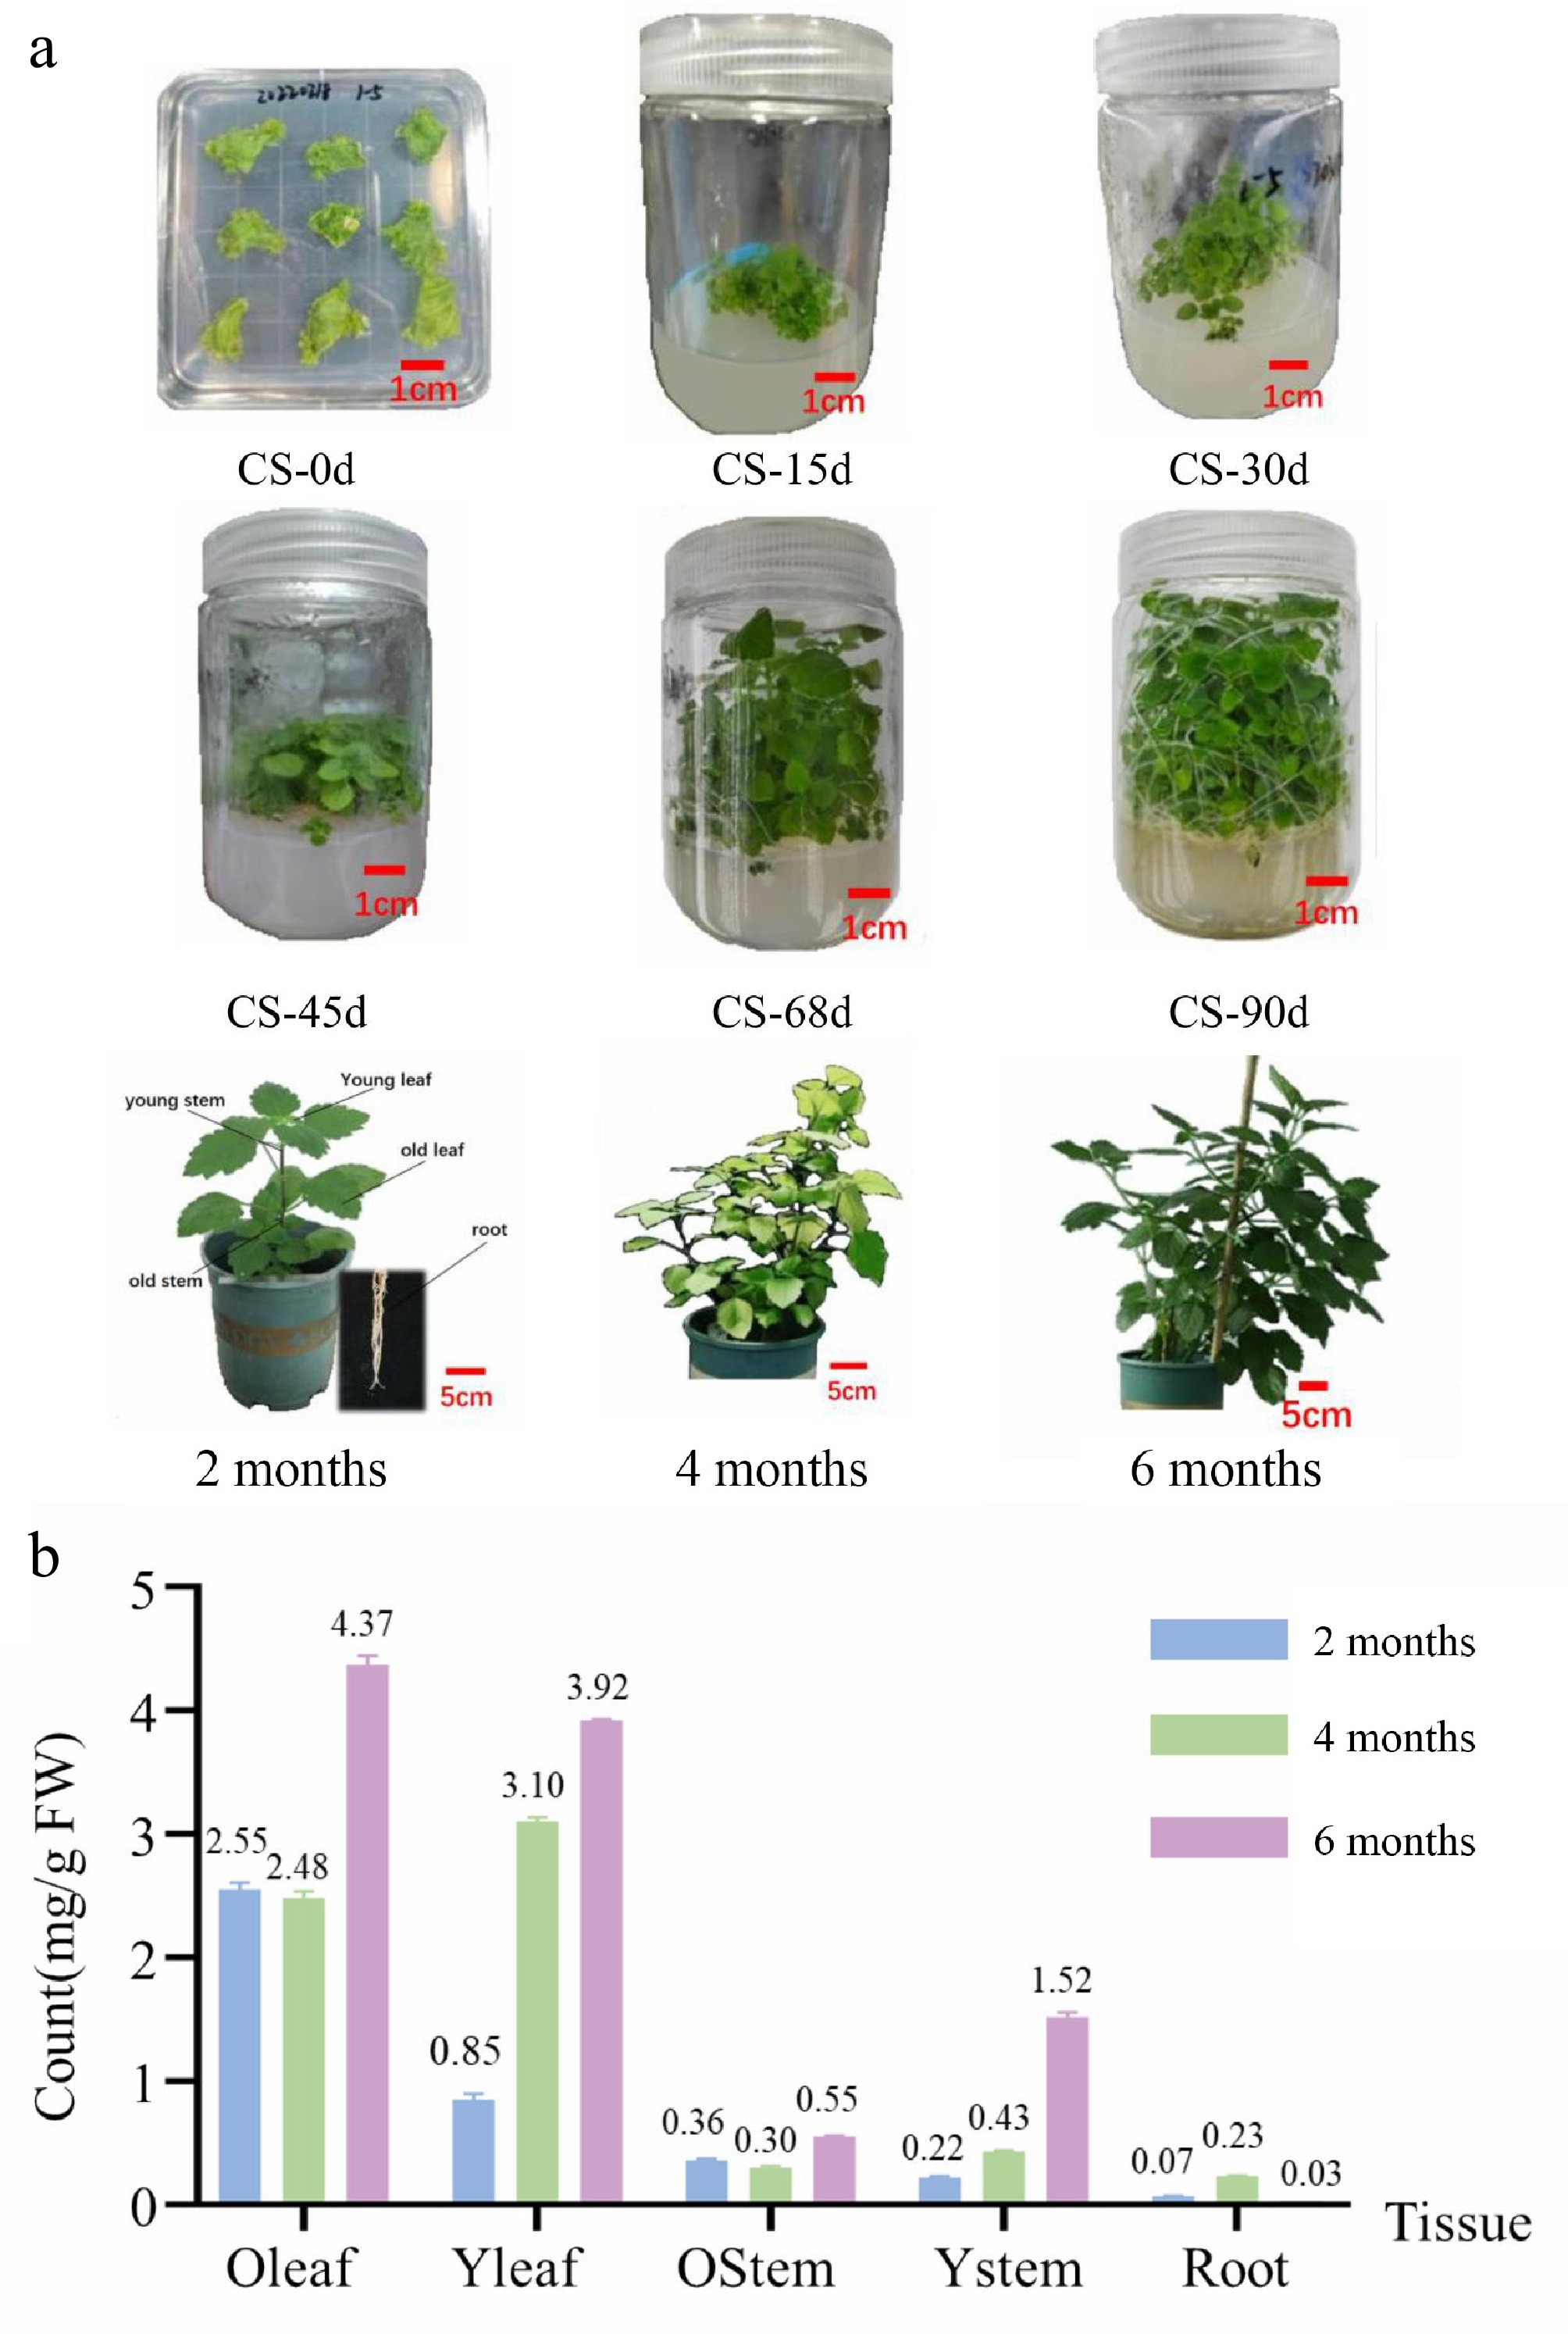
Figure 1.
Patchouli samples and total sesquiterpene compound content. (a) Samples from culture seeding (0, 15, 30, 45, 69, and 90 d), and soil growth (2, 4, and 6 months). (b) Total sesquiterpene compound content from different organization samples (2, 4, and 6 months). Total sesquiterpene compound content from culture seeding samples shown in Supplementary Tables S2 and S3.
-
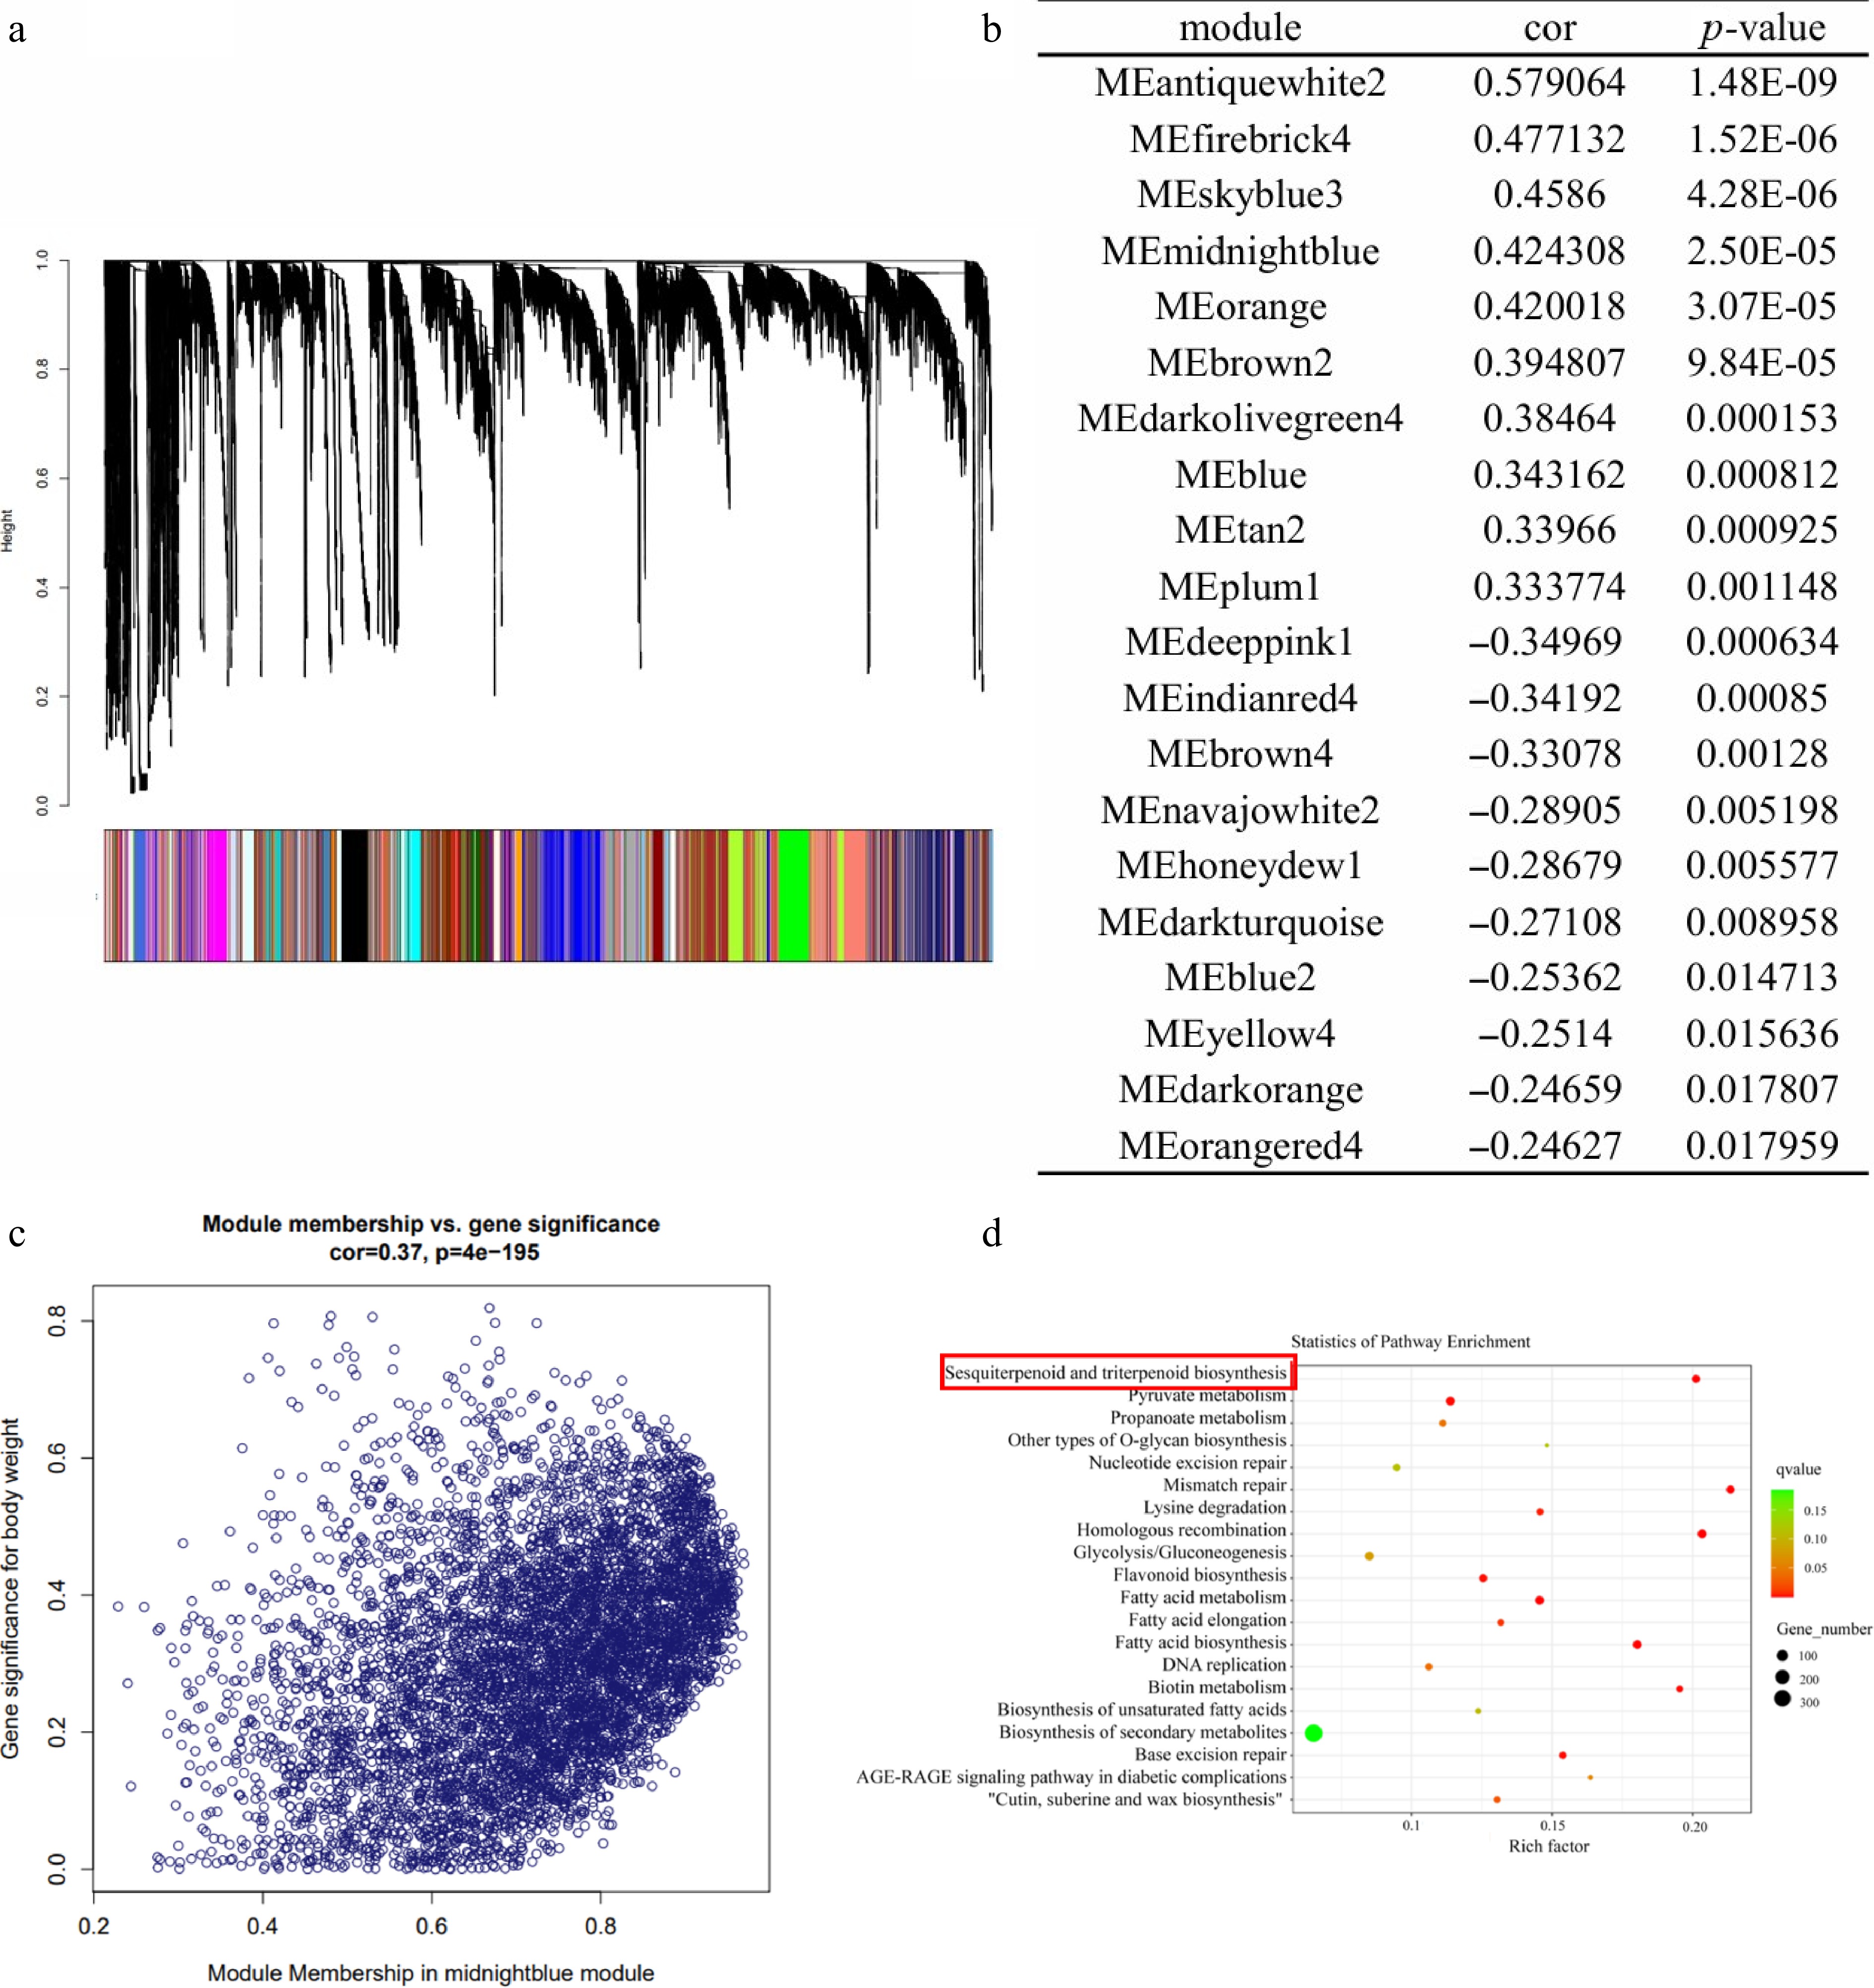
Figure 2.
Analysis of the co-expression network of patchouli genes. (a) Patchouli hierarchical clustering tree and its various modules. (b) Association analysis between modules and sesquiterpene content. (c) Correlation analysis of module midnightblue genes and sesquiterpene content of all patchouli samples. (d) GO annotation of Memidnightblue.
-
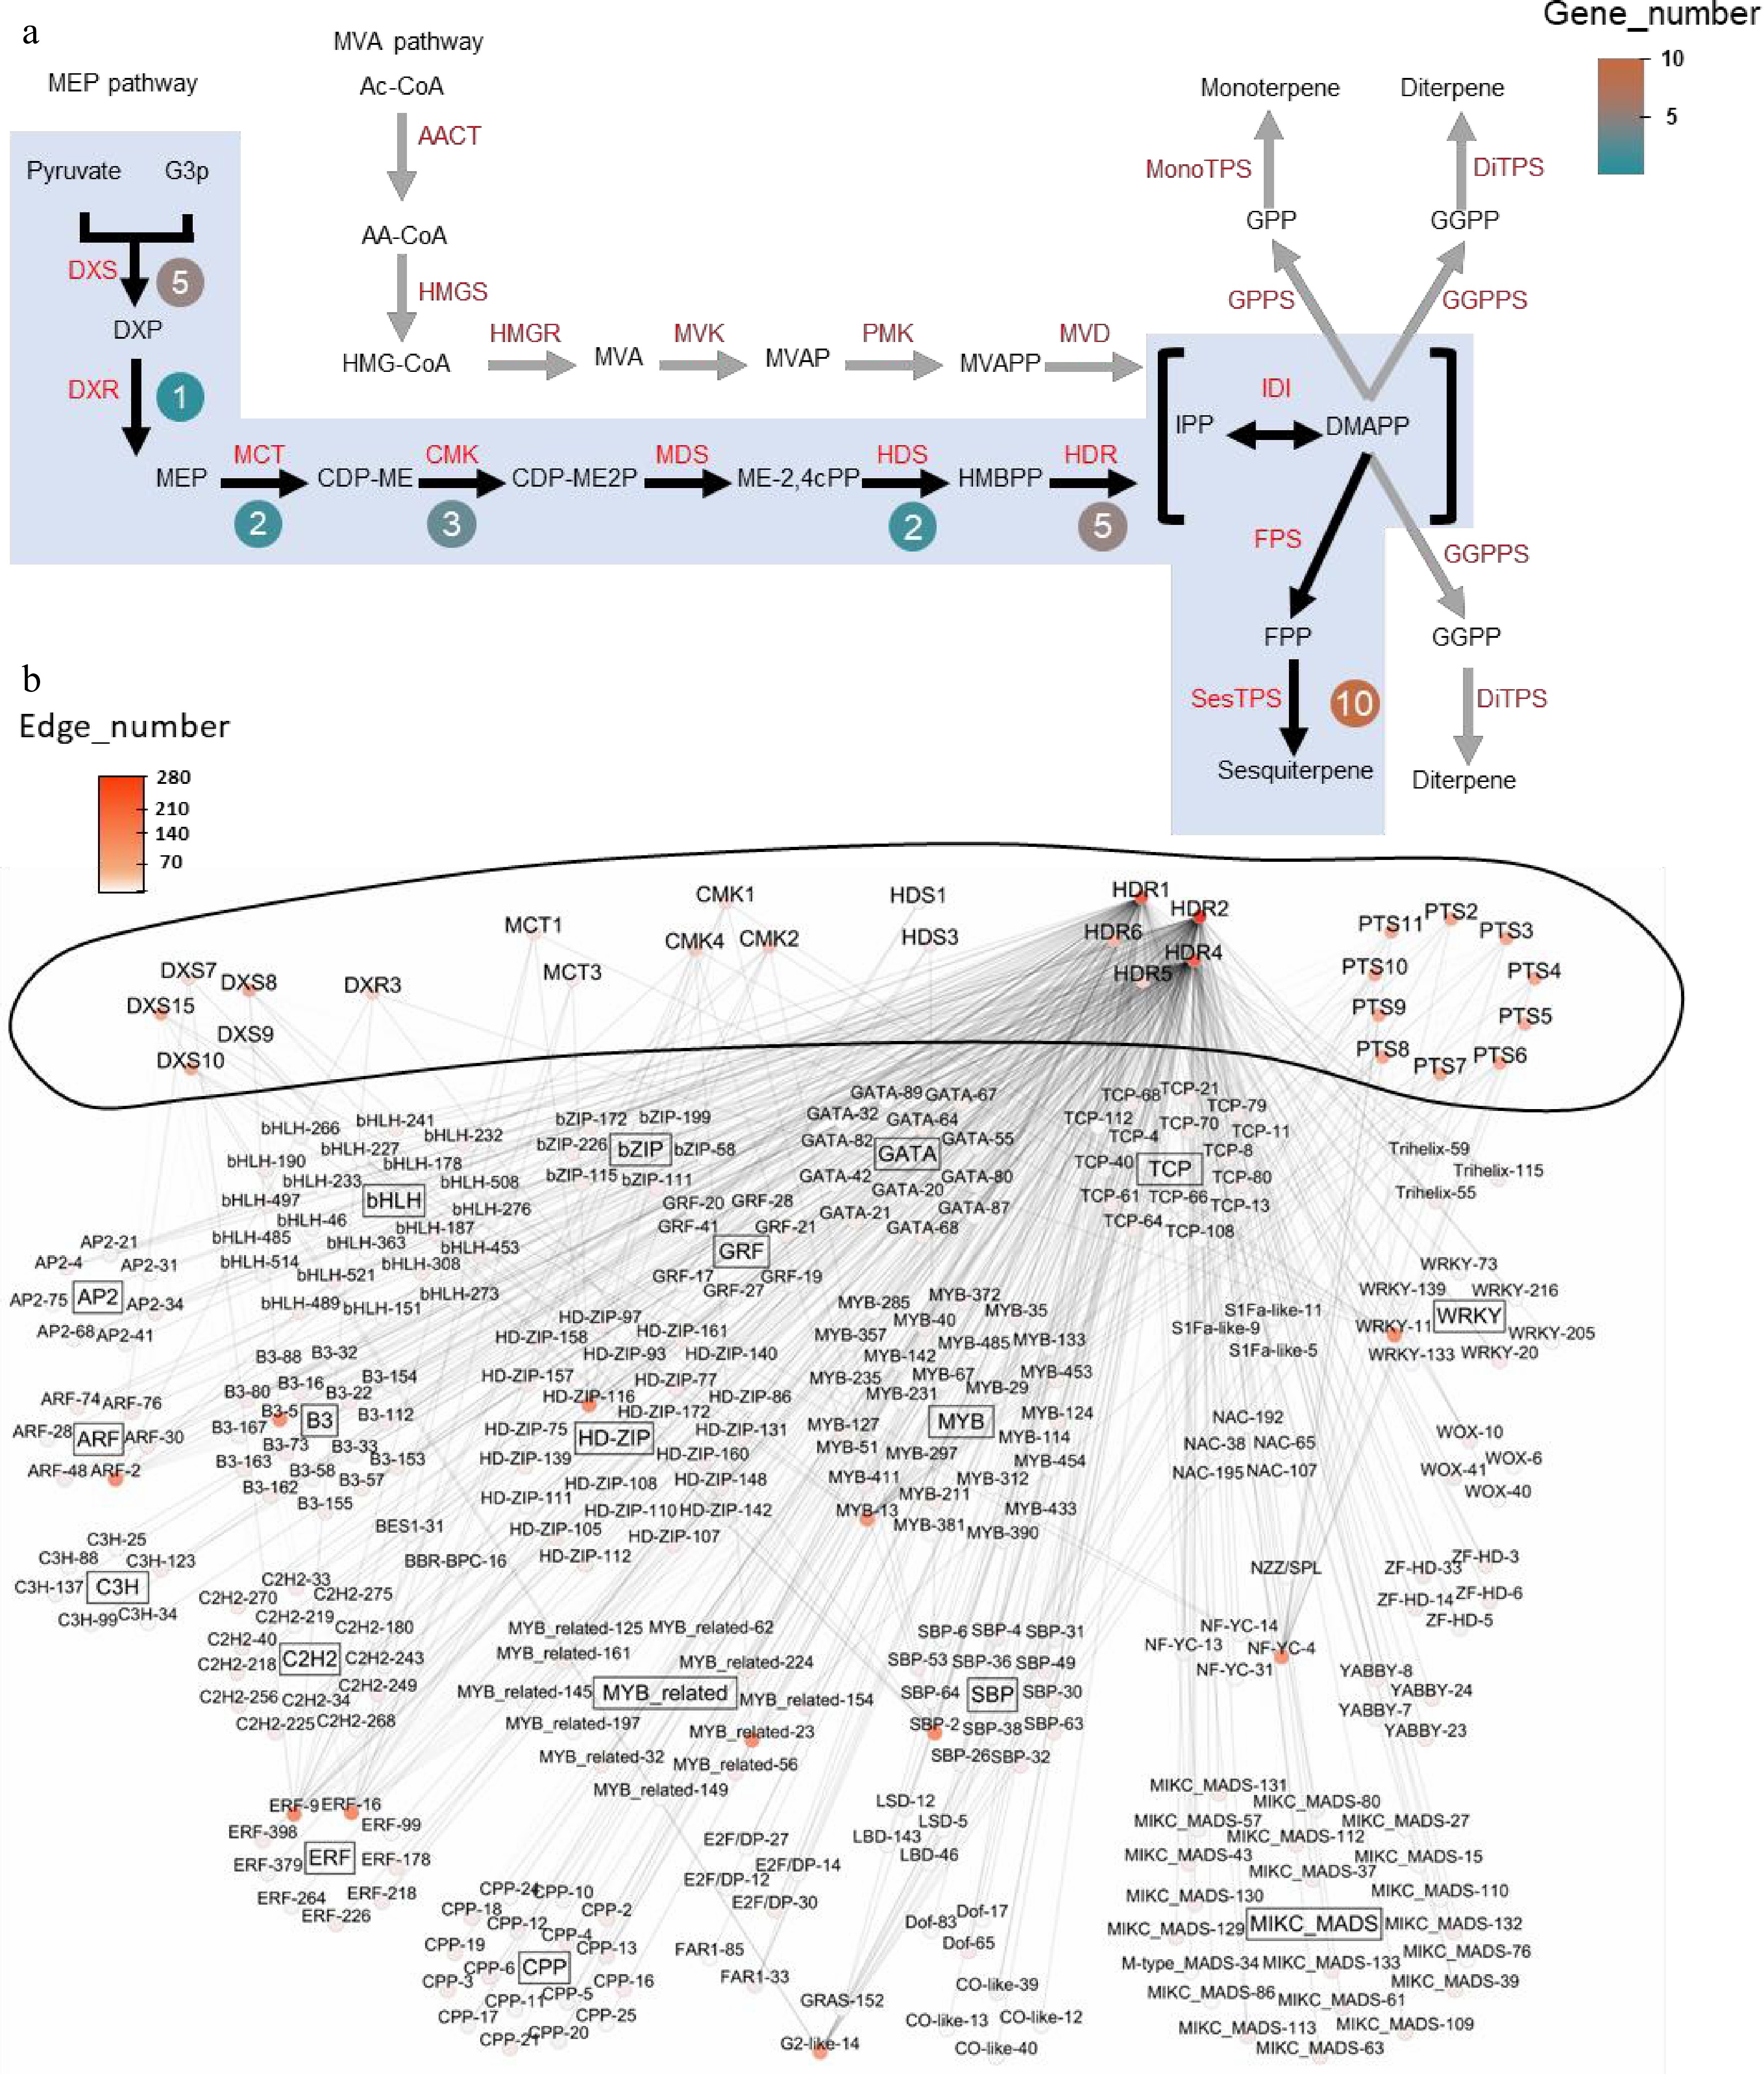
Figure 3.
Co-expression network and key enzyme genes from sesquiterpenoid metabolic pathway of patchouli. (a) Genes from sesquiterpenoid metabolic pathway in patchouli, adapted from Shen et al.[15]. Black arrows and blue shadows indicate key reaction steps. Genes in red indicate enzymes in the pathways. Round boxes next to the enzymes contain the numbers of core pathway genes. (b) Co-expression network of the sesquiterpenoid metabolic pathway. The outer ring of the network represents key enzyme genes implicated in sesquiterpenoid metabolic pathway, while inside are TFs. Nodes are labeled with gene names colored based on the edge number. TFs and pathway genes are connected via undirected edges. Internal connections among TFs and among pathway genes were not shown for clarity. Detailed IDs, names, and connection information for all genes in the network can be found in Supplementary Tables S7 and S8.
-
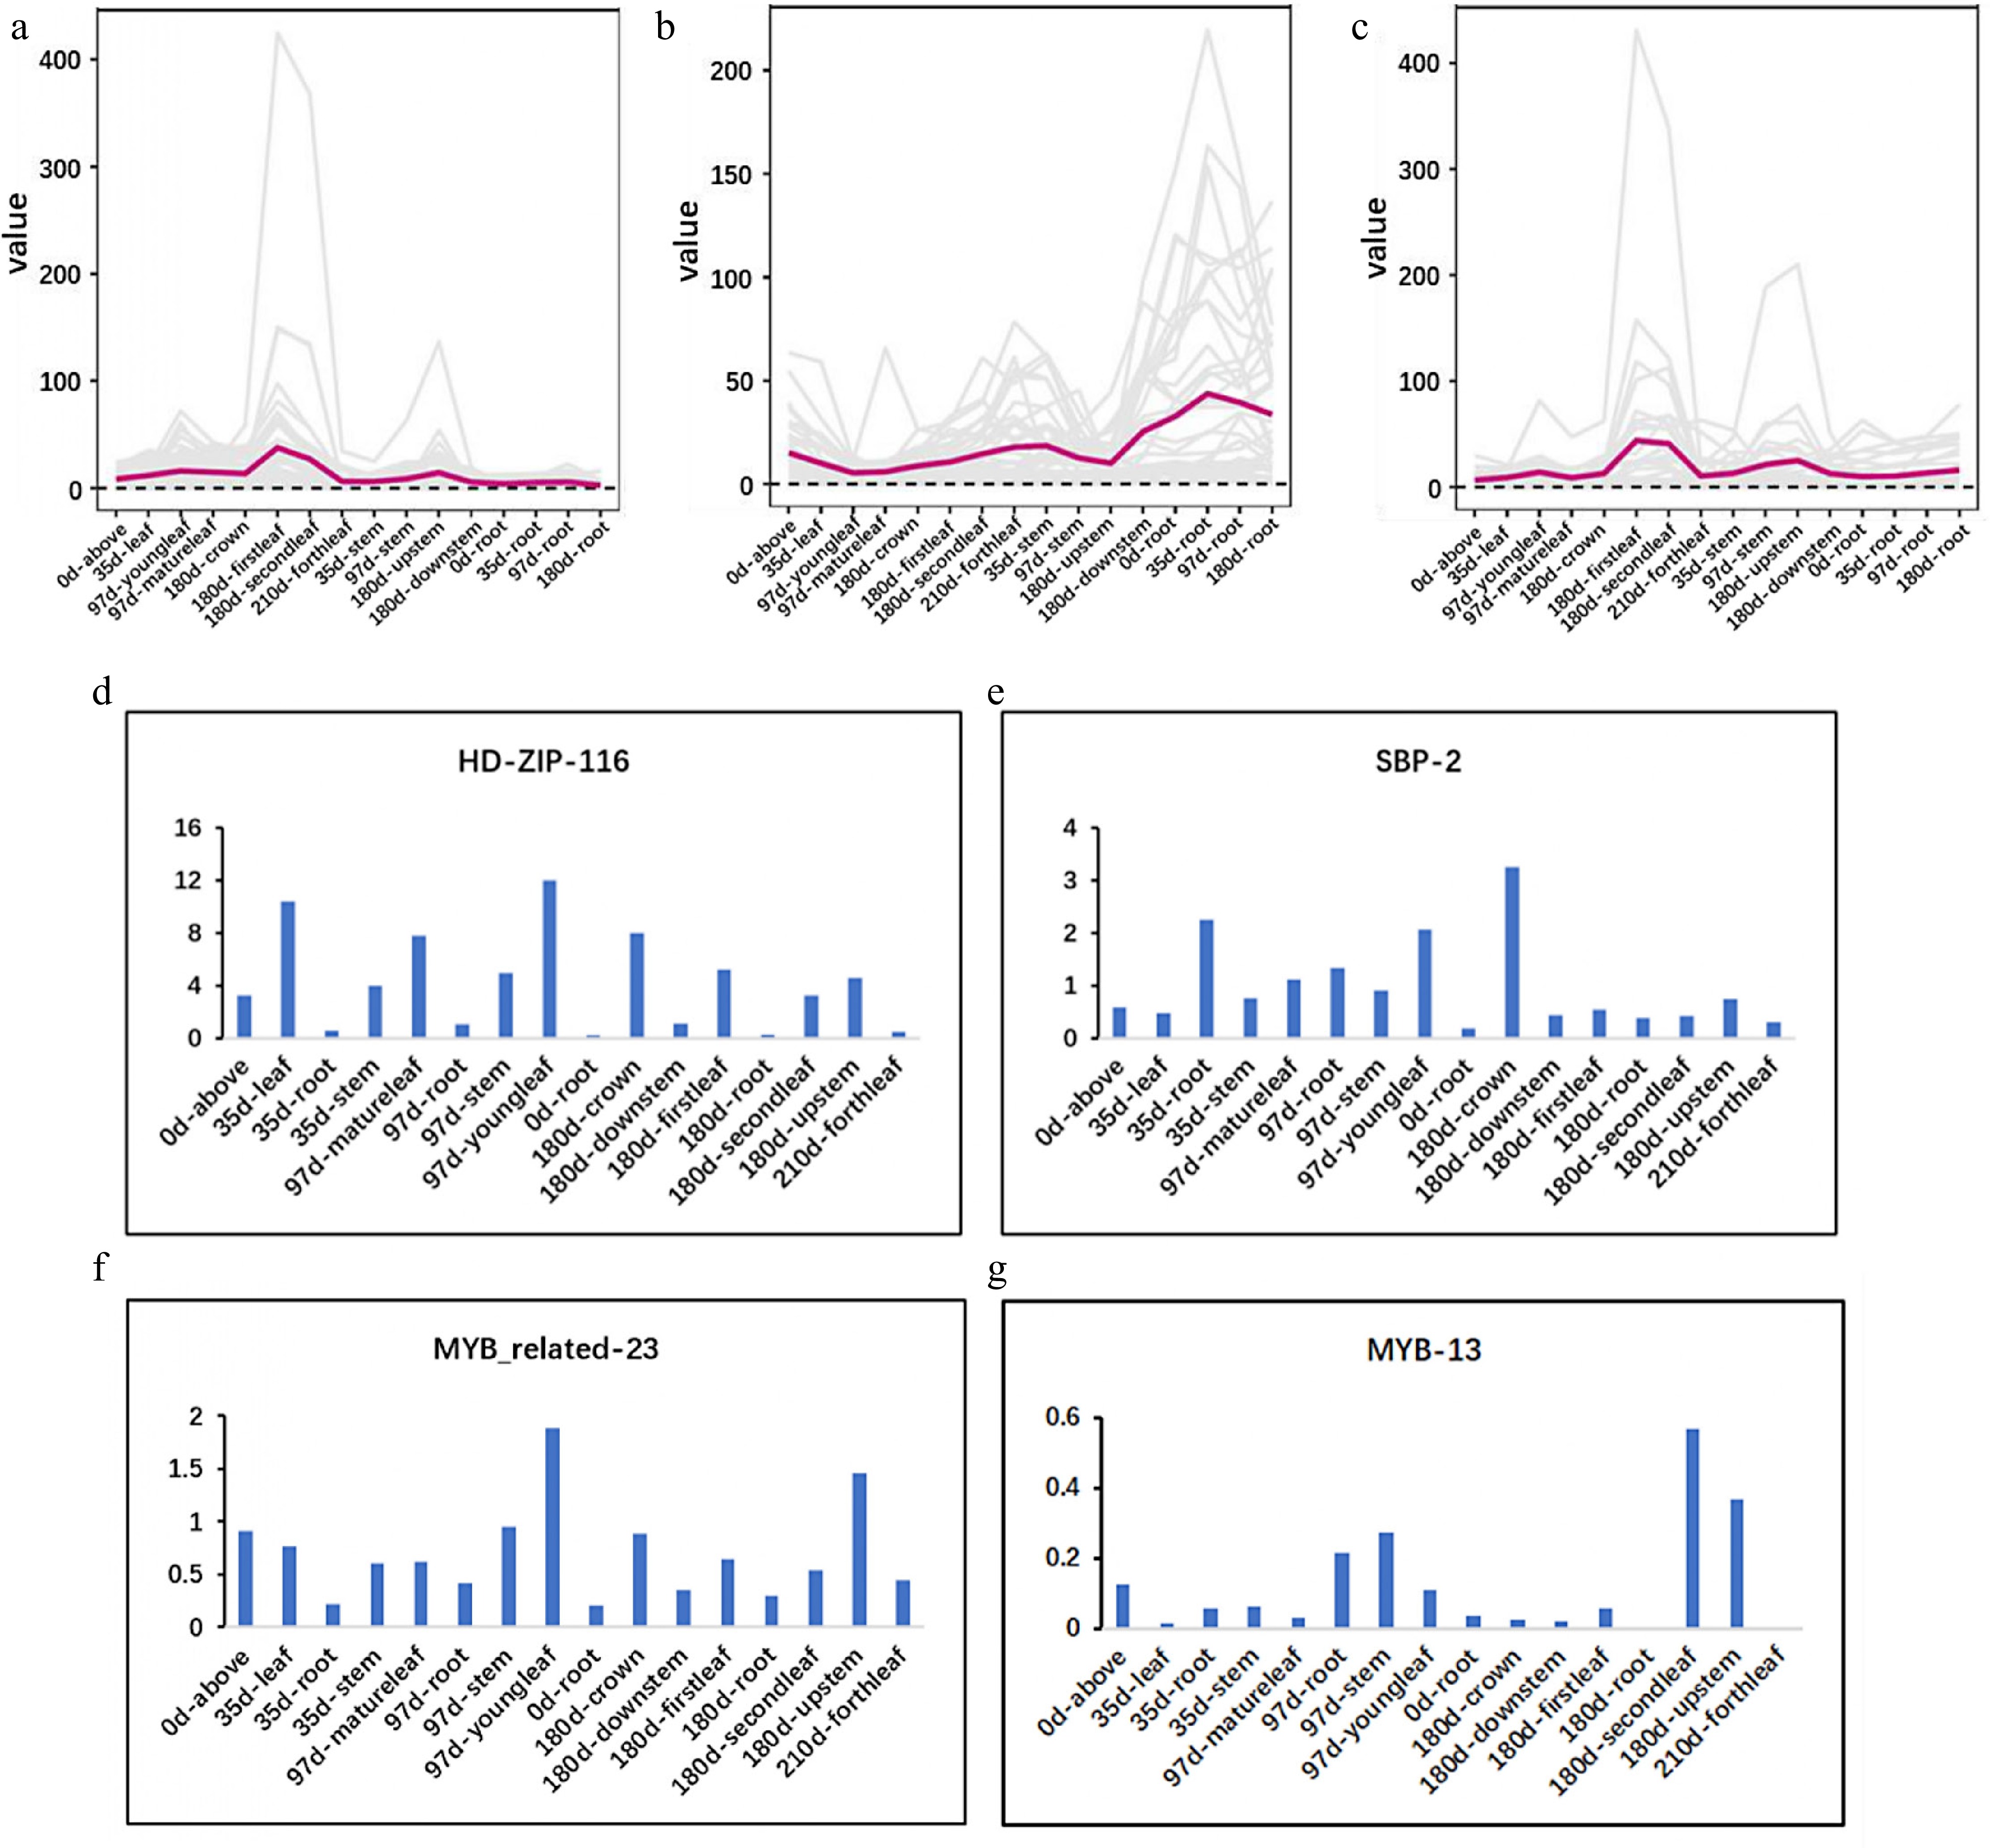
Figure 4.
Expression pattern of the candidate TFs is consistent with that of MEP pathway. (a)−(c) Expression of MEP, MVA, and downstream pathway. (d)−(g) Expression of HDZIP116, SBP2, MYBR23, and MYB13.
-
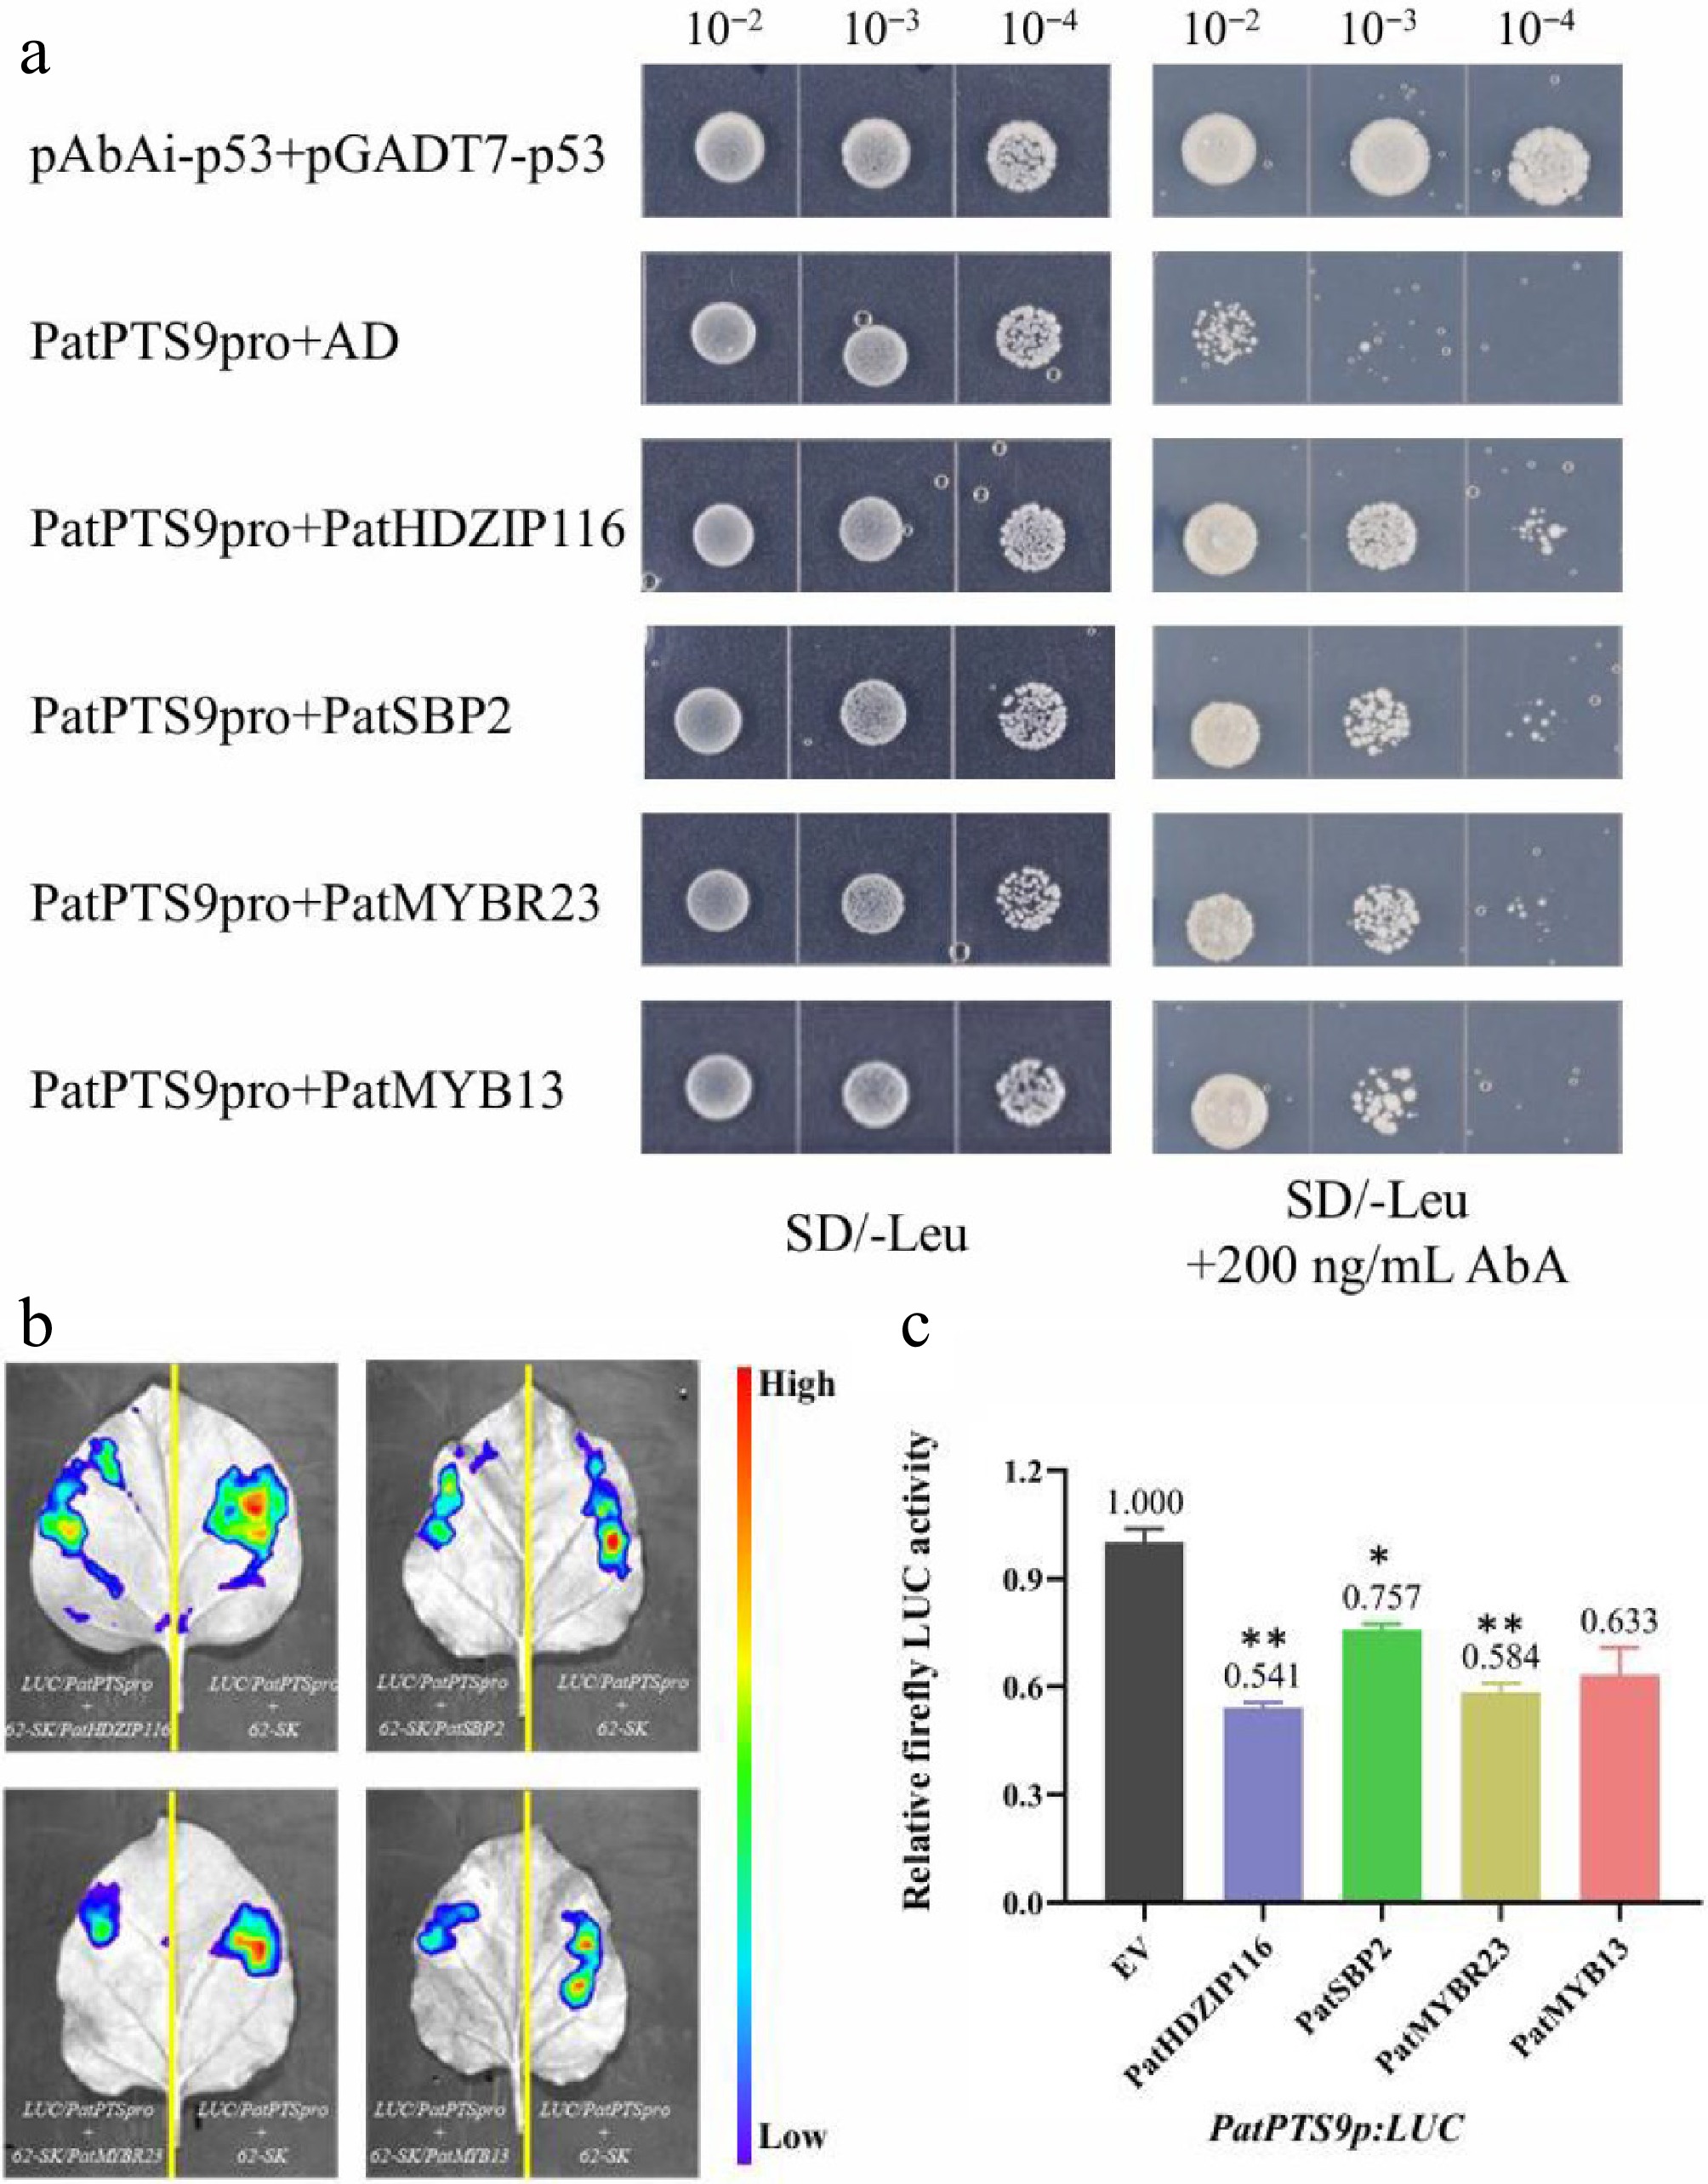
Figure 5.
PatHDZIP116, PatSBP2, PatMYBR23, and PatMYB13 repress the Sesquiterpene synthase gene PatPTS9. (a) Y1H assay confirming the interaction between the PatPTS9 promoter and four TFs. (b) Dual-LUC reporter imaging assay. N. benthamiana leaves were injected with the Agrobacterial GV3101-pSoup-p19 stains containing 62-sk + PatPTS9p:LUC and 62-sk:PatTF + PatPTS9p:LUC. Arrow position indicates the strongest fluorescence. (c) Relative firefly LUC activity assay in tobacco leaves. Error bars are shown with three biological replicates (Student's t-test: * p < 0.05, ** p < 0.01).
-
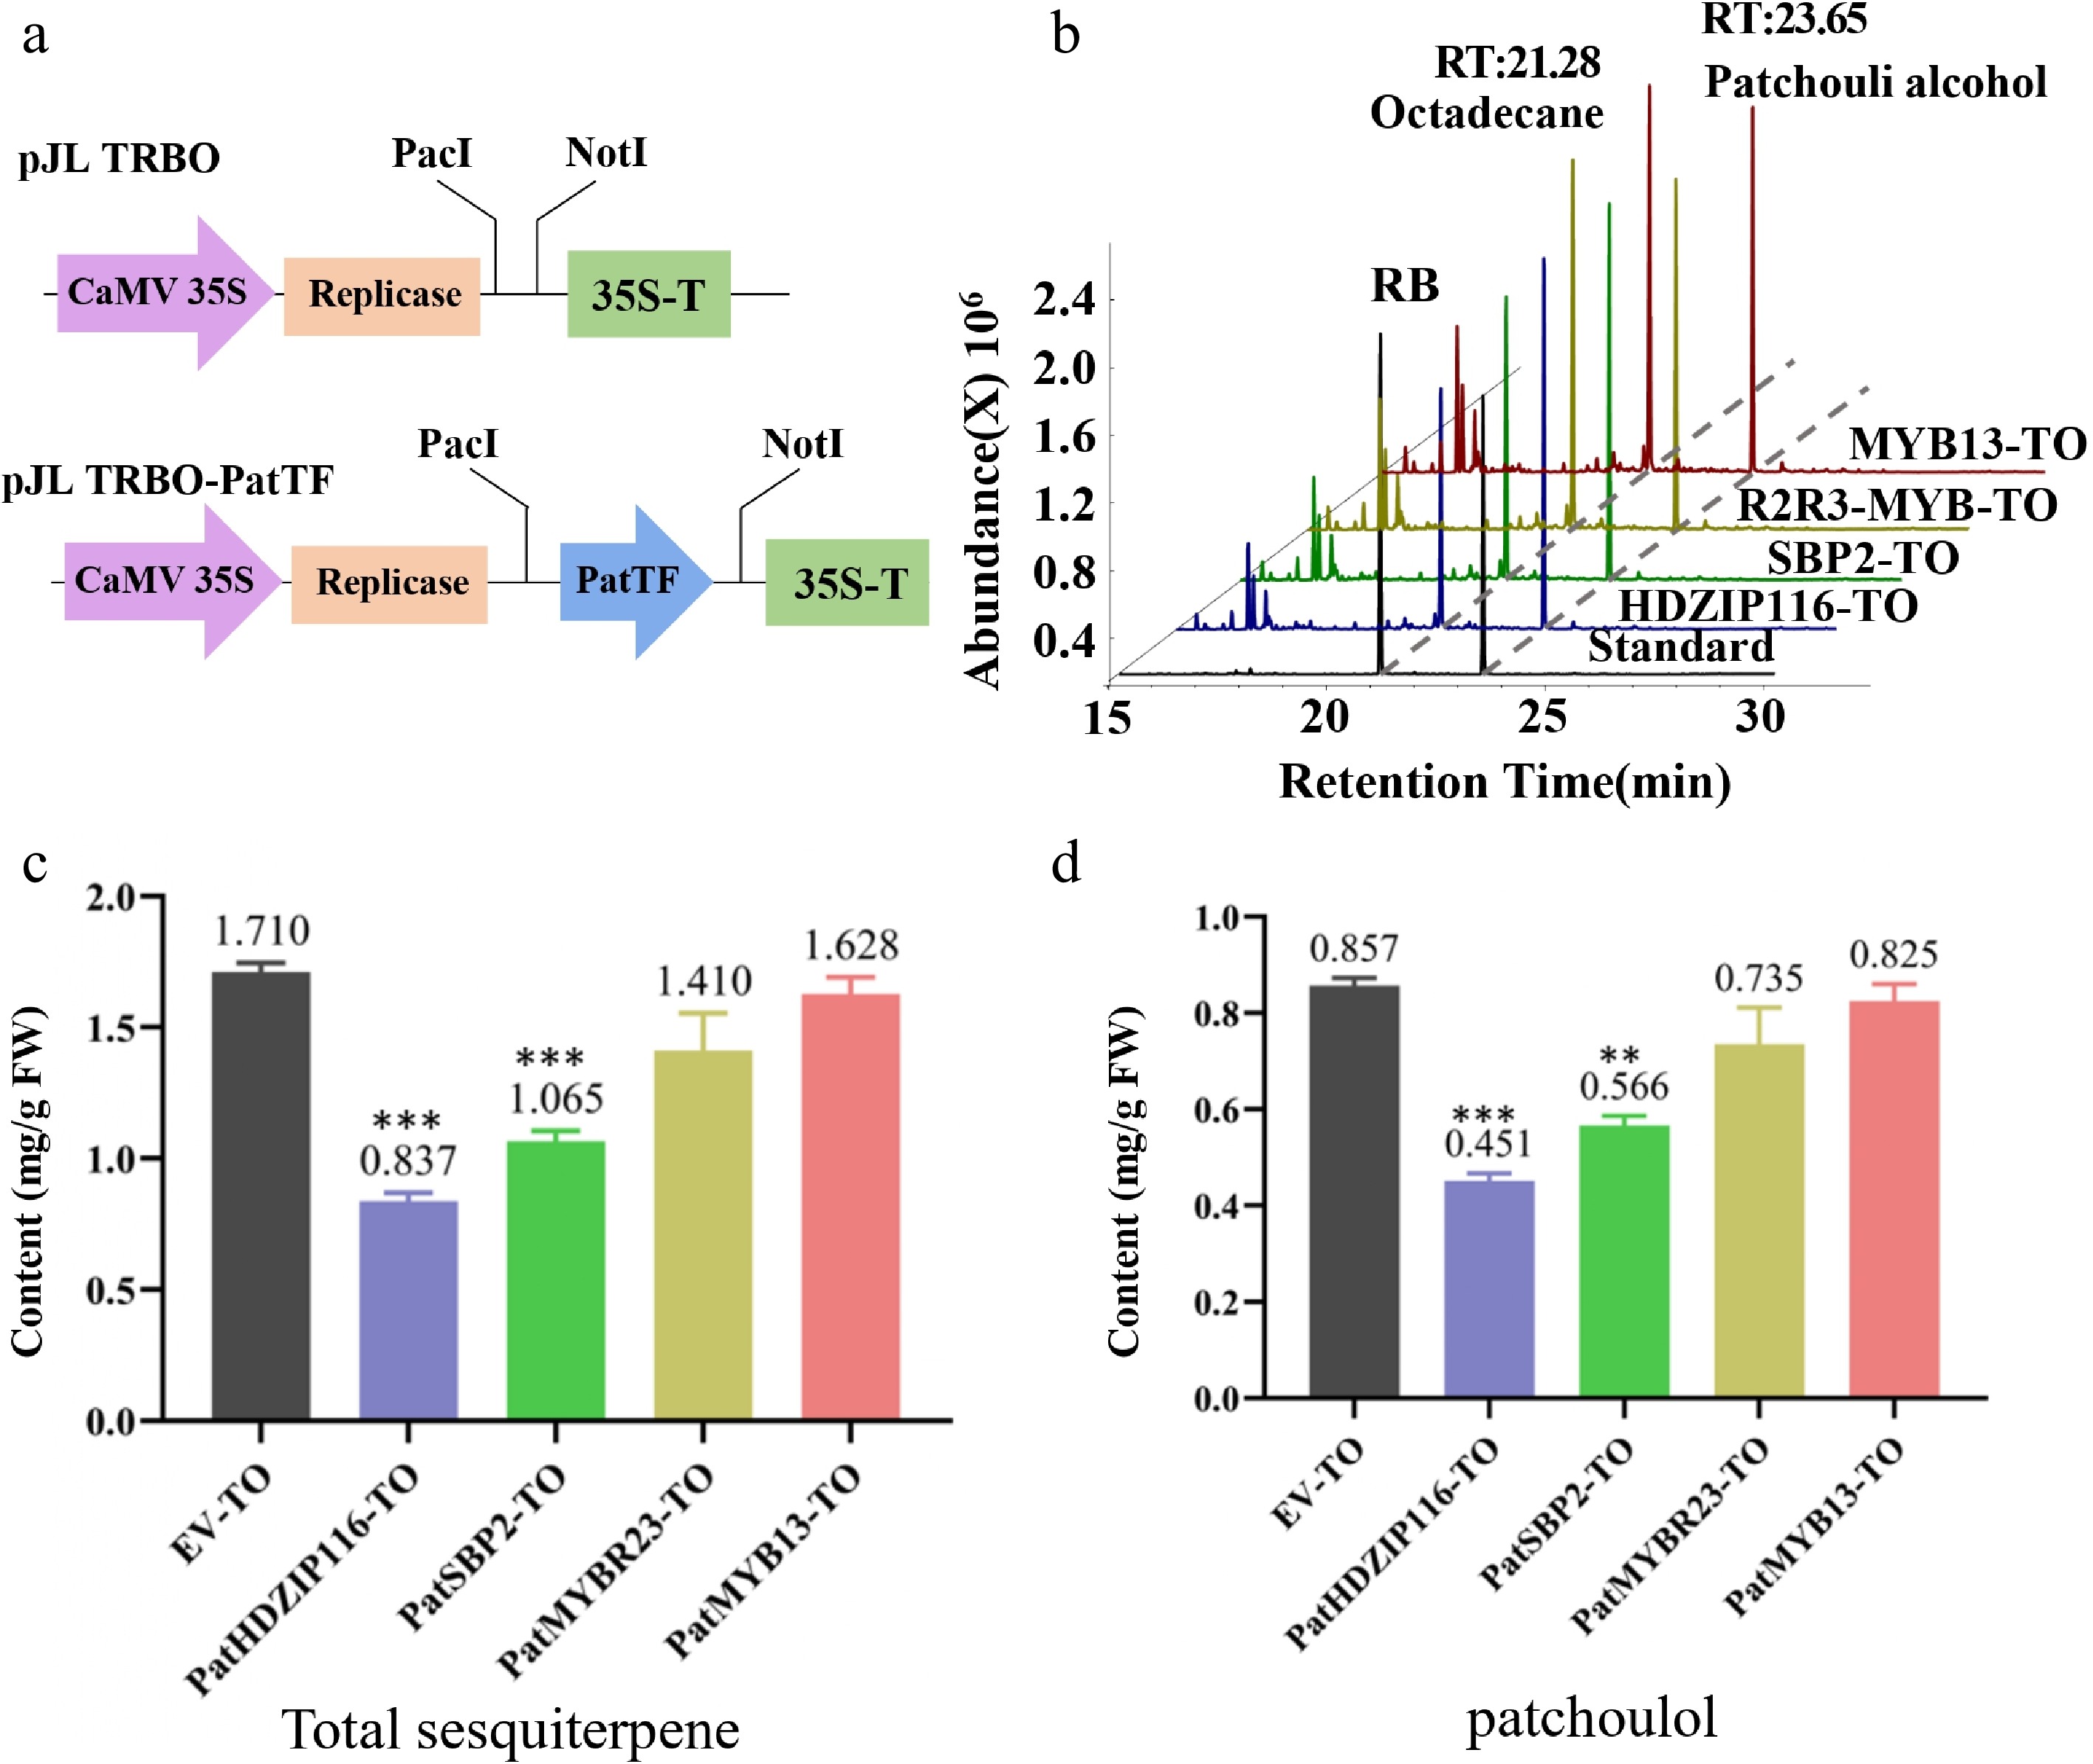
Figure 6.
Analysis of the transient overexpression (TO) of four TFs in patchouli. (a) Schematic diagram of pJL TRBO-PatTF vector construction. (b) The chromatogram of patchouli content detected by GC-MS. (c, d) Compared with EV-TO, the (c) total sesquiterpene and (d) patchouli alcohol content in leaves infiltrated with PatTF-TO was significantly reduced. Values are the mean ± SD of three biological replicates. Student's t-test: * p < 0.05, ** p < 0.01, *** p < 0.001. FW, fresh weight; TO, transient overexpression; EV, pJL-TRBO empty-vector.
-
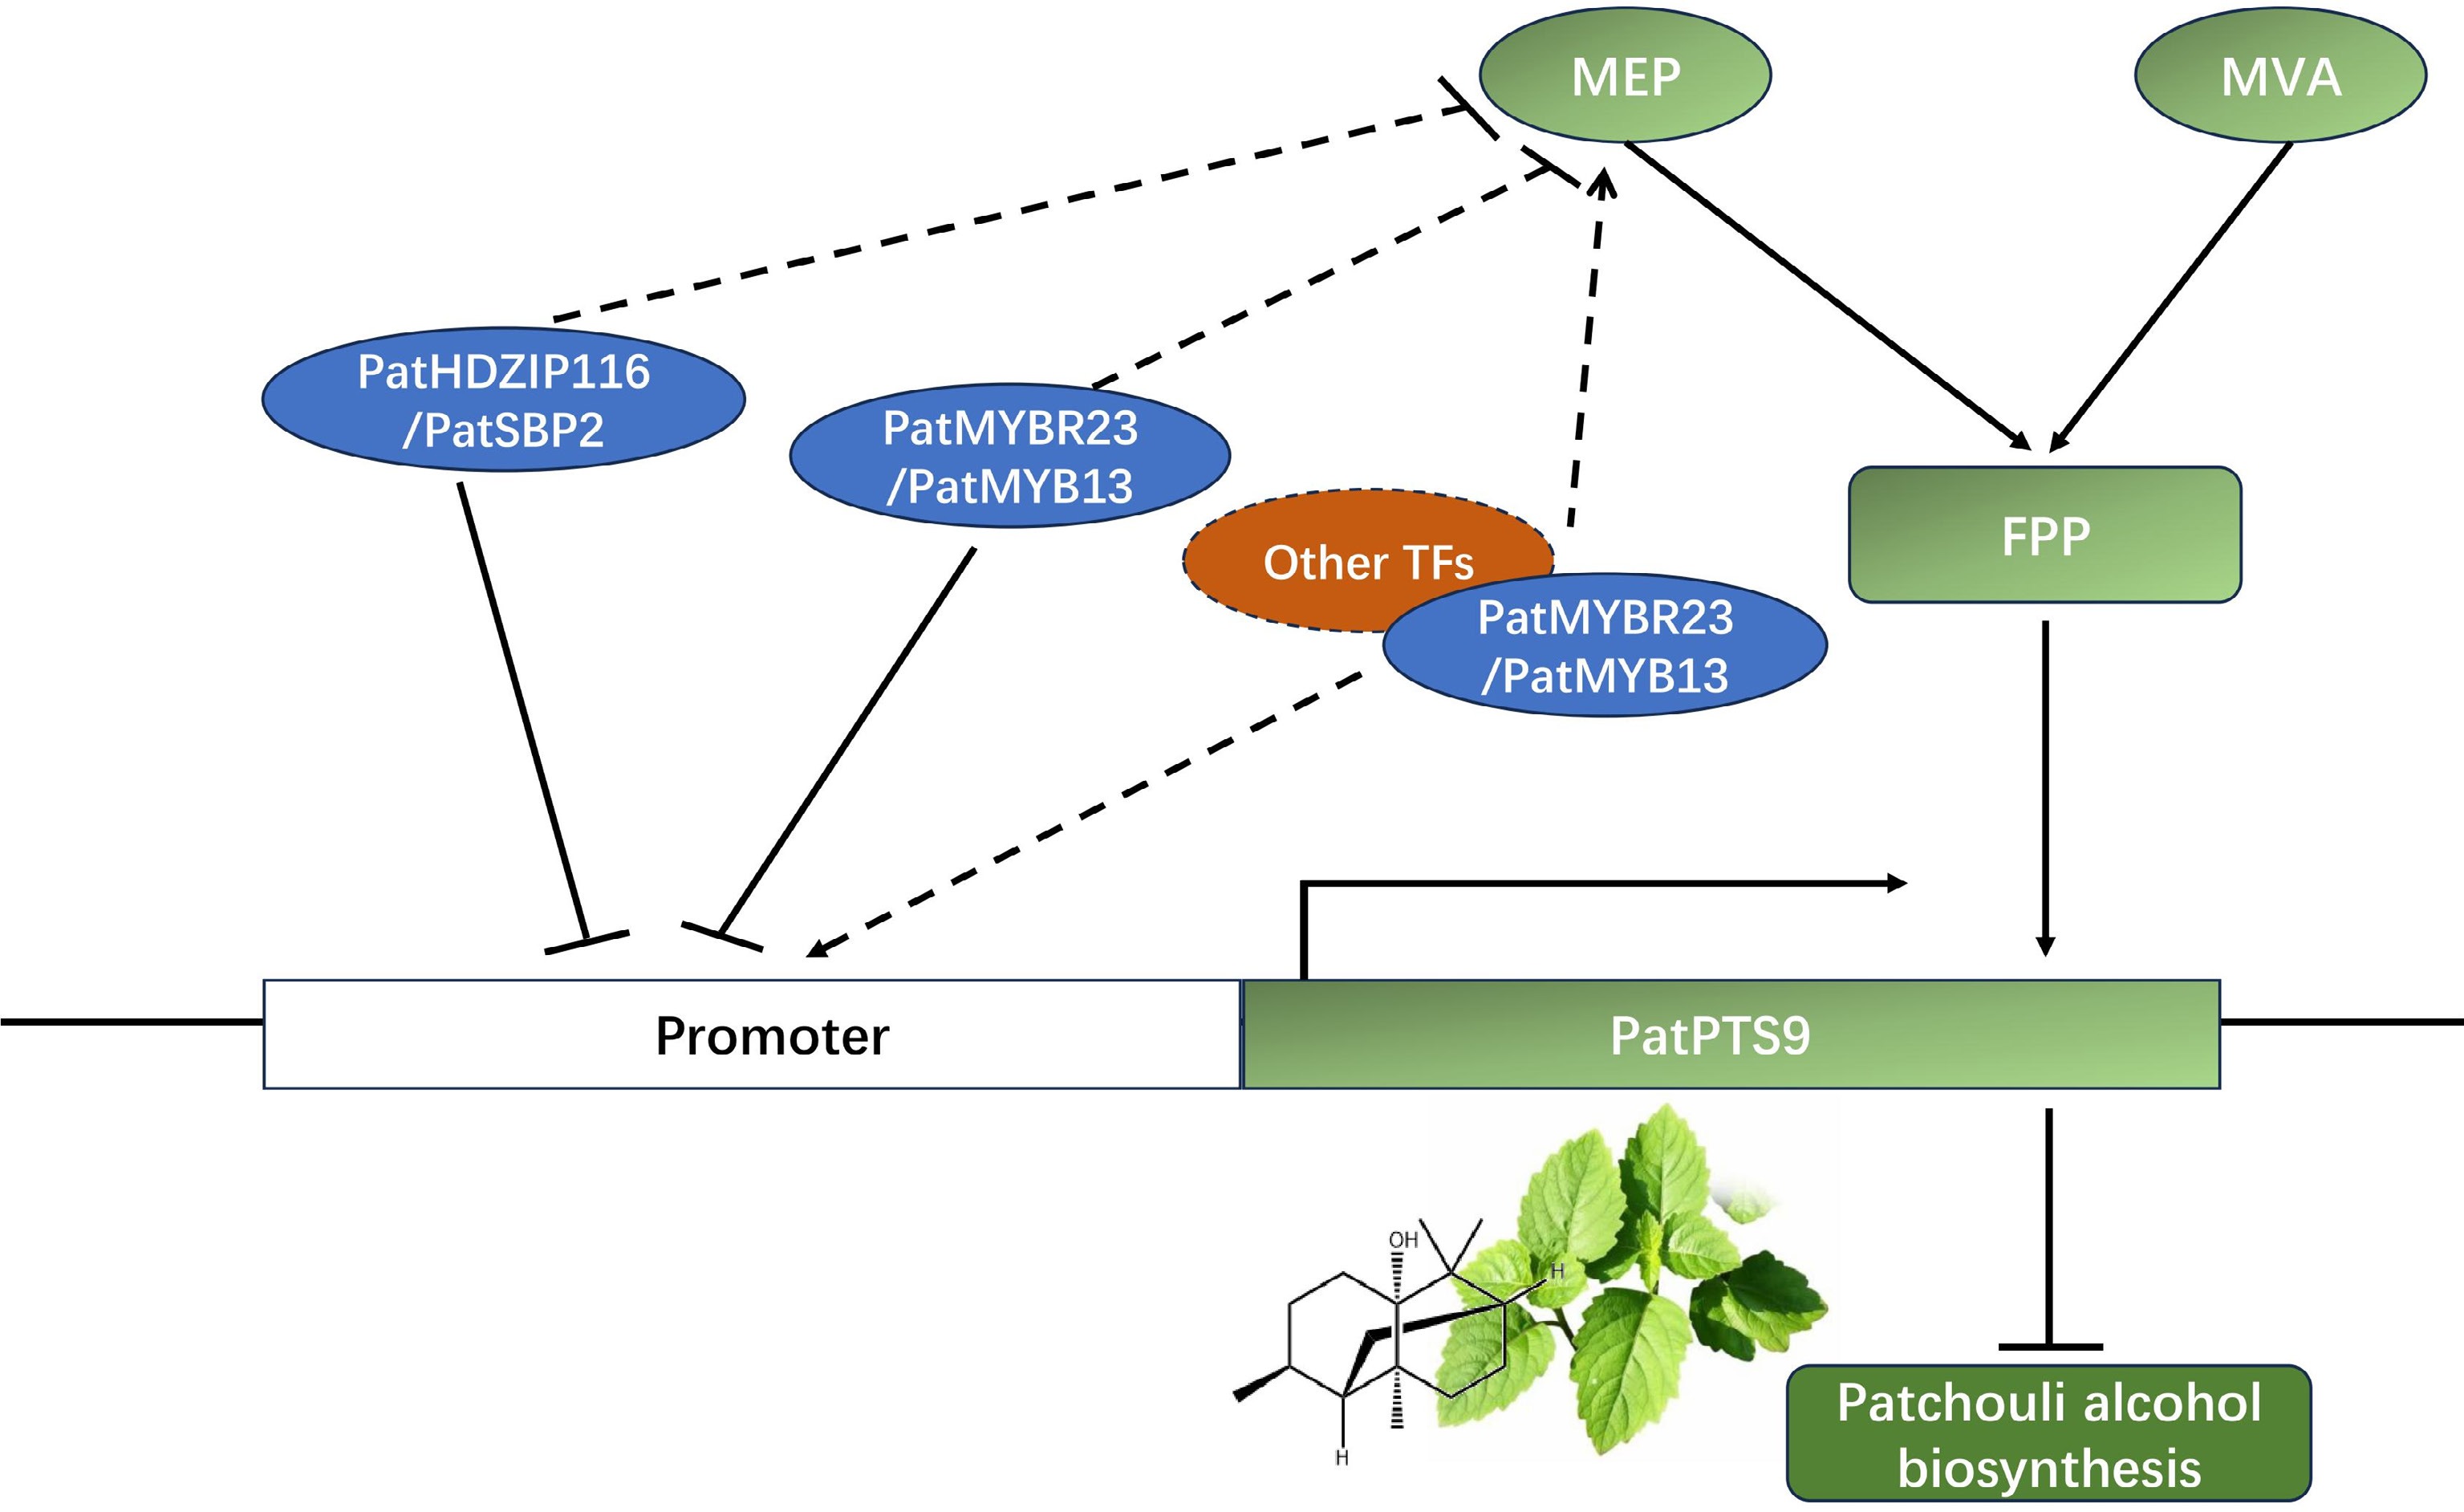
Figure 7.
Model describing the regulation function of PatHDZIP116, PatSBP2, PatMYBR23, and PatMYB13 in patchouli alcohol biosynthesis. PatHDZIP116 and PatSBP2 negatively regulated patchouli alcohol biosynthesis by inhibiting the expression of PatPTS9, while PatMYBR23 and PatMYB13 might had more complex regulation mechanism.
Figures
(7)
Tables
(0)