-
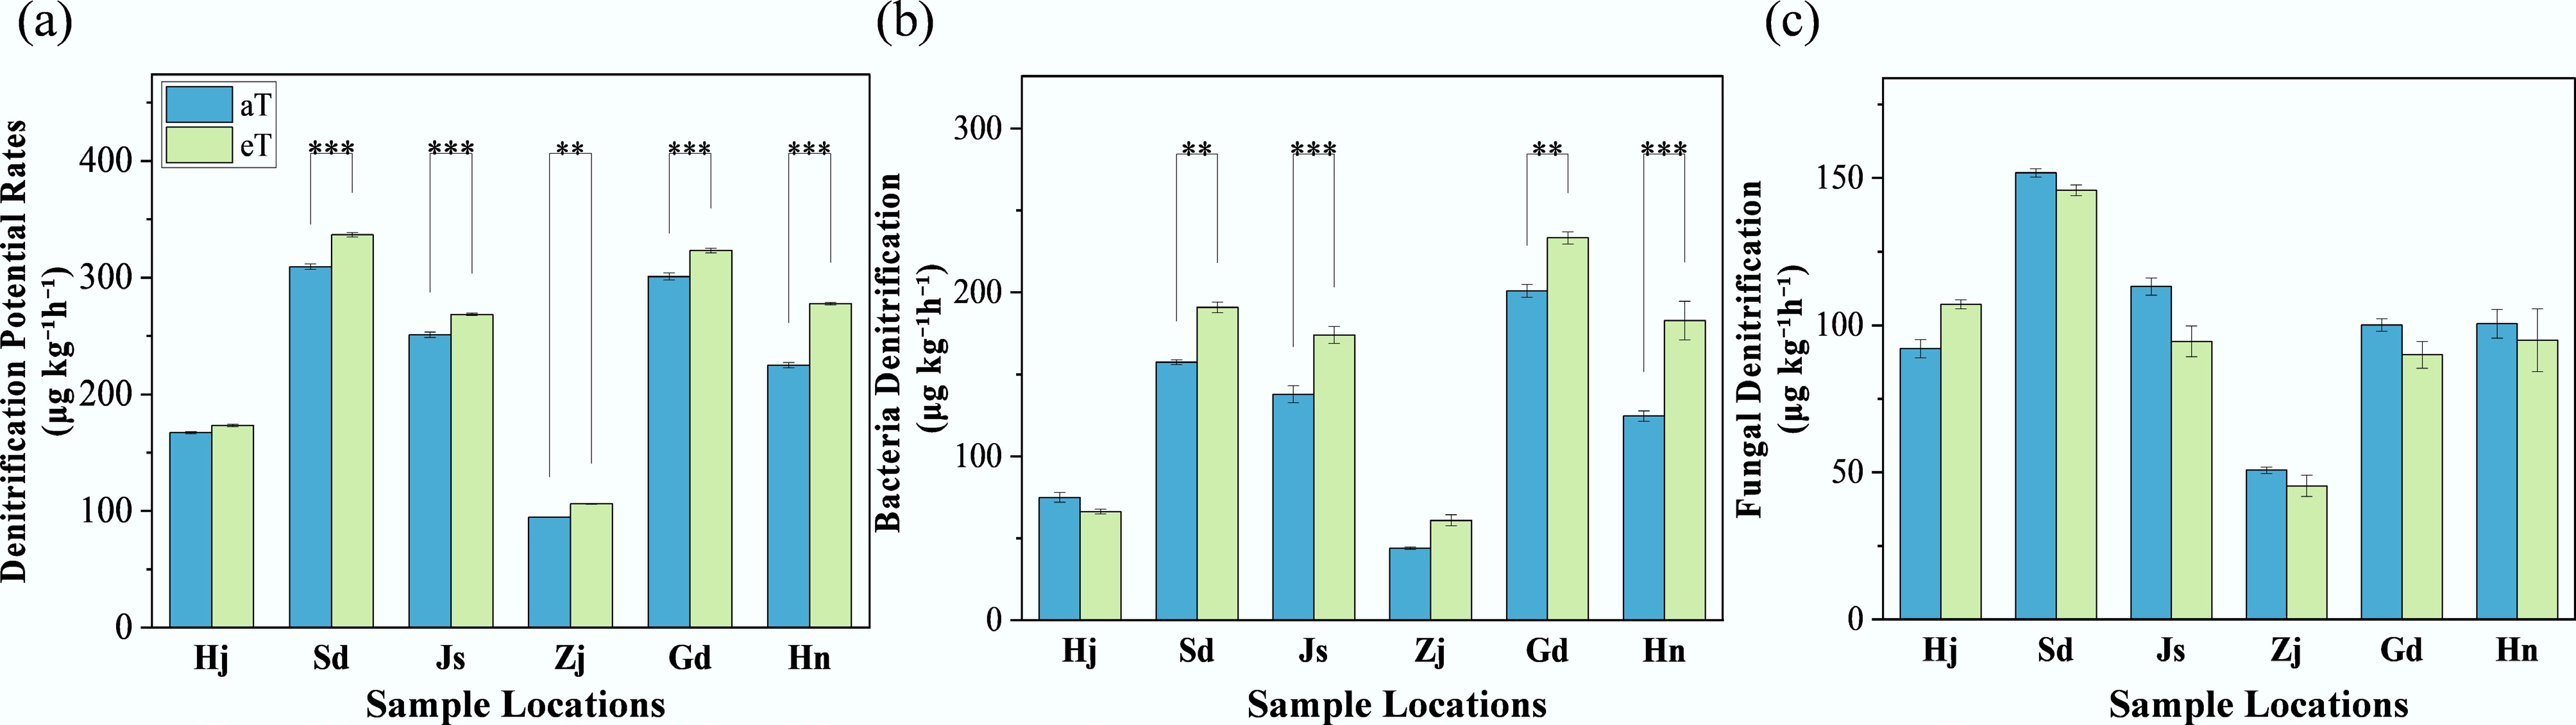
Figure 1.
Response of local denitrification potential rates to warming. Three replicates of one soil sample were used for warming incubations. 'aT' represents the local average annual temperature, and 'eT' represents the elevated temperature (+4 °C), based on the average annual temperature. Sample locations: Heilongjiang (Hj), Shandong (Sd), Jiangsu (Js), Zhejiang (Zj), Guangdong (Gd), and Hainan (Hn). The level of significance is determined by a two-sided t-test; * p < 0.05, ** p < 0.01, and *** p < 0.001.
-
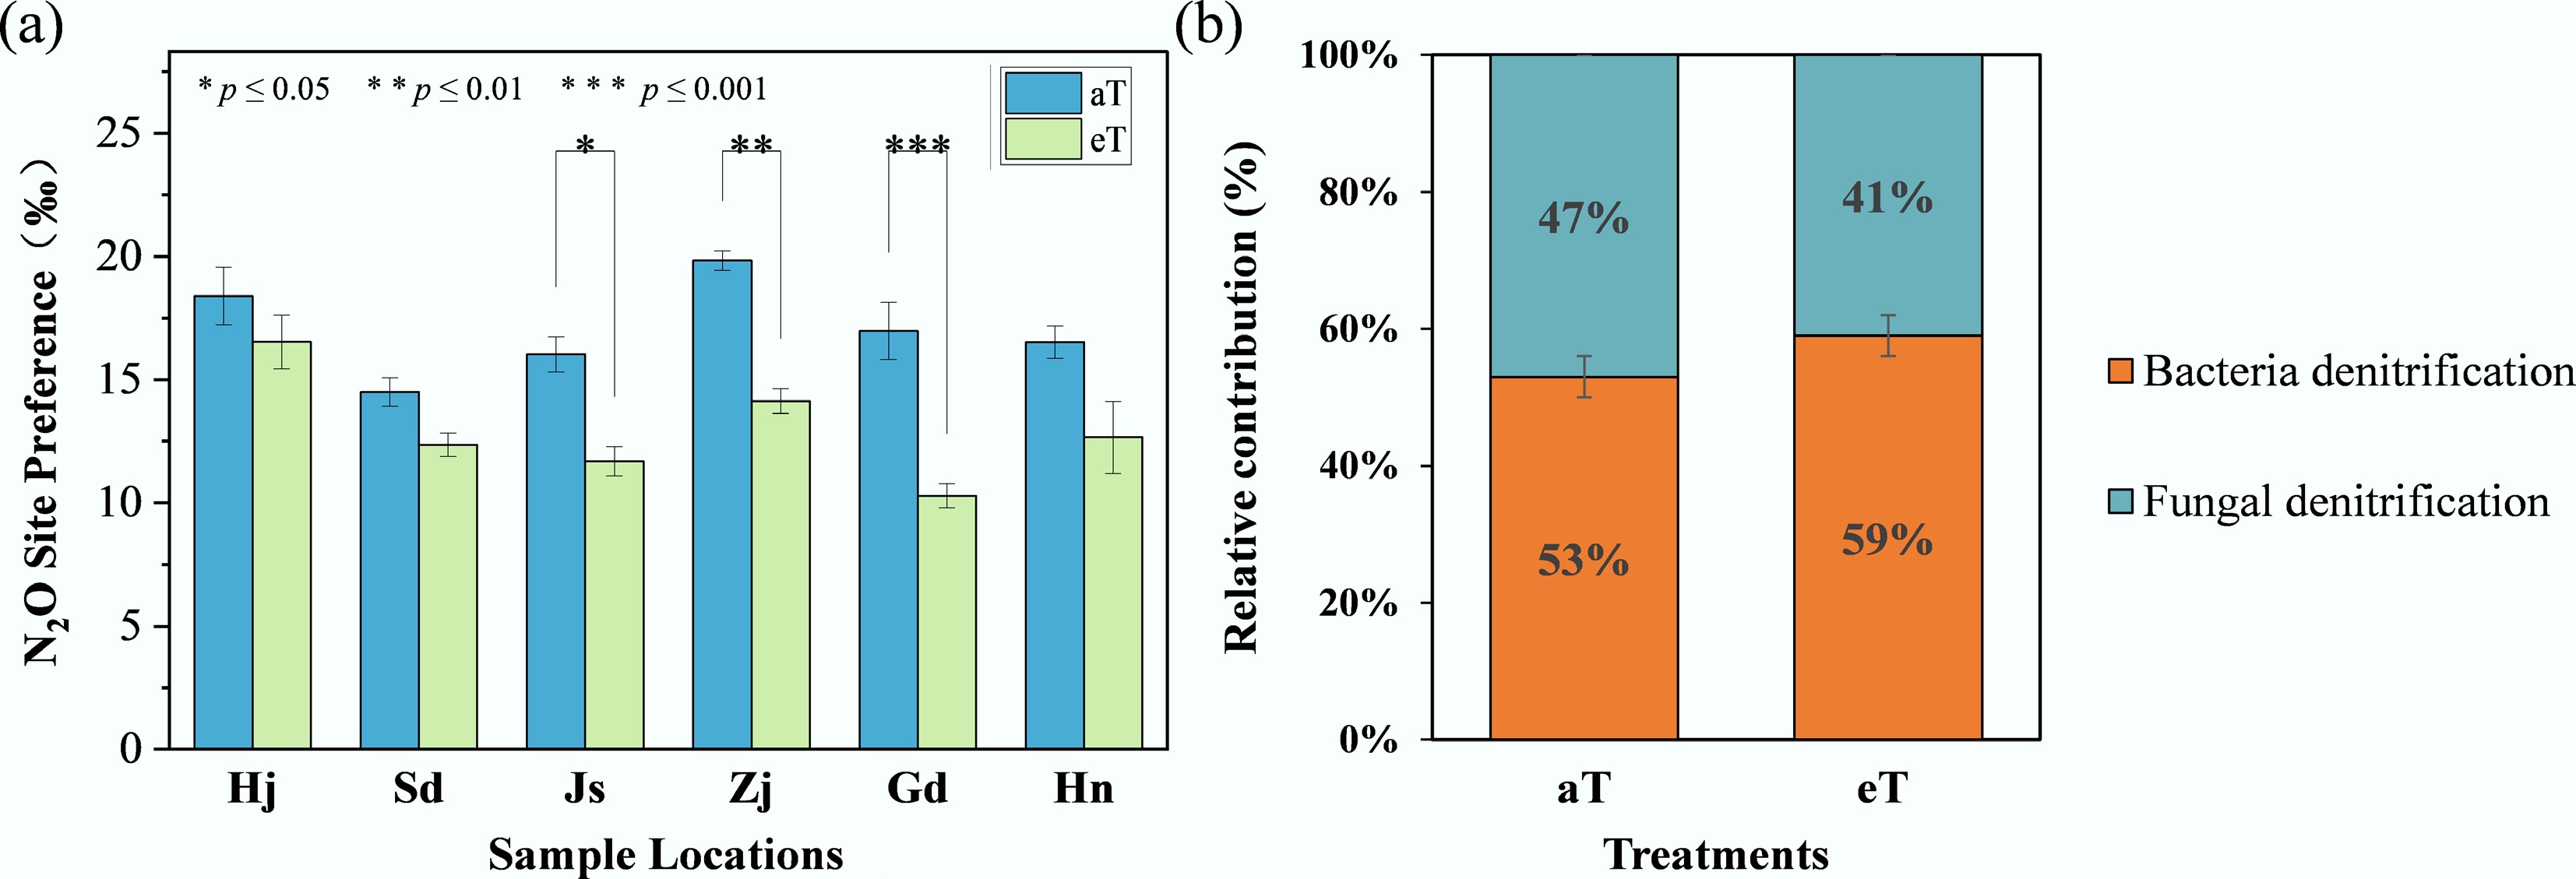
Figure 2.
(a) Response of local SP value to warming. (b) Relative contributions of bacterial and fungal denitrification. Three replicates of one soil sample were used for warming incubations. The level of significance is determined by two-sided t-test; * p < 0.05, ** p < 0.01, and *** p < 0.001.
-
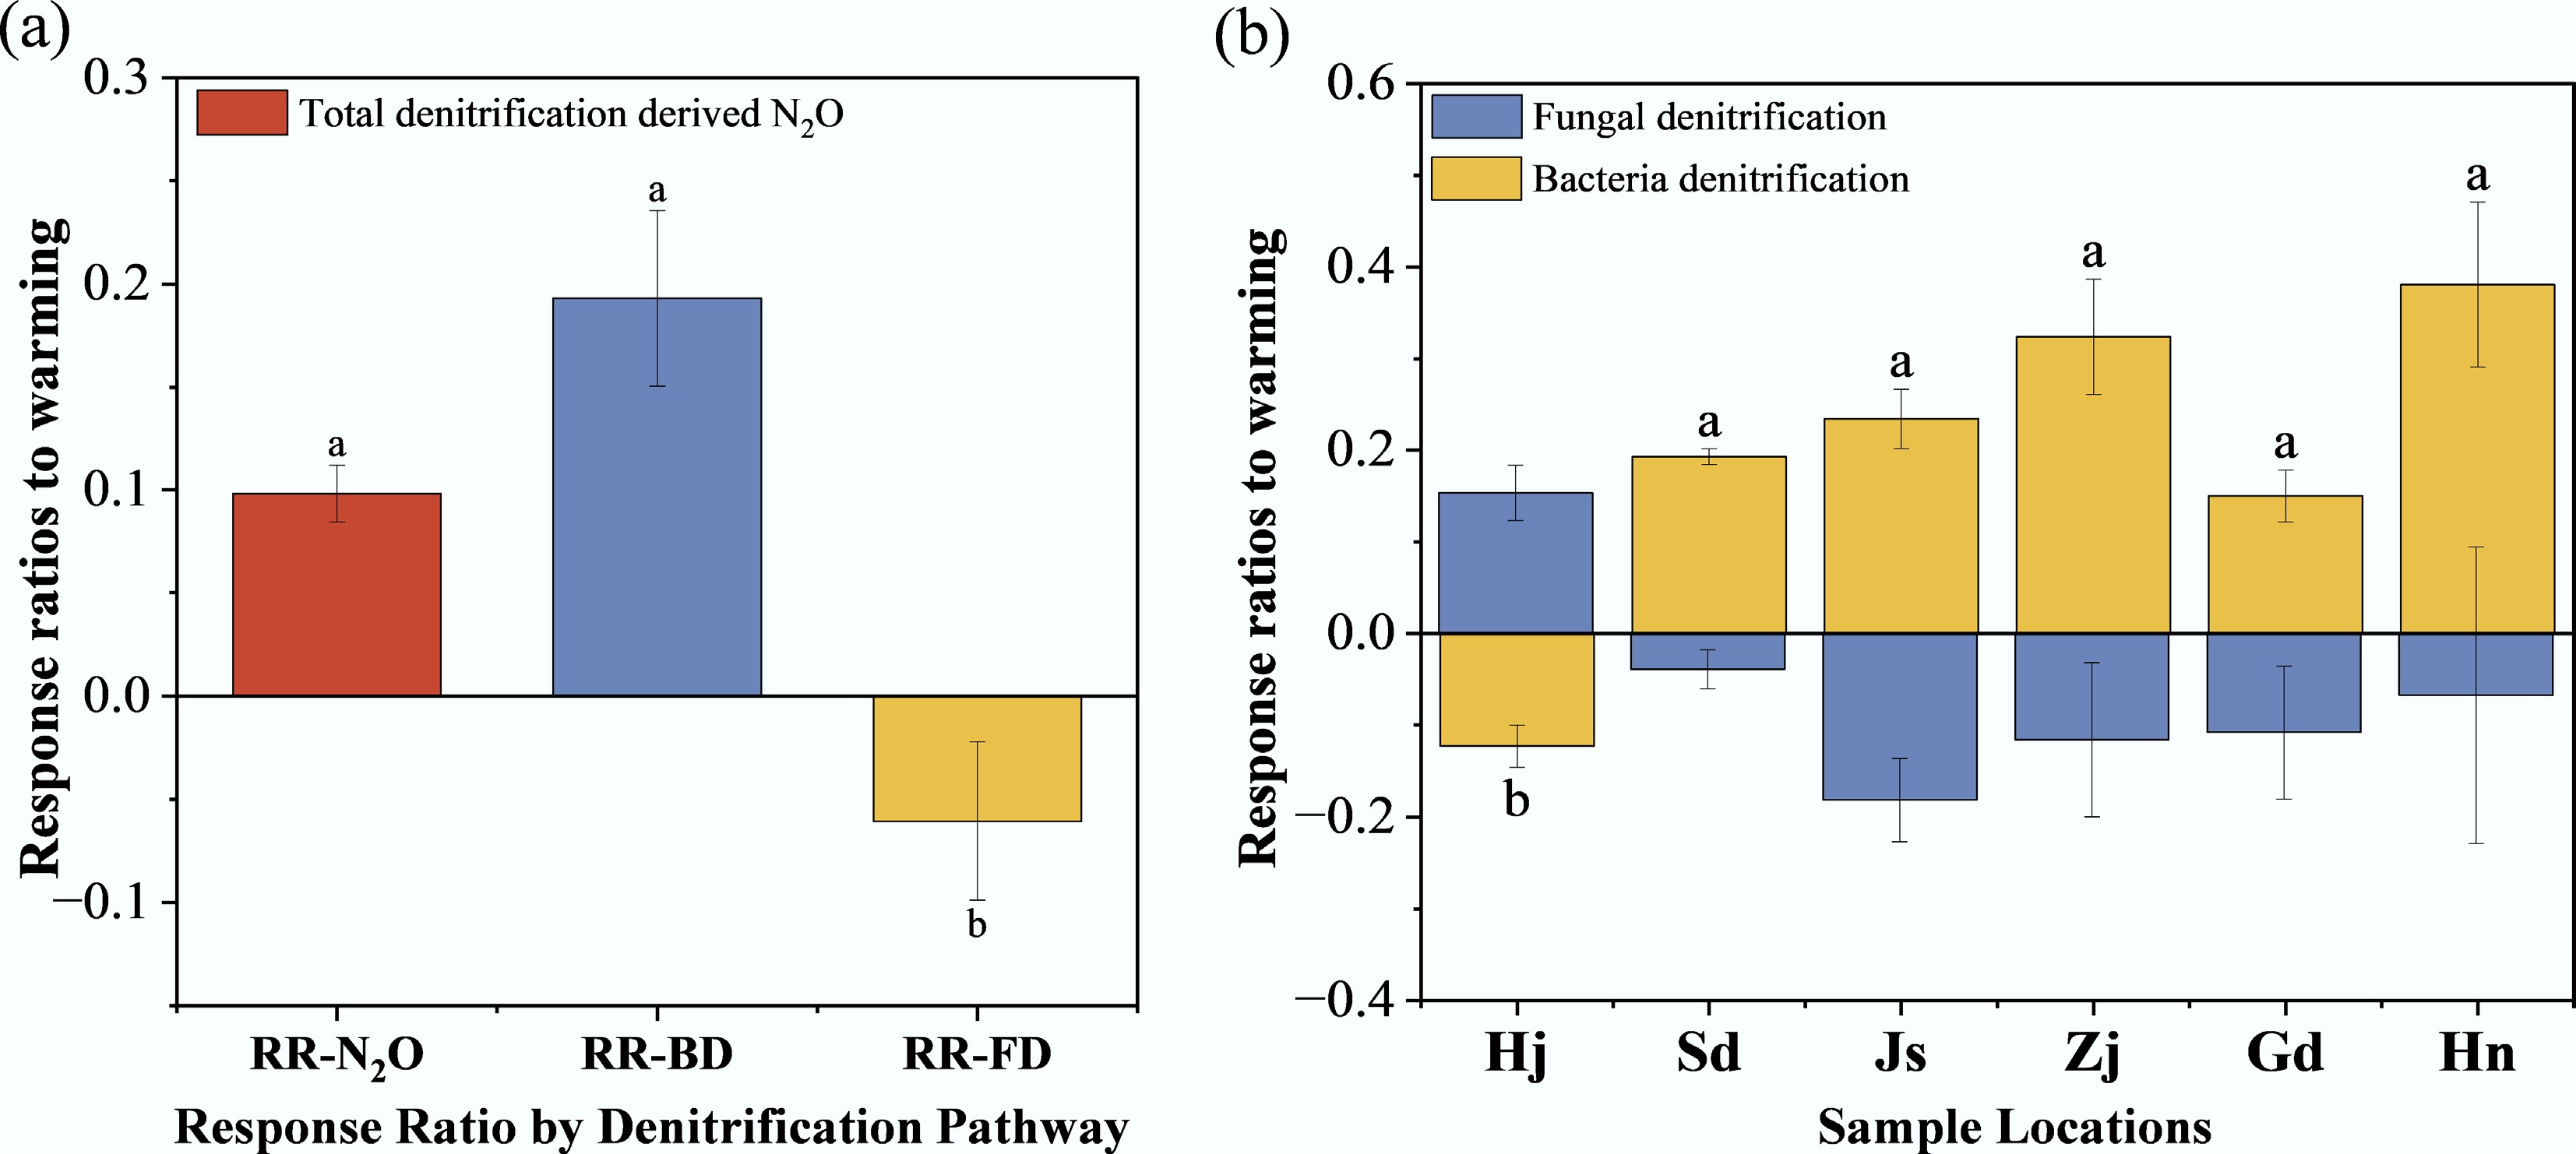
Figure 3.
(a), (b) Response ratios to warming. Different lowercase letters denote statistically significant differences (p < 0.05, Tukey's HSD test).
-
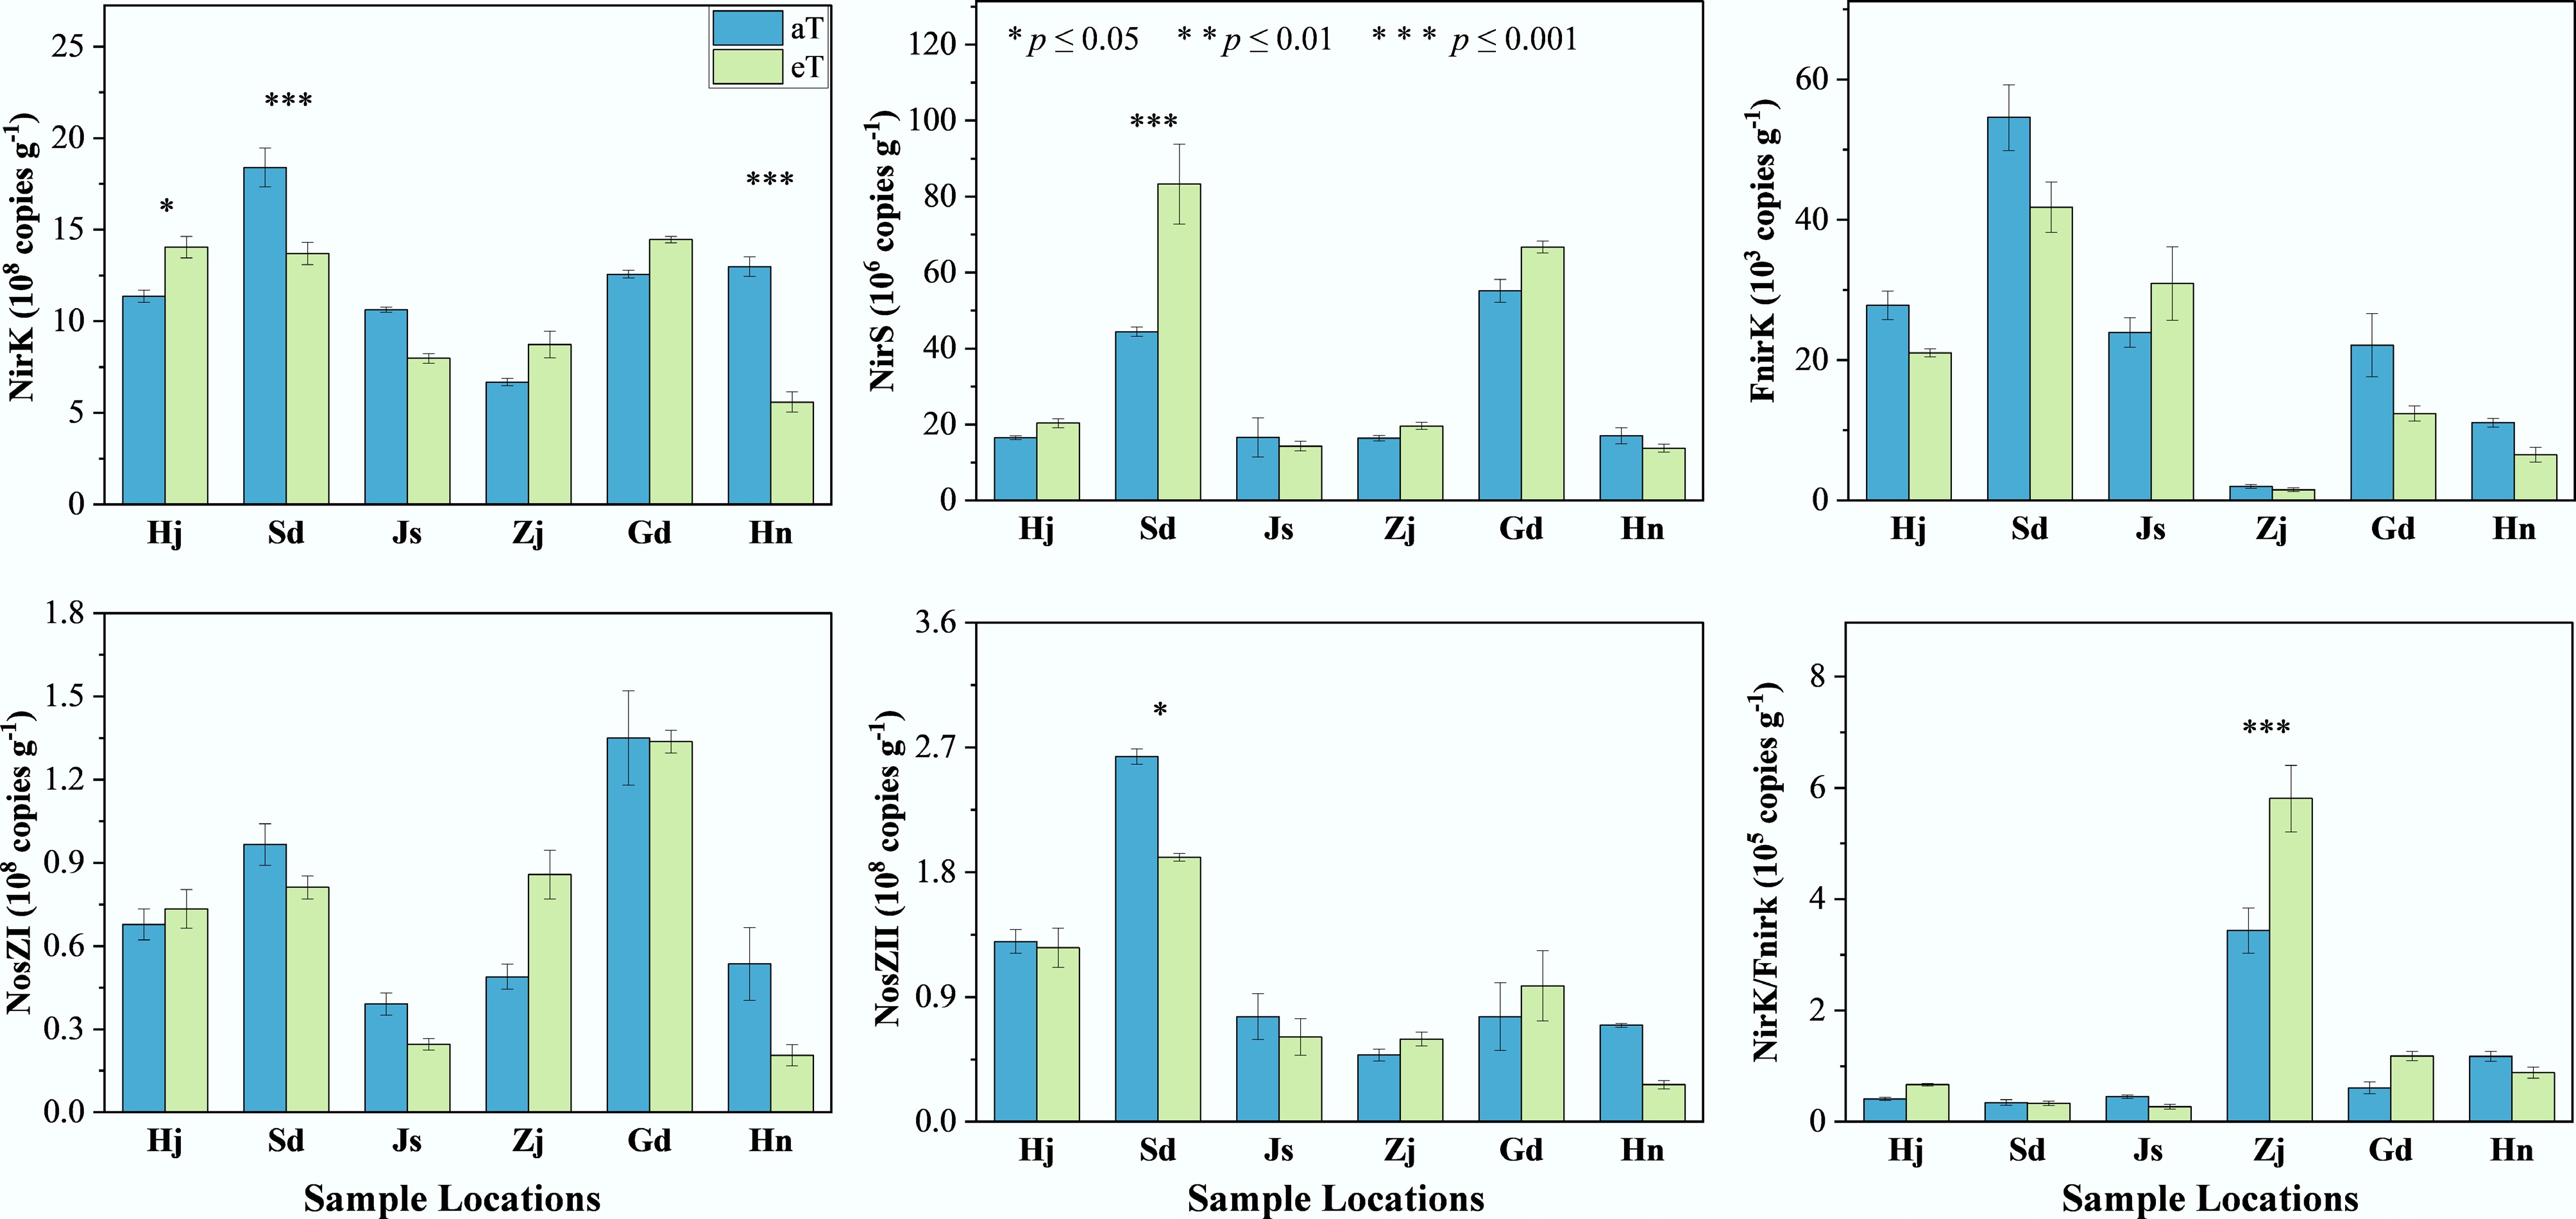
Figure 4.
Effects of warming on the abundance of denitrification function genes at different sampling sites. Three replicates of one soil sample were used for warming incubations. The level of significance is determined by two-sided t-test; * p < 0.05, ** p < 0.01, and *** p < 0.001.
-
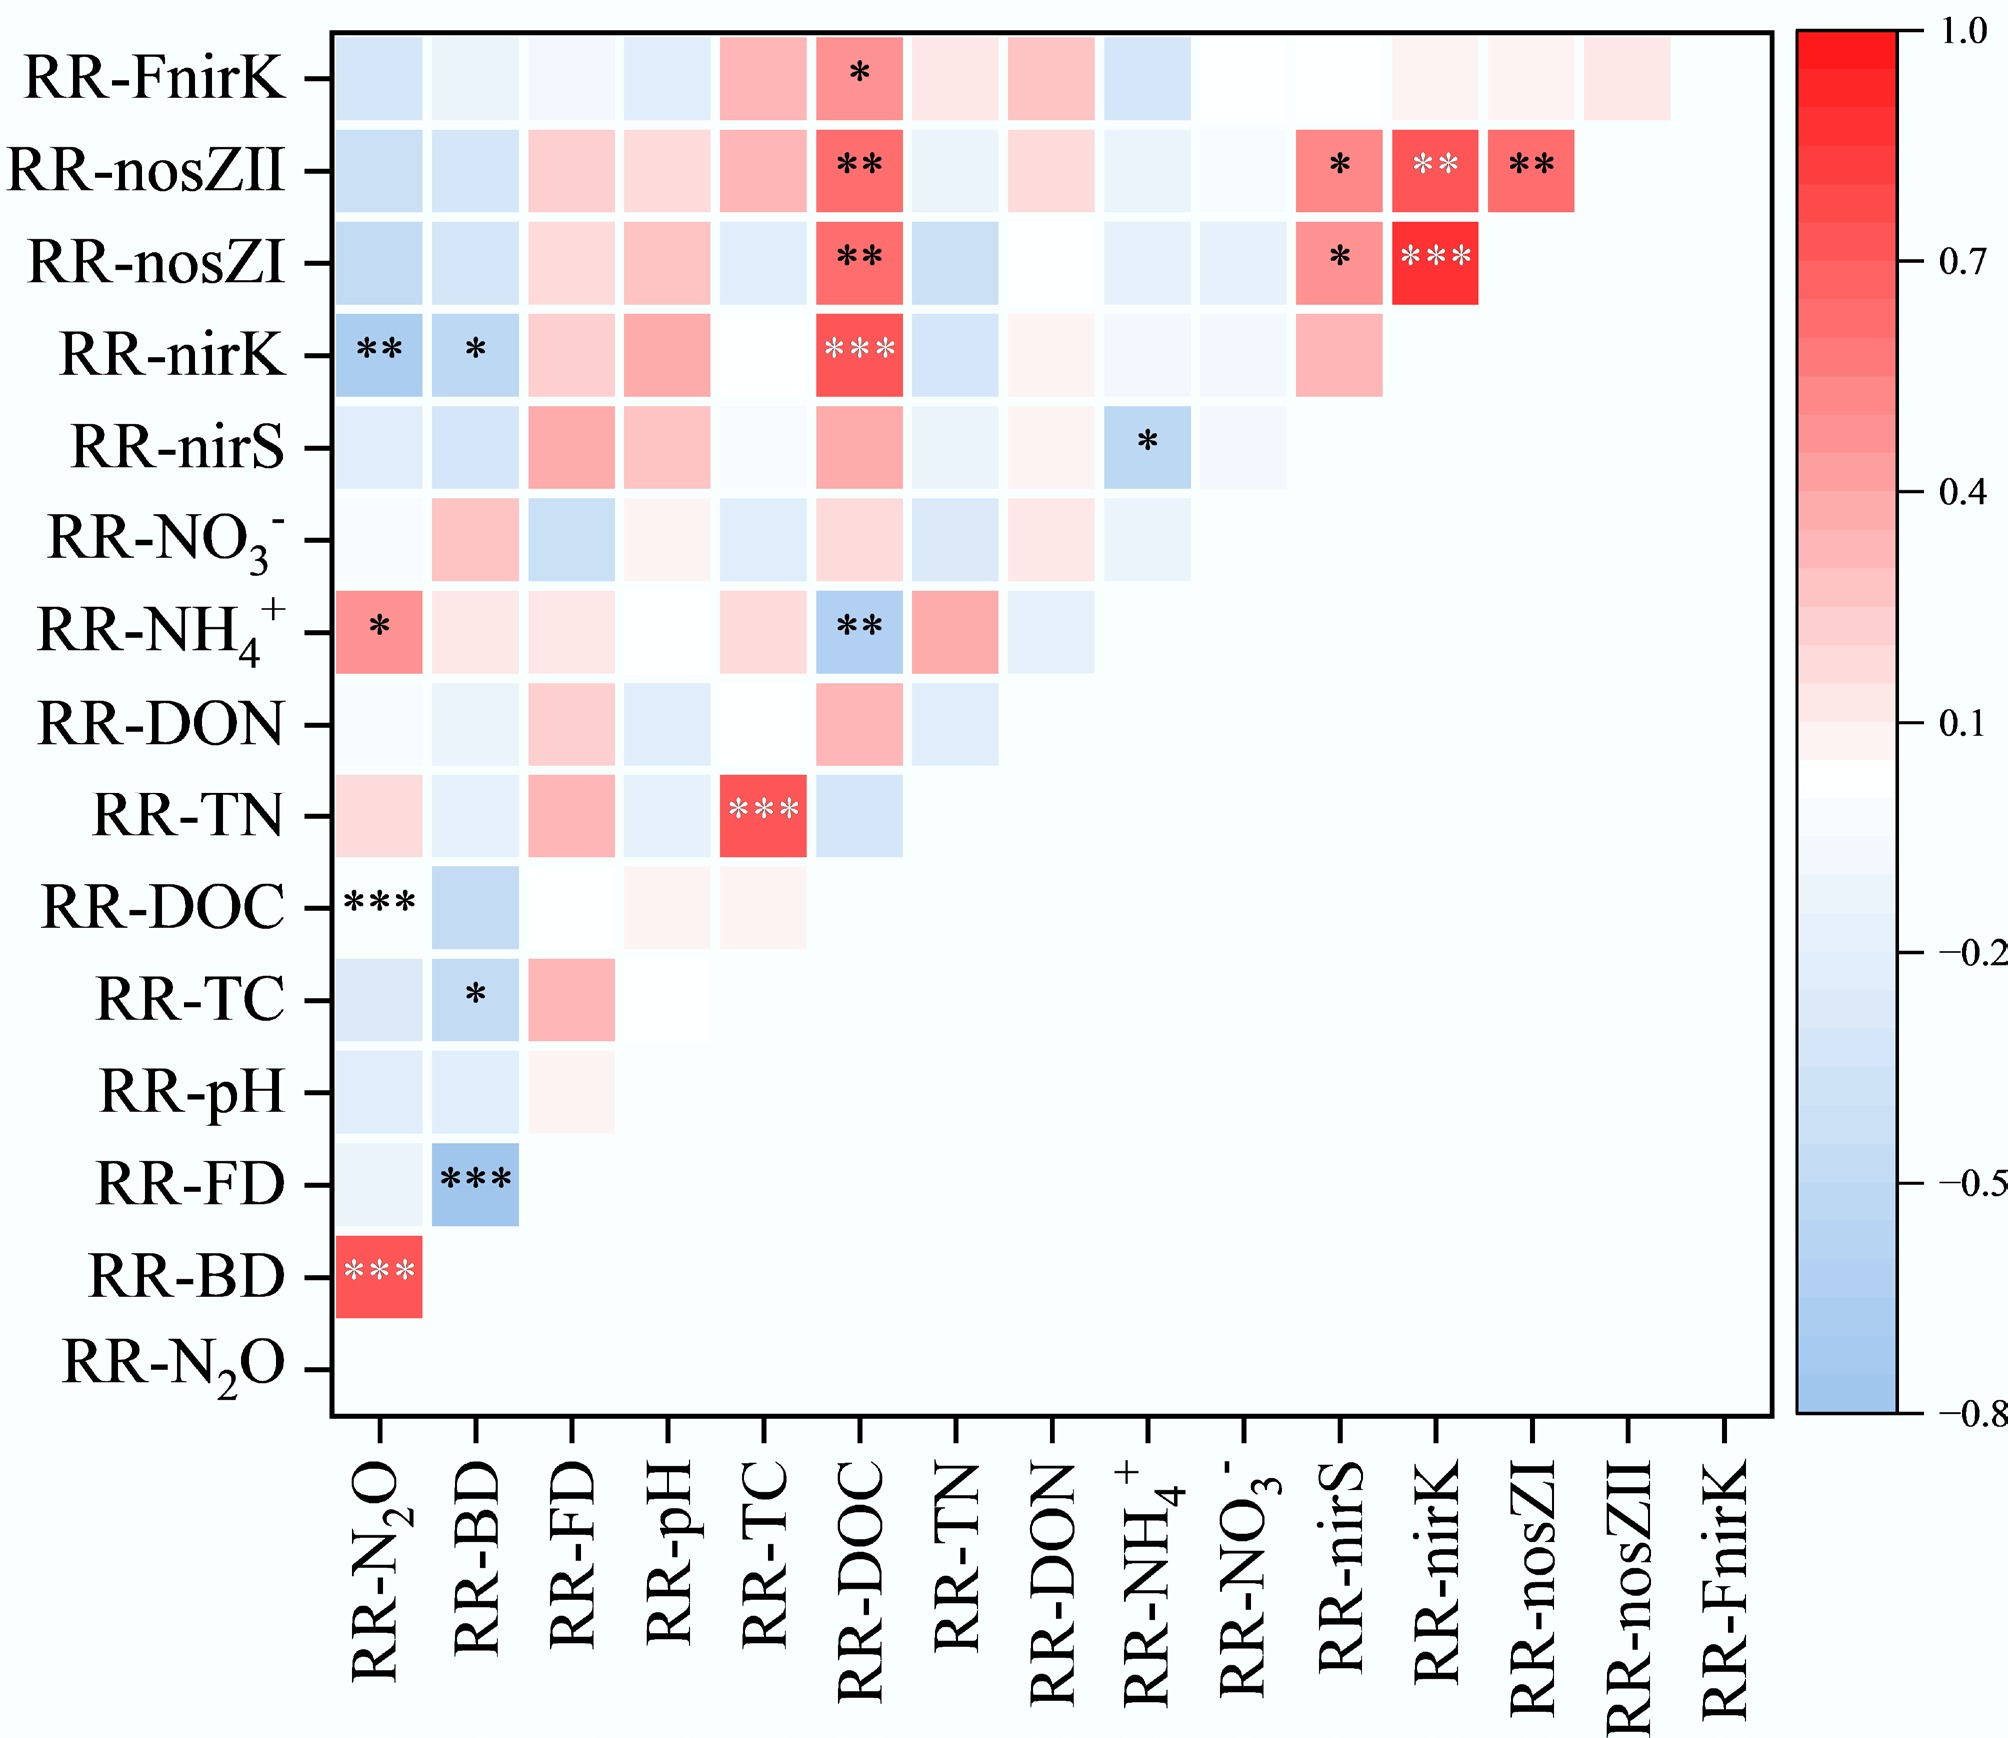
Figure 5.
Pearson correlation analysis between climate factors, soil properties, functional gene abundance, N2O production rates, and their response ratios. The correlation coefficients ranging from negative to positive are indicated by colour gradient from red to blue. The level of significance is determined by two-sided t-test; * p < 0.05, ** p < 0.01, and *** p < 0.001.
-
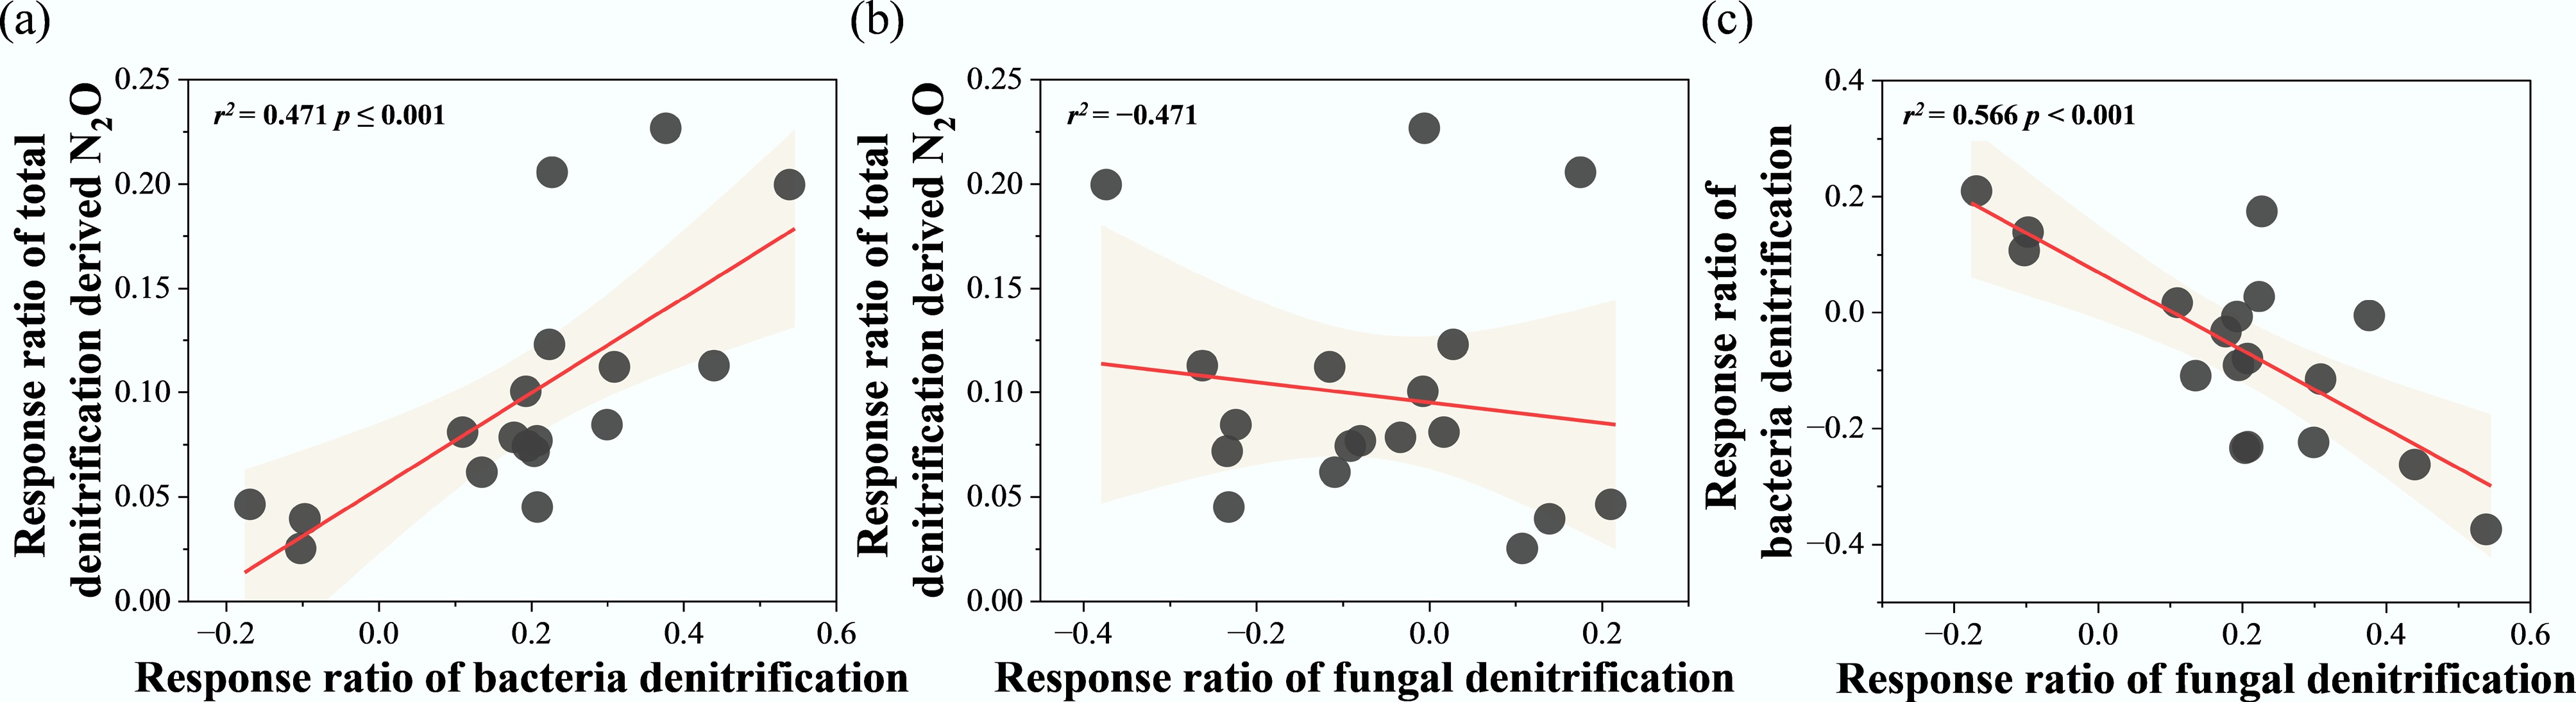
Figure 6.
Regression analysis between response ratio of total denitrification derived N2O (RR-N2O), response ratio of bacterial denitrification (RR-BD), and response ratio of fungal denitrification (RR-FD). * p < 0.05, ** p < 0.01, and *** p < 0.001.
-
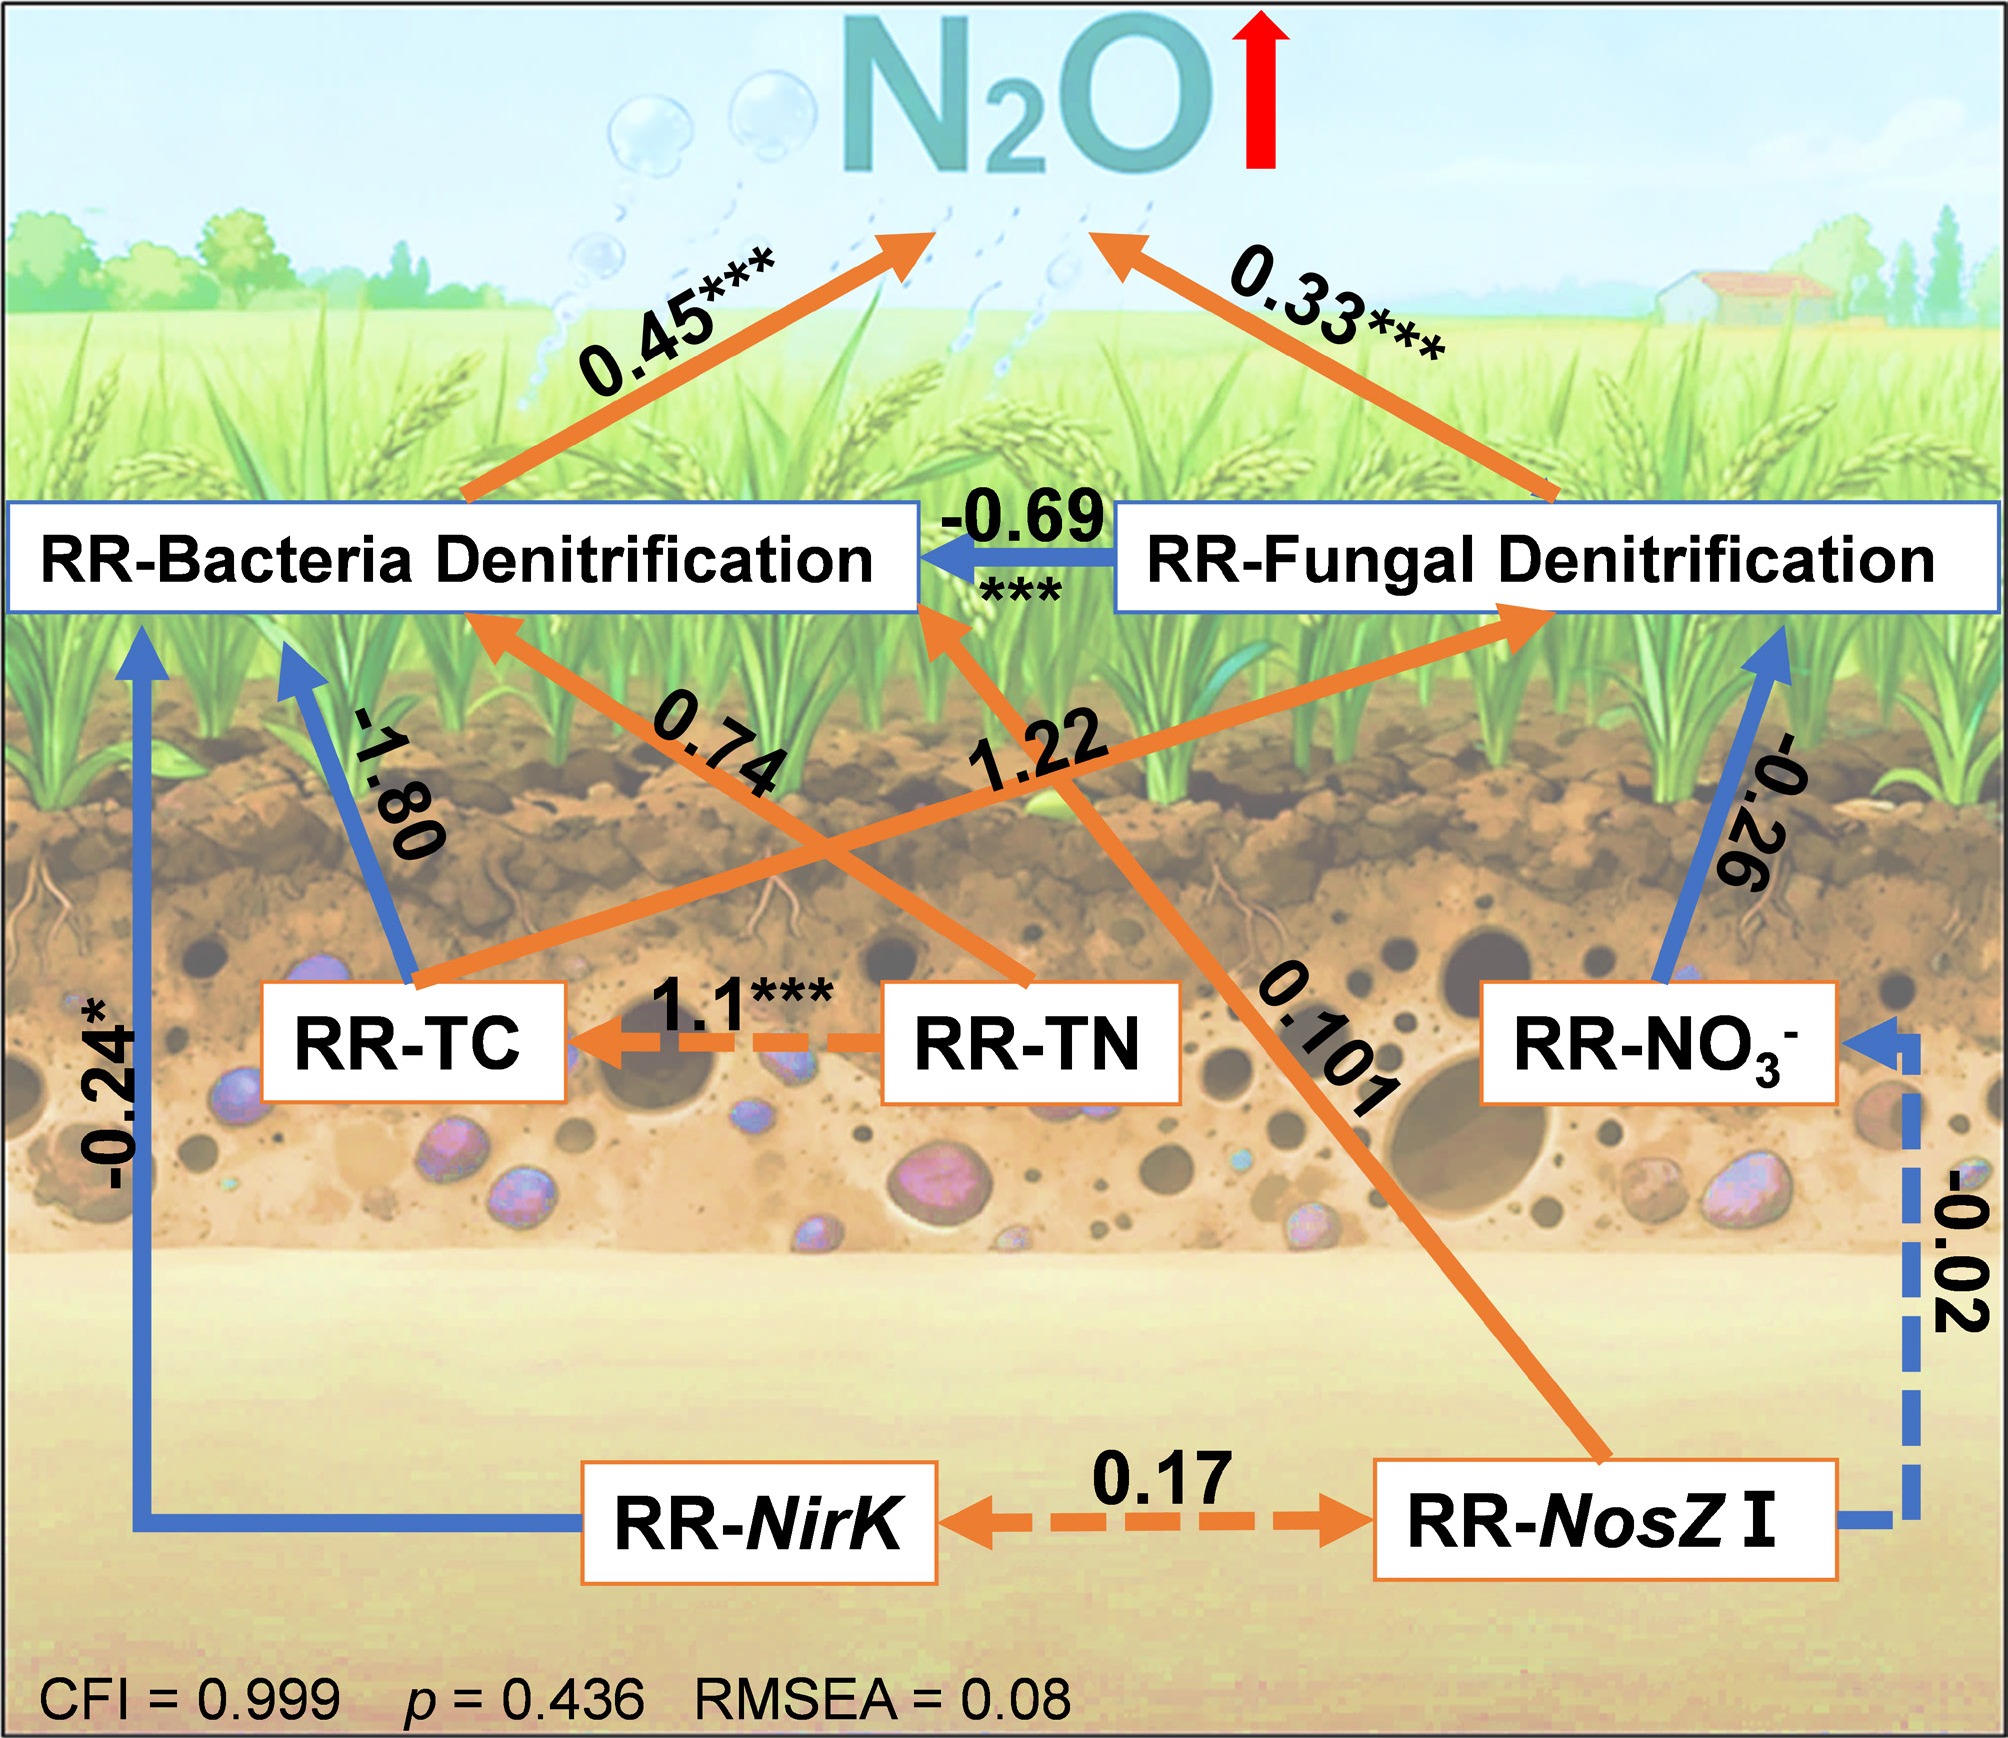
Figure 7.
Structural equation models illustrating the direct and indirect effects of selected variables on response ratios of RR-N2O. Red and blue arrows indicate positive and negative effects, respectively. Solid and dashed lines represent significant and nonsignificant paths, respectively. Numbers next to the arrows are standardized path coefficients (* p < 0.05, ** p < 0.01, and *** p < 0.001).
Figures
(7)
Tables
(0)