-
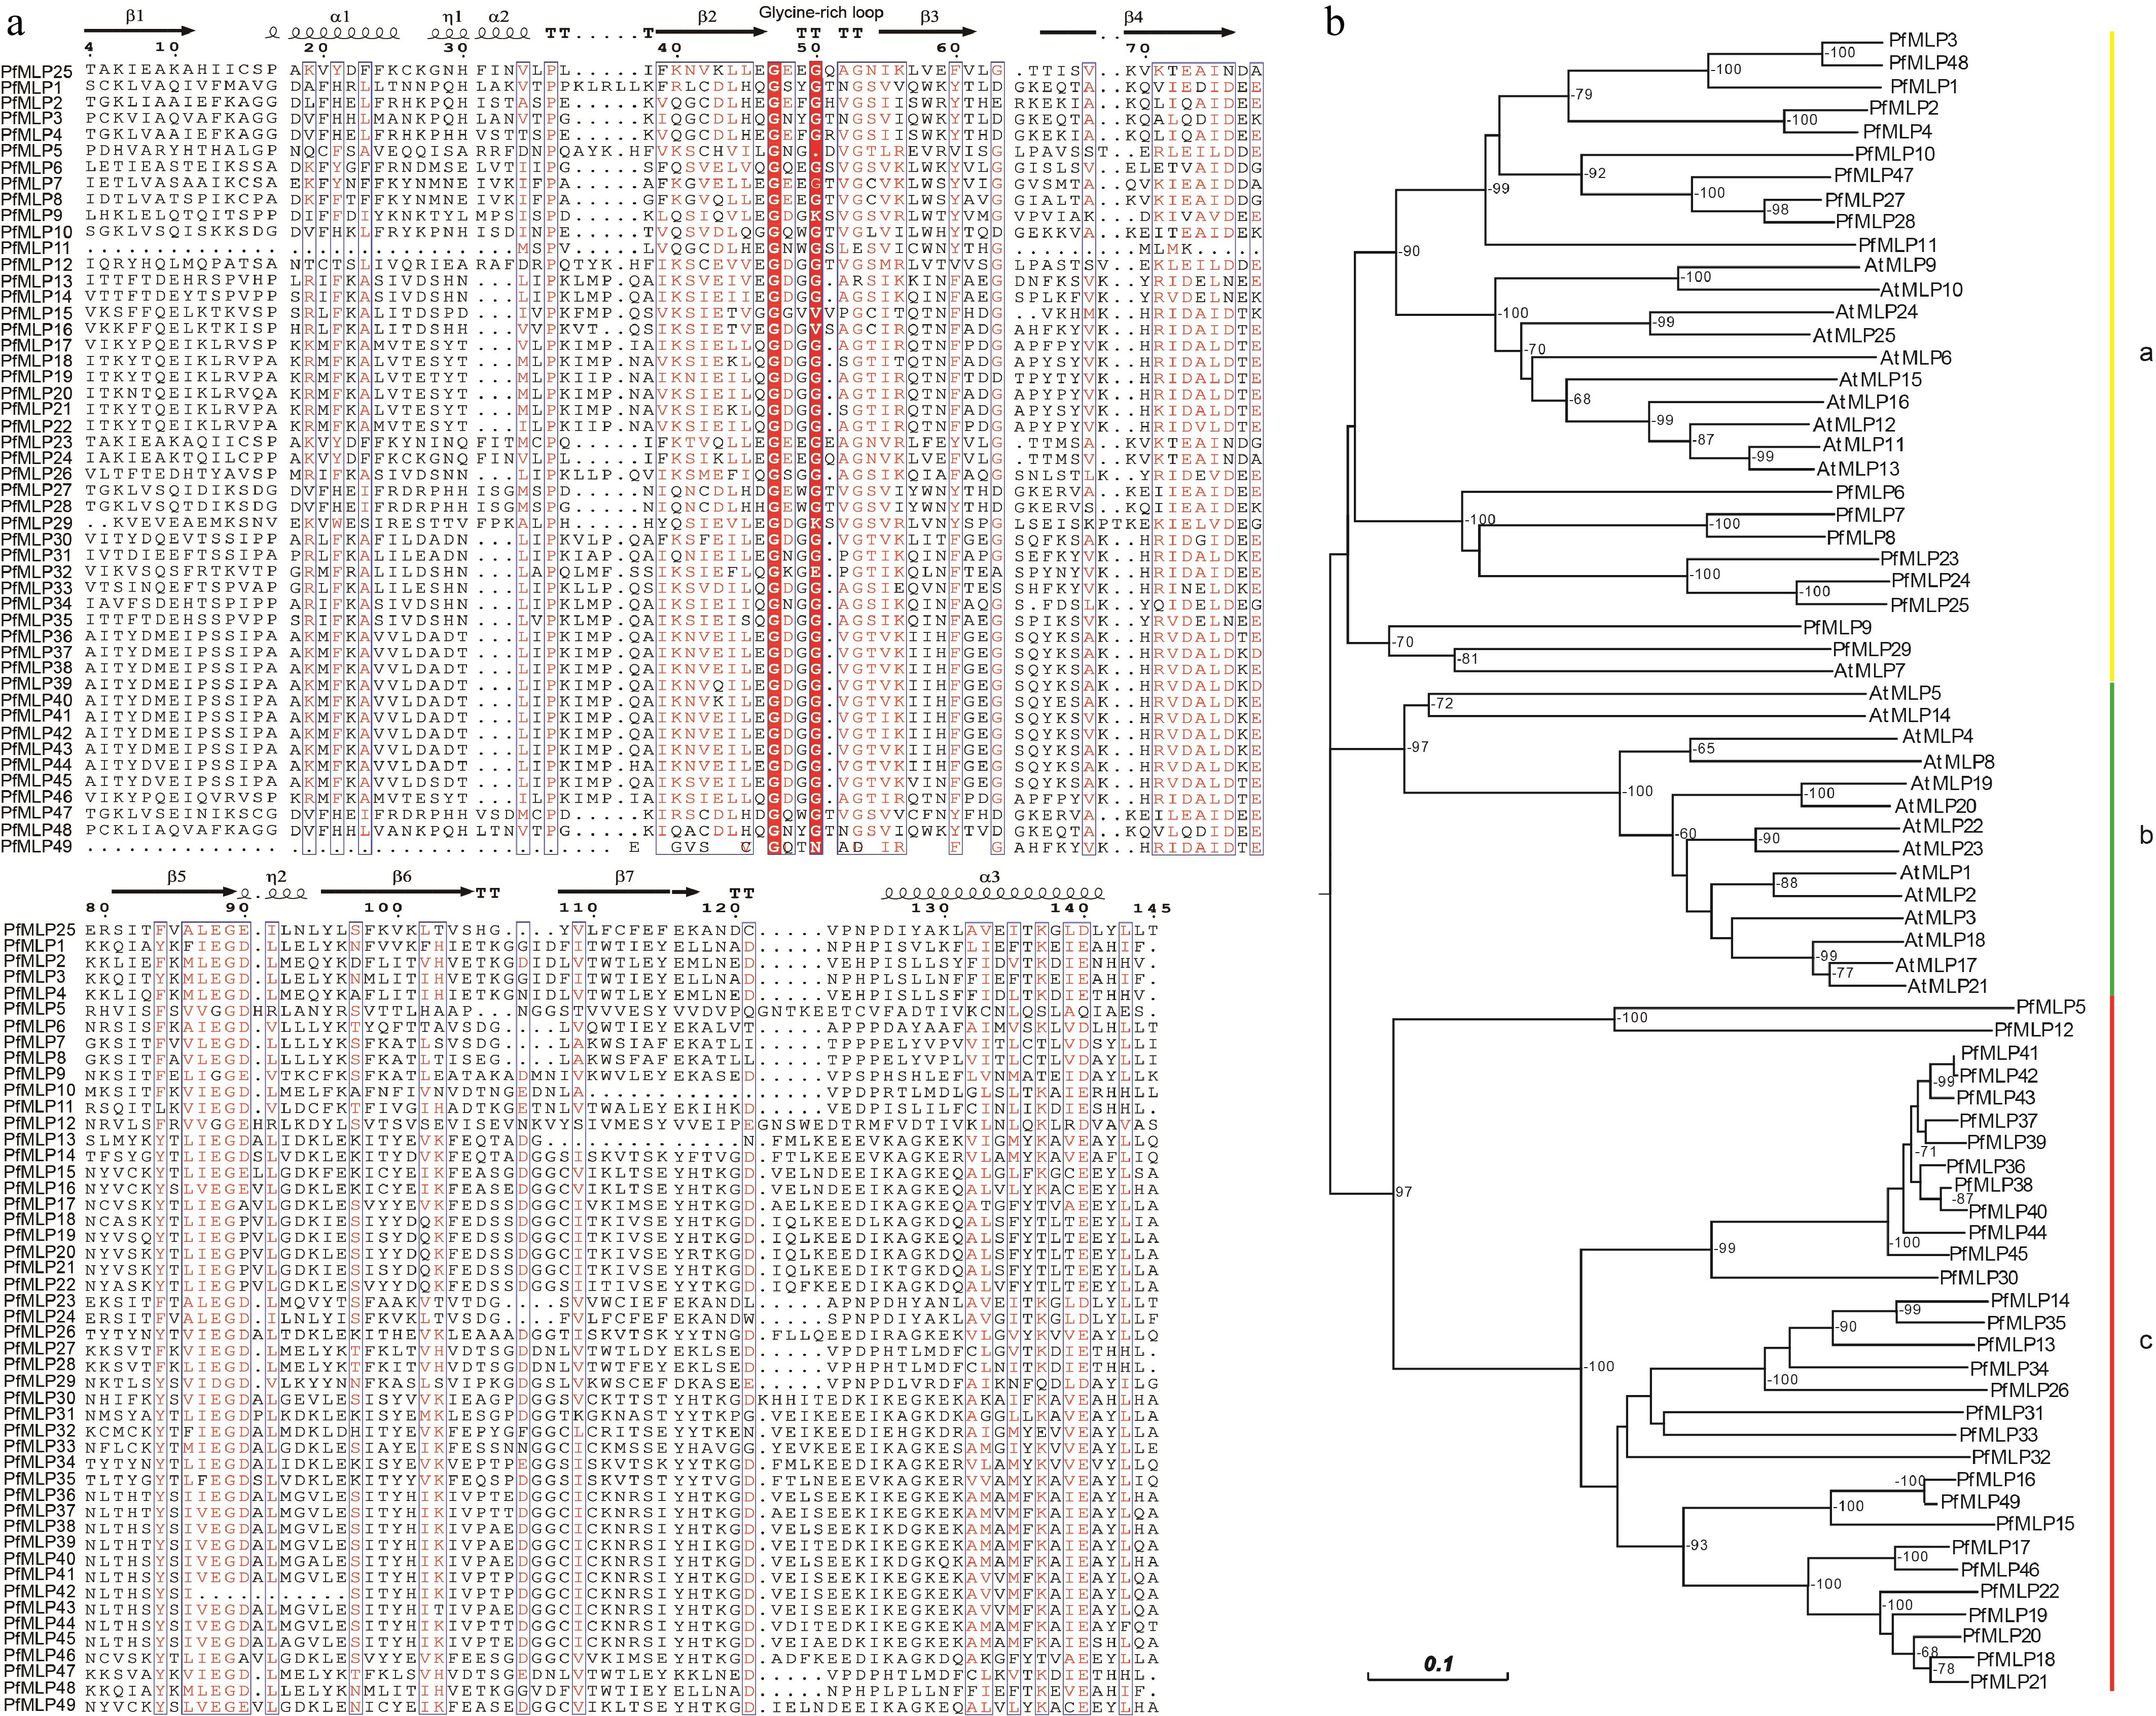
Figure 1.
Sequence features of PfMLPs in Paulownia and phylogenetic relationships with Arabidopsis. (a) The multiple sequence alignment of PfMLPs with typical Bet v1 domains and conserved sequence structures. (b) Phylogenetic relationships of MLP members between P. fortunei and A. thaliana. Bootstraps (> 60%) were indicated.
-
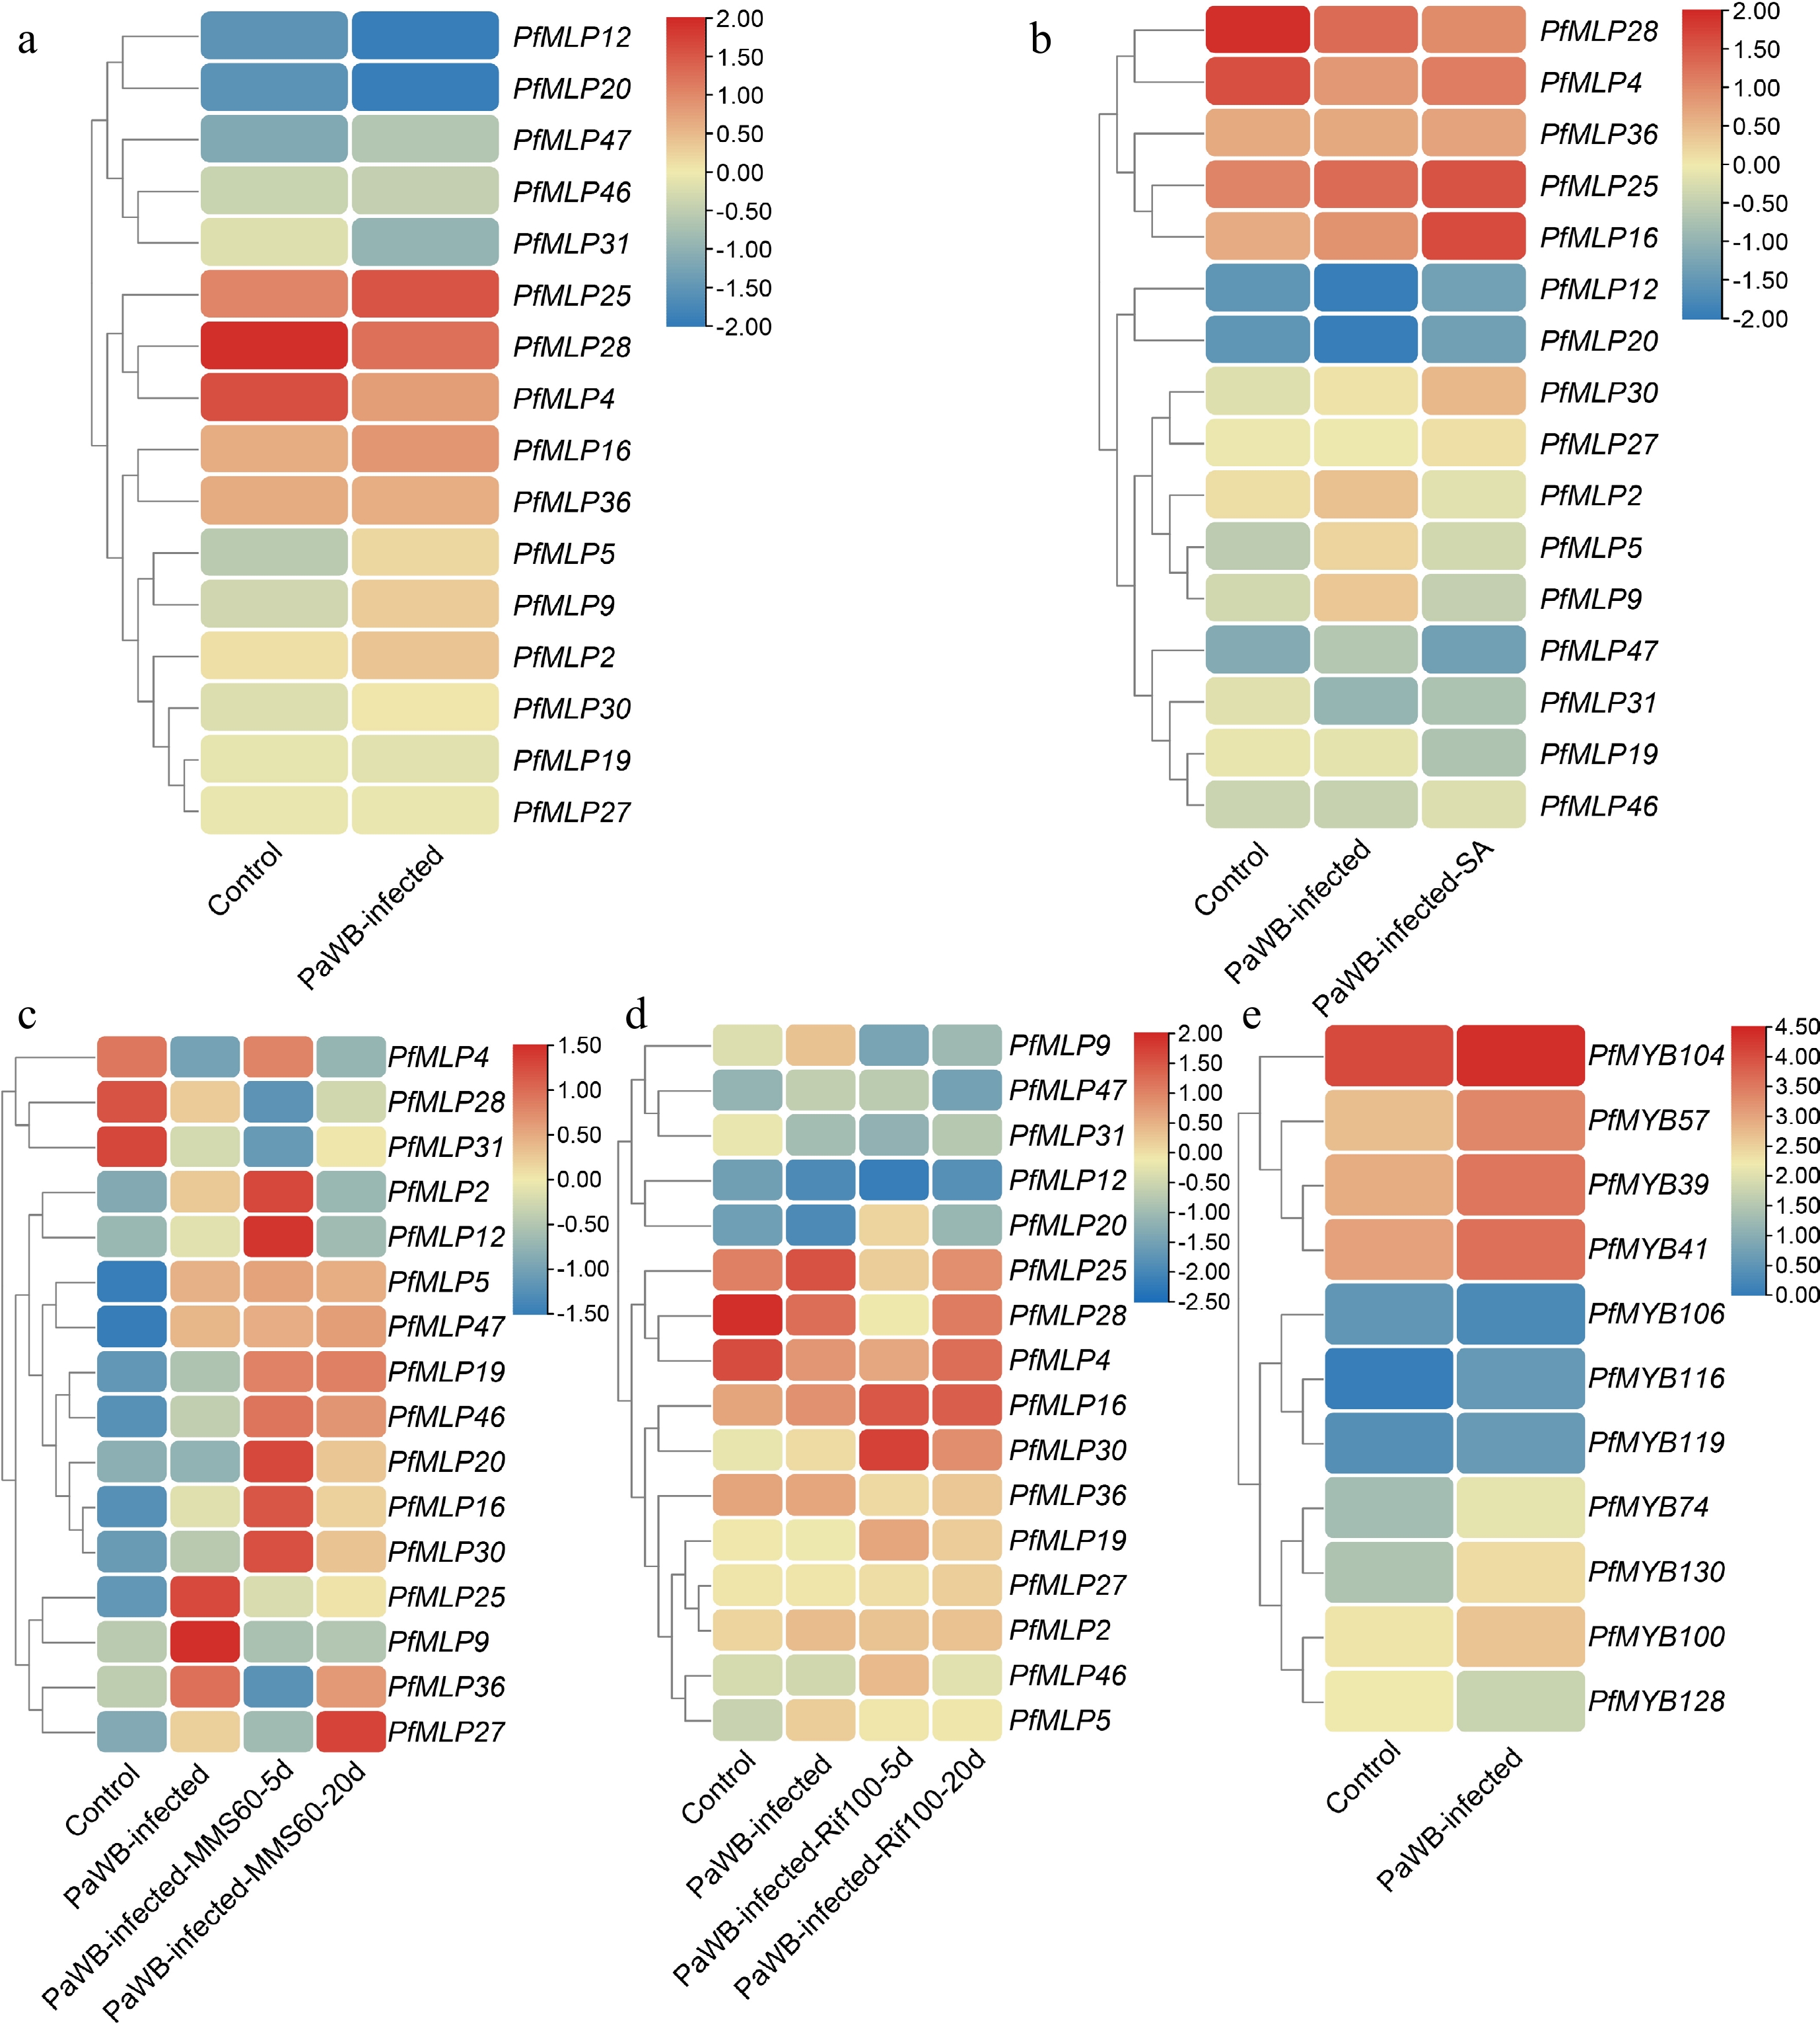
Figure 2.
Expression profiles of PfMLPs under phytoplasma infection and different treatments of PaWB phytoplasma inhibitors. (a) Differential expression patterns of PfMLPs in response to PaWB phytoplasma invasion. (b) Expression patterns of PfMLPs in response to PaWB phytoplasma infection under exogenous SA treatment. (c) Expression patterns of PfMLPs in response to PaWB phytoplasma infection under methyl methanesulfonate (MMS) treatment in PaWB-infected seedlings. Expression changes of PfMLPs were examined at 5 and 20 d post-treatment, respectively. (d) Expression patterns of PfMLPs in answering to PaWB phytoplasma infection under rifampicin (Rif) treatment in PaWB-infected seedlings. Expressional dynamics of PfMLPs were examined at 5 and 20 d post-treatment, respectively. (e) Differential expression patterns of PfMYBs under phytoplasma stress. Relative expression values were normalized, with the transcriptomics data range colored from low (blue) to high (red).
-
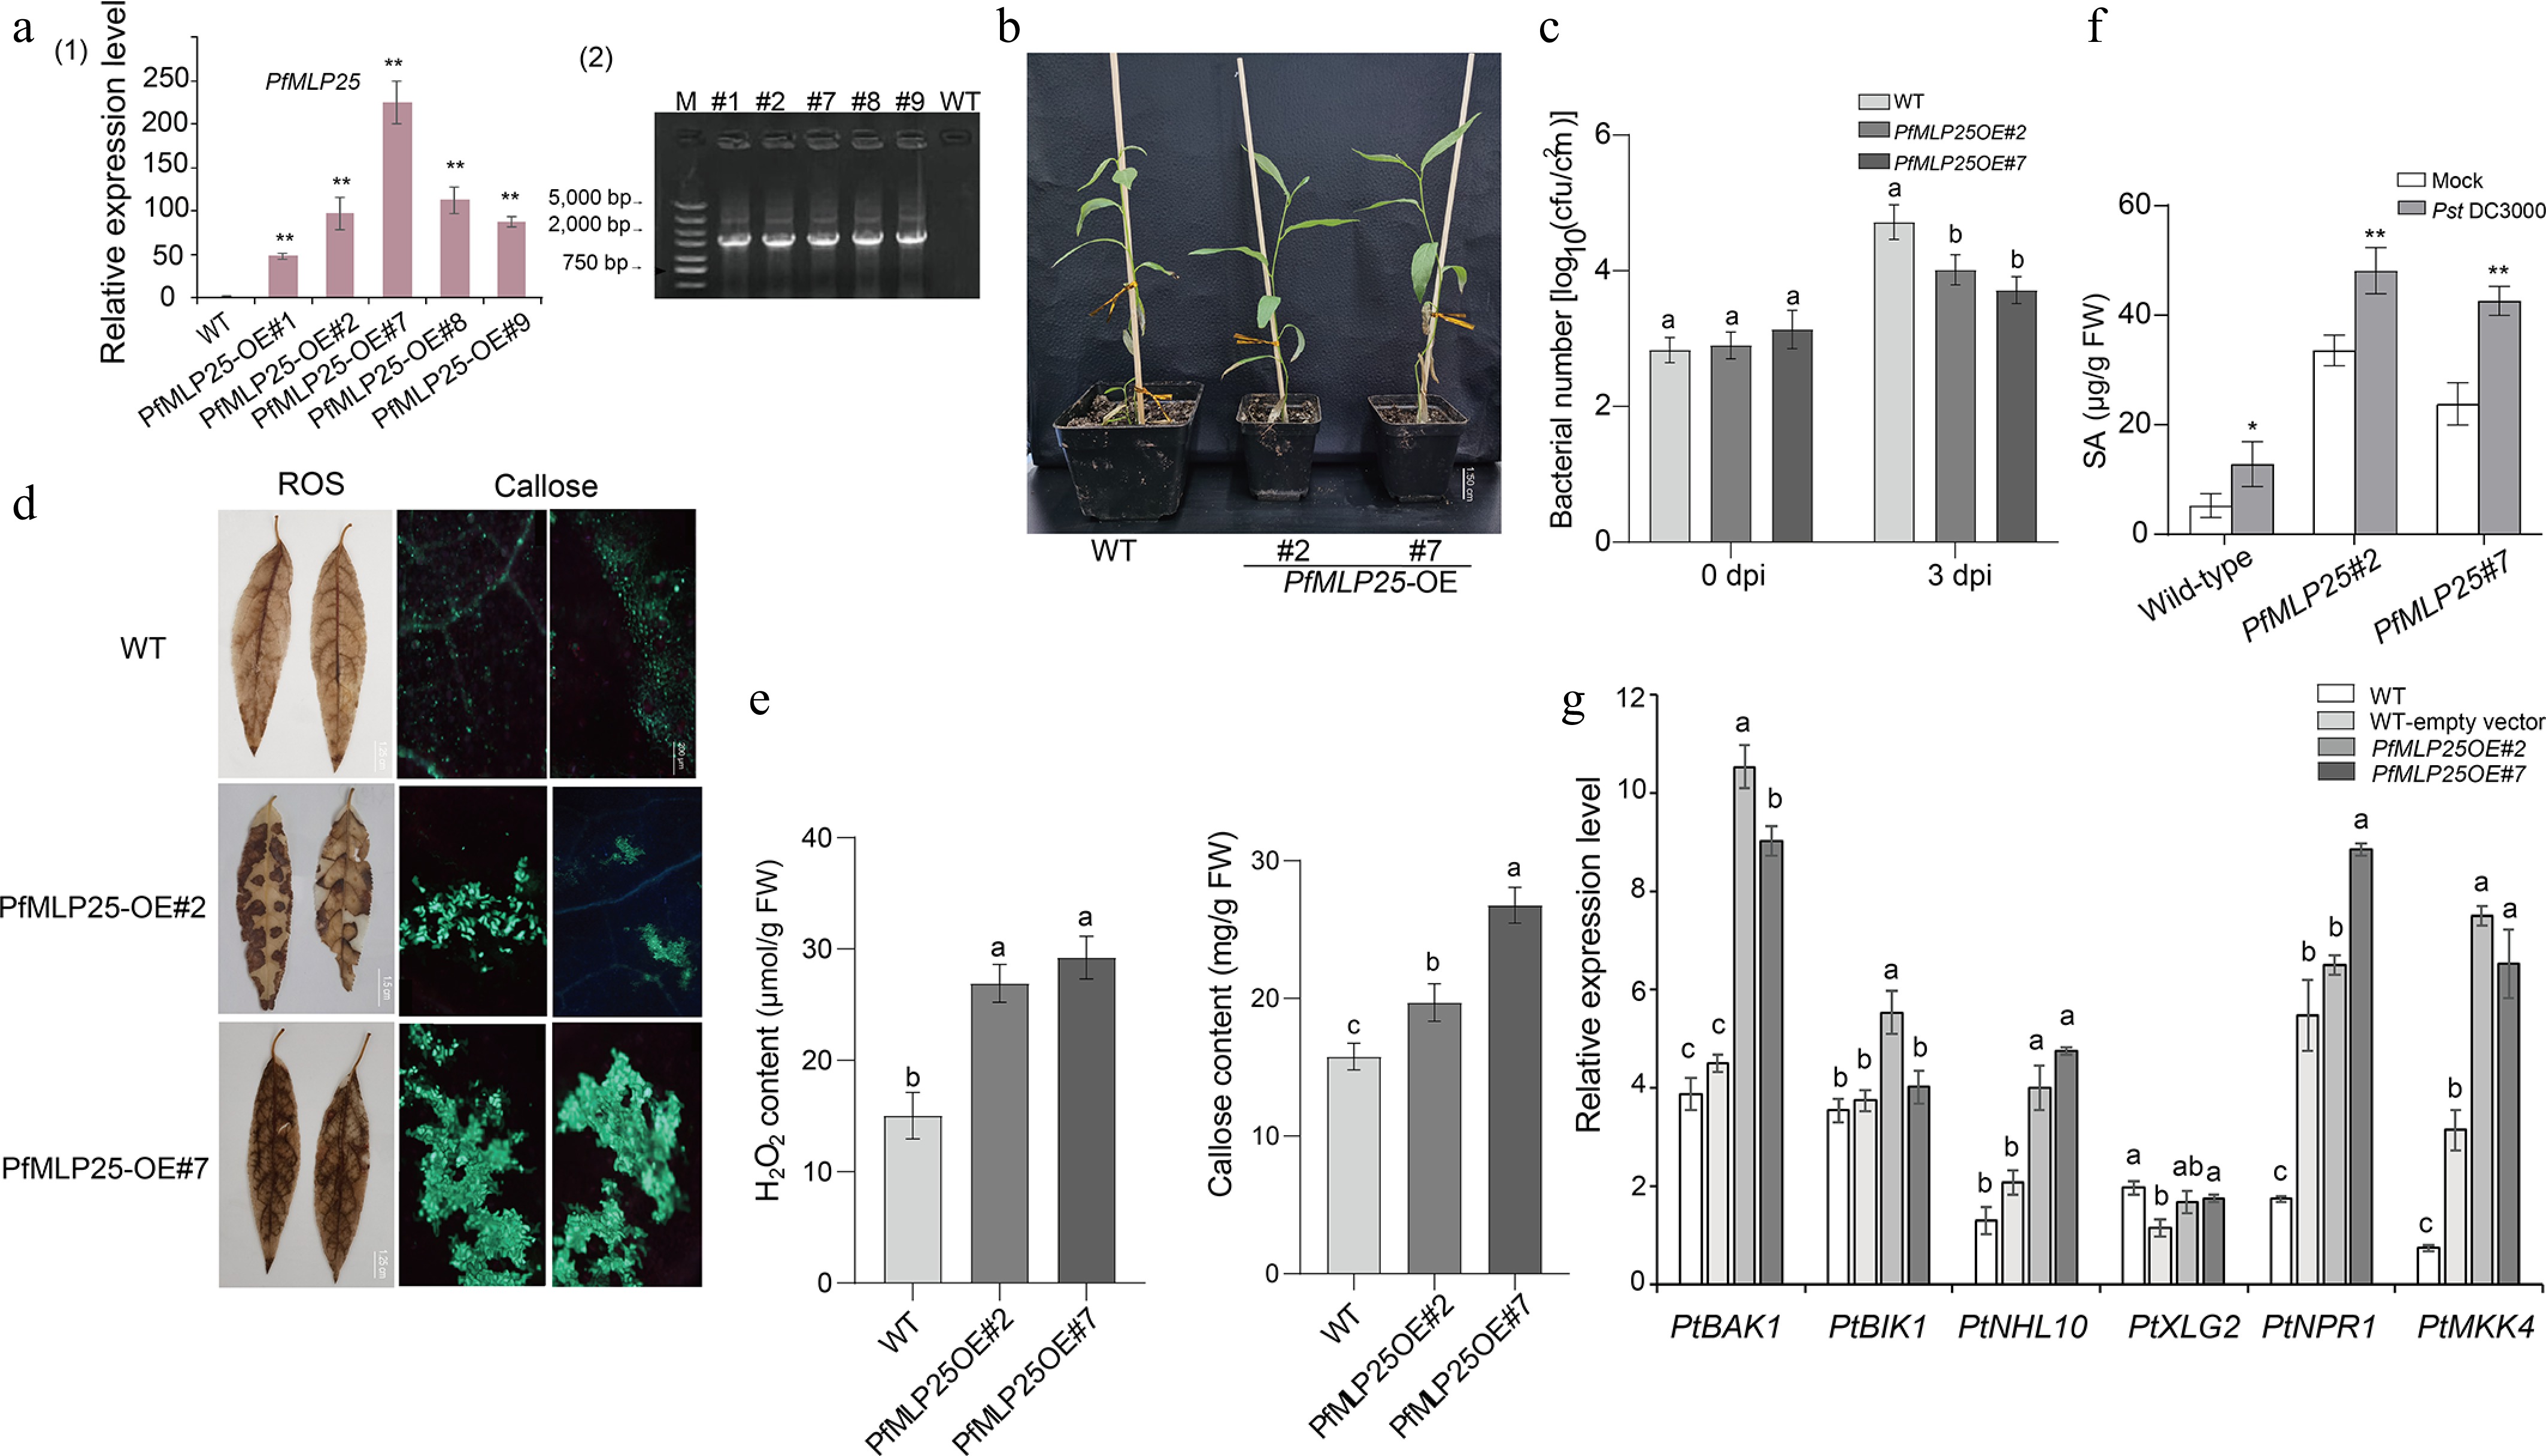
Figure 3.
Heterologous overexpression of PfMLP25 in poplar enhanced pathogen resistance in the transgenic lines. (a) Transcriptional changes in PfMLP25 across different PfMLP25-overexpressing poplar lines (#1, #2, #7, #8, and #9) compared to the wild type (WT), with data generated from three technical replicates and statistical significance determined (* p < 0.05, ** p < 0.01) (1) and PCR validated positive transformants (2). (b) Phenotypes of transformants #2 and #7 did not exhibit visible difference with WT. (c) Growth rates of Pst DC3000 bacterial in infected leaves of transformants and WT. Leaves of 5-week-old poplars seedlings from transformants #2, #7 and WT were infiltrated with suspensions of Pst DC3000, and bacterial numbers were assessed at 0 and 3 dpi (day post inoculation). (d) Enhancement of H2O2 accumulation and callose deposition in transformants poplar leaves. Transformants' leaves (OE#2 and OE#7) were treated with 3,3'-diaminobenzidine after they were infiltrated with suspensions of Pst DC3000 for 72 h. Two transformants (OE#2, OE#7) exhibited higher contents of H2O2 indicated by brown insoluble polymer and more callose deposition indicated by bright-blue spots, which were generated from treatments of the stain aniline blue and imaged under bright-field UV, Bar = 200 μm. (e) Comparisons of quantified H2O2 and callose contents between transformants and WT. (f) The endogenous SA content in WT and over-expressed transformants plants inoculated with Pst DC3000 or mock-treated (water). Bar chart represents mean ± SE (n = 3 biological replicates of six plants for each plant line and treatment), with statistical significance (* p < 0.05, ** p < 0.01). (g) Expressional comparisons of defense-related marker genes between transformants and WT using a qRT-PCR technique. Data presented were means of triple repeats with standard deviation (n = 3). Each biological replicate consisted of pooled samples from three leaves. The normality of the data was assessed using a Q-Q plot. The letters denote statistical significance differences as determined by one-way ANOVA (p < 0.05).
-
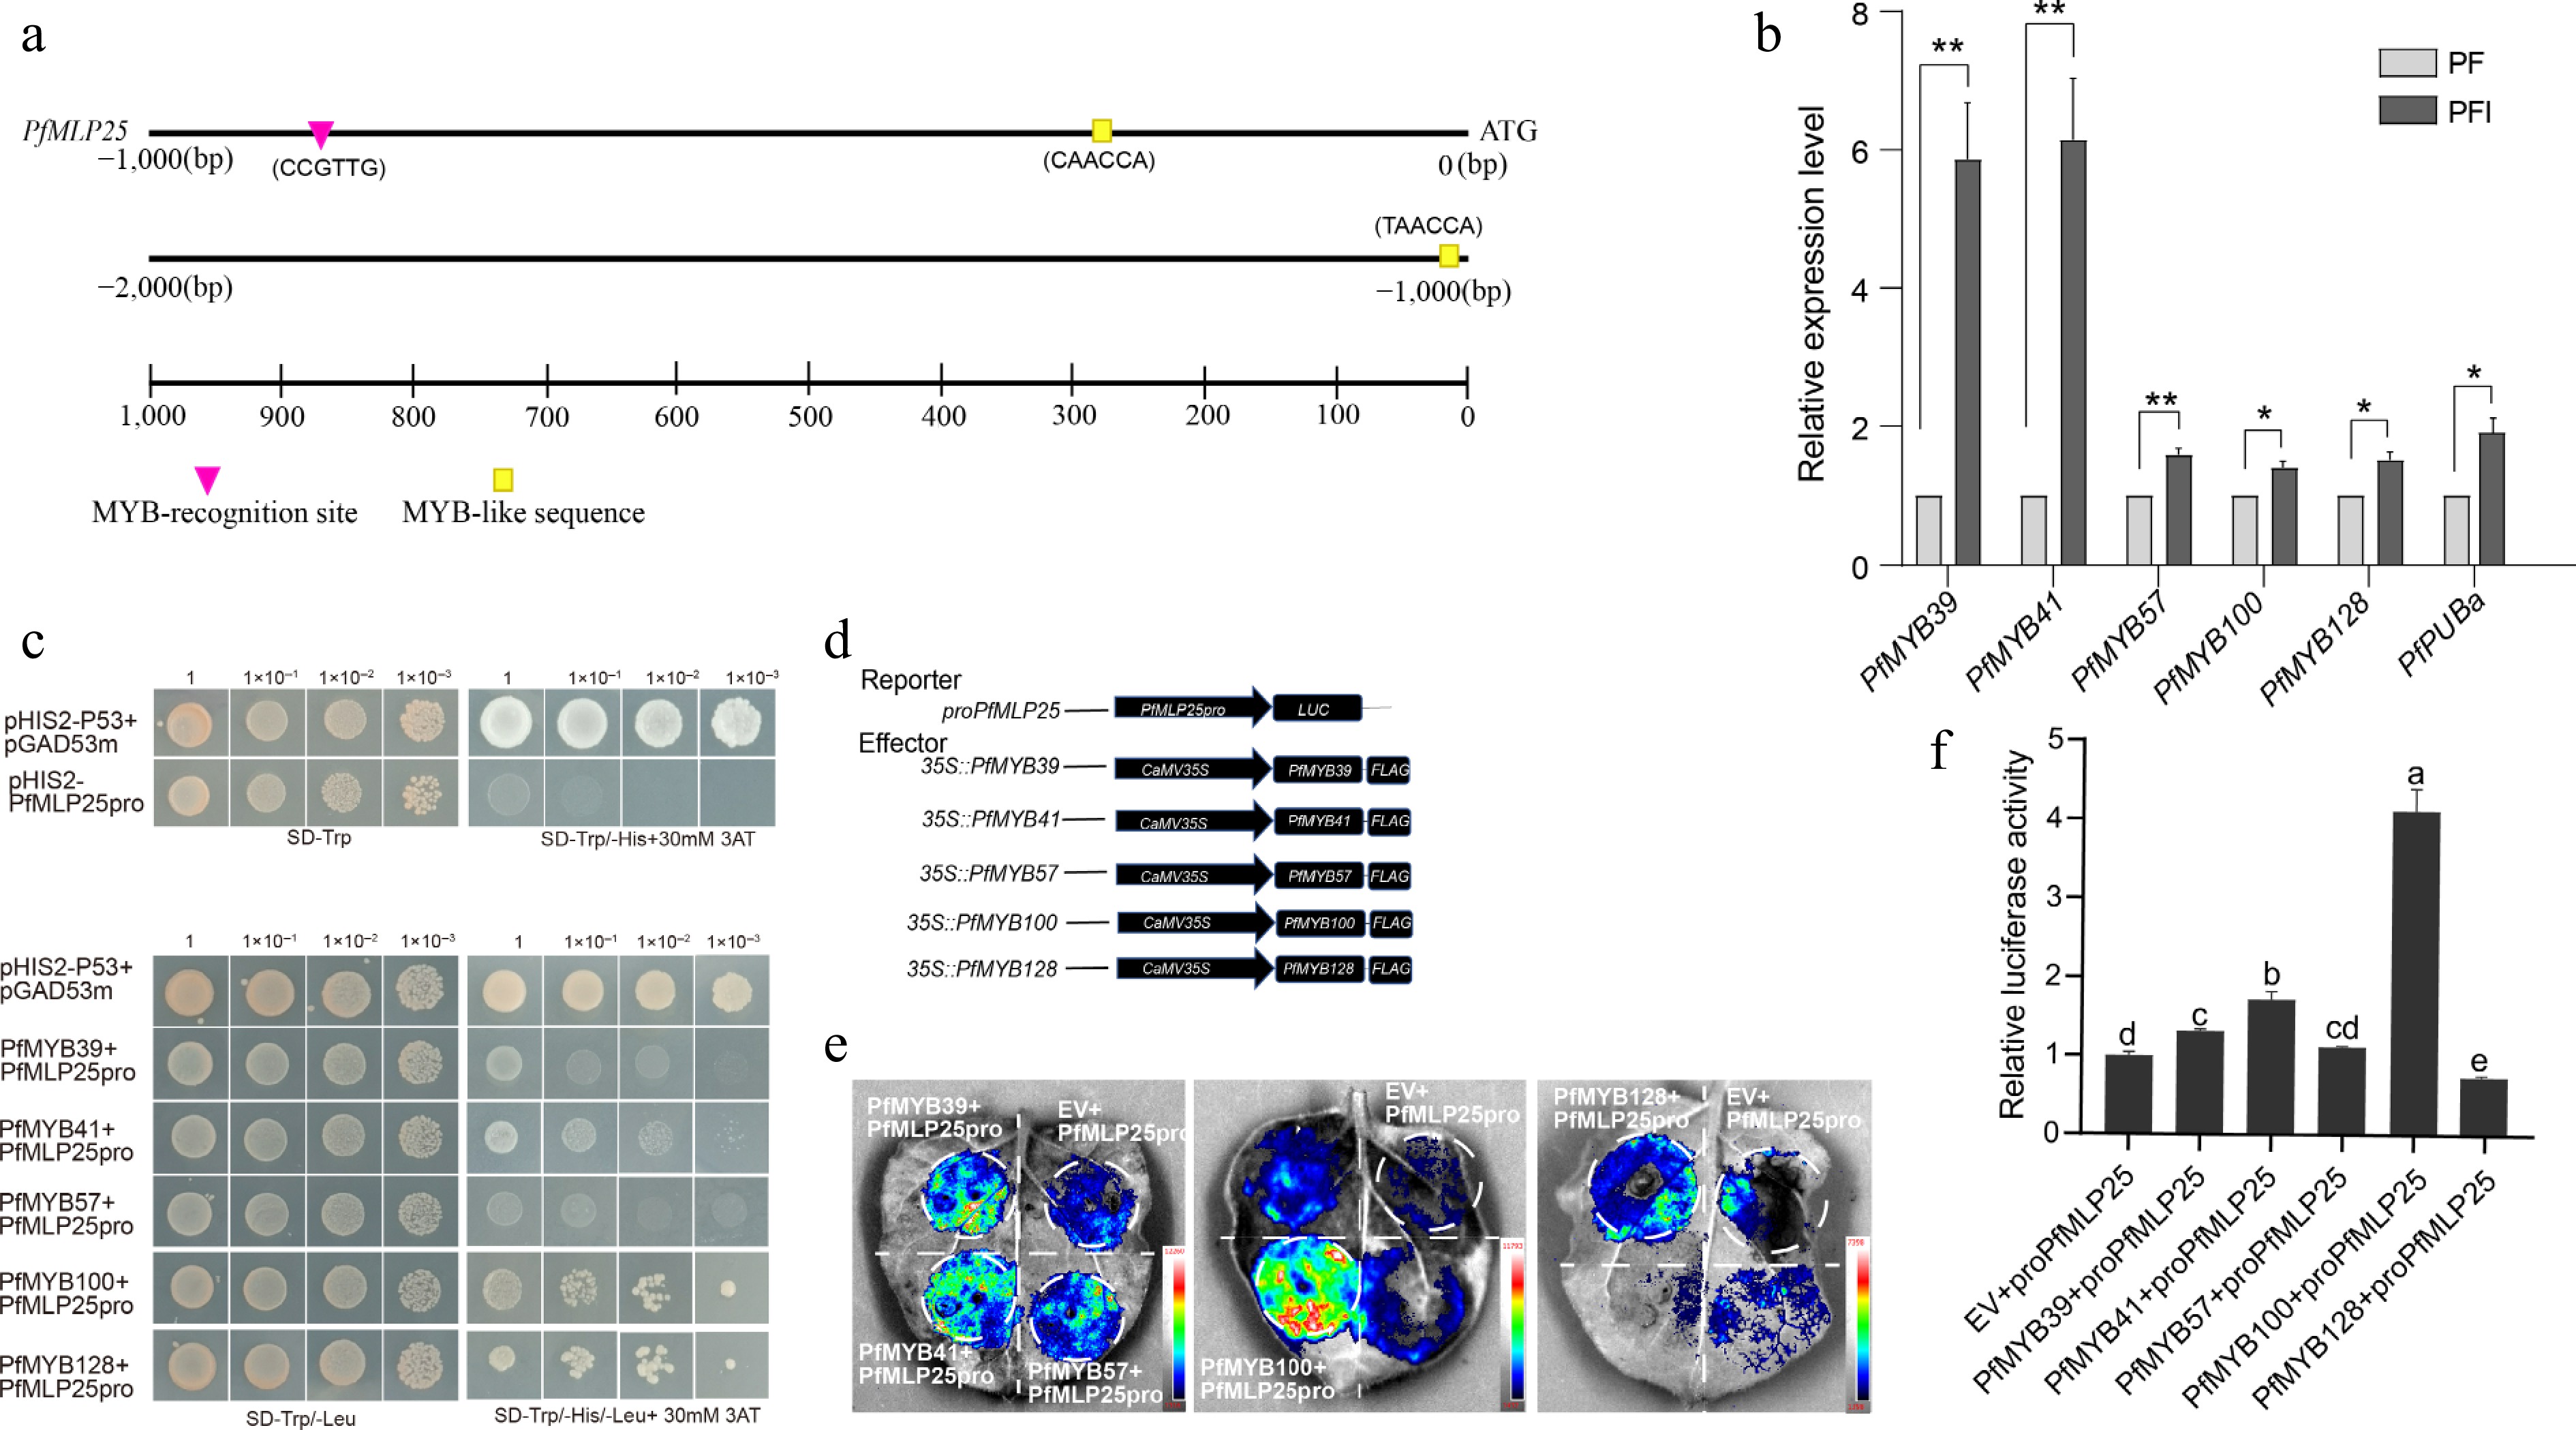
Figure 4.
The expression of PfMLP25 is regulated by transcript factor PfMYB100. (a) The 2,000 bp upstream promoter region of PfMLP25 harbored MYB recognition and binding sites. (b) PfMYBs genes are upregulated after PaWB phytoplasma infection based on the qRT-PCR technique. Data presented were means with standard deviation (n = 3) (* p < 0.05; ** p < 0.01). Statistical analysis was performed using an independent samples t-test. (c) Yeast one-hybrid assay utilizing pGADT7-PfMYBs as the prey and pHIS-PfMLP25 as the bait. Following co-transformation with recombinant vectors, yeast cells were plated on SD/-Trp/-Leu selection medium and subjected to serial dilutions (10-fold gradients). Five μL aliquots of each dilution were spotted onto SD/-Trp/-Leu/-His plates supplemented with 30 mM 3-AT. After 72 h incubation at 30 °C, colony growth was visually inspected. (d) Schematic diagram of vectors for the dual-luciferase reporter assay. (e) A representative LUC signal image in tobacco leaves. (f) Quantified LUC signal presented relative LUC activity. Letters indicate statistically significant differences determined by one-way ANOVA (p < 0.05).
-
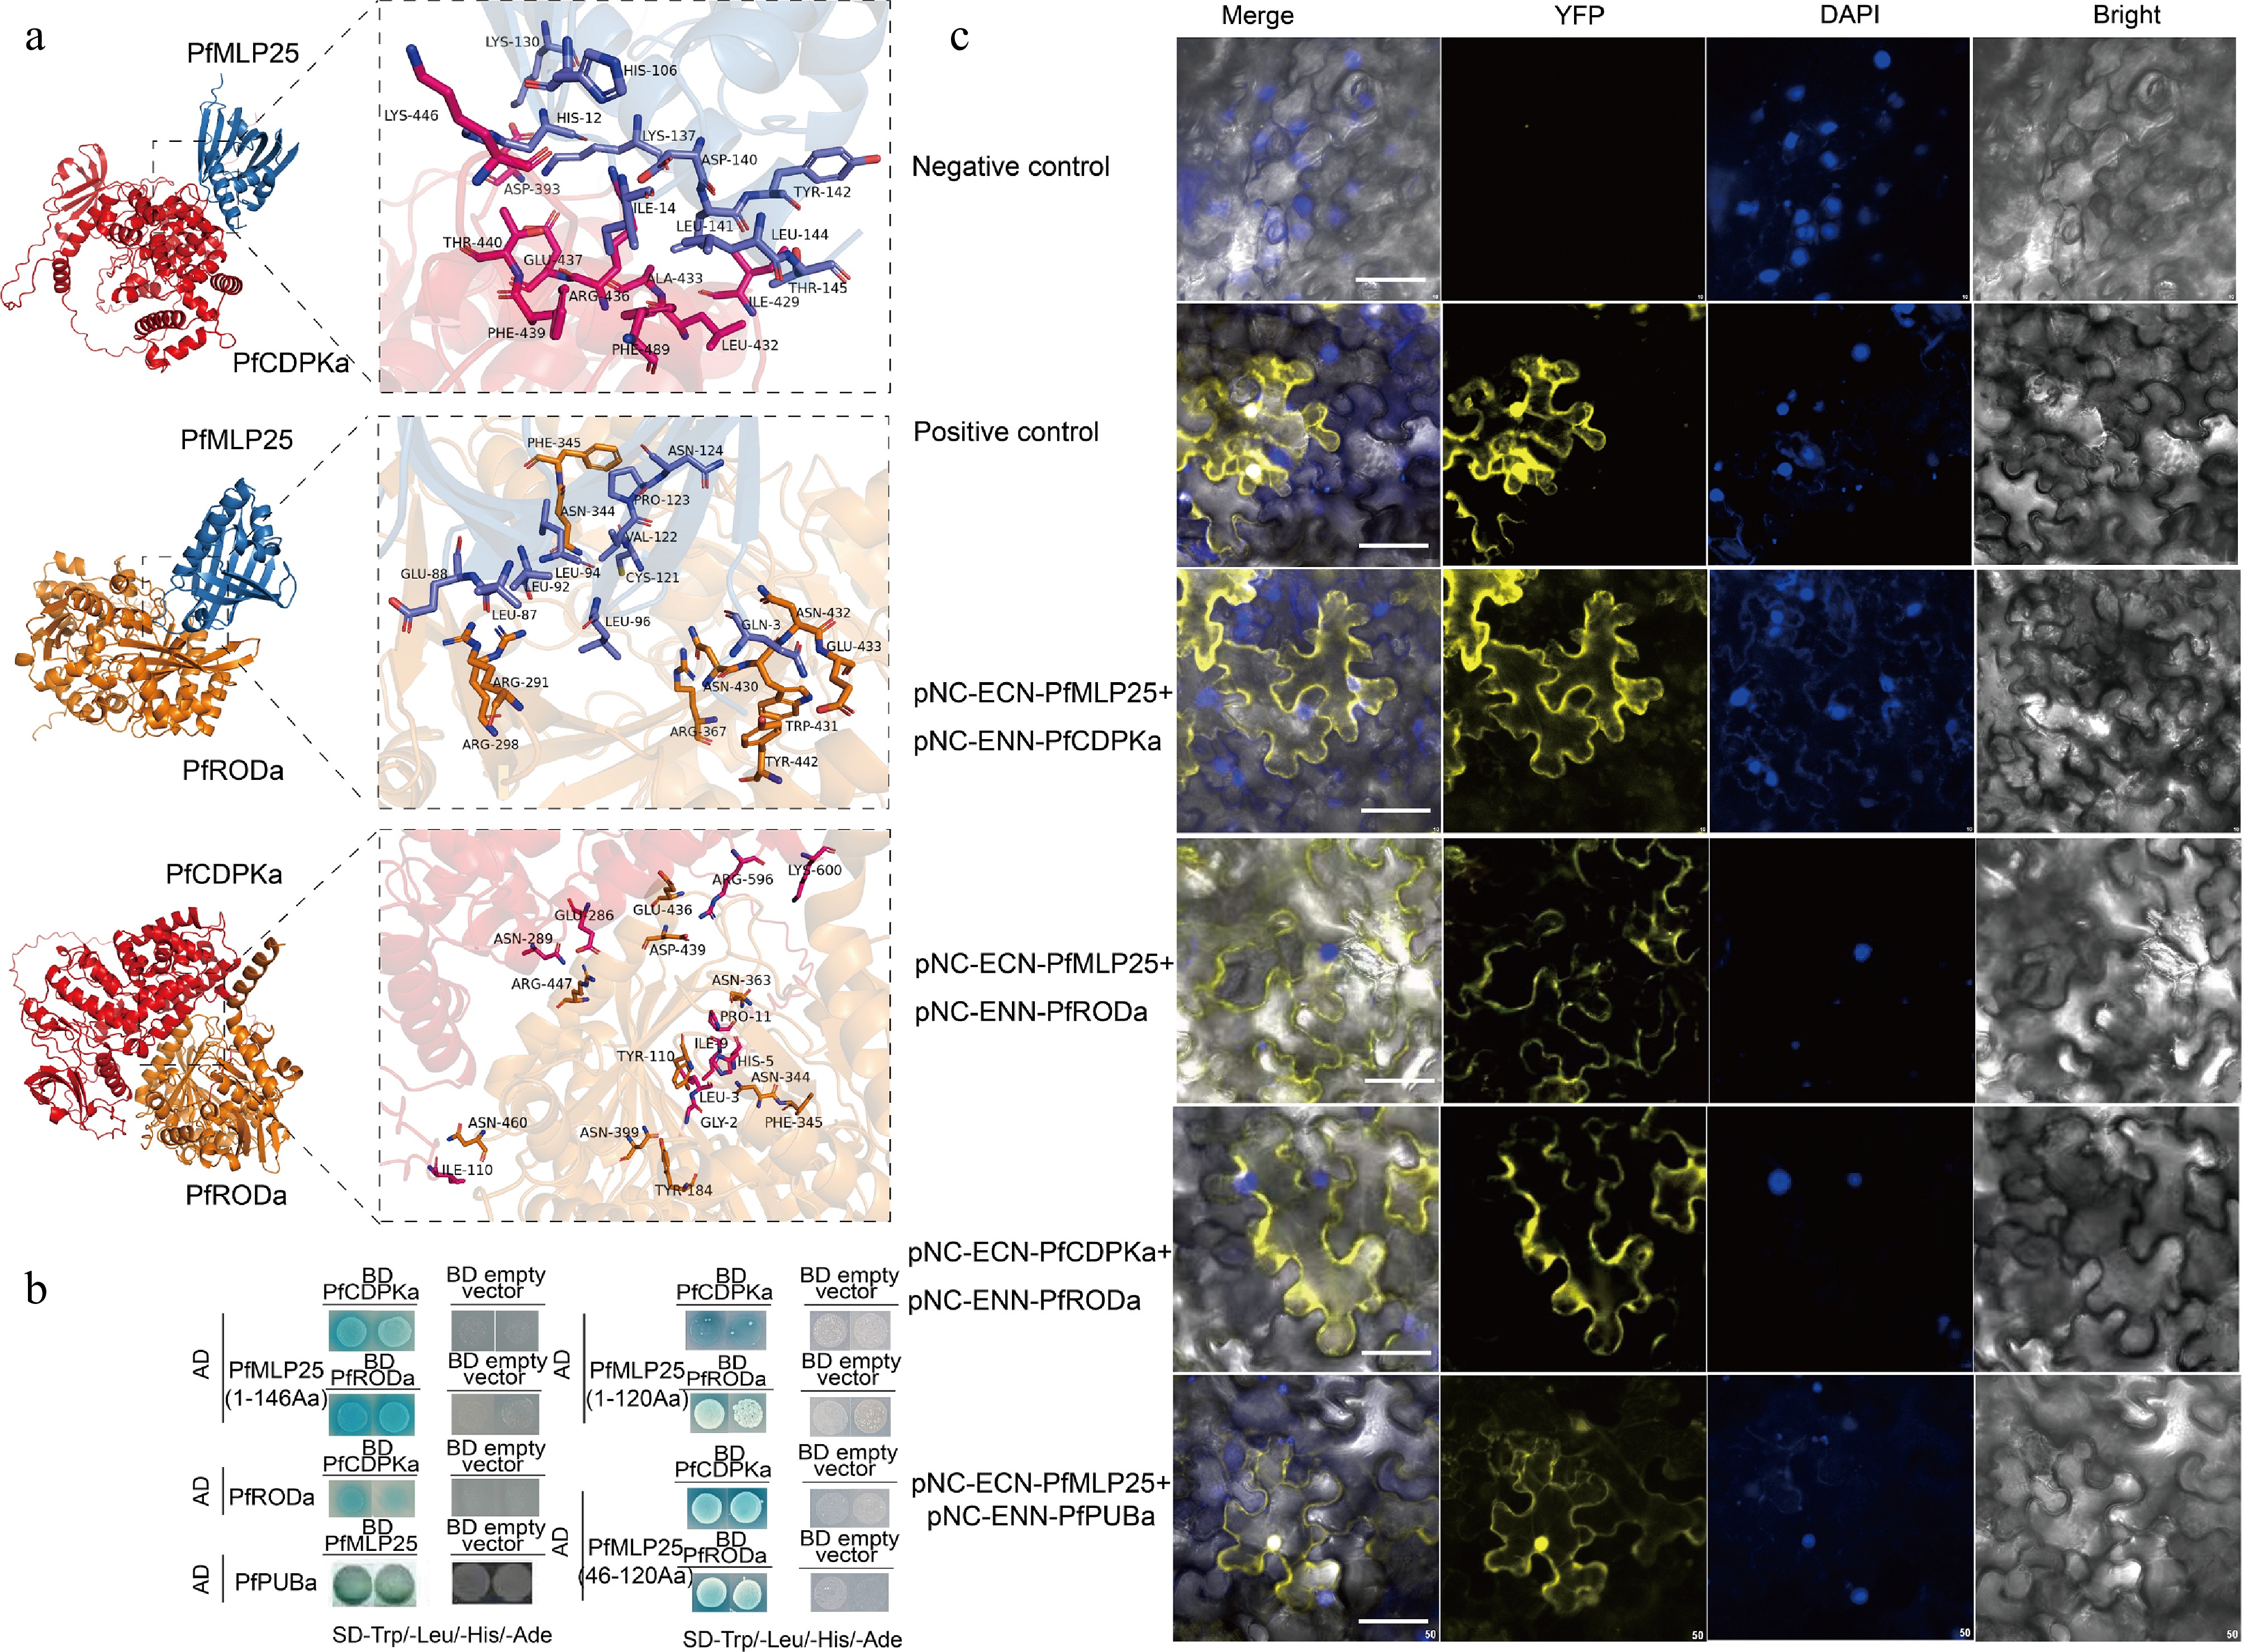
Figure 5.
Verification of protein interactions between PfMLP25 and PfCDPKa/PfRODa. (a) Molecular docking analysis revealed pairwise interactions of PfMLP25 and PfCDPKa, PfMLP25 and PfRODa, and PfCDPKa and PfRODa. The docking simulations are performed using Alphafold3, and the binding affinities are presented as binding free energies (kcal/mol). (b) Yeast two-hybrid assays confirm the interactions between PfMLP25 and PfCDPKa, PfMLP25 and PfRODa, as well as PfCDPKa and PfRODa. Blue yeast colonies on SD/-Trp-His-Leu-Ade medium supplemented with 20 μg/mL X-α-Gal (-THLA+X-α-Gal) serves as an indicator of the protein-protein interactions. (c) Bimolecular fluorescence complementation visualization of the interactions between PfMLP25 and PfCDPKa, PfMLP25 and PfRODa, PfCDPKa and PfRODa, as well as PfMLP25 and PfPUBa. Cell nuclei were stained by DAPI (in blue). pNC-ENN-PfARF13 and pNC-ECN-PfAux/IAA45 were used as a positive control. Truncated non-functional PfMLP25 proteins were used as a negative control. Bar scale, 50 μM.
-
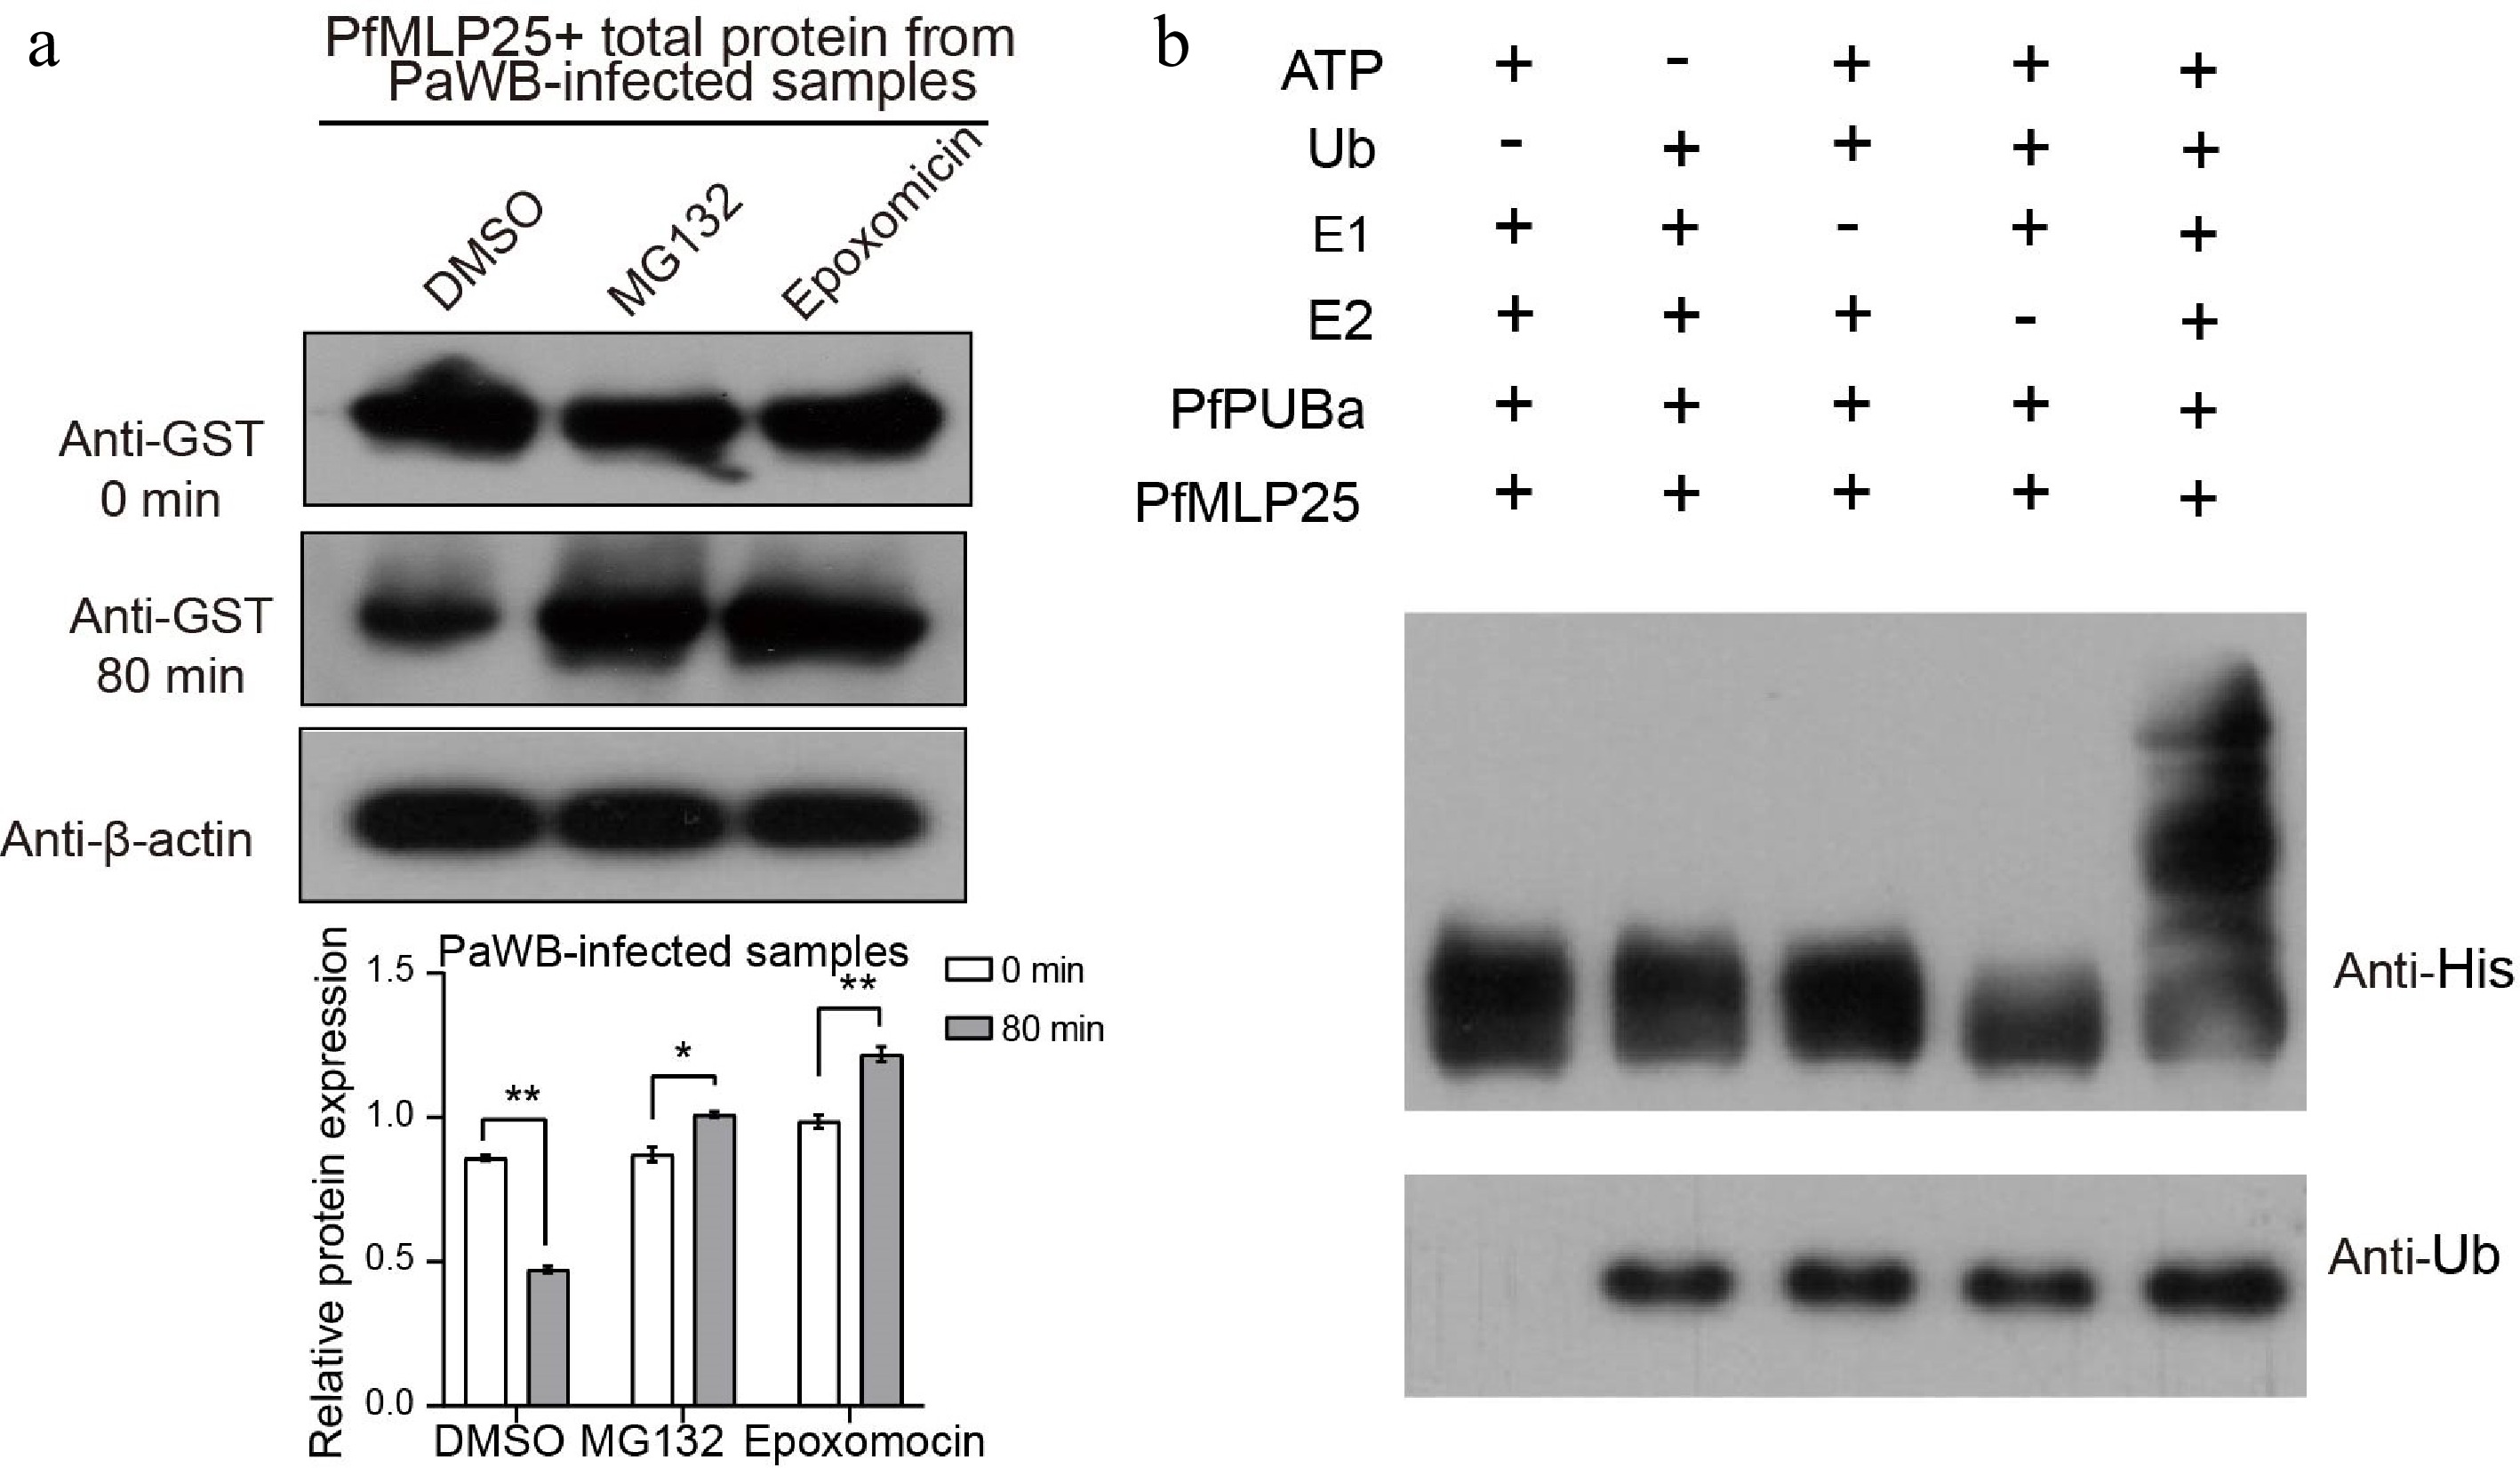
Figure 6.
PfPUBa interacts with PfMLP25 and functions as an E3 ubiquitin ligase to modulate the ubiquitinate of PfMLP25 in vitro. (a) Cell-free degradation assay of recombinant GST-PfMLP25 protein. Recombinant GST-PfMLP25 protein was purified from E. coli and cultured with proteins from PaWB-infected Paulownia, and treated with specific 26S proteasome inhibitors MG132, and epoxomicin at different time intervals. Western blot analysis was performed using an anti-GST antibody, with anti-β-actin utilized as a control. The bands were examined using ImageJ software, and the results were presented as mean with standard deviation (n = 3). Statistical significance is denoted by * p < 0.05 and ** p < 0.01. (b) PfPUBa functions as an E3 ligase of PfMLP25 in vitro. GST-PfPUBa and His-PfMLP25 fusion proteins were purified. The E3 activity of the GST-PfPUBa fusion protein was detected under conditions with or without the addition of ATP, ubiquitin, ubiquitin-activating enzyme (E1), ubiquitin-conjugating enzyme (E2), His-PfMLP25, or ubiquitin (Ub).
-
Gene Gene ID Amino
acidsMolecular
weight (KDa)pI Gravy Subcellular
localizationPfMLP1 Pfo01g004220.1 156 17.90 6.30 −0.096 chlo PfMLP2 Pfo03g006750.1 152 17.53 5.30 −0.373 cyto PfMLP3 Pfo03g006760.1 151 17.00 5.94 −0.231 nucl PfMLP4 Pfo03g006780.1 162 18.55 5.21 −0.314 cyto PfMLP5 Pfo03g015030.1 208 22.68 8.71 −0.212 chlo PfMLP6 Pfo06g009240.1 147 16.08 4.53 0.232 cyto PfMLP7 Pfo06g009250.1 148 16.15 4.83 0.538 cyto PfMLP8 Pfo06g009260.1 148 16.10 5.14 0.555 cyto PfMLP9 Pfo07g005940.1 150 16.81 5.20 −0.058 cysk PfMLP10 Pfo07g005960.1 164 18.26 5.31 −0.039 cyto PfMLP11 Pfo07g006210.1 106 12.07 5.37 0.066 cyto PfMLP12 Pfo08g013310.1 205 22.88 5.05 −0.035 chlo PfMLP13 Pfo09g002850.1 146 16.58 5.46 −0.364 cyto PfMLP14 Pfo11g002980.1 160 17.76 5.00 −0.204 cyto PfMLP15 Pfo11g004160.1 159 17.47 5.83 −0.219 cyto PfMLP16 Pfo11g004210.1 160 17.93 5.65 −0.346 cyto PfMLP17 Pfo11g004220.1 160 17.73 5.27 −0.221 nucl PfMLP18 Pfo11g004240.1 160 17.93 5.09 −0.400 cyto PfMLP19 Pfo11g004250.1 160 18.04 4.98 −0.422 cyto_nucl PfMLP20 Pfo11g004260.1 160 17.92 5.11 −0.407 cyto PfMLP21 Pfo11g004270.1 160 17.90 5.26 −0.457 nucl PfMLP22 Pfo11g004280.1 160 17.95 4.96 −0.307 cyto PfMLP23 Pfo13g006930.1 146 16.20 4.76 0.028 cyto PfMLP24 Pfo13g006940.1 188 21.10 8.95 0.160 chlo PfMLP25 Pfo13g006950.1 146 16.30 6.42 0.247 cyto PfMLP26 Pfo16g013080.1 160 17.68 4.95 −0.206 cysk PfMLP27 Pfo17g000360.1 155 17.70 4.74 −0.559 cyto PfMLP28 Pfo17g000370.1 155 17.88 5.46 −0.598 cysk PfMLP29 Pfo17g005500.1 152 16.86 4.90 −0.347 extr PfMLP30 Pfo19g001350.1 161 17.62 6.13 −0.297 cyto PfMLP31 Pfo19g001360.1 160 17.43 5.18 −0.378 cyto PfMLP32 Pfo19g001370.1 160 18.37 5.69 −0.342 cyto PfMLP33 Pfo19g001380.1 160 17.71 5.25 −0.252 nucl PfMLP34 Pfo19g004540.1 159 17.67 4.96 −0.240 cyto PfMLP35 Pfo19g004550.1 160 17.69 4.86 −0.303 chlo PfMLP36 Pfo19g006510.1 156 17.02 5.49 −0.097 cyto PfMLP37 Pfo19g006520.1 158 17.20 5.52 −0.130 cyto PfMLP38 Pfo19g006530.1 158 17.19 5.49 −0.135 cyto PfMLP39 Pfo19g006540.1 158 17.21 5.51 −0.099 cyto PfMLP40 Pfo19g006550.1 158 17.16 5.66 −0.151 cyto PfMLP41 Pfo19g006560.1 158 17.23 5.53 −0.090 cyto PfMLP42 Pfo19g006570.1 147 16.12 6.20 −0.154 cyto PfMLP43 Pfo19g006600.1 158 17.17 5.21 −0.083 cyto PfMLP44 Pfo19g006610.1 158 17.23 5.65 −0.136 cyto PfMLP45 Pfo19g006620.1 158 17.02 5.20 −0.130 cyto PfMLP46 Pfo19g006800.1 160 17.77 5.00 −0.231 cyto PfMLP47 Pfoxxg001330.1 153 17.51 5.28 −0.454 cyto PfMLP48 Pfoxxg035180.1 151 17.01 5.57 −0.197 cyto PfMLP49 Pfoxxg039320.1 117 13.00 4.61 −0.379 cyto Table 1.
PfMLPs identified in the P. fortunei genome.
Figures
(6)
Tables
(1)