-
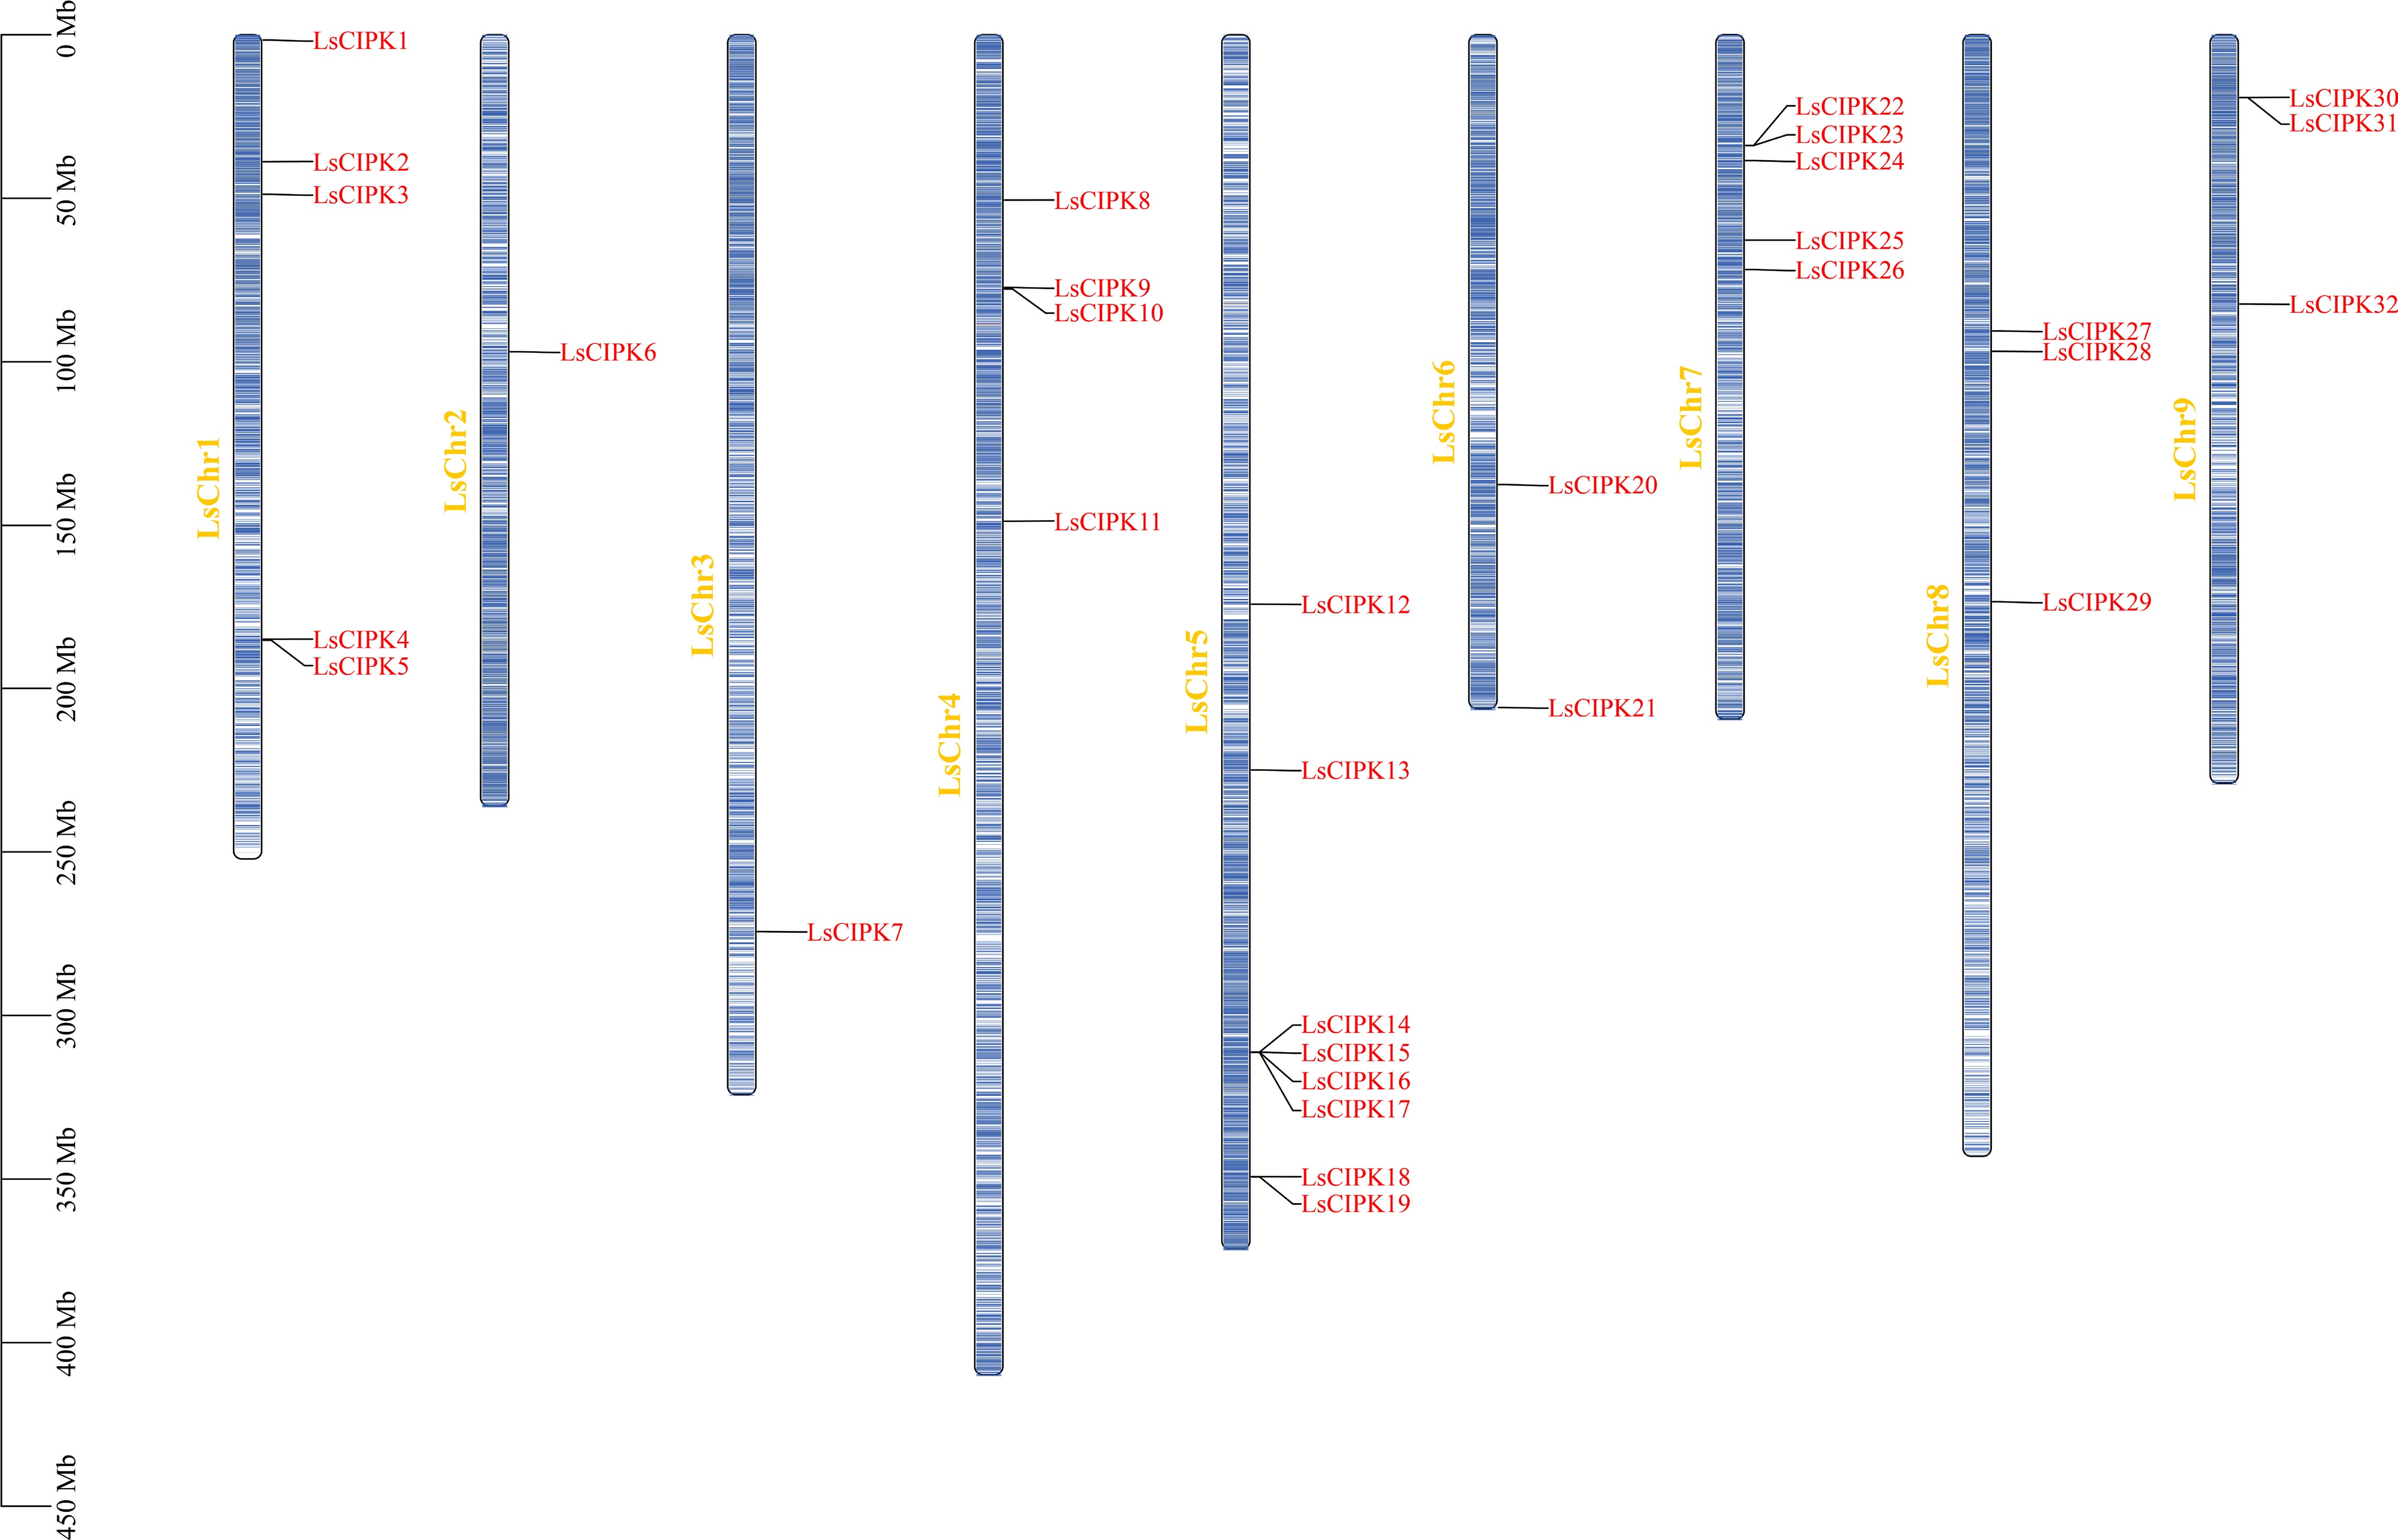
Figure 1.
Chromosomal distribution of the lettuce CIPK gene family. Blue bars represent lettuce chromosomes (LsChr1–LsChr9), with physical distances (Mb) shown on the left. Red text indicates CIPK gene names.
-
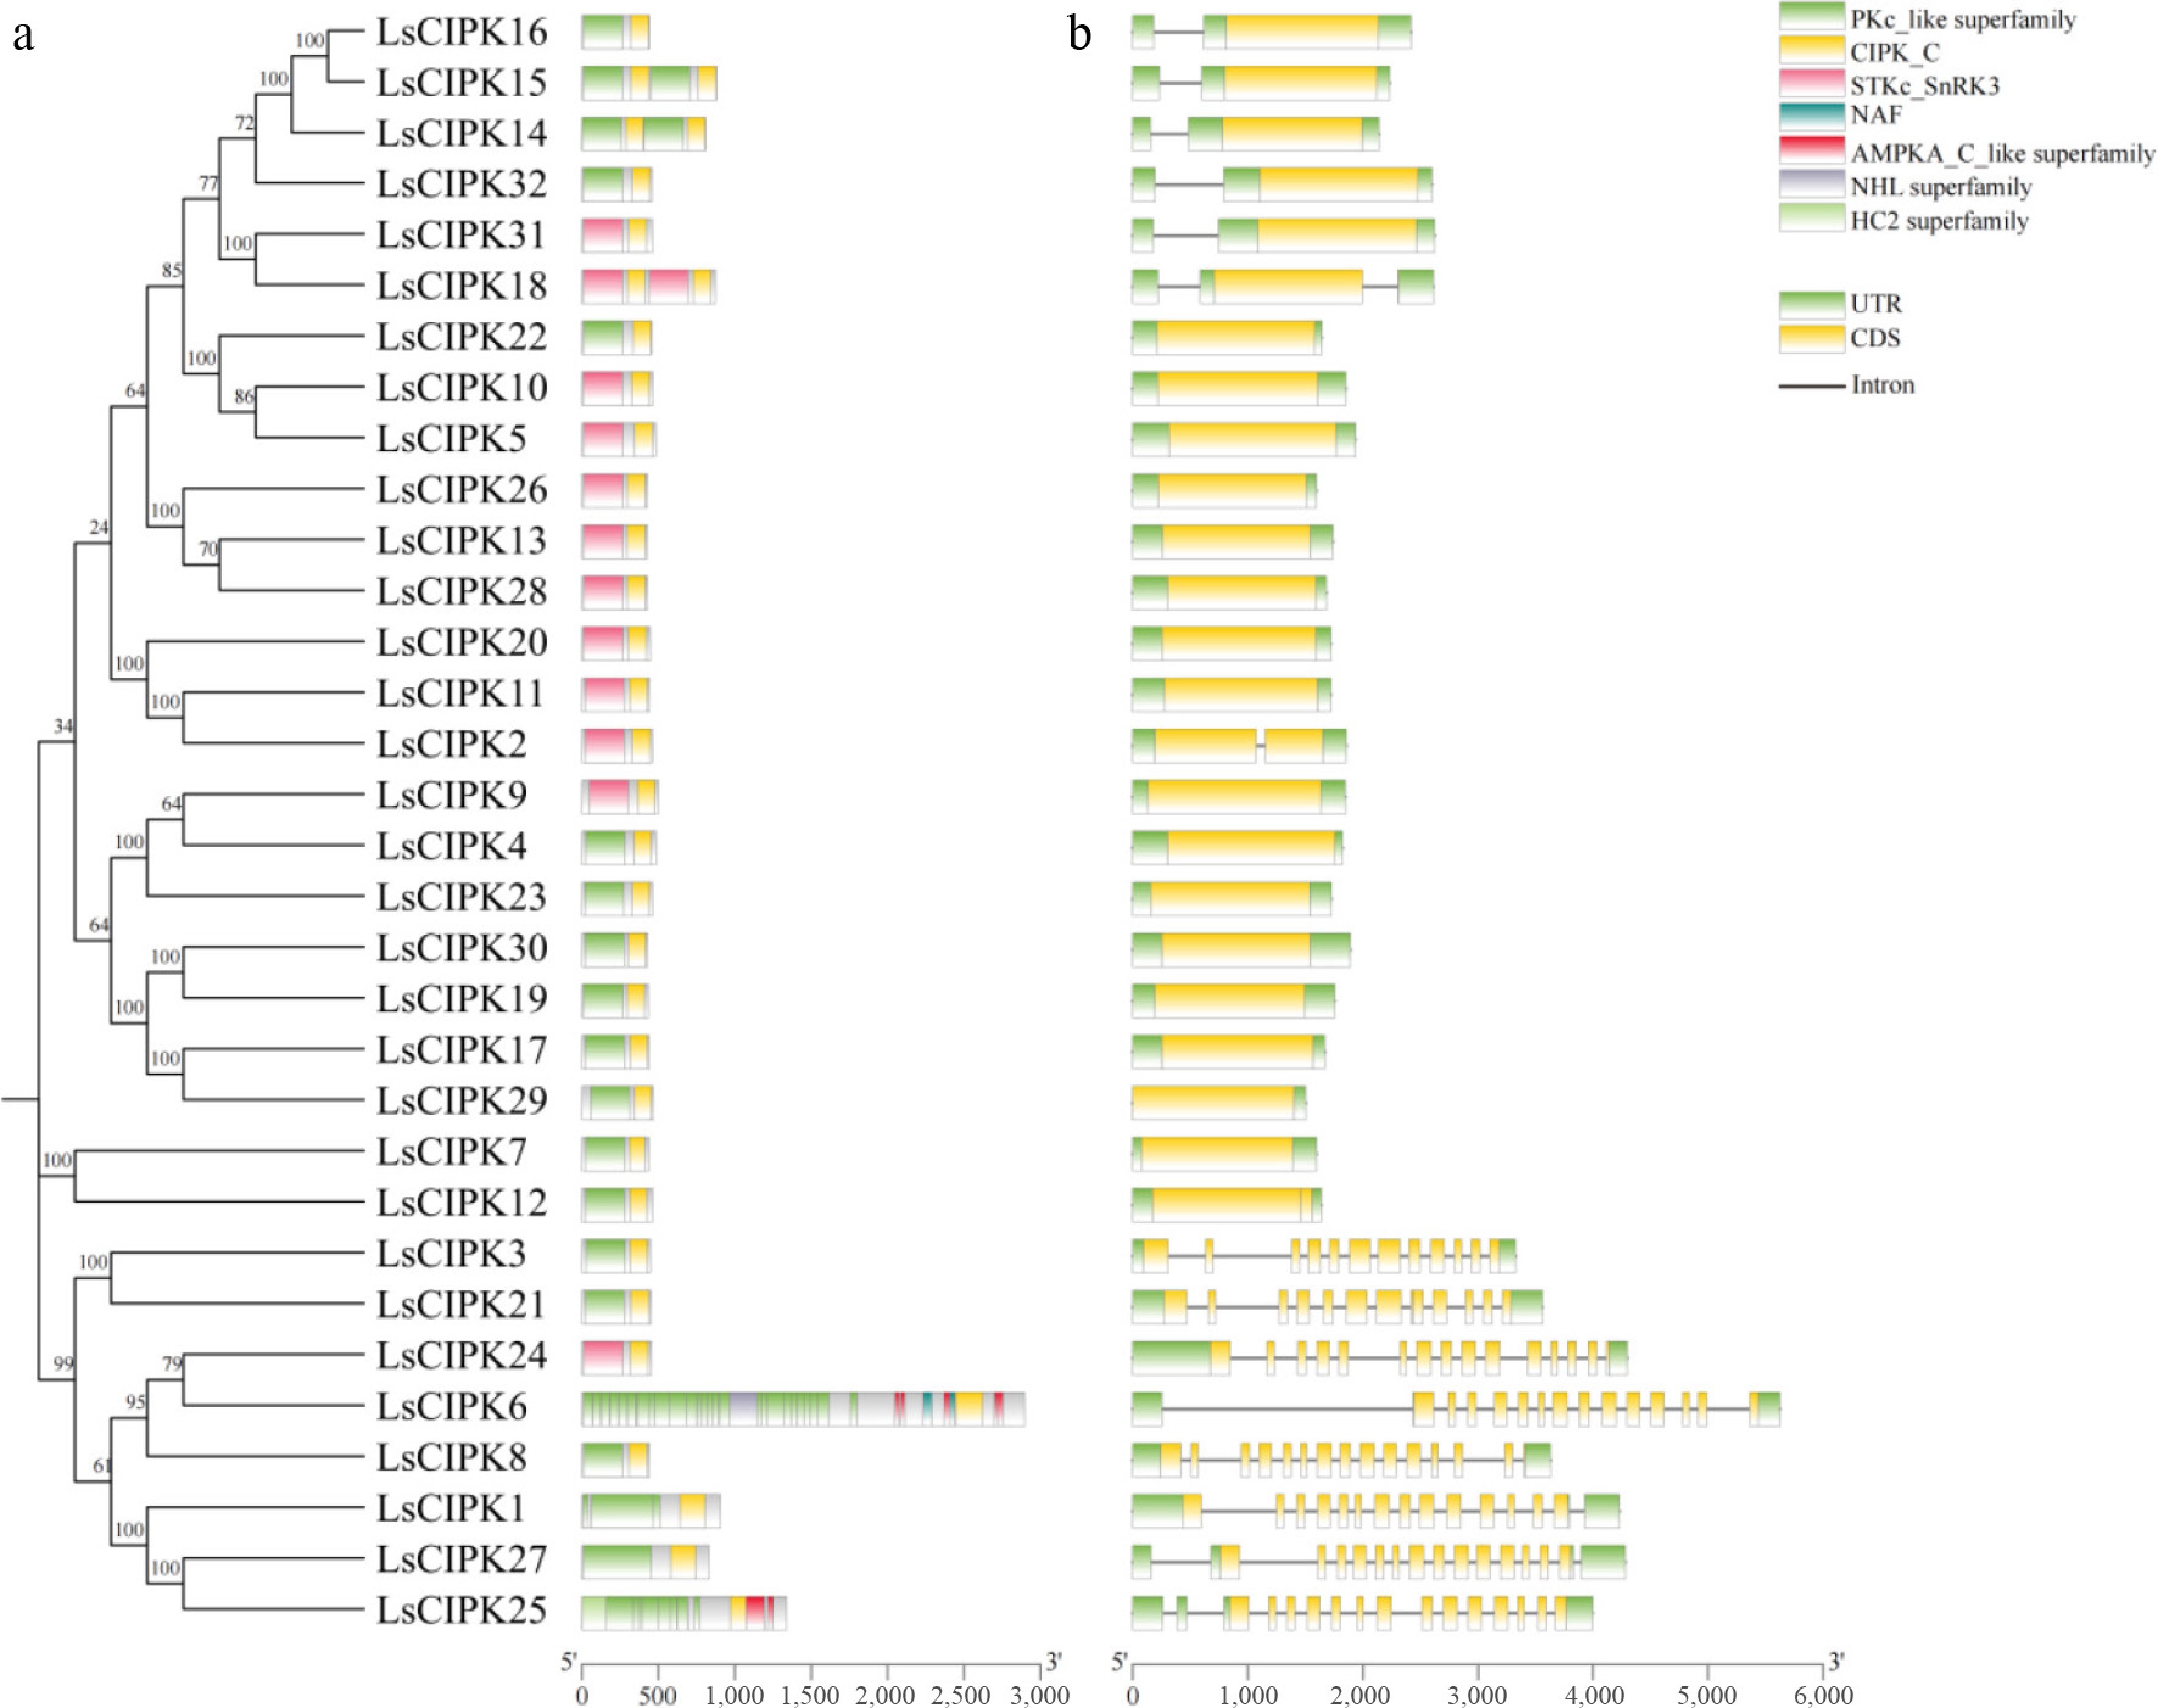
Figure 2.
Conserved domains and gene structure analysis of the CIPK gene family in lettuce. (a) Conserved domain distribution of the LsCIPK protein. Different colors represent different domain types; the corresponding domain names are labeled on the right. (b) Exon-intron structure of the LsCIPK gene. Yellow boxes represent coding regions (CDS), green boxes represent untranslated regions (UTR), and black lines represent introns.
-
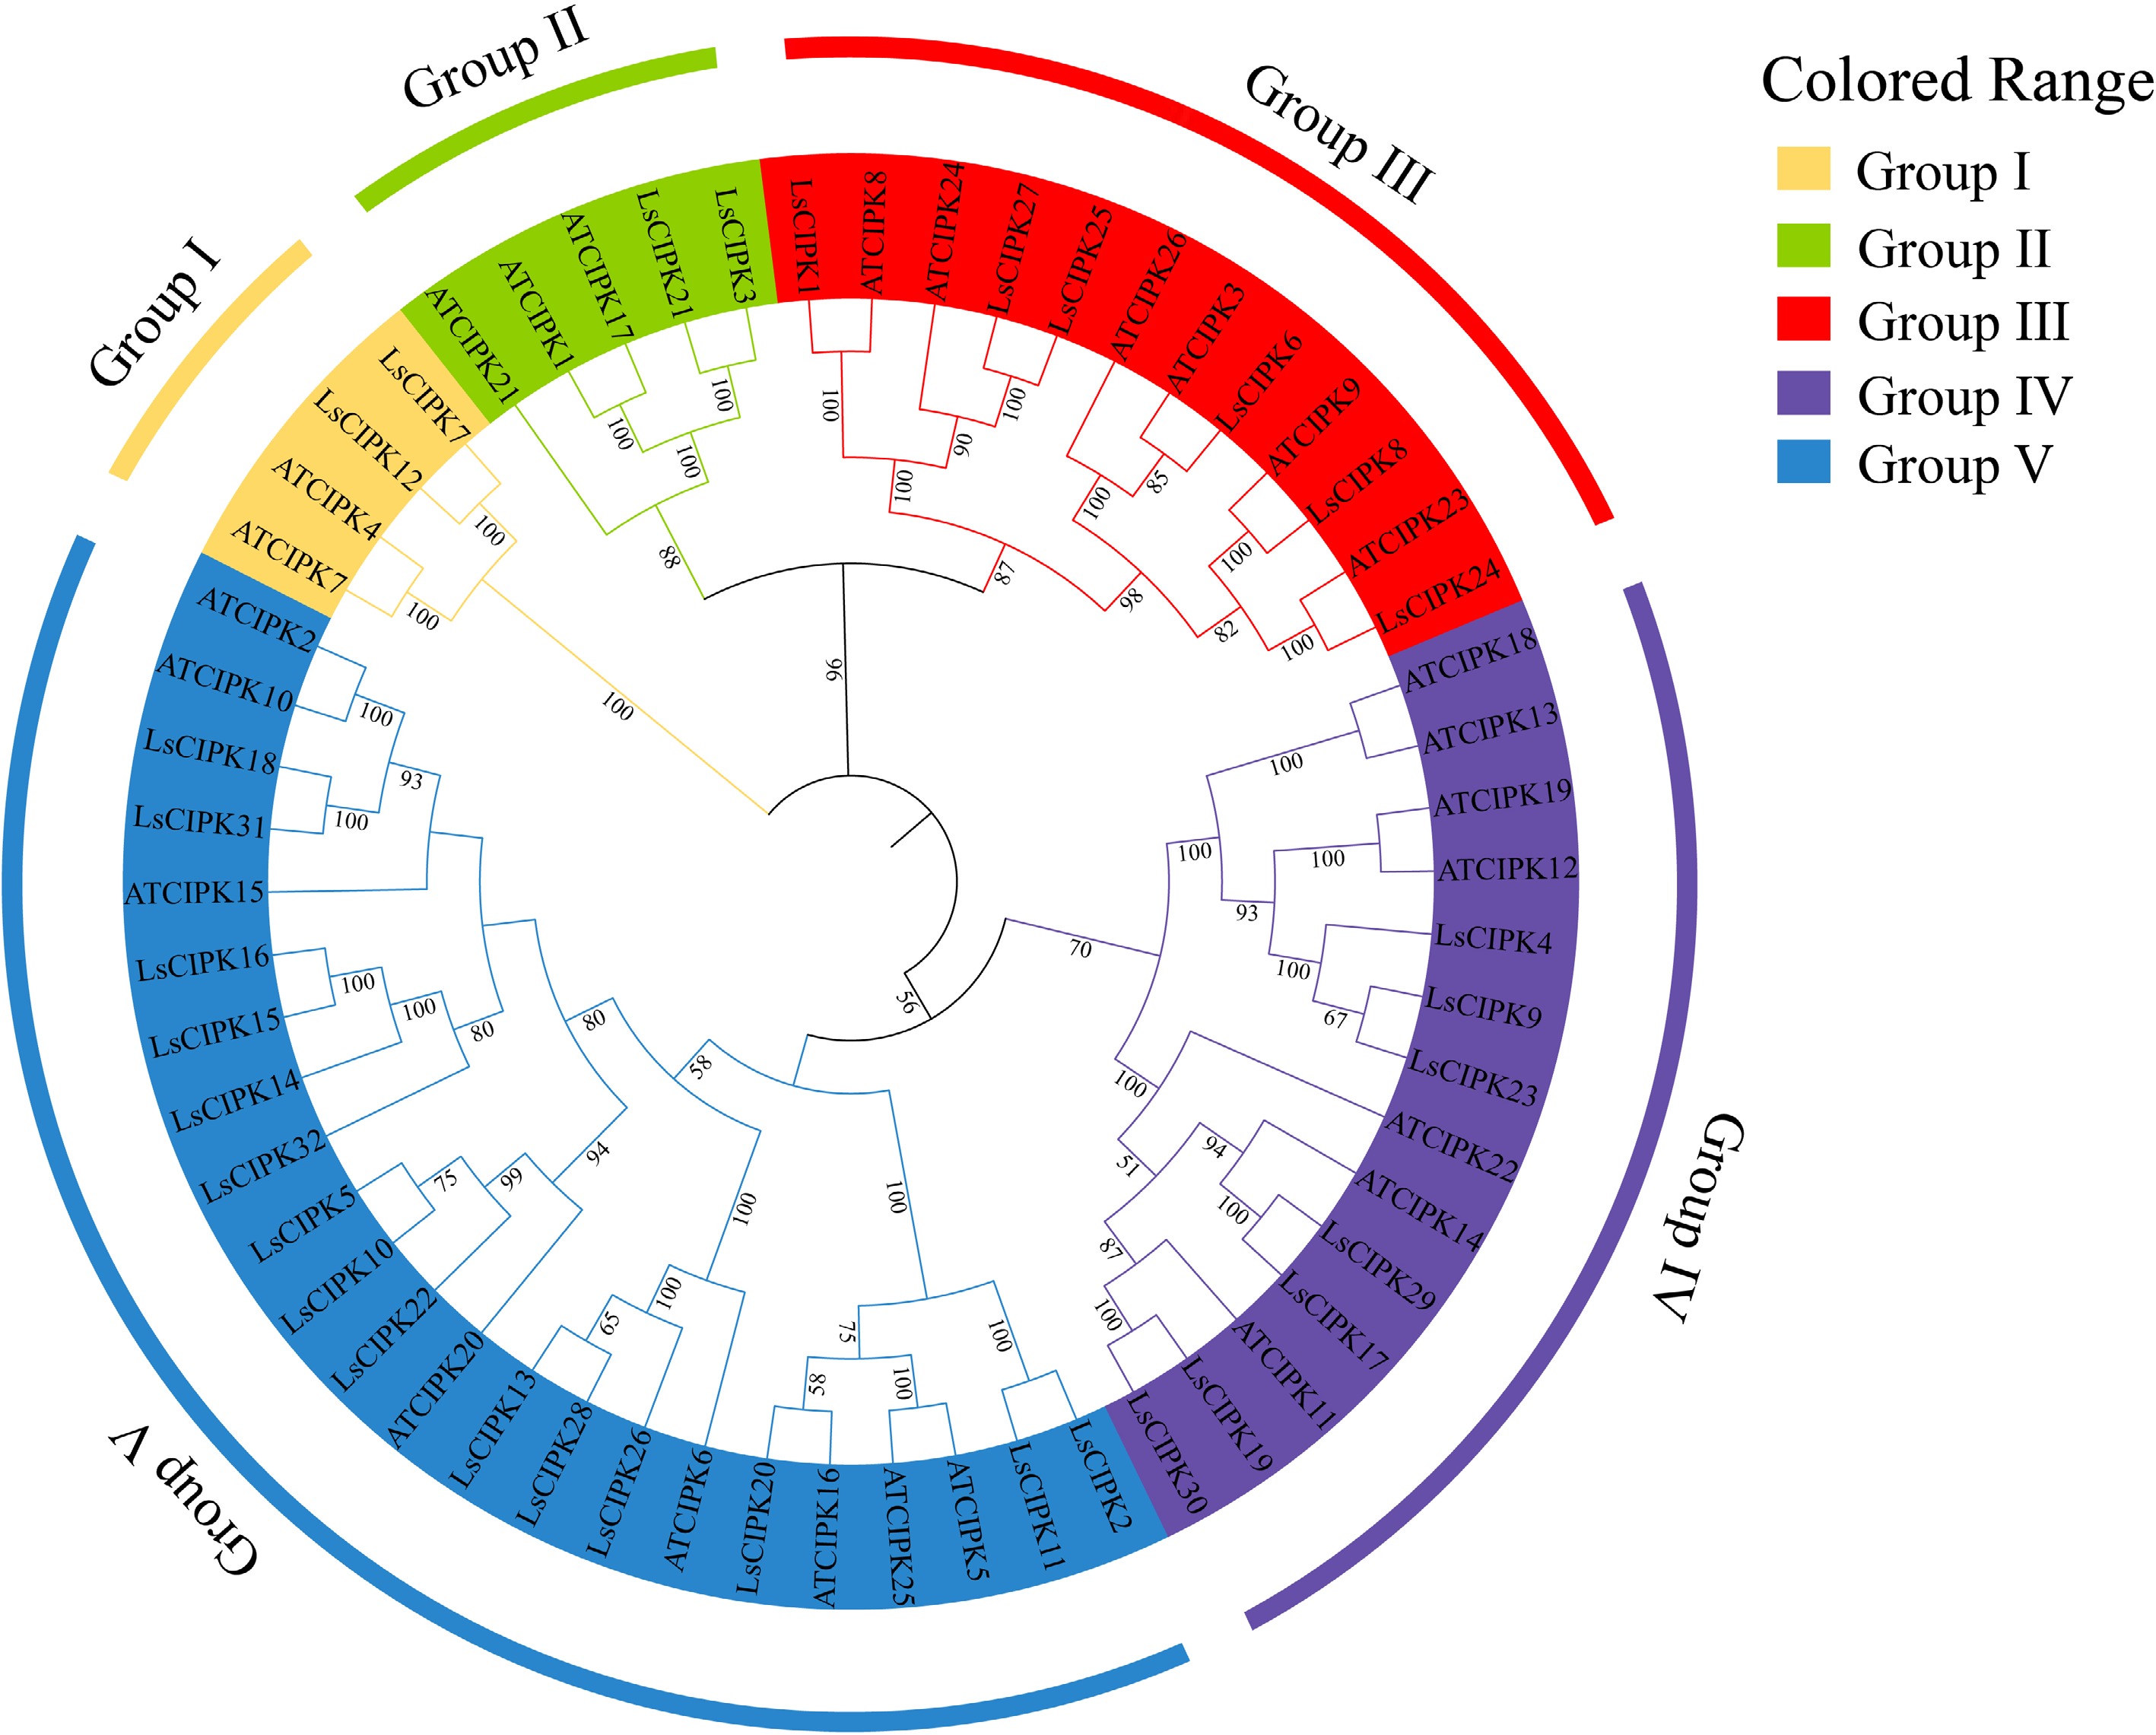
Figure 3.
Phylogenetic tree of the CIPK gene family in lettuce and Arabidopsis. Different colors represent five evolutionary branches (Group I–V). CIPK proteins in lettuce and Arabidopsis are distinguished as 'LsCIPK' and 'AtCIPK'.
-
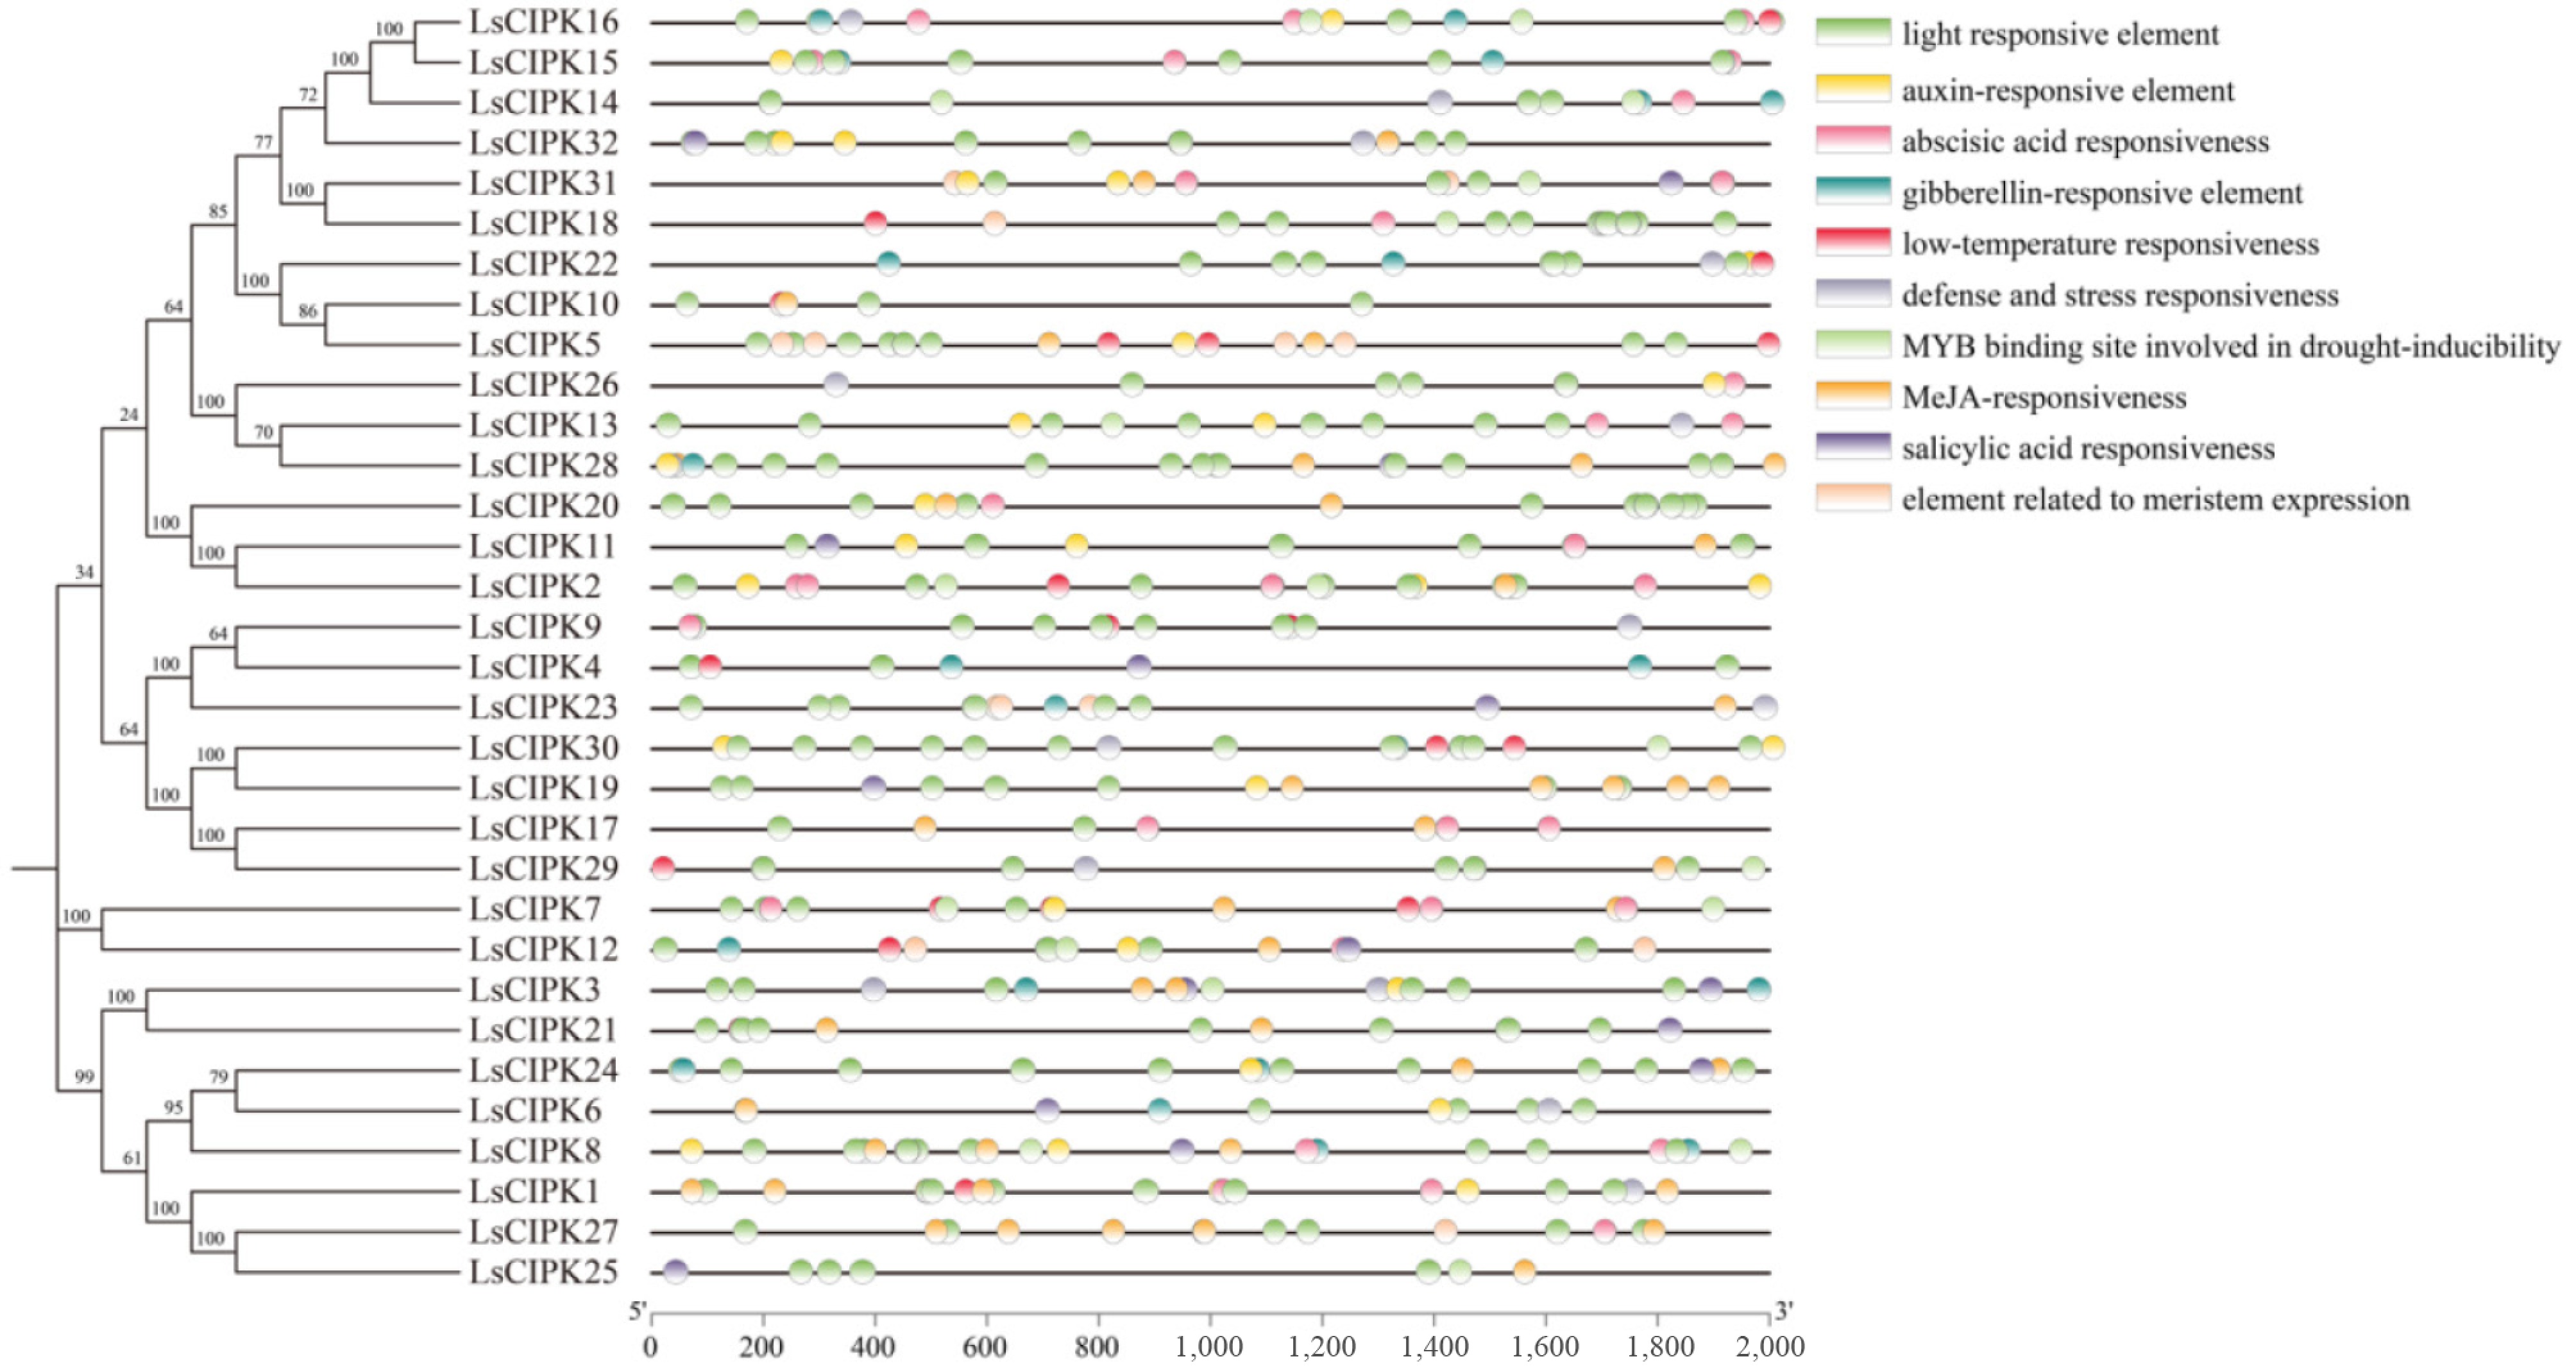
Figure 4.
Analysis of cis-acting elements associated with specific plant hormones and abiotic stresses within 2,000 bp upstream of the LsCIPKs sequence.
-
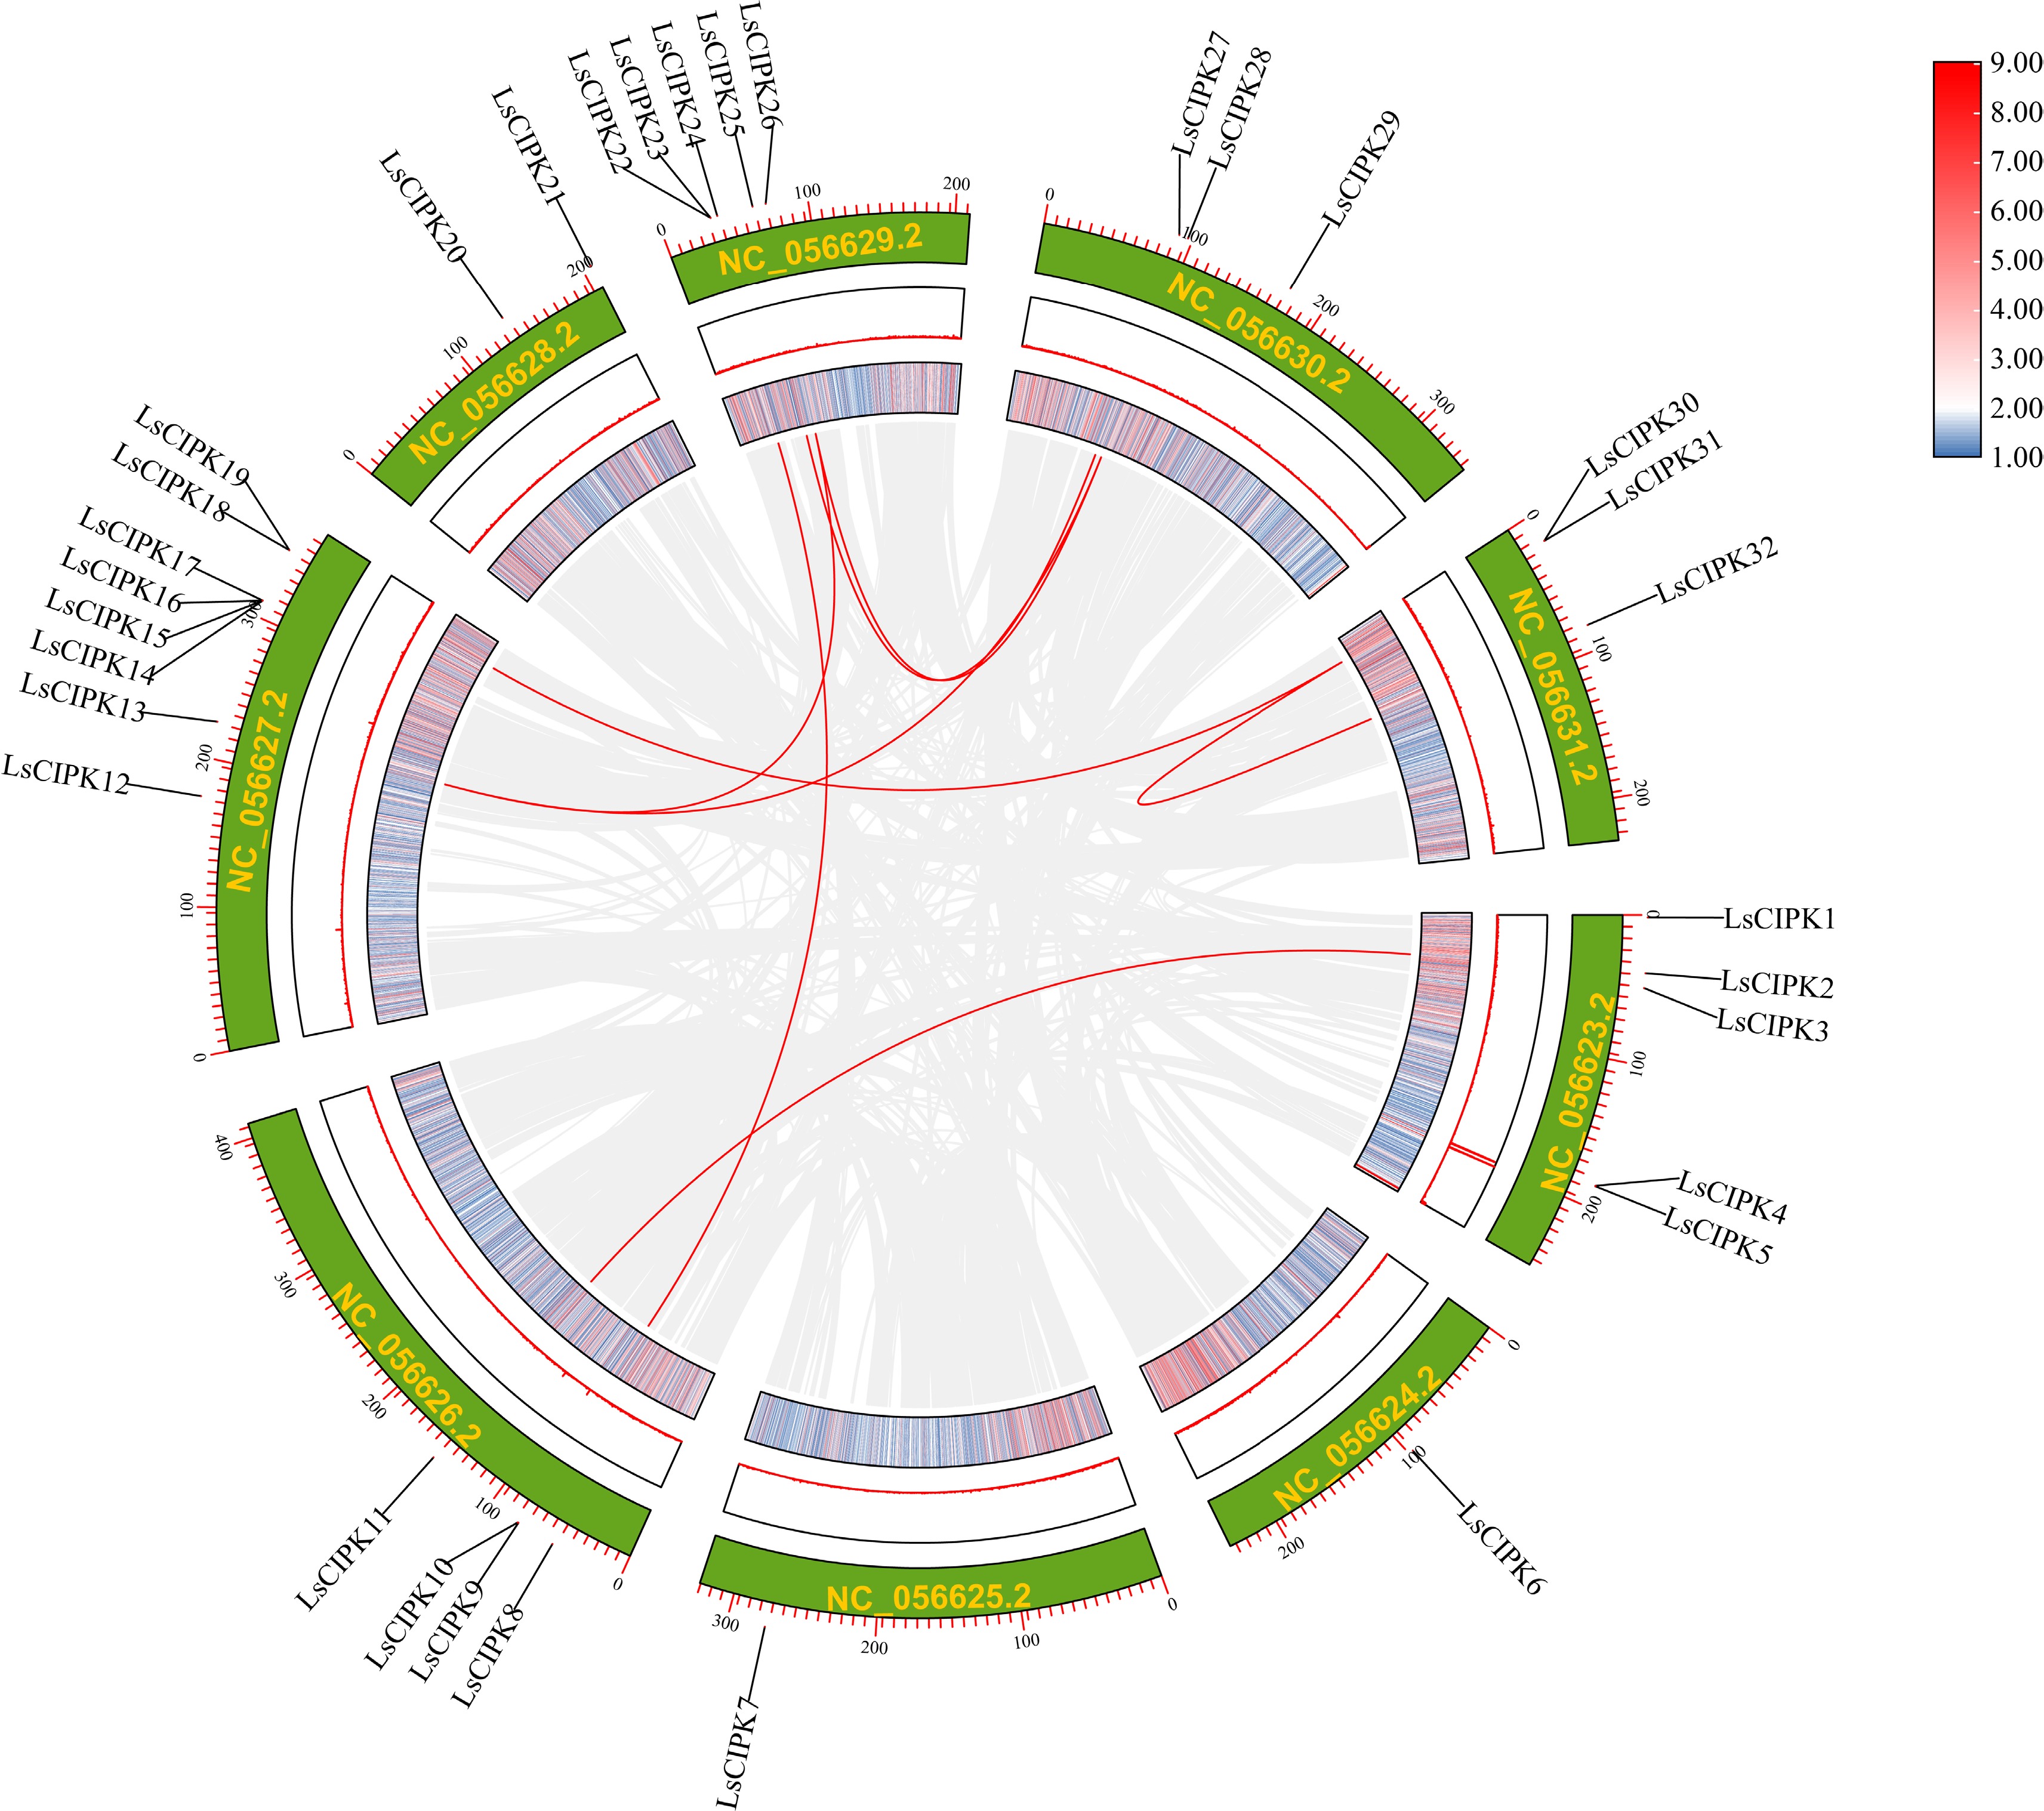
Figure 5.
Genome-wide colinearity analysis of the lettuce CIPK gene family. Arcs of different colors represent homologous gene pairs between chromosomes; the green outer ring depicts the nine chromosomes of lettuce (LsChr1–LsChr9). The heatmap colors (blue, red) indicate a gradient of sequence similarity (from low to high).
-
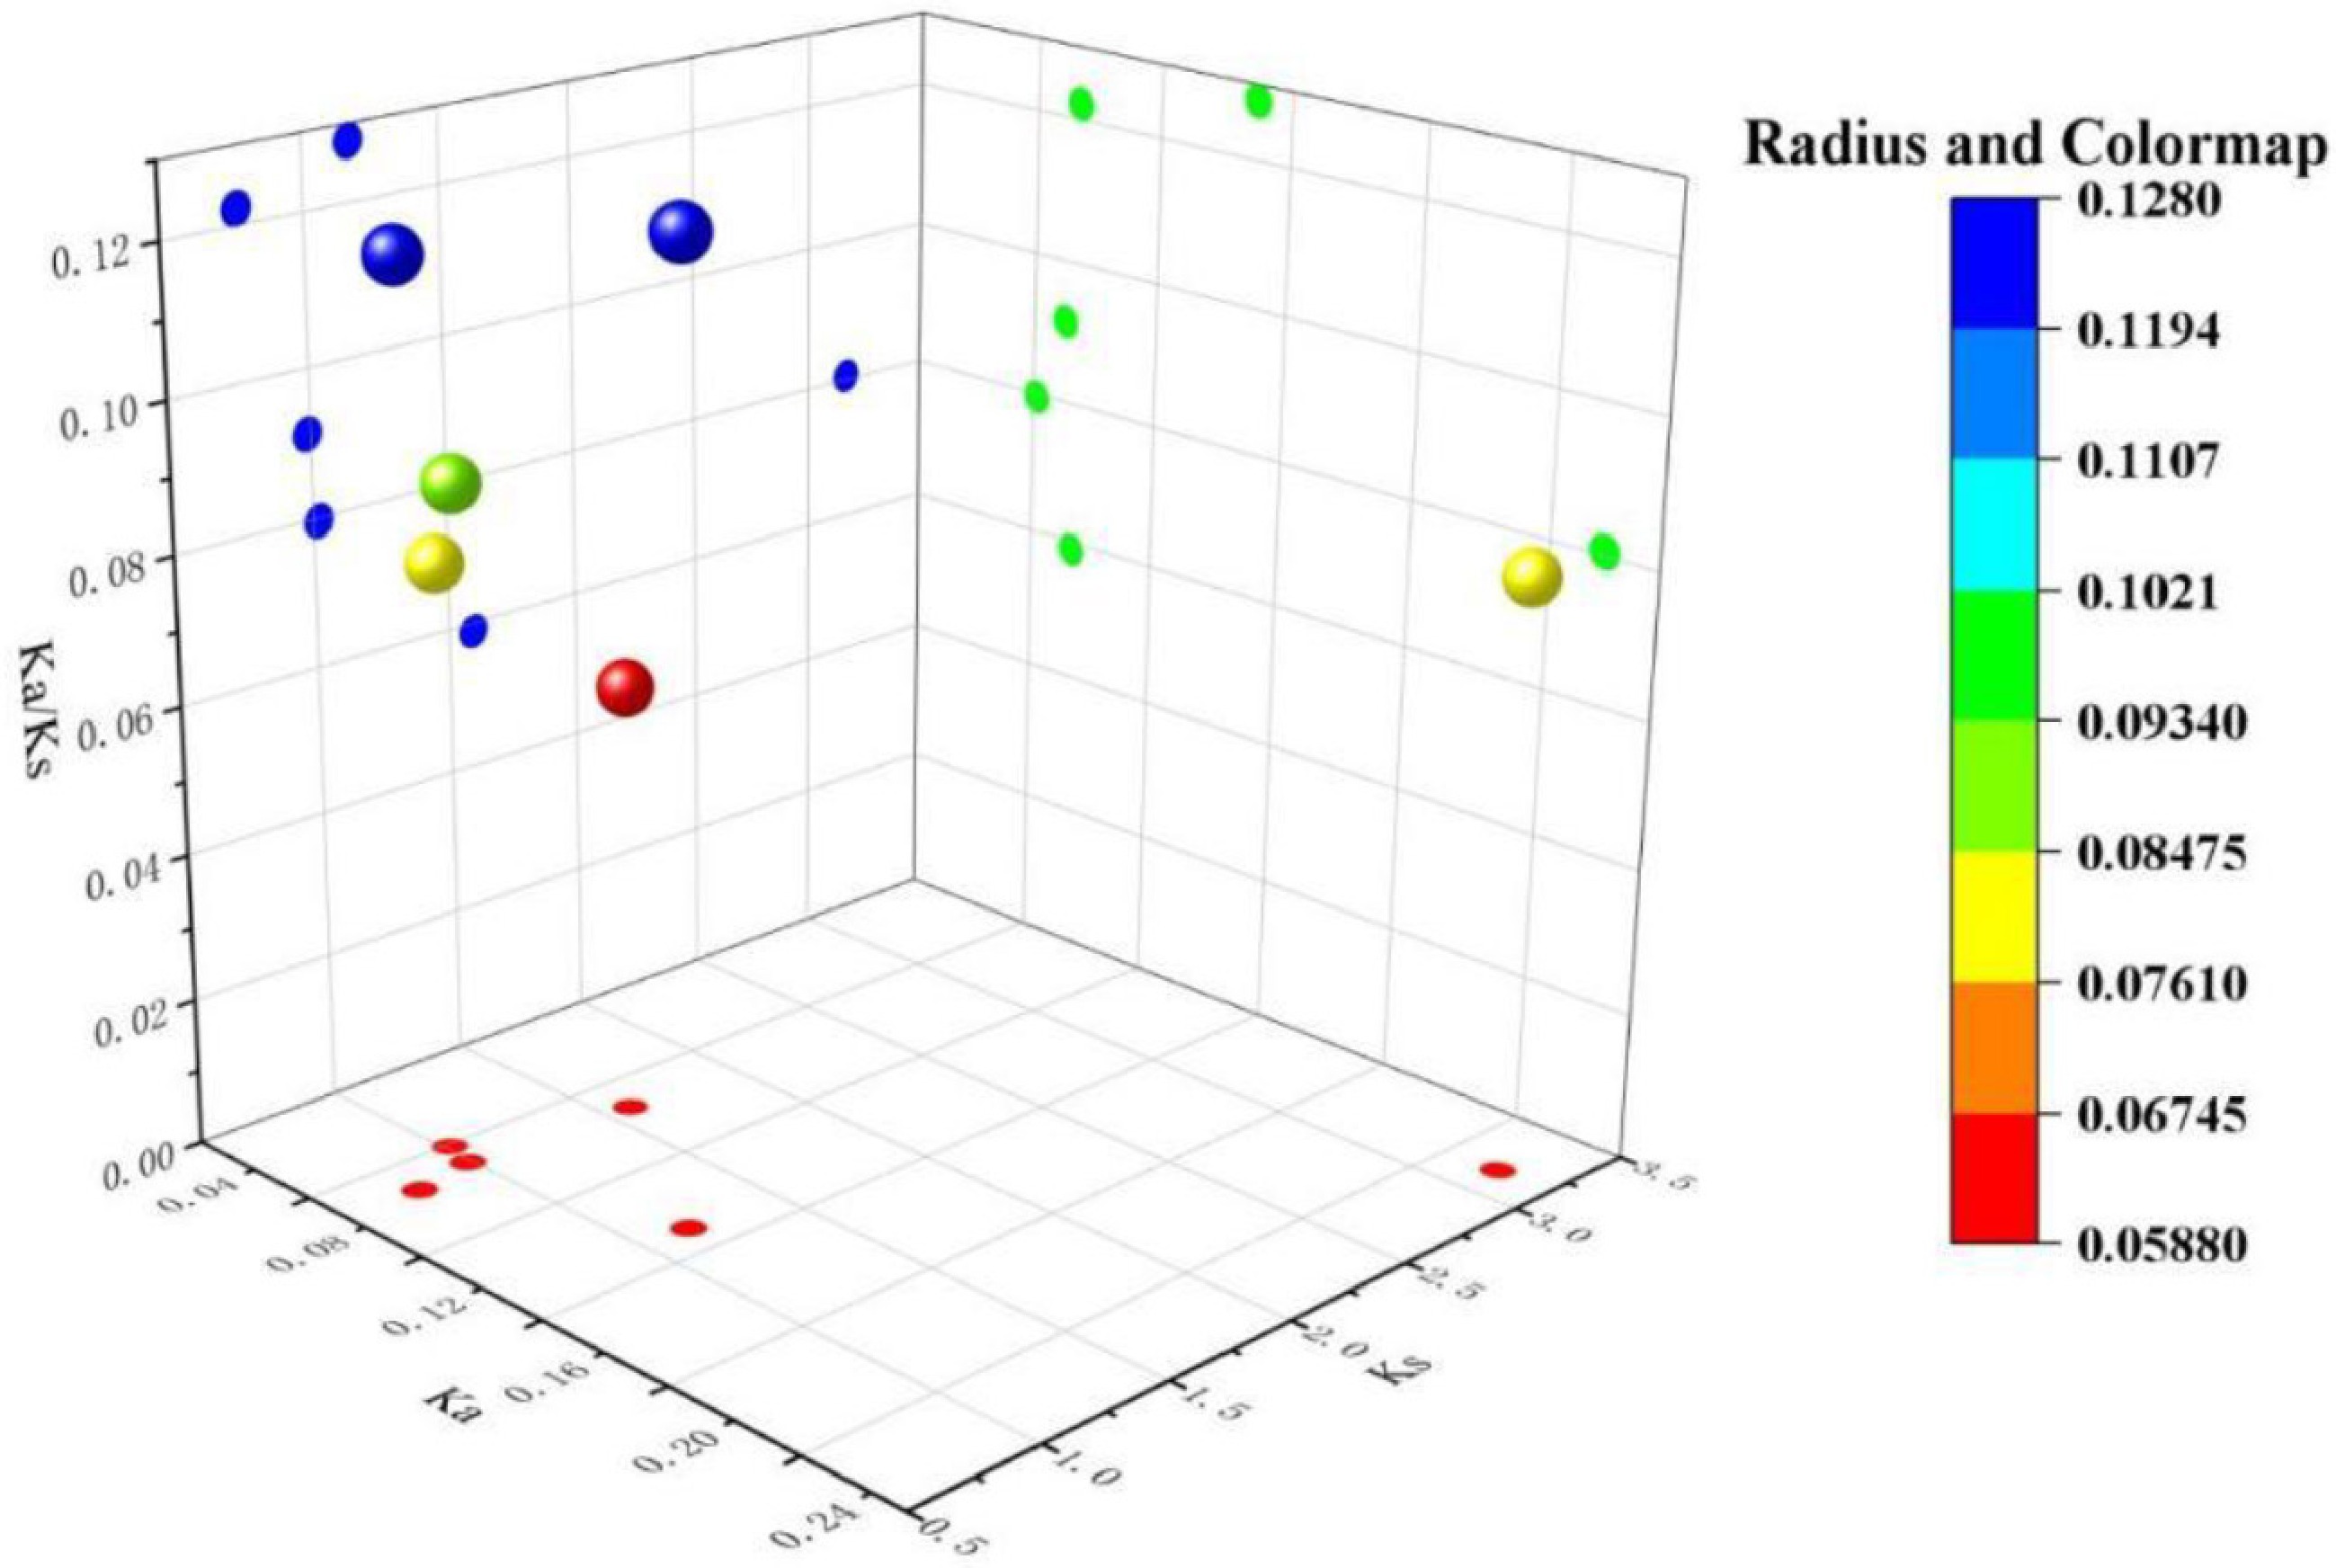
Figure 6.
Analysis of Ka/Ks ratios for collinear genes in the lettuce CIPK gene family. The bubble chart displays the distribution of Ka, Ks, and Ka/Ks values for each gene pair, with color and bubble size indicating the range of Ka/Ks ratios.
-
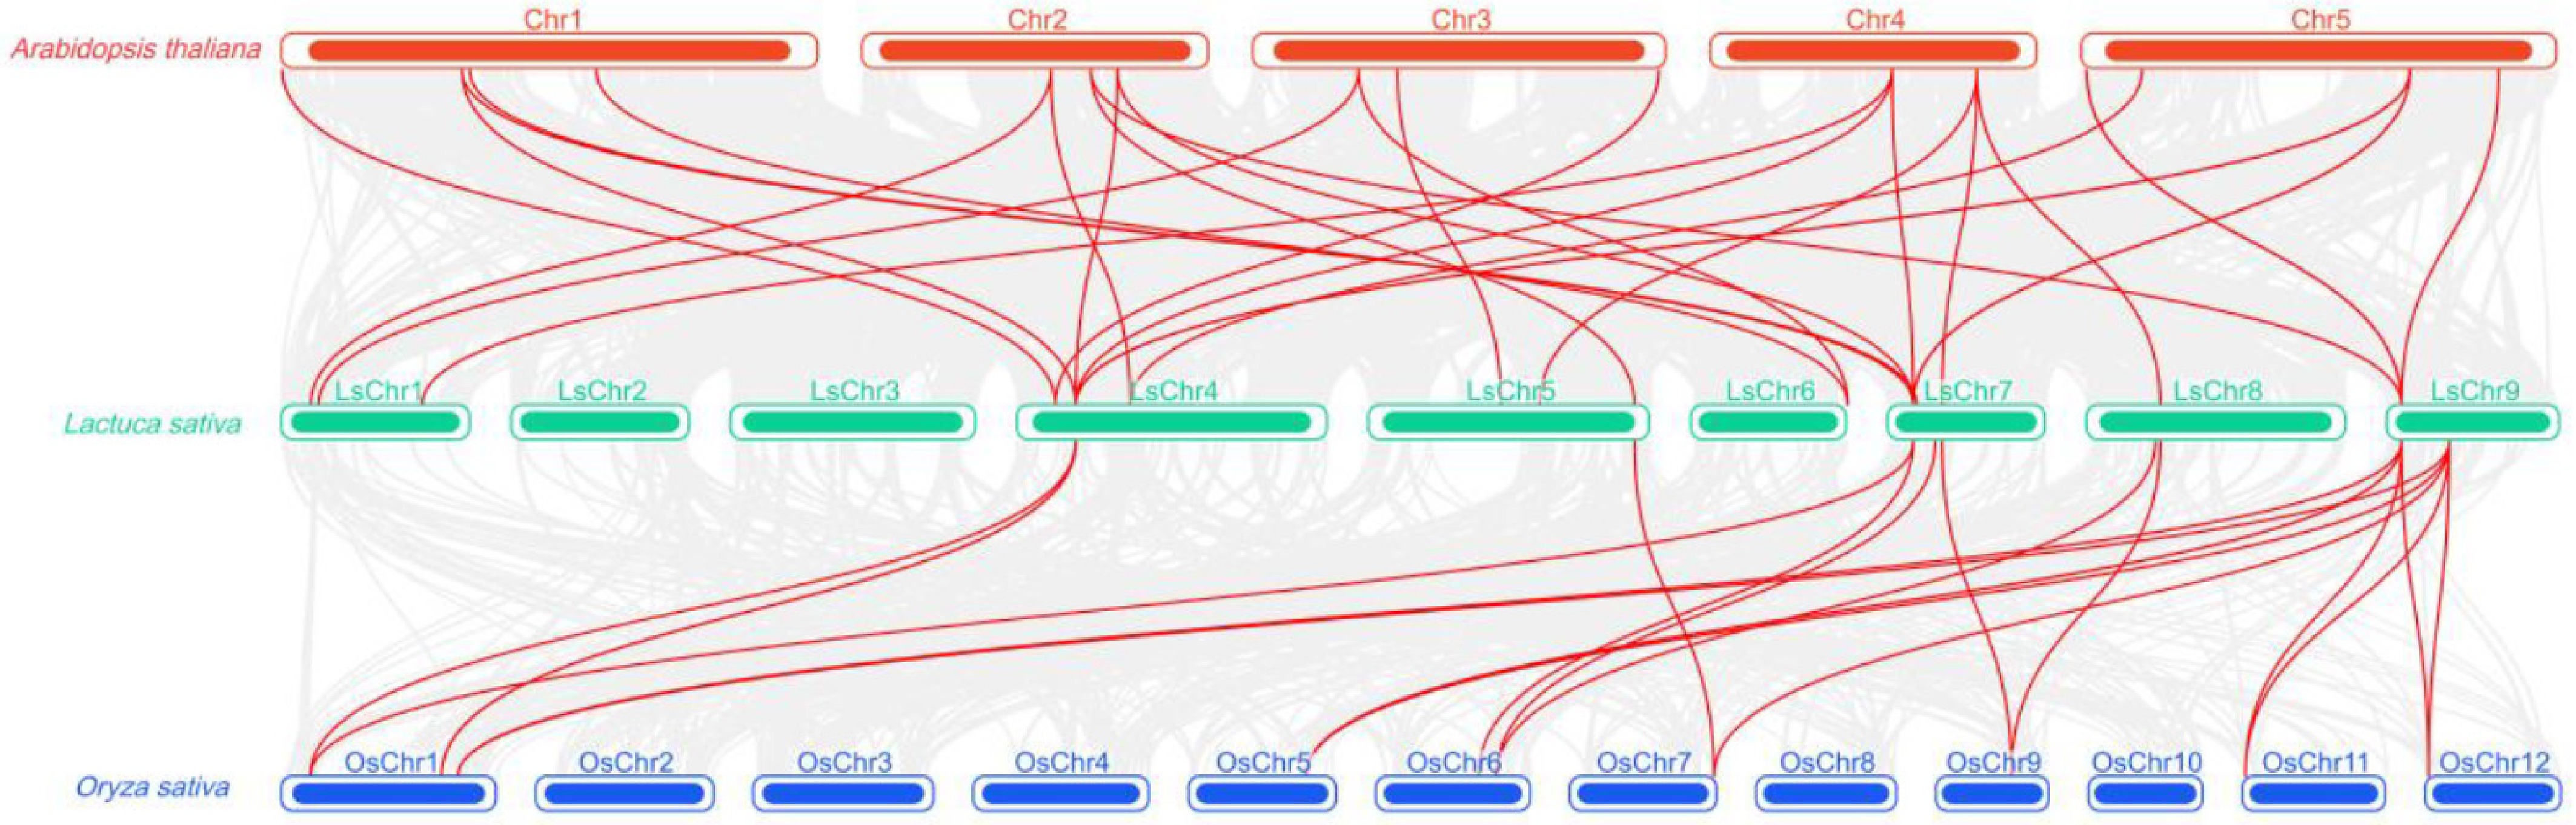
Figure 7.
Cross-species orthology analysis of the CIPK gene families in lettuce, Arabidopsis, and rice. Red lines indicate homologous gene pairs between different species; the top panel shows Arabidopsis chromosomes (red), the middle panel shows lettuce chromosomes (green), and the bottom panel shows rice chromosomes (blue); the density of lines reflects the degree of colinearity among CIPK genes across different species.
-
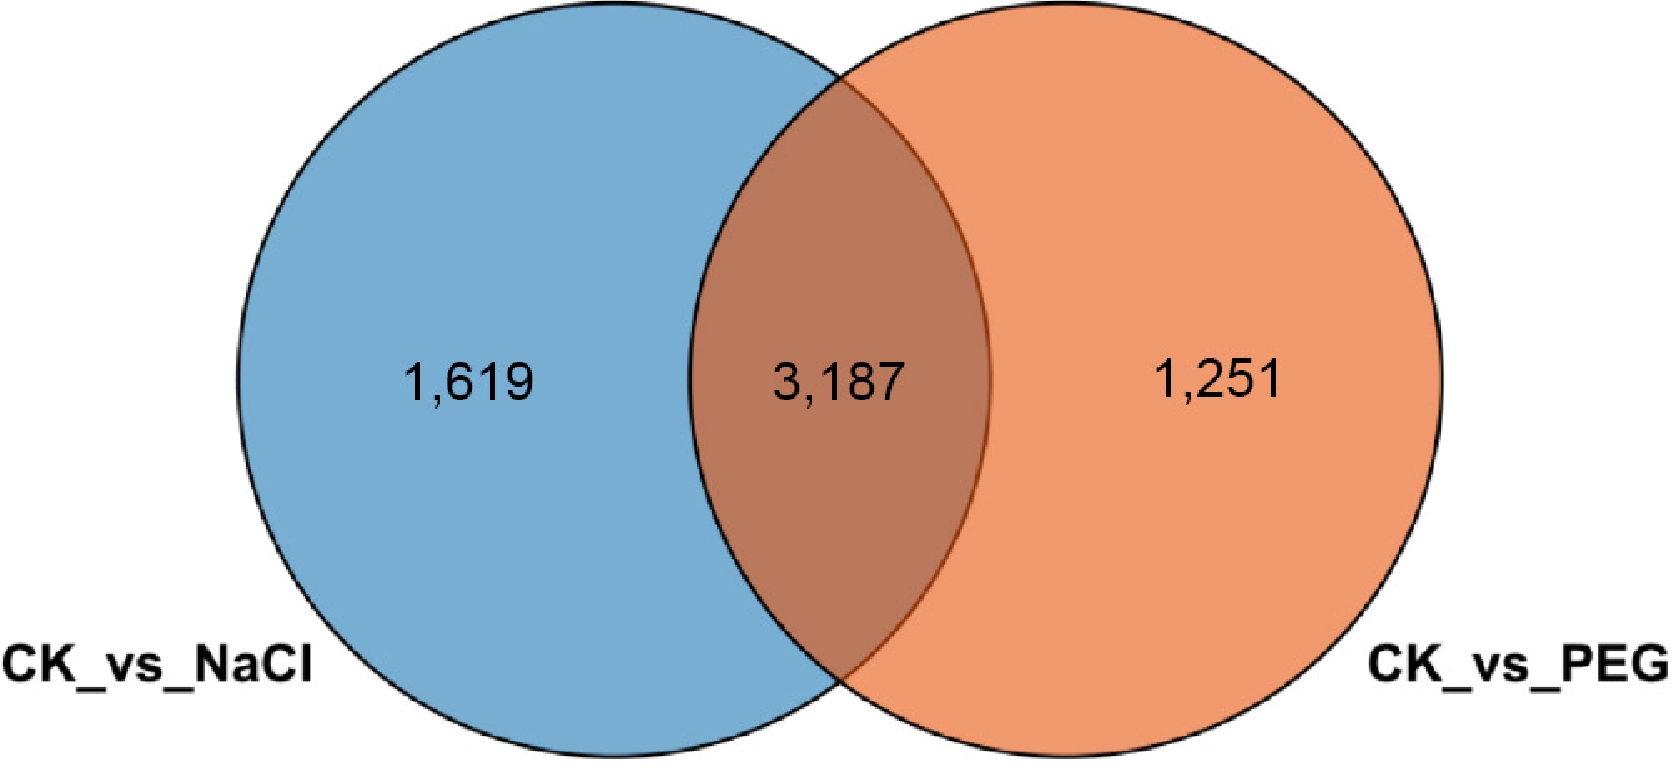
Figure 8.
Venn diagram of differentially expressed genes in lettuce under salt stress and drought stress. Blue and orange circles represent DEGs under salt stress and drought stress, respectively. The overlapping region indicates differentially expressed genes common to both treatments.
-
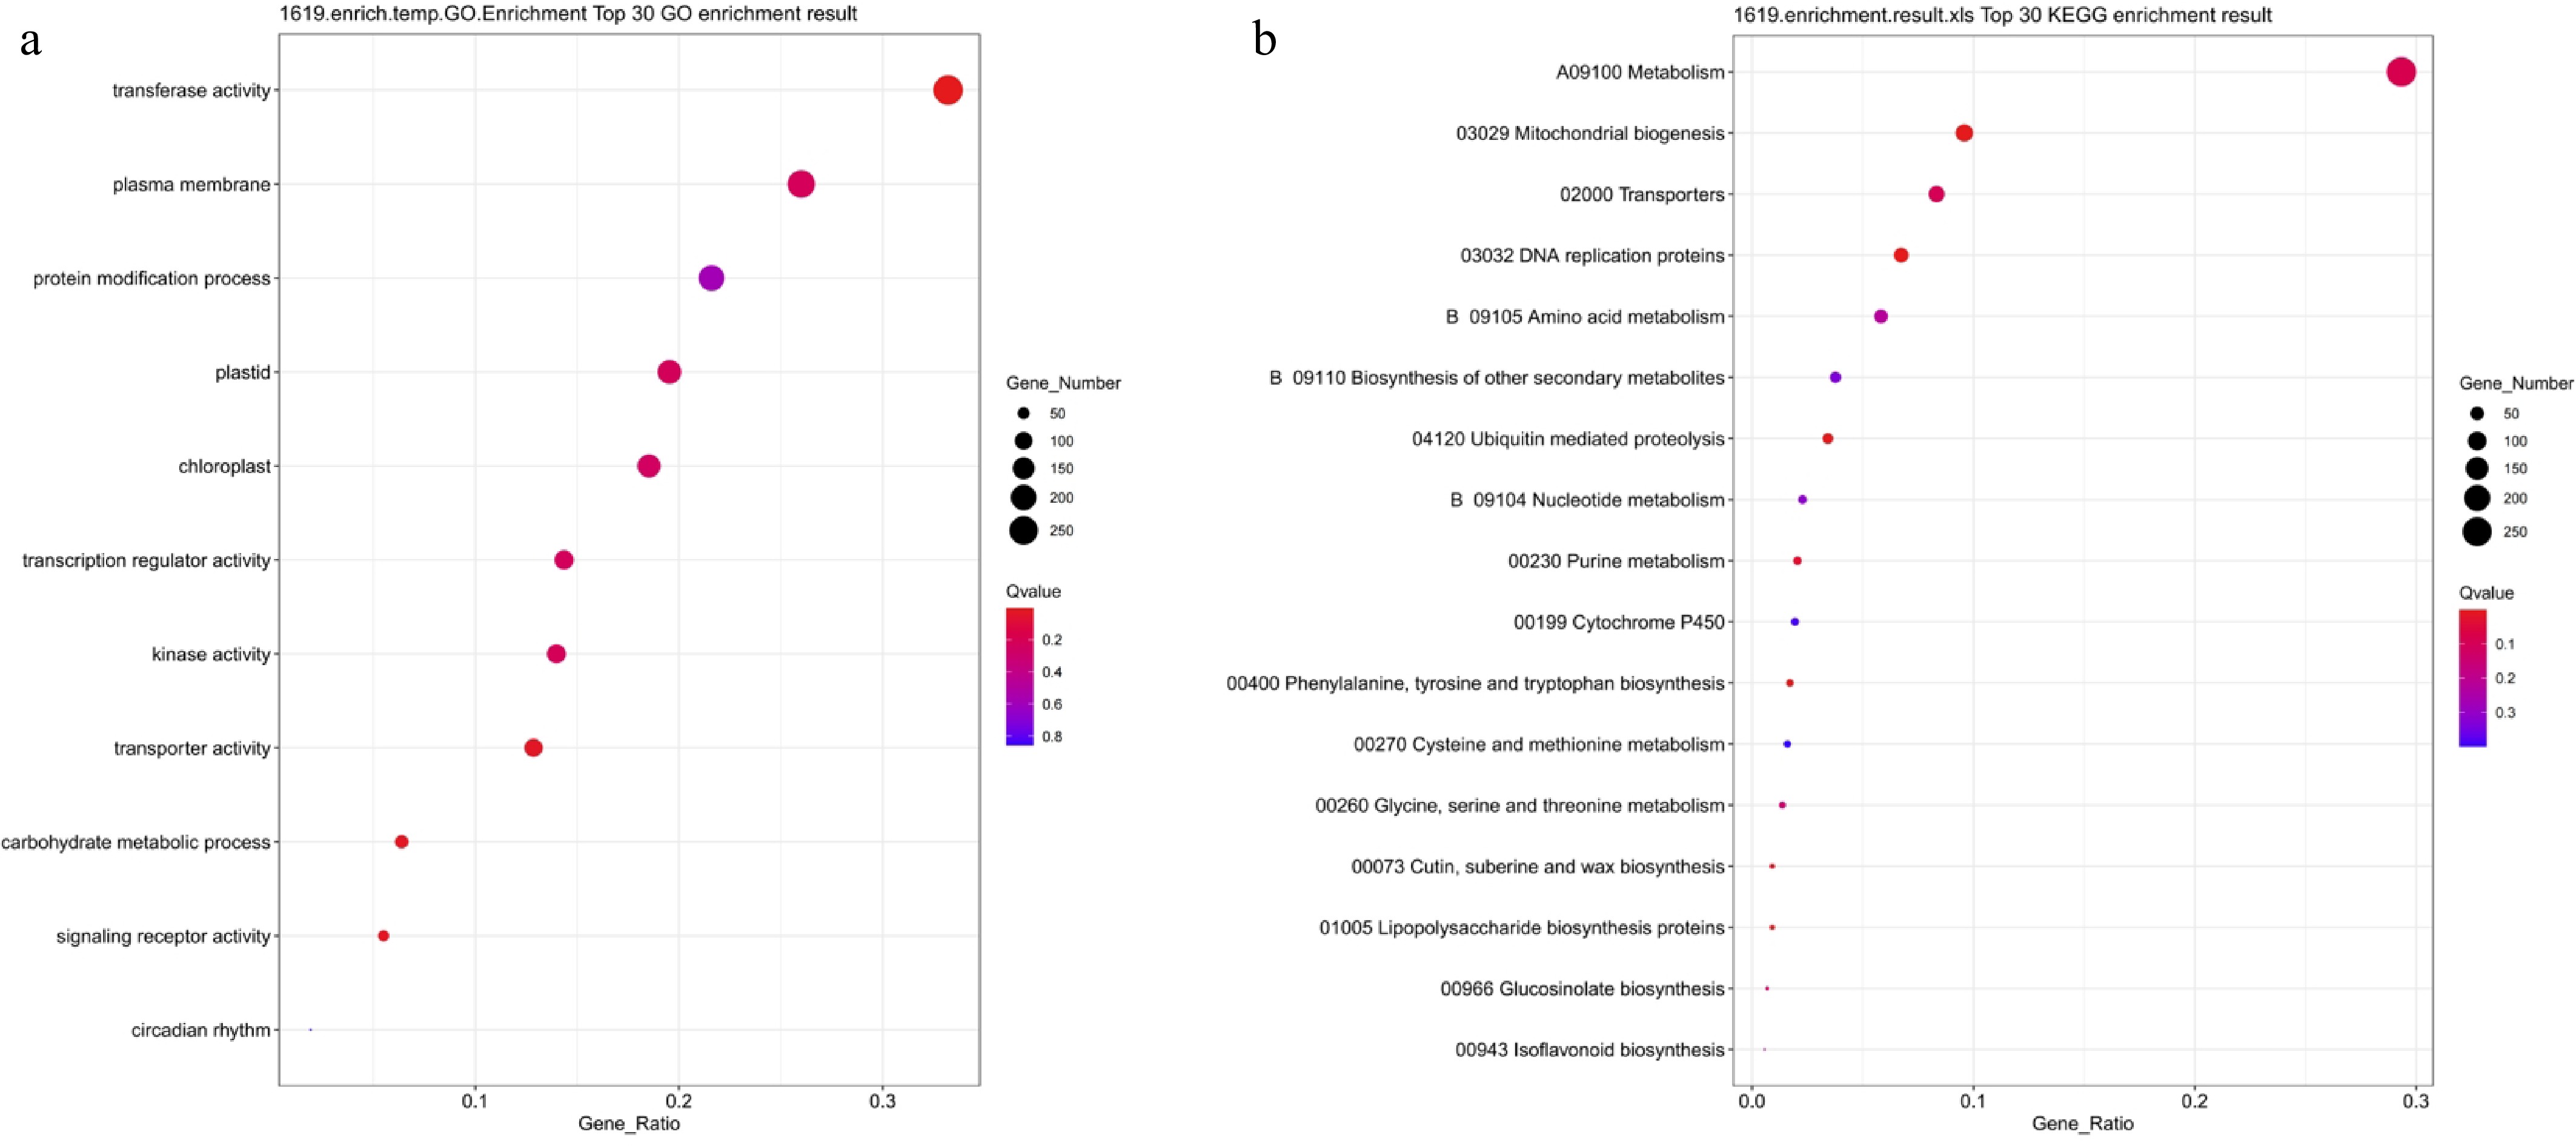
Figure 9.
GO and KEGG functional enrichment analysis of NaCl-treated differentially expressed genes. (a) GO enrichment analysis; (b) KEGG enrichment analysis. Bubble size indicates the number of enriched genes, color represents significance (Q-value), and the horizontal axis shows enrichment factor. A smaller Q-value indicates more significant enrichment.
-
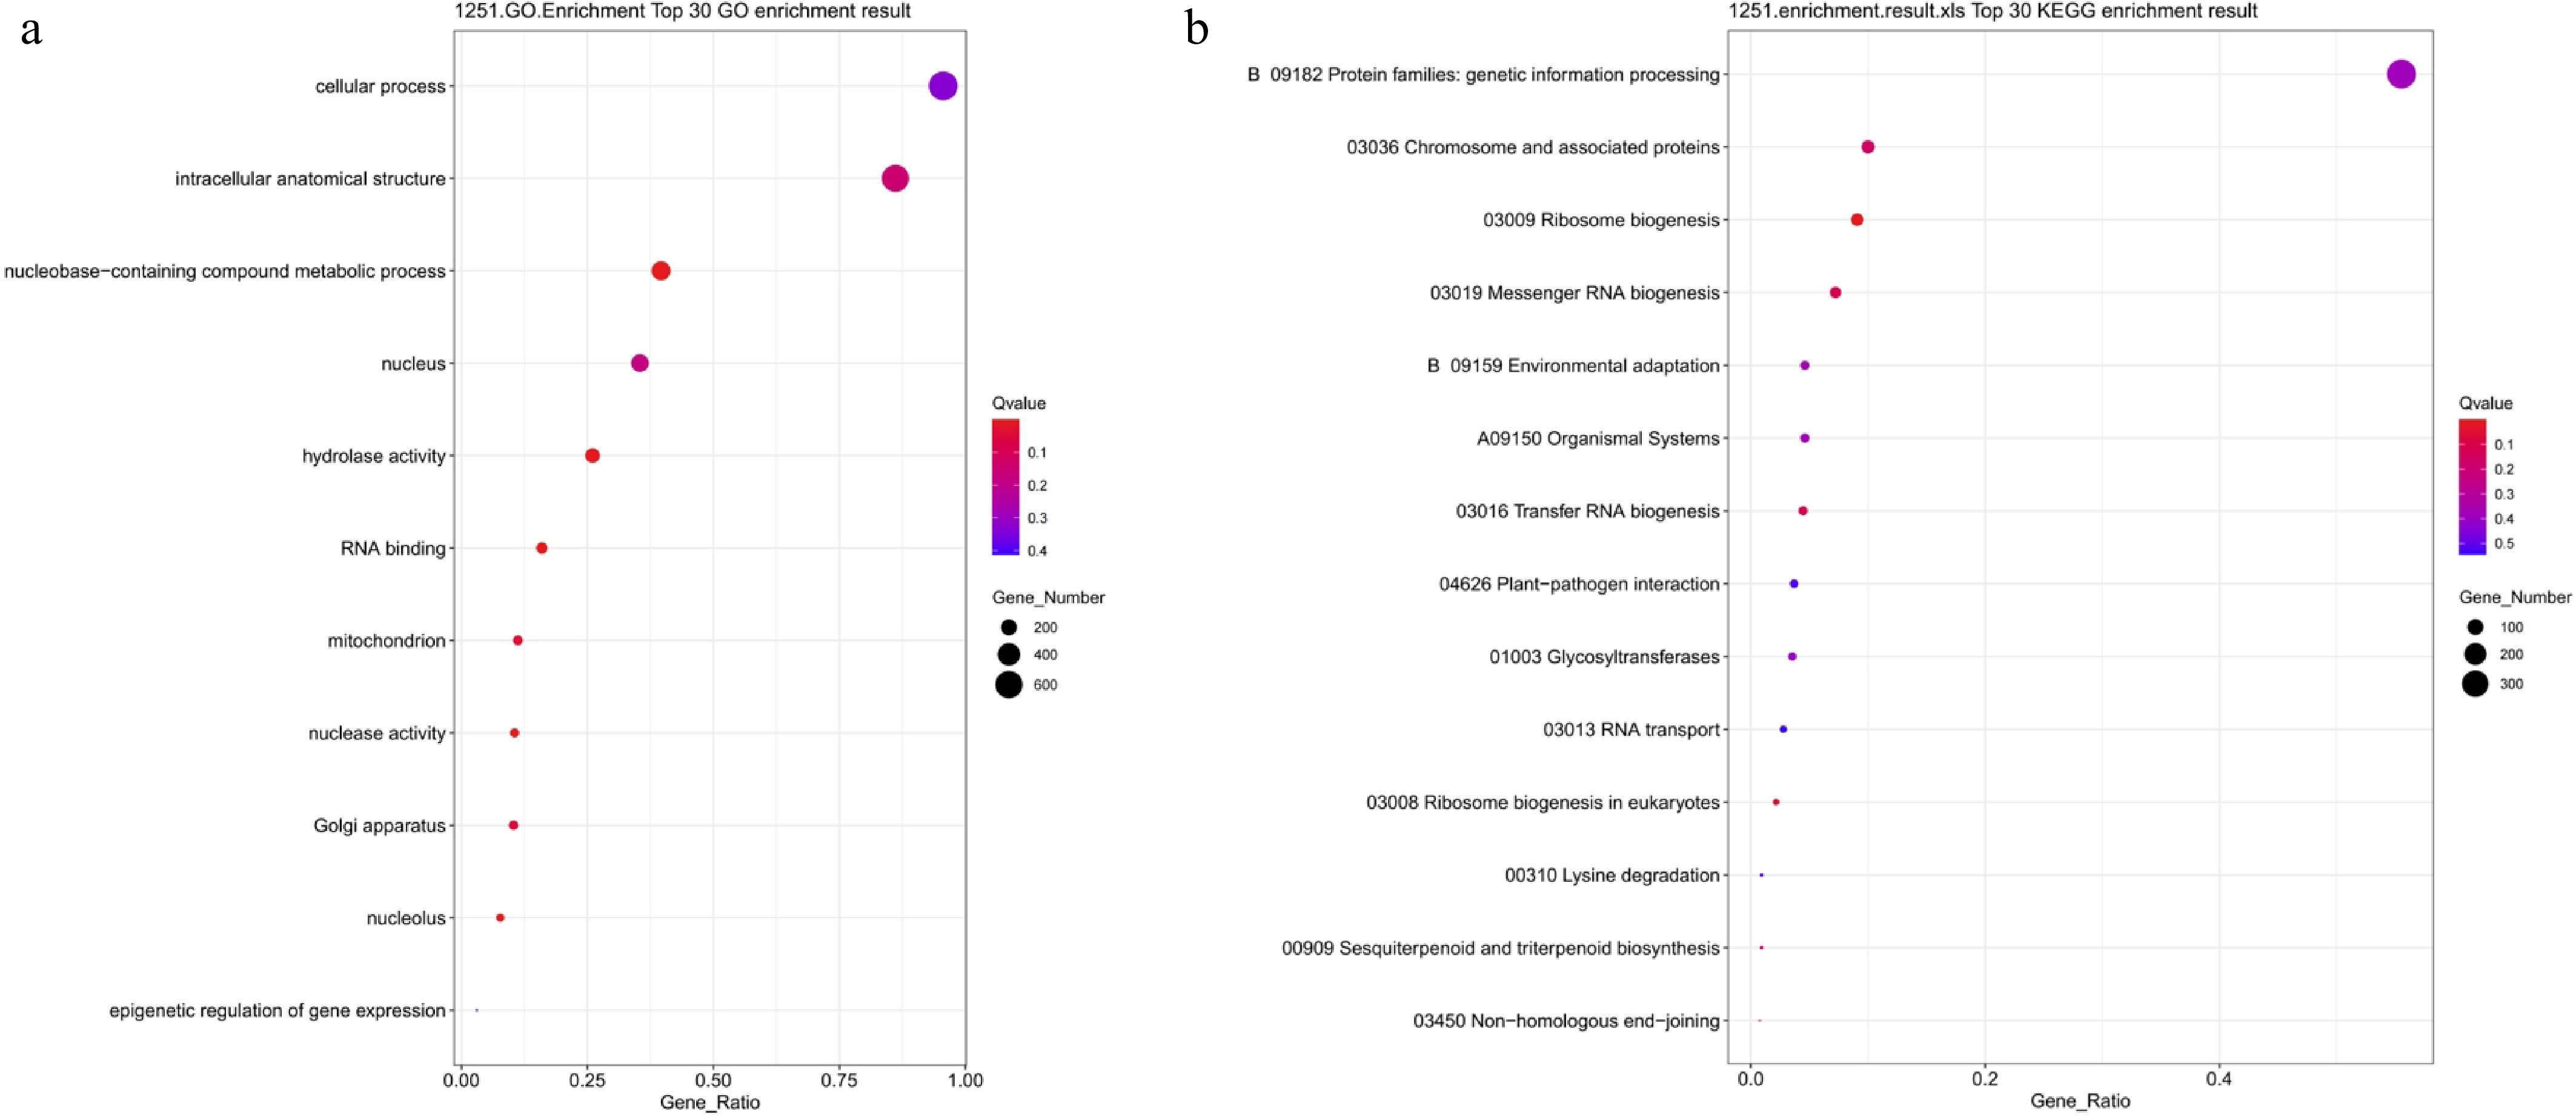
Figure 10.
GO and KEGG functional enrichment analysis of PEG-treated differentially expressed genes. (a) GO enrichment analysis; (b) KEGG enrichment analysis. Bubble size indicates the number of enriched genes, color represents significance (Q-value), and the horizontal axis shows enrichment factor. A smaller Q-value indicates more significant enrichment.
-
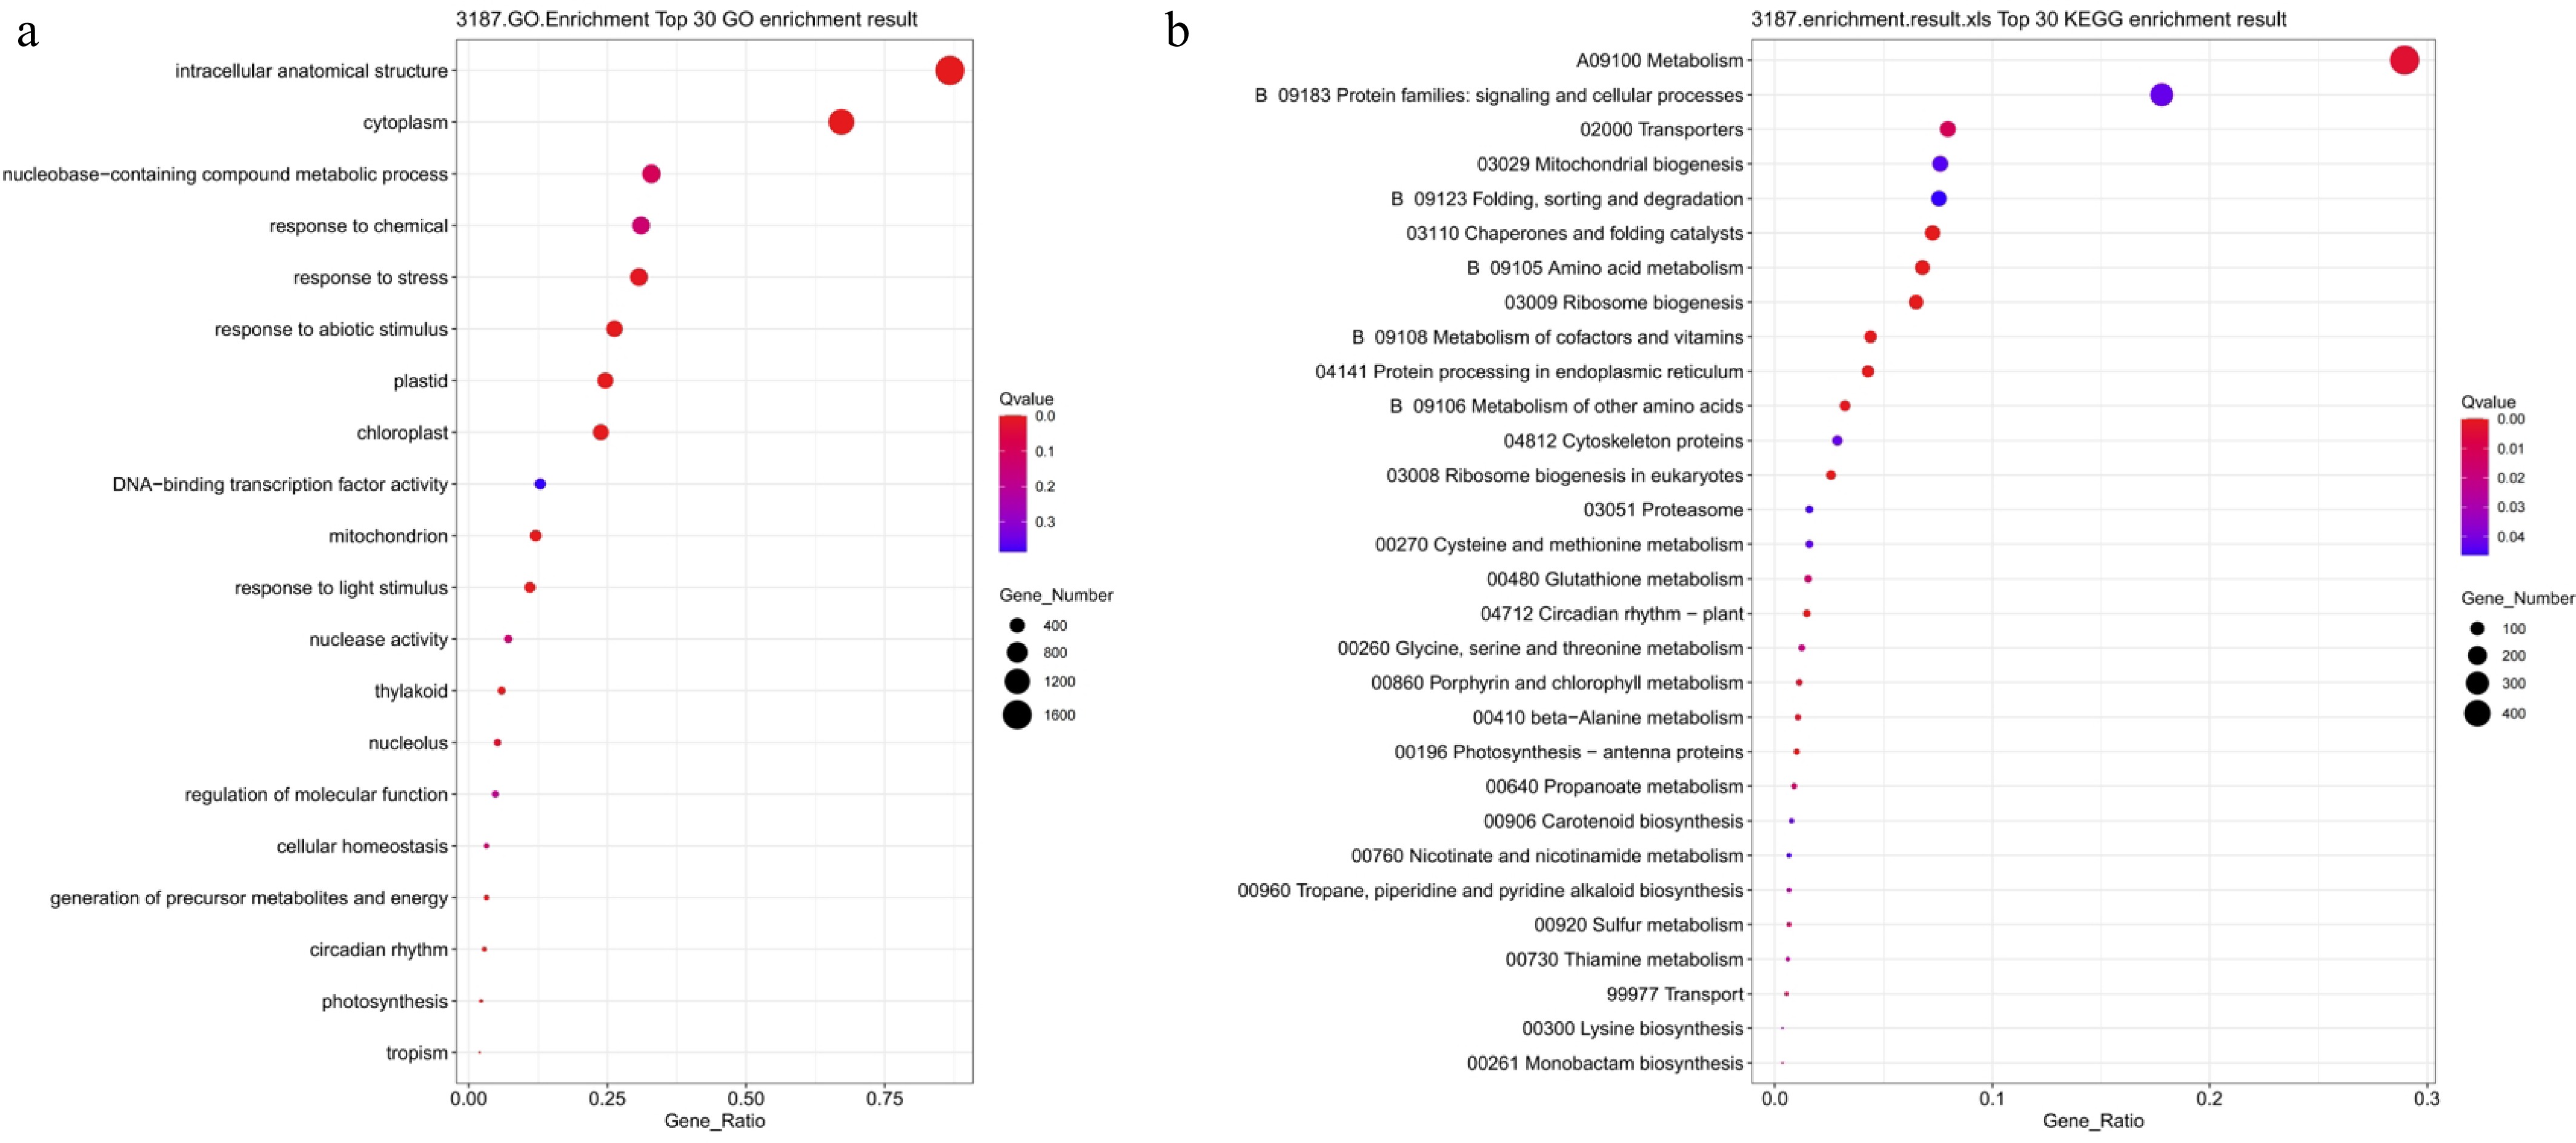
Figure 11.
GO and KEGG functional enrichment analysis of genes differentially expressed in both salt stress and drought stress. (a) GO enrichment analysis; (b) KEGG enrichment analysis. Bubble size indicates the number of enriched genes, color represents significance (Q-value), and the horizontal axis shows enrichment factor. A smaller Q-value indicates more significant enrichment.
-
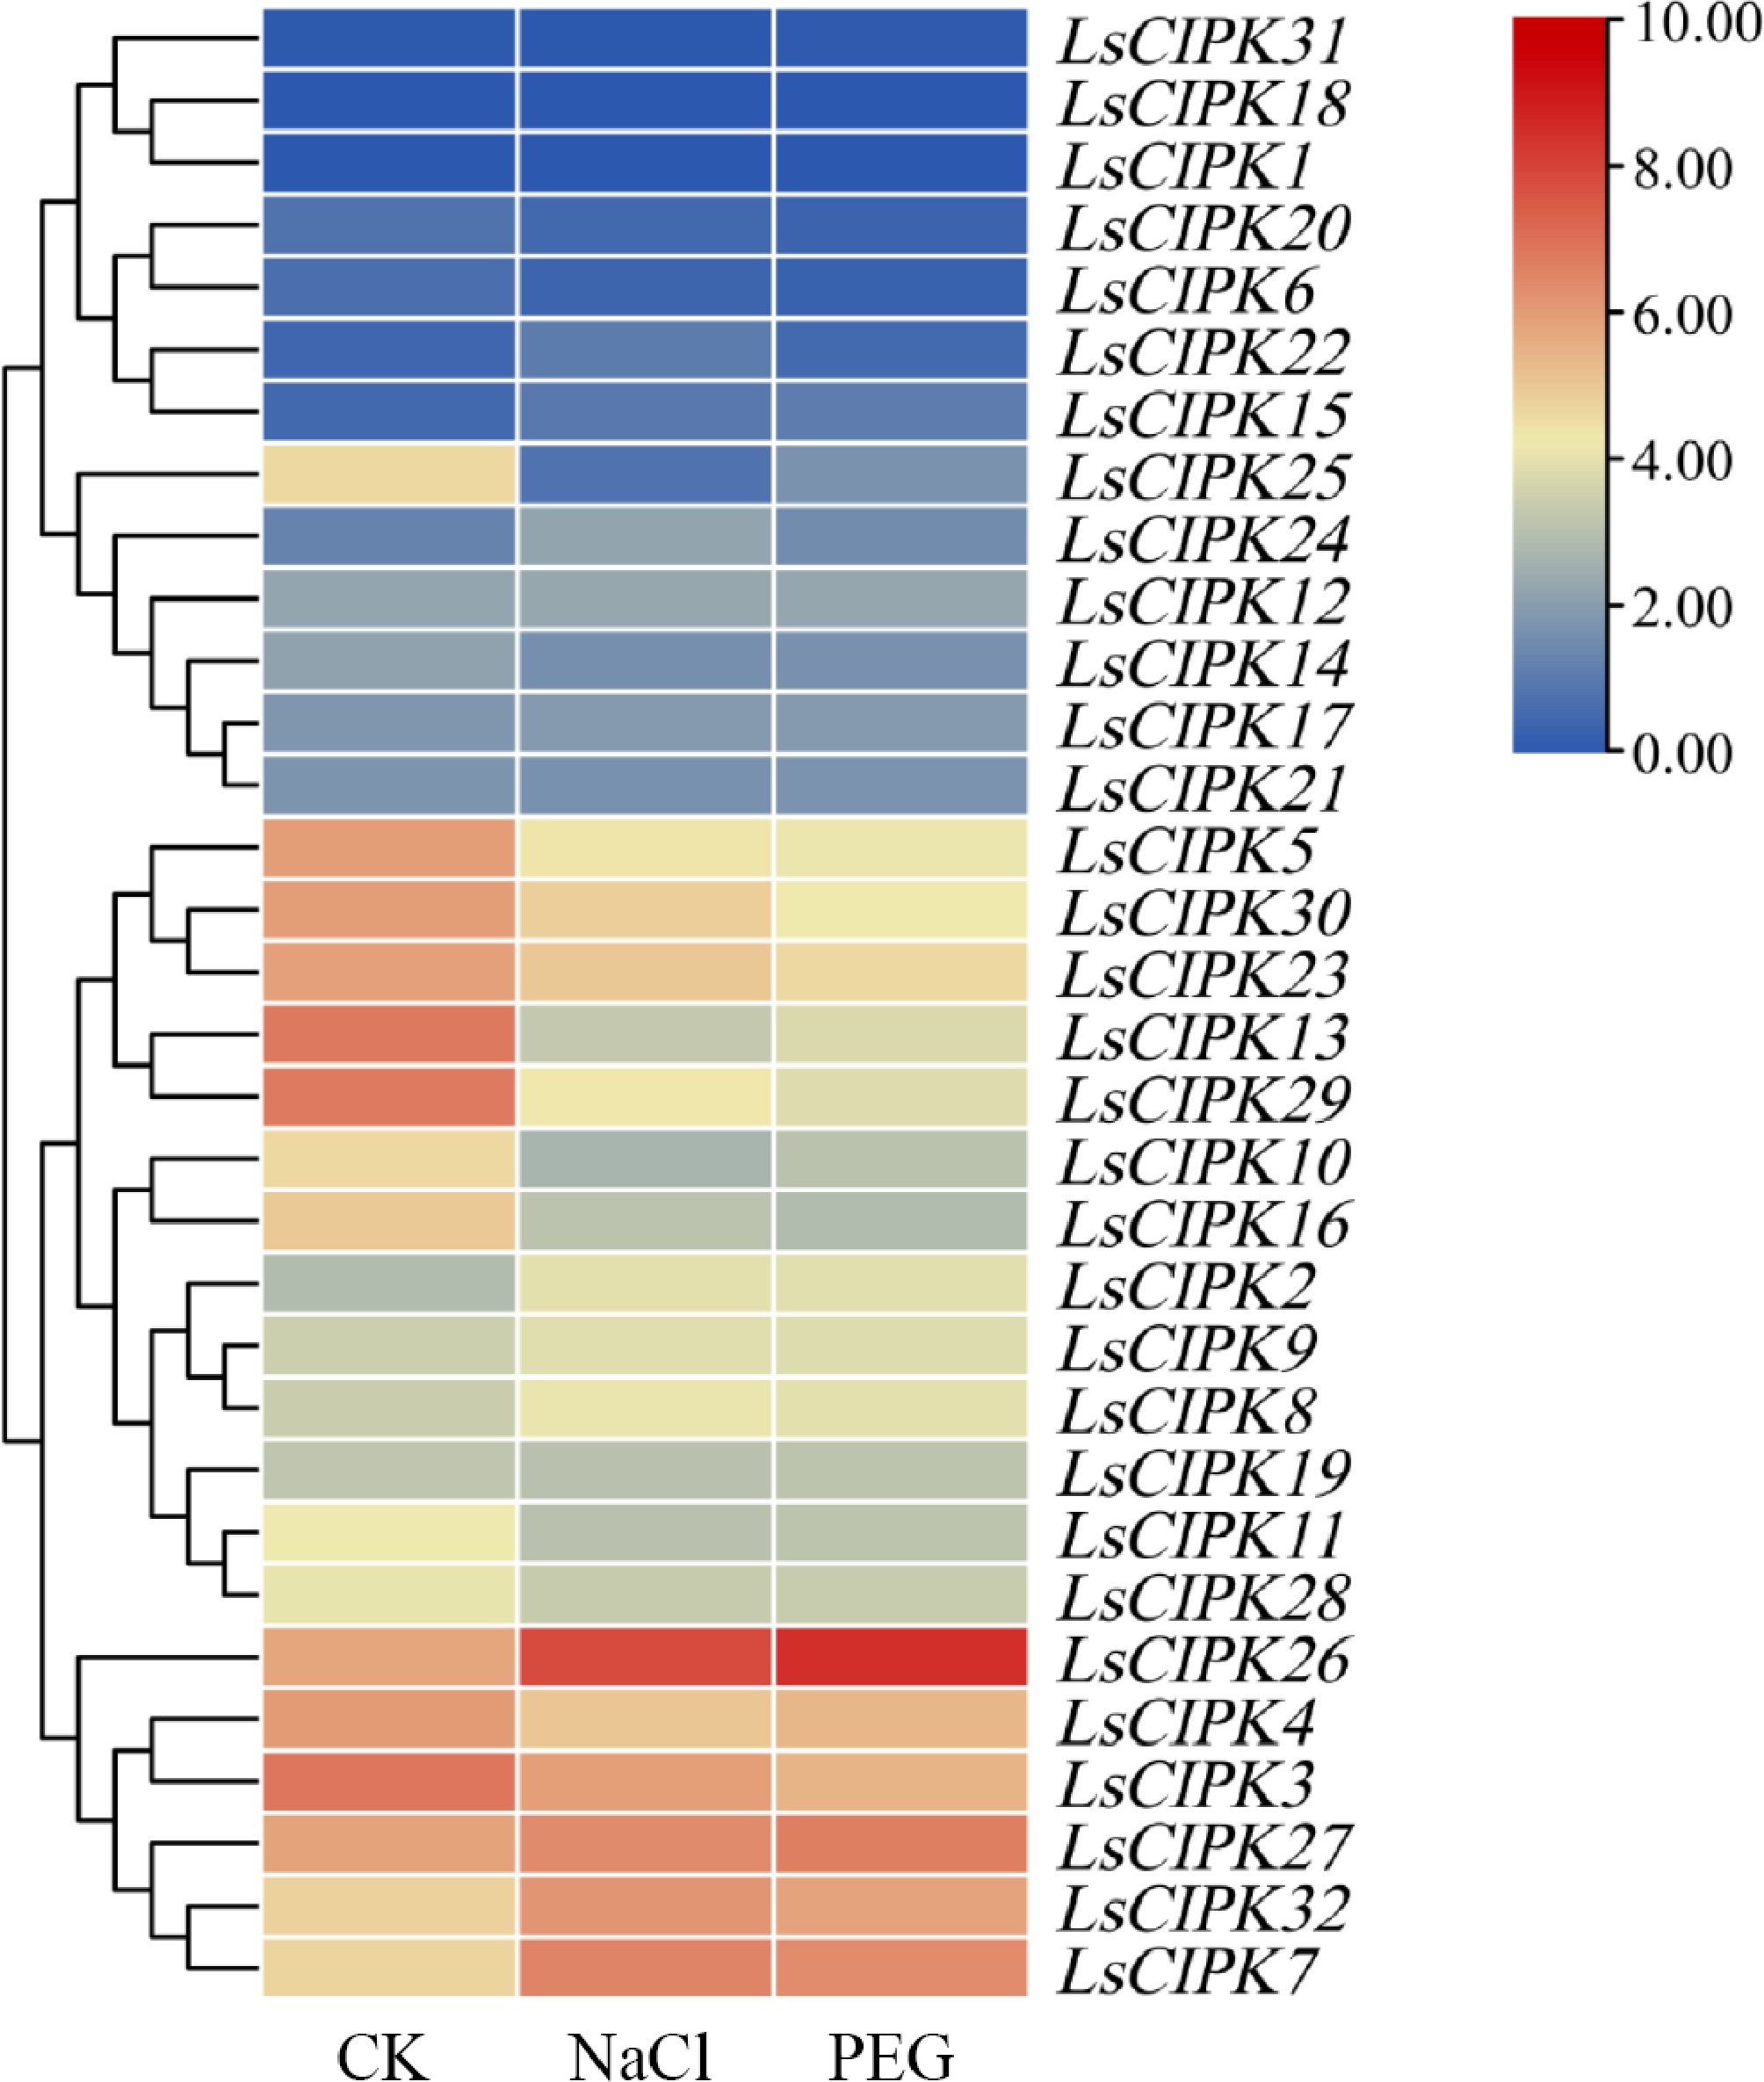
Figure 12.
Heatmap of expression patterns of the LsCIPK genes under salt stress (NaCl) and drought stress (PEG) treatments. The color bars in the heatmap represent expression levels converted to log2 (log2[TPM + 1]), with values ranging from 0 to 10: dark blue indicates lower expression, while dark red indicates higher expression. CK denotes the control group, NaCl represents the salt stress treatment group, and PEG indicates the drought stress treatment group.
-
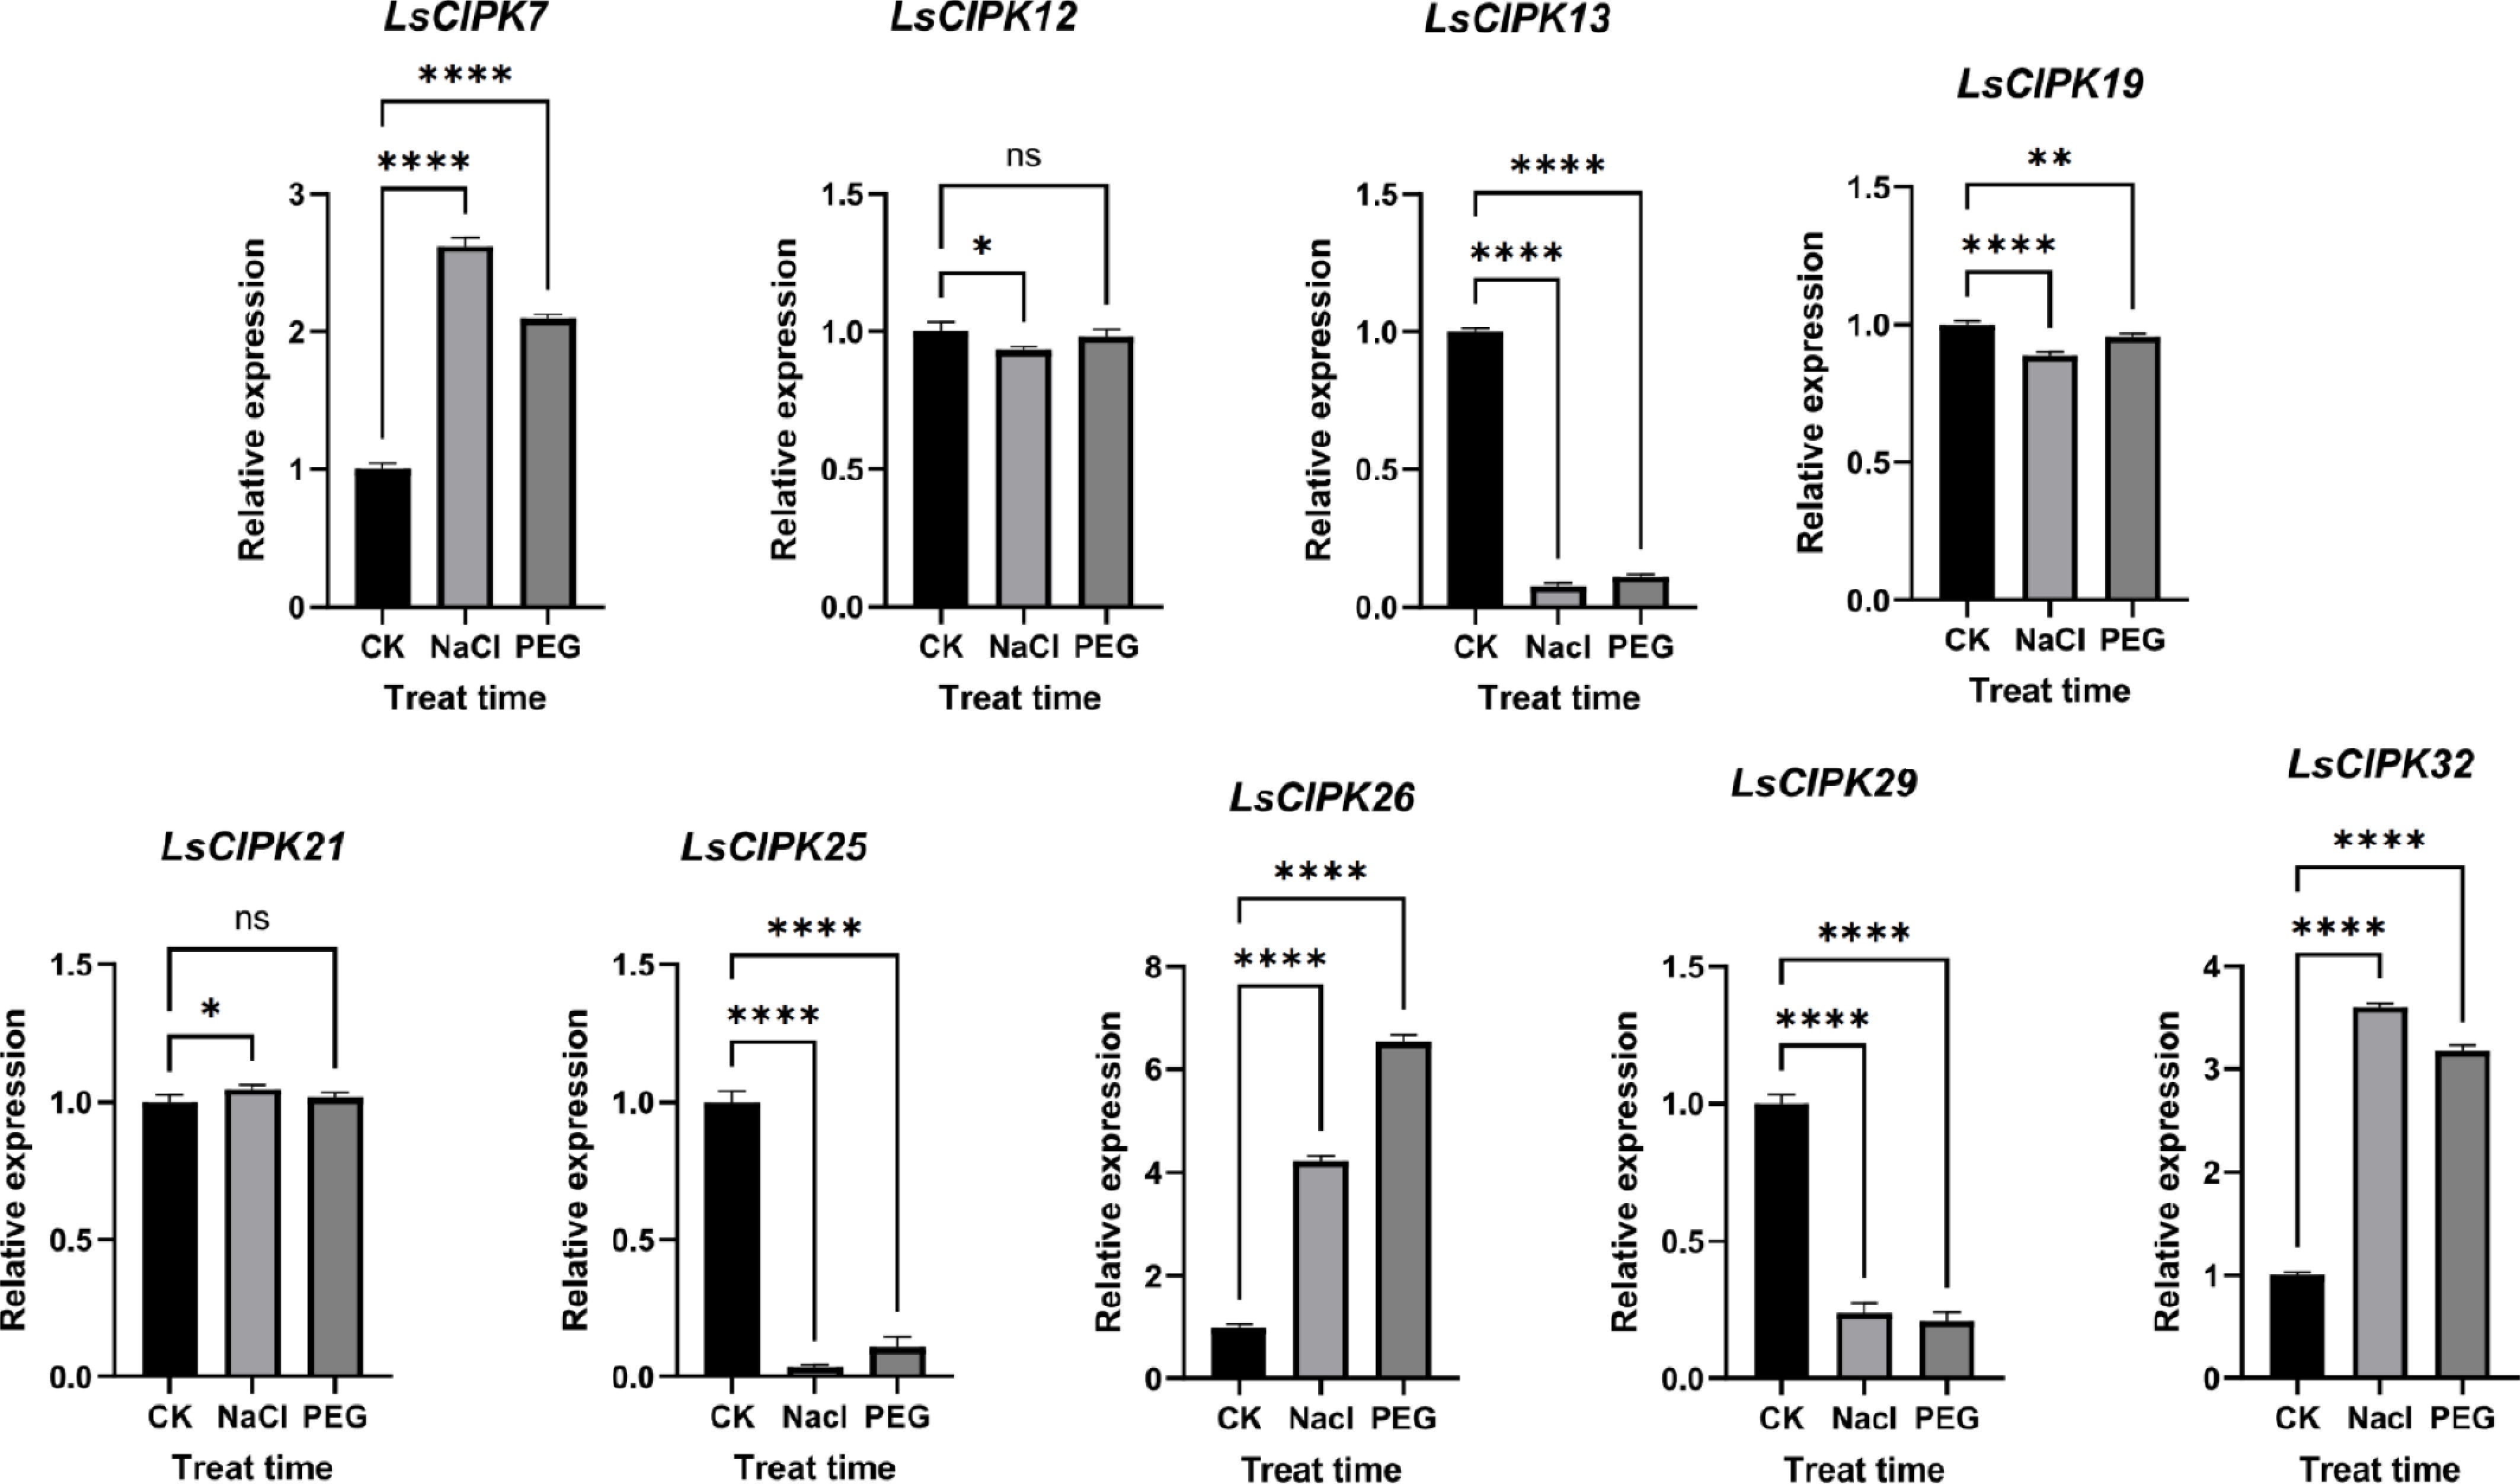
Figure 13.
qRT-PCR expression analysis of the lettuce CIPK genes under salt (NaCl), and drought (PEG) stress. CK represents the control group, NaCl denotes the salt stress treatment group, and PEG indicates the drought stress treatment group; error bars represent standard errors (n = 5); ns indicates p > 0.05, * p < 0.05, ** p < 0.01, *** p < 0.001, **** p < 0.0001.
-
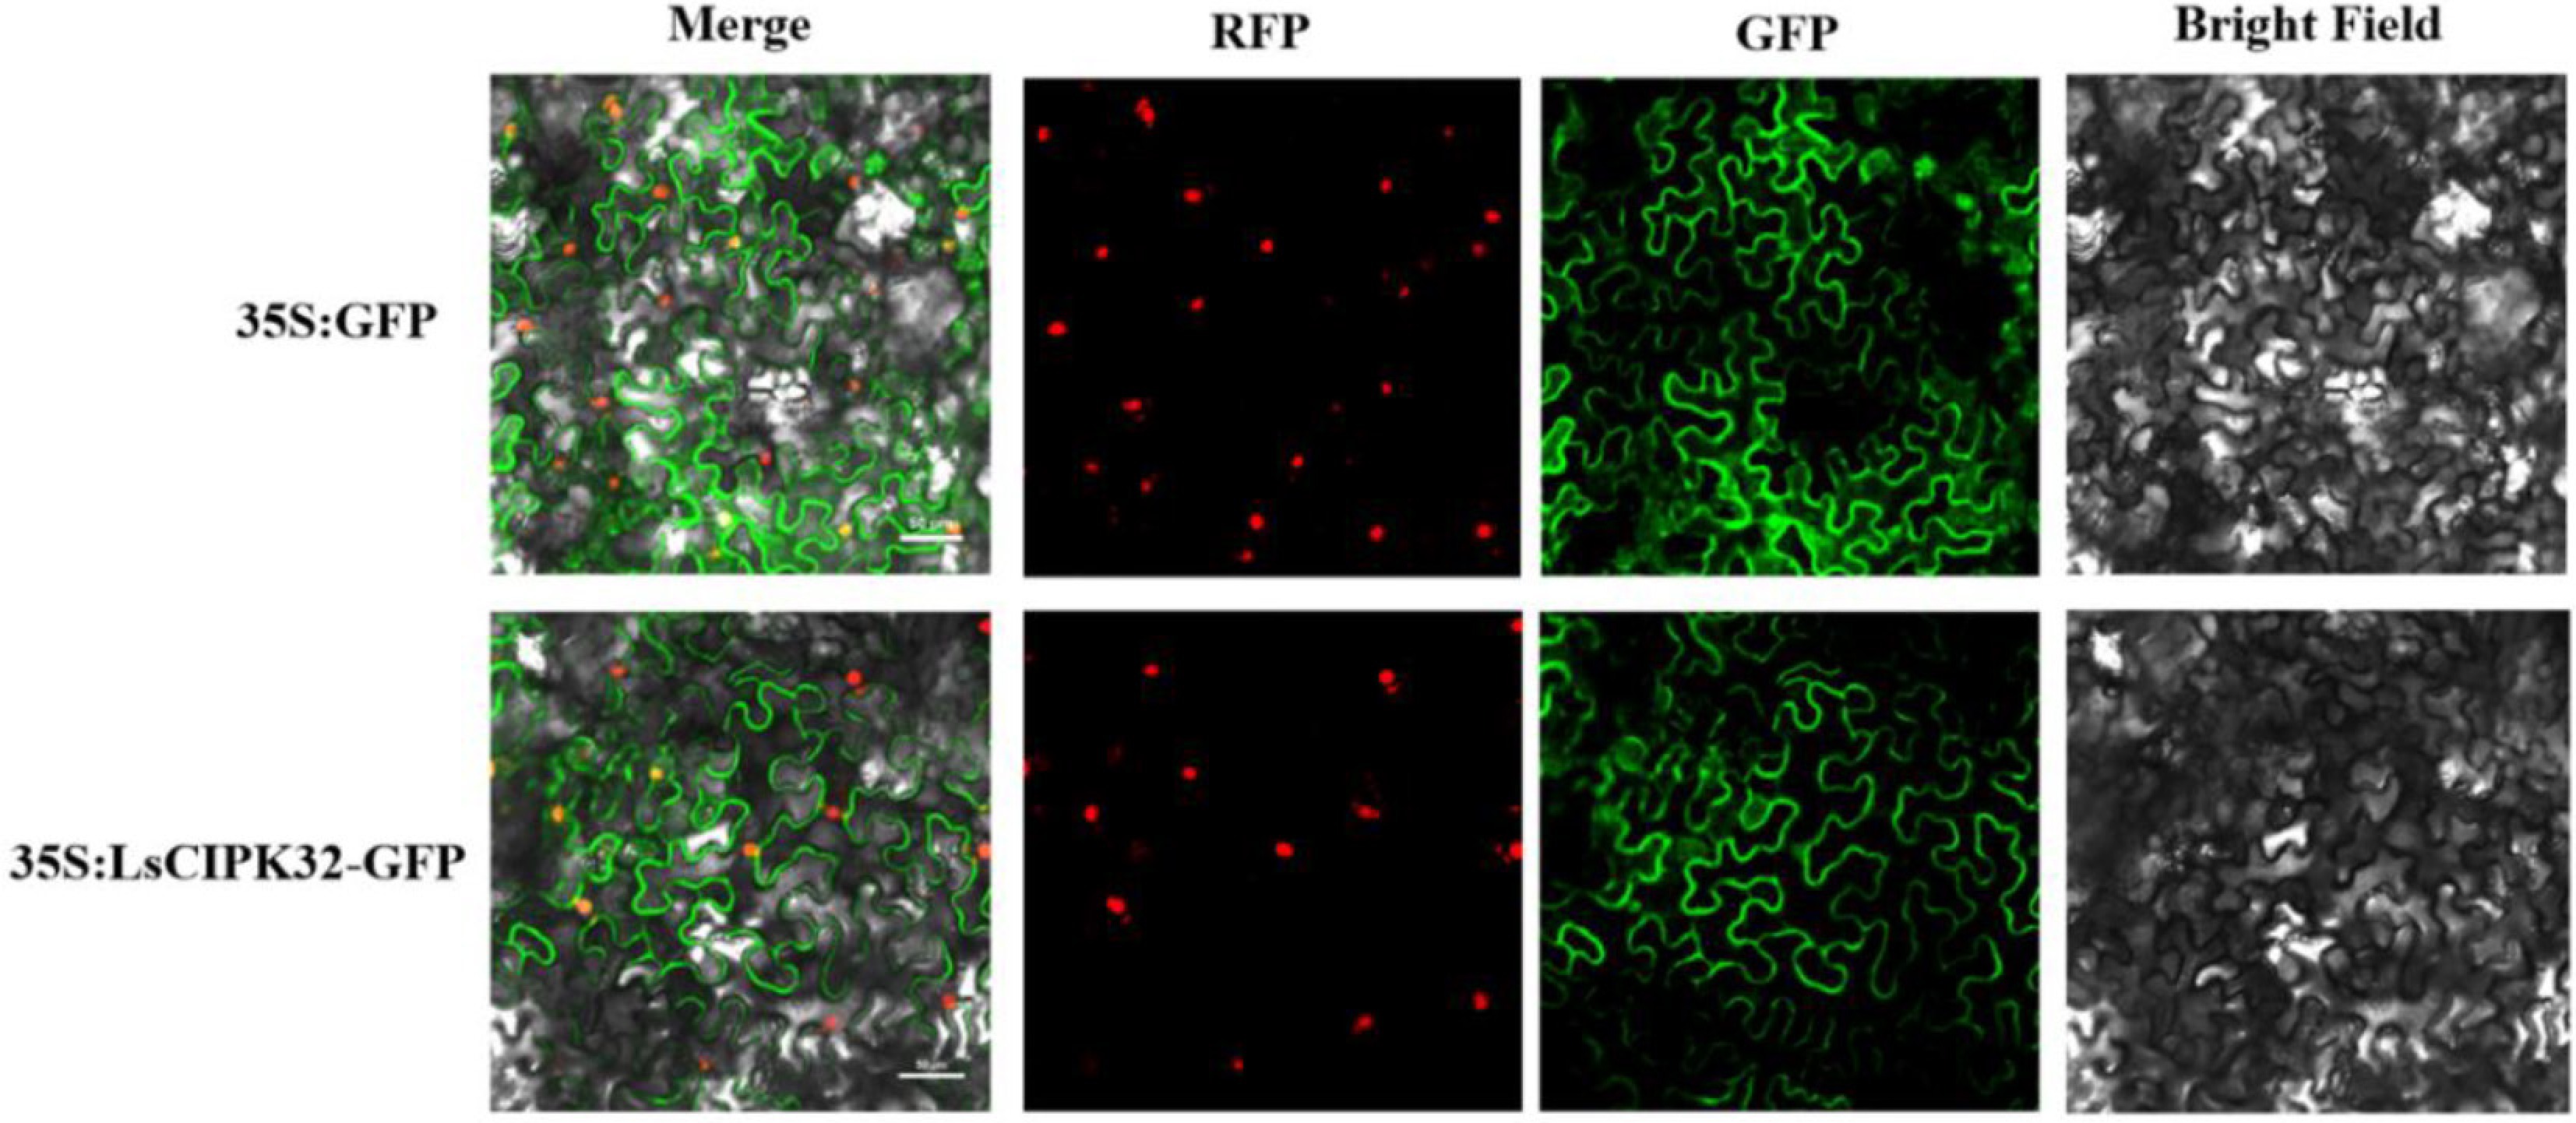
Figure 14.
Subcellular localization analysis of the LsCIPK32 protein. Merge, RFP, GFP, and Bright Field represent signal merging, red fluorescence channel, green fluorescence channel, and bright field image, respectively. Scale bar = 50 μm.
-
Name Forward primers (5'-3') Reverse primers (5'-3') LsActin CTGGTGTGATGGTAGGTATGG CTCGTTGTAGAAAGTGTGATGC LsCIPK1 CGCGAAGGTCAAGTTTGCTC TGGGAGGTATCCAGCCATCA LsCIPK7 GTAGCACACCGTGACCTCAA CCGCCACCGTCTTCTCTATC LsCIPK13 TGAAGGTGACGGATTTCGGG CGACGTCGTCTTCGCAGATA LsCIPK21 CACGAGGTTTTGGCAAGCAA CCTCTGCCCGTTGTGATCTT LsCIPK25 GGCCTAAACCTGTCTGCCTT ACGGAAGCTCCTTCAAGACG LsCIPK26 TTGGACTCAGCGCTTTTTGC CACCAGAAACGACGGAGTGA LsCIPK29 AGGTCTACCATGGCTGGGAT ACGTCCATTTCGGAACACGA LsCIPK31 CCAGCAATTGATCACAGCCG GGTGCCACATAAGCAGGAGT LsCIPK32 CACATGTGGTACTCCGGCTT CACCATGCCATGCACAAACA Table 1.
qRT-PCR primers.
-
Gene name The number
of amino acidMolecular
weight (Da)Theoretical pI Instability index Aliphatic
indexGrand average of hydropathicity Subcellular localization prediction LsCIPK1 904 102,285.14 6.54 40.05 88.36 −0.306 Plasma membrane; Cytoplasm; Endoplasmic Reticulum LsCIPK2 458 52,131.89 8.82 41.22 78.08 −0.398 Cytoplasm; Chloroplast; Nucleus LsCIPK3 446 5,0691.35 8 31.65 90.45 −0.4 Cytoplasm; Peroxisome; Nucleus LsCIPK4 483 54,689.08 8.88 42.81 88.36 −0.295 Chloroplast; Mitochondrion; Extracellular space LsCIPK5 482 54,396.49 8.96 29.92 77.86 −0.461 Chloroplast; Endoplasmic Reticulum; Plasma membrane LsCIPK6 2,890 328,456.35 7.36 38.07 83.37 −0.412 Plasma membrane; Nucleus; Endoplasmic Reticulum LsCIPK7 437 48,880.63 9.07 35.68 91.24 −0.308 Chloroplast; Golgi apparatus; Plasma membrane LsCIPK8 440 50,107.46 8.92 42.65 79.07 −0.526 Mitochondrion; Plasma membrane; Nucleus LsCIPK9 499 56,623.4 8.93 43.68 88.28 −0.323 Chloroplast; Vacuole; Cytoplasm LsCIPK10 462 52,465.55 9.03 28.57 81.43 −0.443 Cytoplasm; Endoplasmic Reticulum; Chloroplast LsCIPK11 441 50,187.94 9.02 35.63 84.22 −0.323 Cytoplasm; Nucleus; Endoplasmic Reticulum LsCIPK12 460 51,846.01 9.2 44.36 91.78 −0.272 Chloroplast; Plasma membrane; Cytoplasm LsCIPK13 427 47,976.37 8.86 36.01 82.41 −0.371 Plasma membrane; Endoplasmic Reticulum; Cytoplasm LsCIPK14 806 91,426.57 7.9 22.16 99.85 −0.109 Plasma membrane; Cytoplasm; Endoplasmic Reticulum LsCIPK15 878 99,016.35 8.26 32.55 89.25 −0.324 Plasma membrane; Endoplasmic Reticulum; Cytoplasm LsCIPK16 439 49,560.31 7.24 34.87 91.46 −0.294 Cytoplasm; Chloroplast; Endoplasmic Reticulum LsCIPK17 437 49,440.97 8.66 34.67 97.21 −0.25 Cytoplasm; Cytoskeleton; Chloroplast LsCIPK18 871 99,290.81 9.24 43.07 92.55 −0.367 Cytoplasm; Nucleus; Chloroplast LsCIPK19 432 48,527.79 8.85 40.83 90.67 −0.278 Chloroplast; Nucleus; Cytoplasm LsCIPK20 445 49,952.97 7.07 31.66 78.63 −0.356 Chloroplast; Plasma membrane; Nucleus LsCIPK21 451 50,541.88 6.3 35.49 93.08 −0.345 Cytoplasm; Nucleus; Chloroplast LsCIPK22 455 51,728.97 6.55 26.87 92.13 −0.283 Cytoplasm; Chloroplast; Plasma membrane LsCIPK23 459 52,112.4 9.07 48.33 85.14 −0.283 Chloroplast; Cytoplasm; Mitochondrion LsCIPK24 454 51,137.91 9.02 36.47 85.46 −0.369 Chloroplast; Mitochondrion; Golgi apparatus LsCIPK25 1,335 151,026.24 8.61 29.65 91.98 −0.245 Plasma membrane; Endoplasmic Reticulum; Vacuole LsCIPK26 428 48,055.44 9.06 32.74 82.69 −0.34 Plasma membrane; Cytoplasm; Endoplasmic Reticulum LsCIPK27 829 94,260.65 8.64 34.86 91.71 −0.243 Plasma membrane; Endoplasmic Reticulum LsCIPK28 428 47,731.15 9.23 32.27 84.28 −0.31 Plasma membrane; Endoplasmic Reticulum; Cytoplasm LsCIPK29 466 52,966.58 6.48 42.05 87.88 −0.283 Chloroplast; Extracellular space; Cytoplasm LsCIPK30 429 49,029.58 9.03 43.56 92.45 −0.316 Cytoskeleton; Cytoplasm; Cytoplasm & Nucleus LsCIPK31 458 52,243.51 8.99 42.3 88.54 −0.441 Cytoplasm; Cytoskeleton; Chloroplast LsCIPK32 456 5,1765.2 8.63 35.59 86.1 −0.269 Cytoplasm; Cytoskeleton; Golgi apparatus Table 2.
Physicochemical properties of the lettuce CIPK gene family.
Figures
(14)
Tables
(2)