-
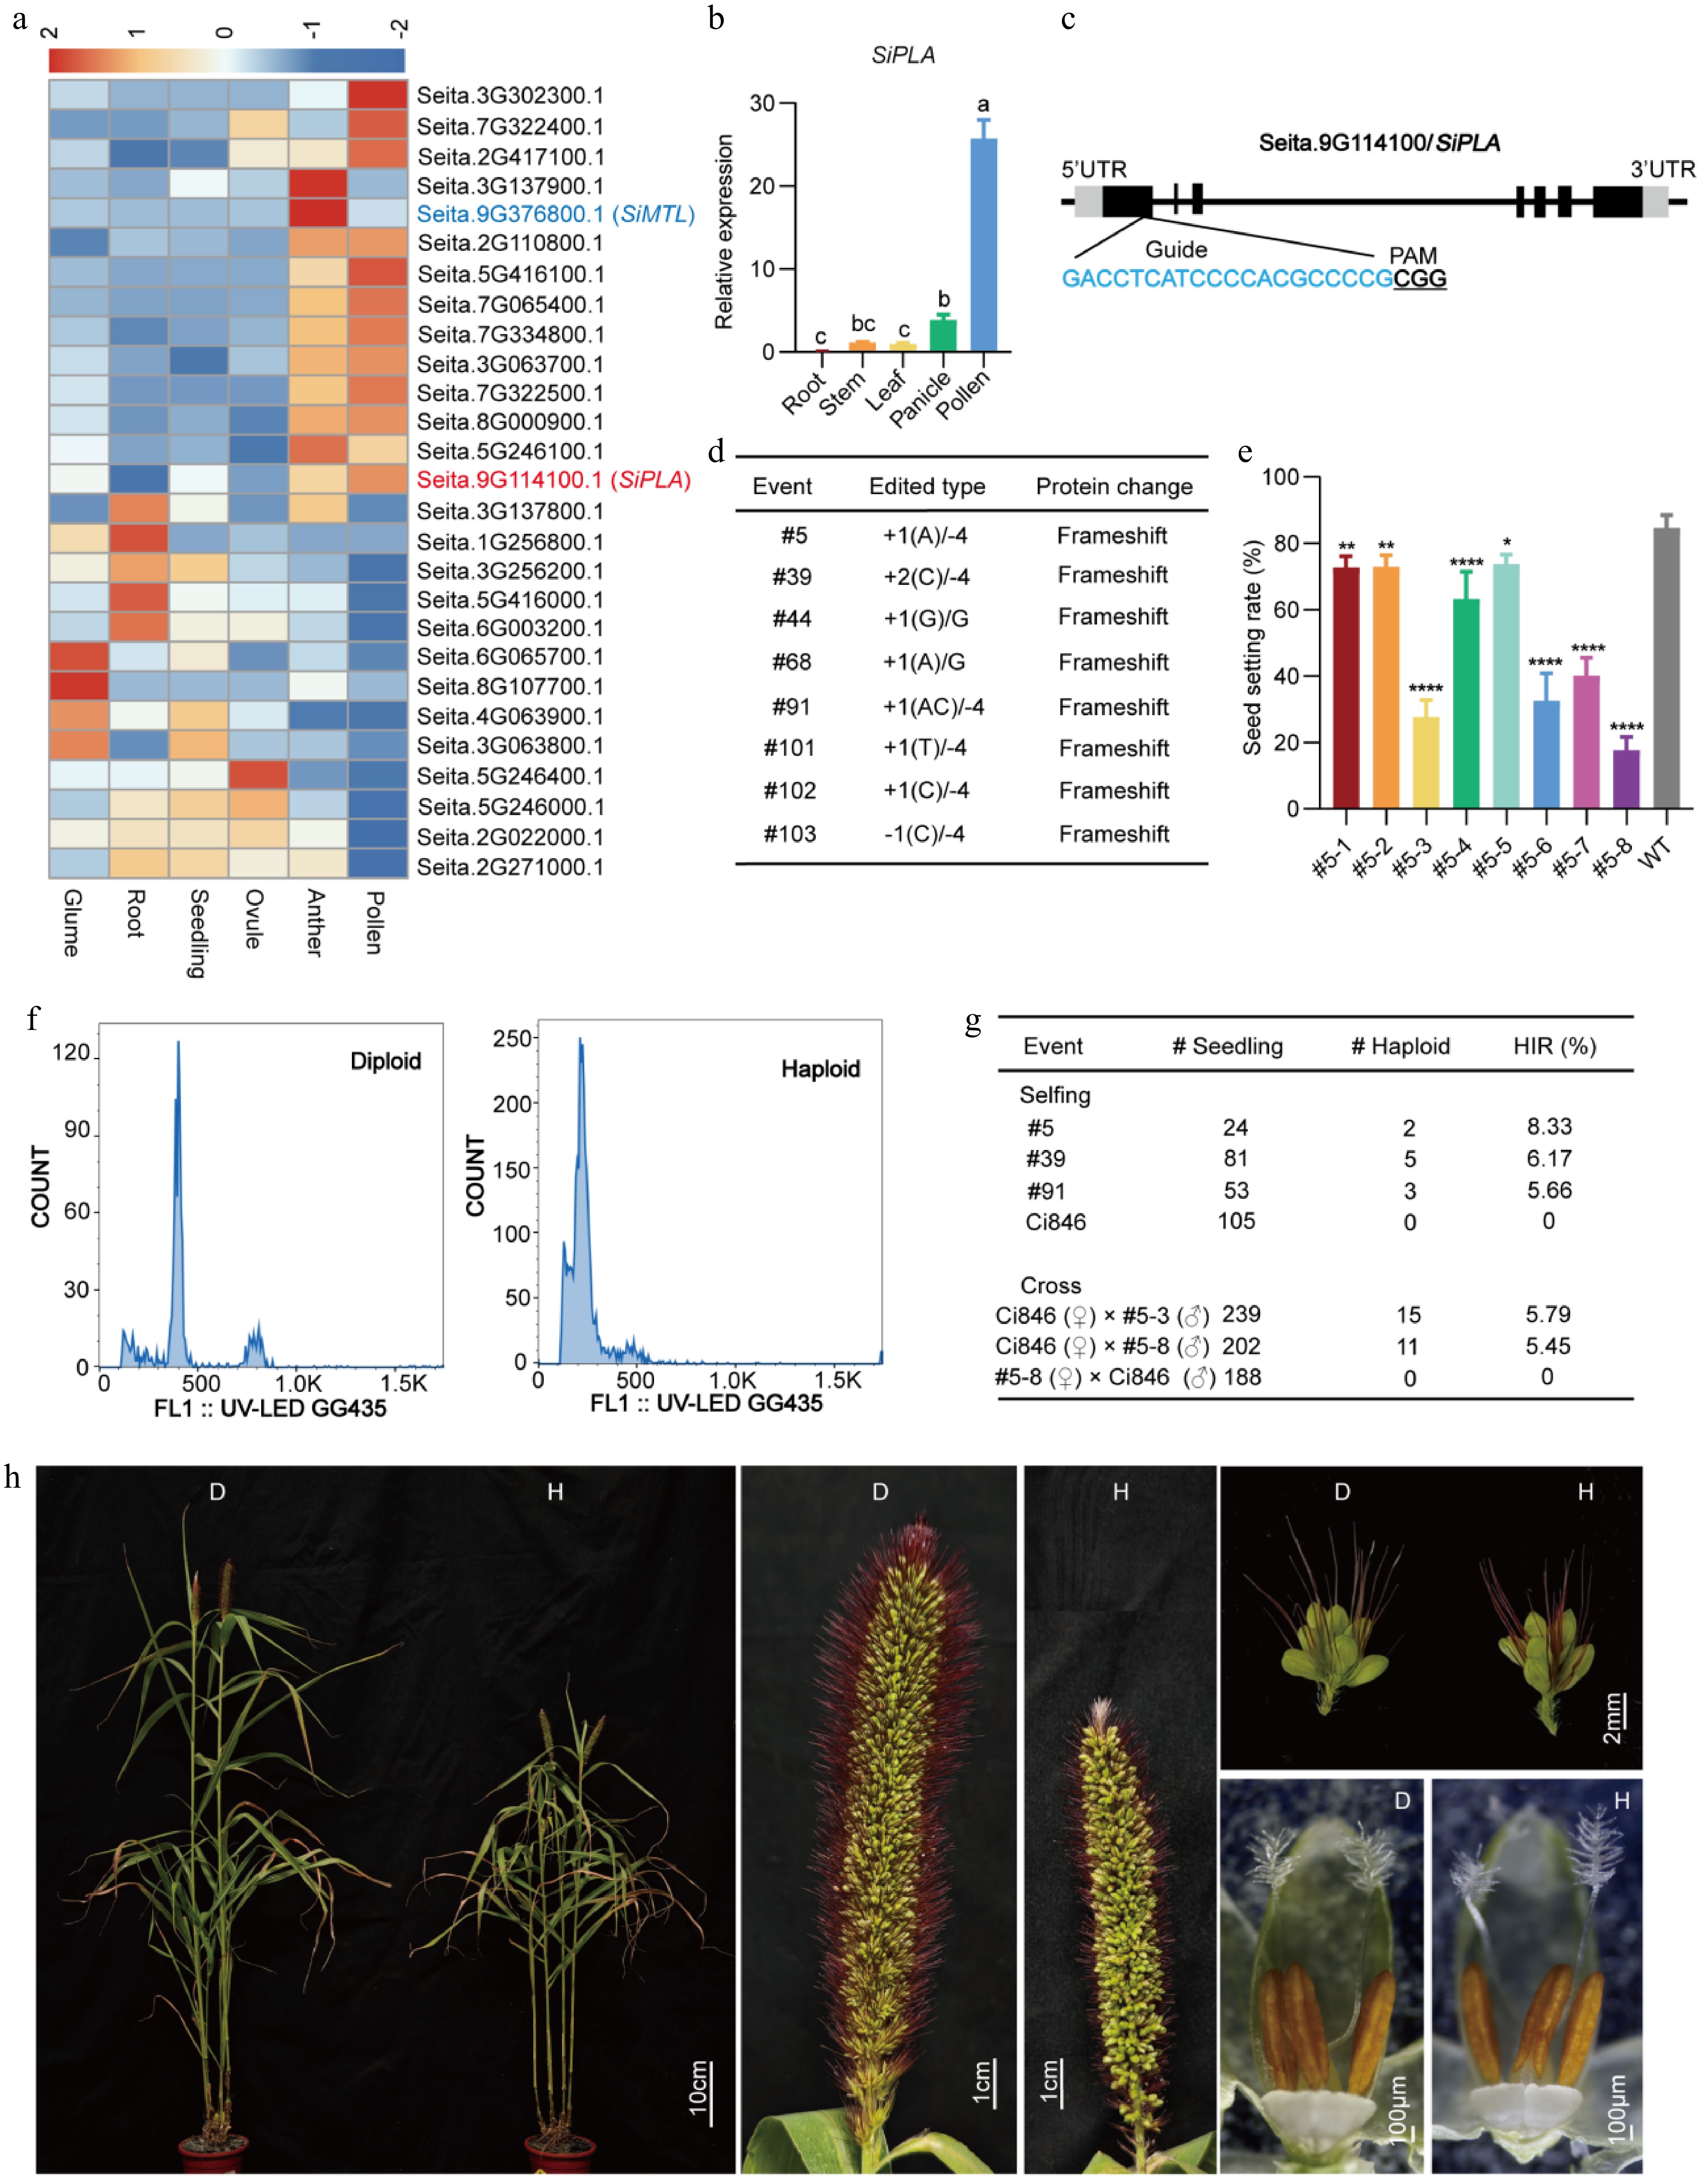
Figure 1.
Haploid induction in foxtail millet. (a) Heatmap of PLA expression identified from our transcriptome data of foxtail millet. Colored boxes represent the log2 fold change. The numbers represent the fragments per kilobase of transcript per million mapped reads (FPKM) value in relative expression levels. Red represents upregulated expression and blue represents downregulated expression. (b) RT-qPCR showed that the relative expression of SiPLA in pollen was high. Significant differences were analyzed using ordinary one-way analysis of variance (ANOVA) by Tukey's method; lowercase letters indicate statistical significance at p < 0.05. (c) Gene structure of SiPLA and CRISPR/Cas9-targeted sites. PAM is underlined and the guide RNA sequence is highlighted in blue. (d) Editing sites and nucleic acid sequence changes in T0 plants. (e) The seed-setting rate of self-pollinated T1 plants derived from Mutant #5. Each error bar represents the mean of three biological replicates with their standard deviations (±SD) (n = 10). Significant differences were analyzed by one-way ANOVA followed by Tukey's multiple comparison test (* p < 0.05; ** p < 0.01; **** p < 0.0001). (f) Verification of haploid plants by flow cytometry analysis. The x-axis indicates the signal peak for the nuclei and the y-axis indicates the number of nuclei. (g) Haploid induction efficiency (HIR) determined by self-pollination or crossing. (h) Phenotype of haploid and diploid plants. "D" represents the diploid control, and "H" represents the haploid.
Figures
(1)
Tables
(0)