-
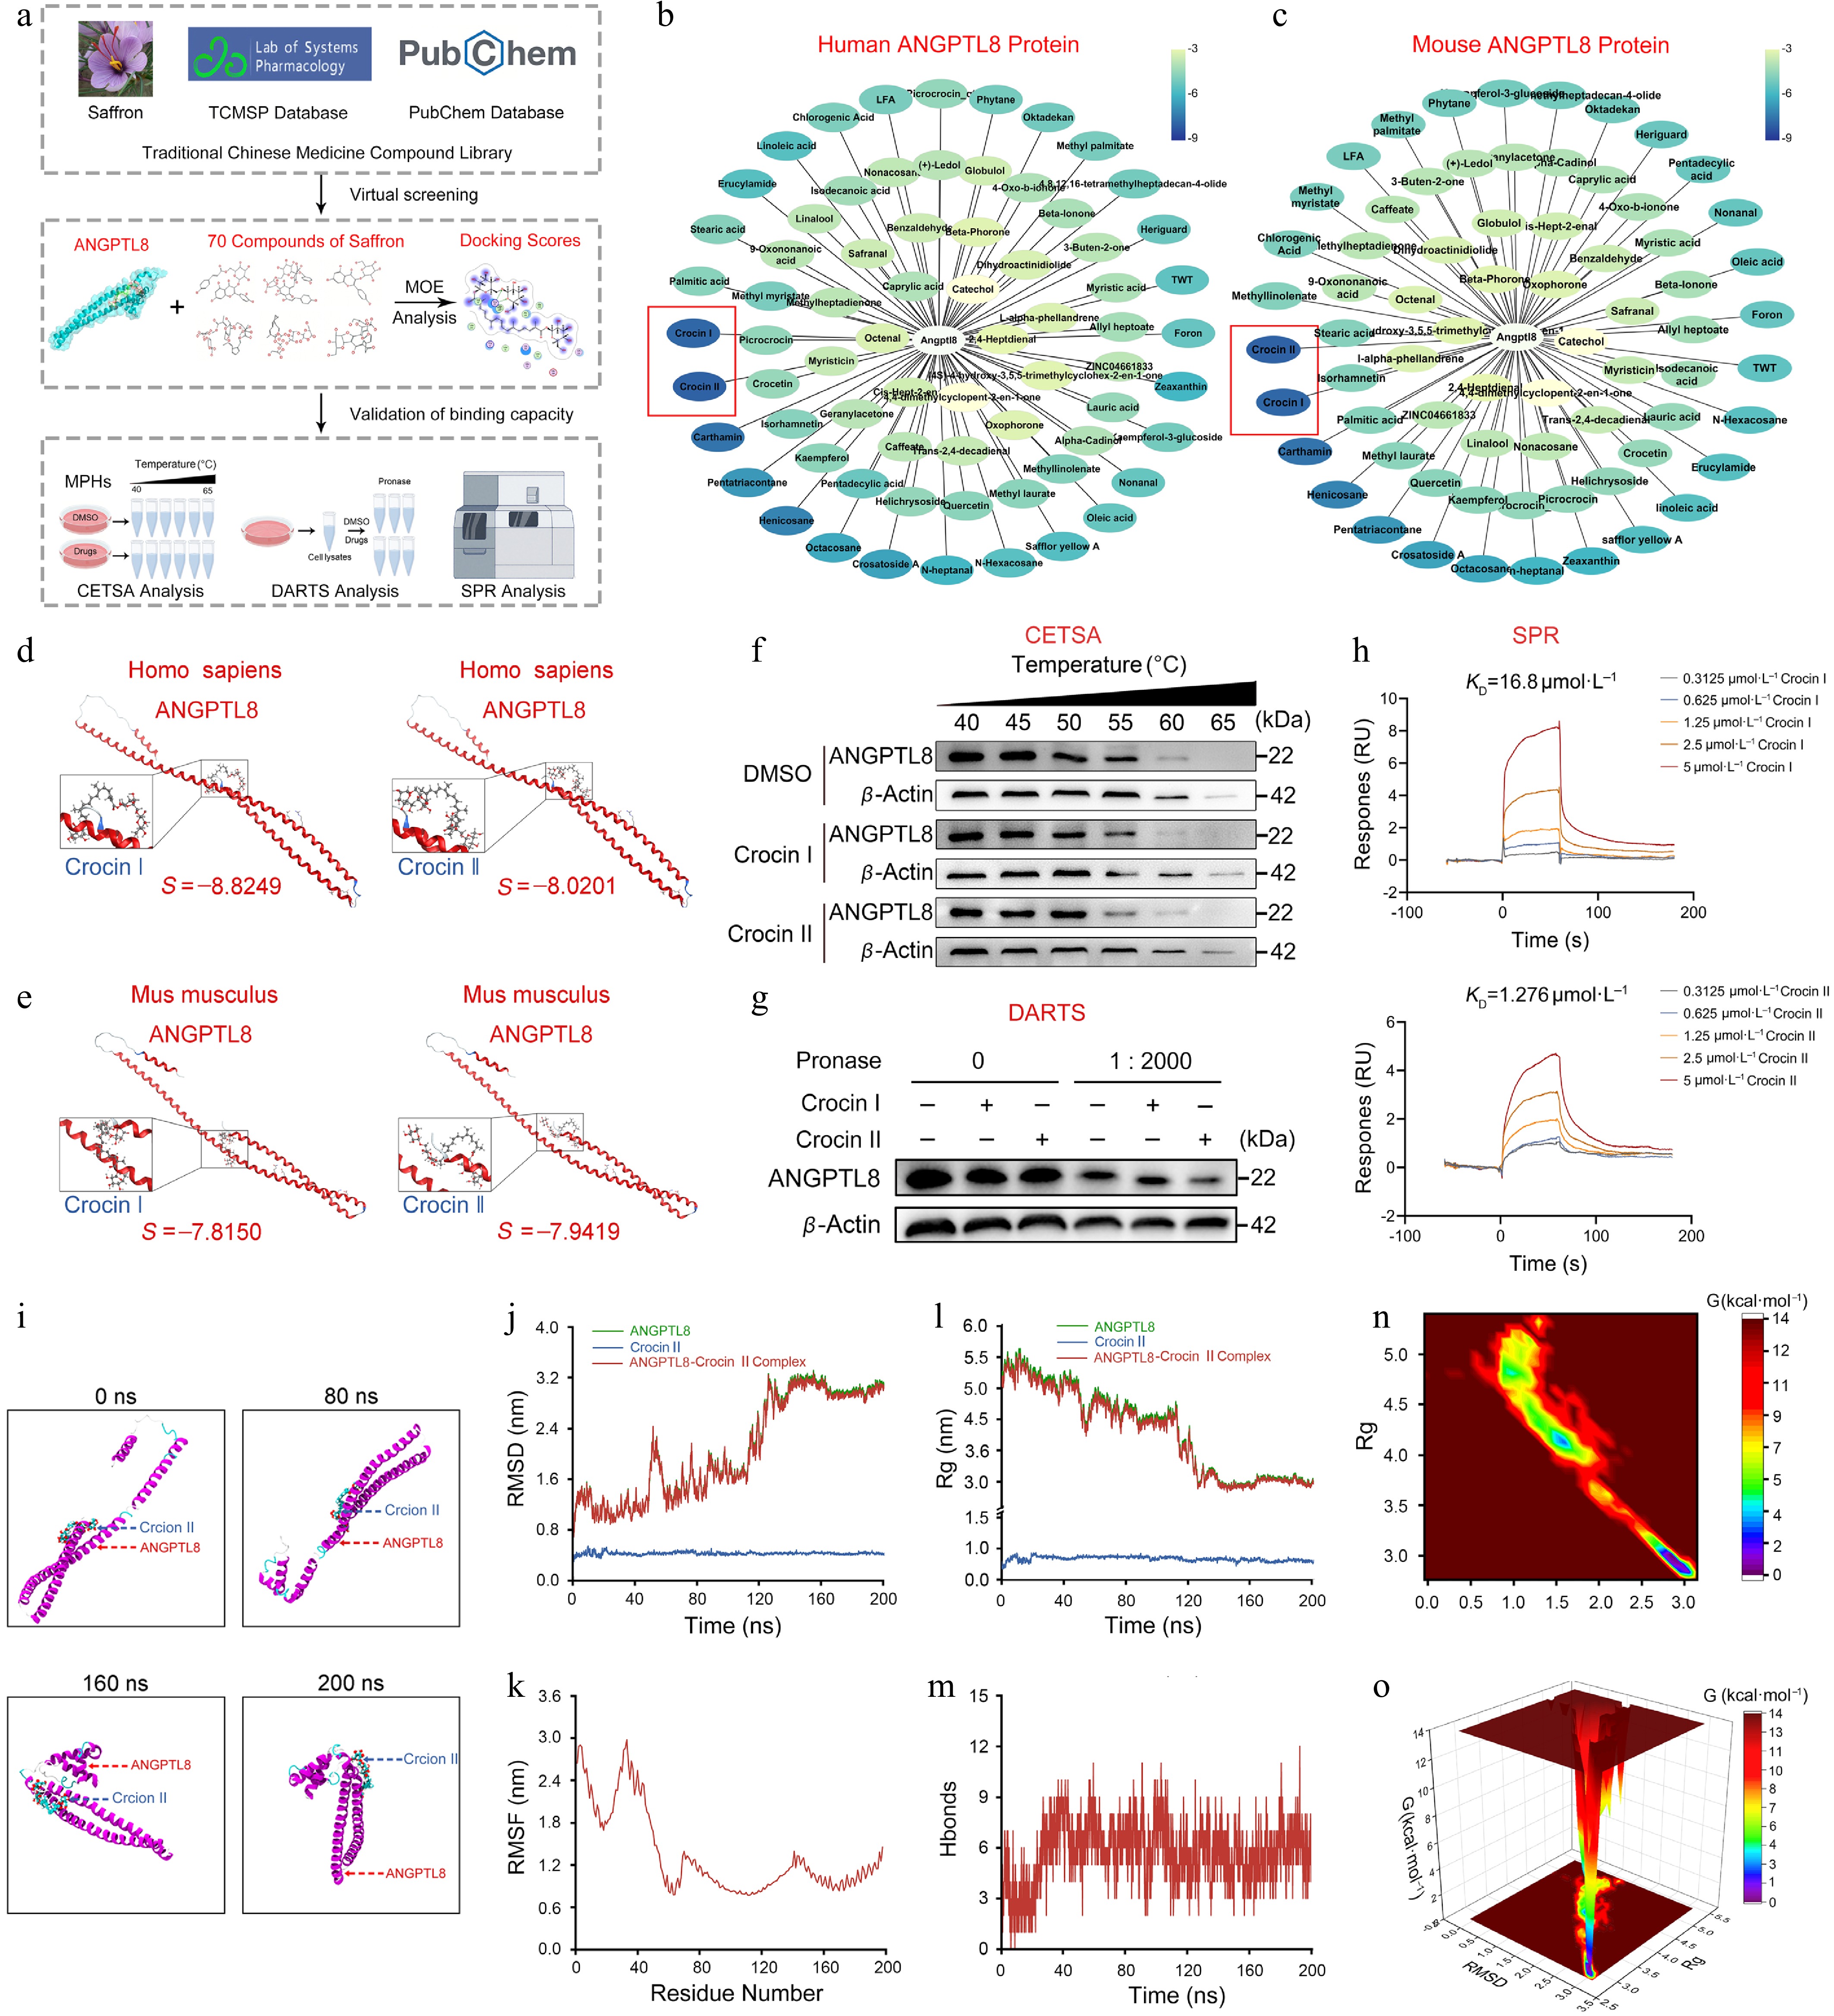
Figure 1.
Compound screenings identify Crocin II as a potential drug targeting ANGPTL8. (a) Workflow for screening small-molecule compounds targeting ANGPTL8. (b) MOE analysis of binding potentials of natural small-molecule compounds on human ANGPTL8. (c) MOE analysis of binding potentials of natural small-molecule compounds on mouse ANGPTL8. (d) The binding pattern of human ANGPTL8 with Crocin I and Crocin II. (e) The binding pattern of mouse ANGPTL8 with Crocin I and Crocin II. (f) Mouse PHs were exposed to DMSO, 100 μmol·L−1 Crocin I or Crocin II for 3 h, then subjected to CETSA analysis. Western blot analysis for the protein levels of ANGPTL8. (g) Mouse PHs lysates were incubated with DMSO, 100 μmol·L−1 Crocin I or Crocin II for 2 h at 25 °C, followed by digestion with pronase for 30 min at 37 °C. Western blot analysis for the protein levels of ANGPTL8. (h) The direct combination of ANGPTL8 with Crocin I or Crocin II was evaluated using SPR. (i) Representative snapshots of molecular dynamics processes. (j) RMSD curves. (k) RMSF curve. (l) Rg curves. (m) Fluctuation curve of the number of hydrogen bonds. (n) The two-dimensional mapping of the free energy landscape. (o) The three-dimensional mapping of the free energy landscape. Data are presented as the mean ± SEM, n = 3.
-
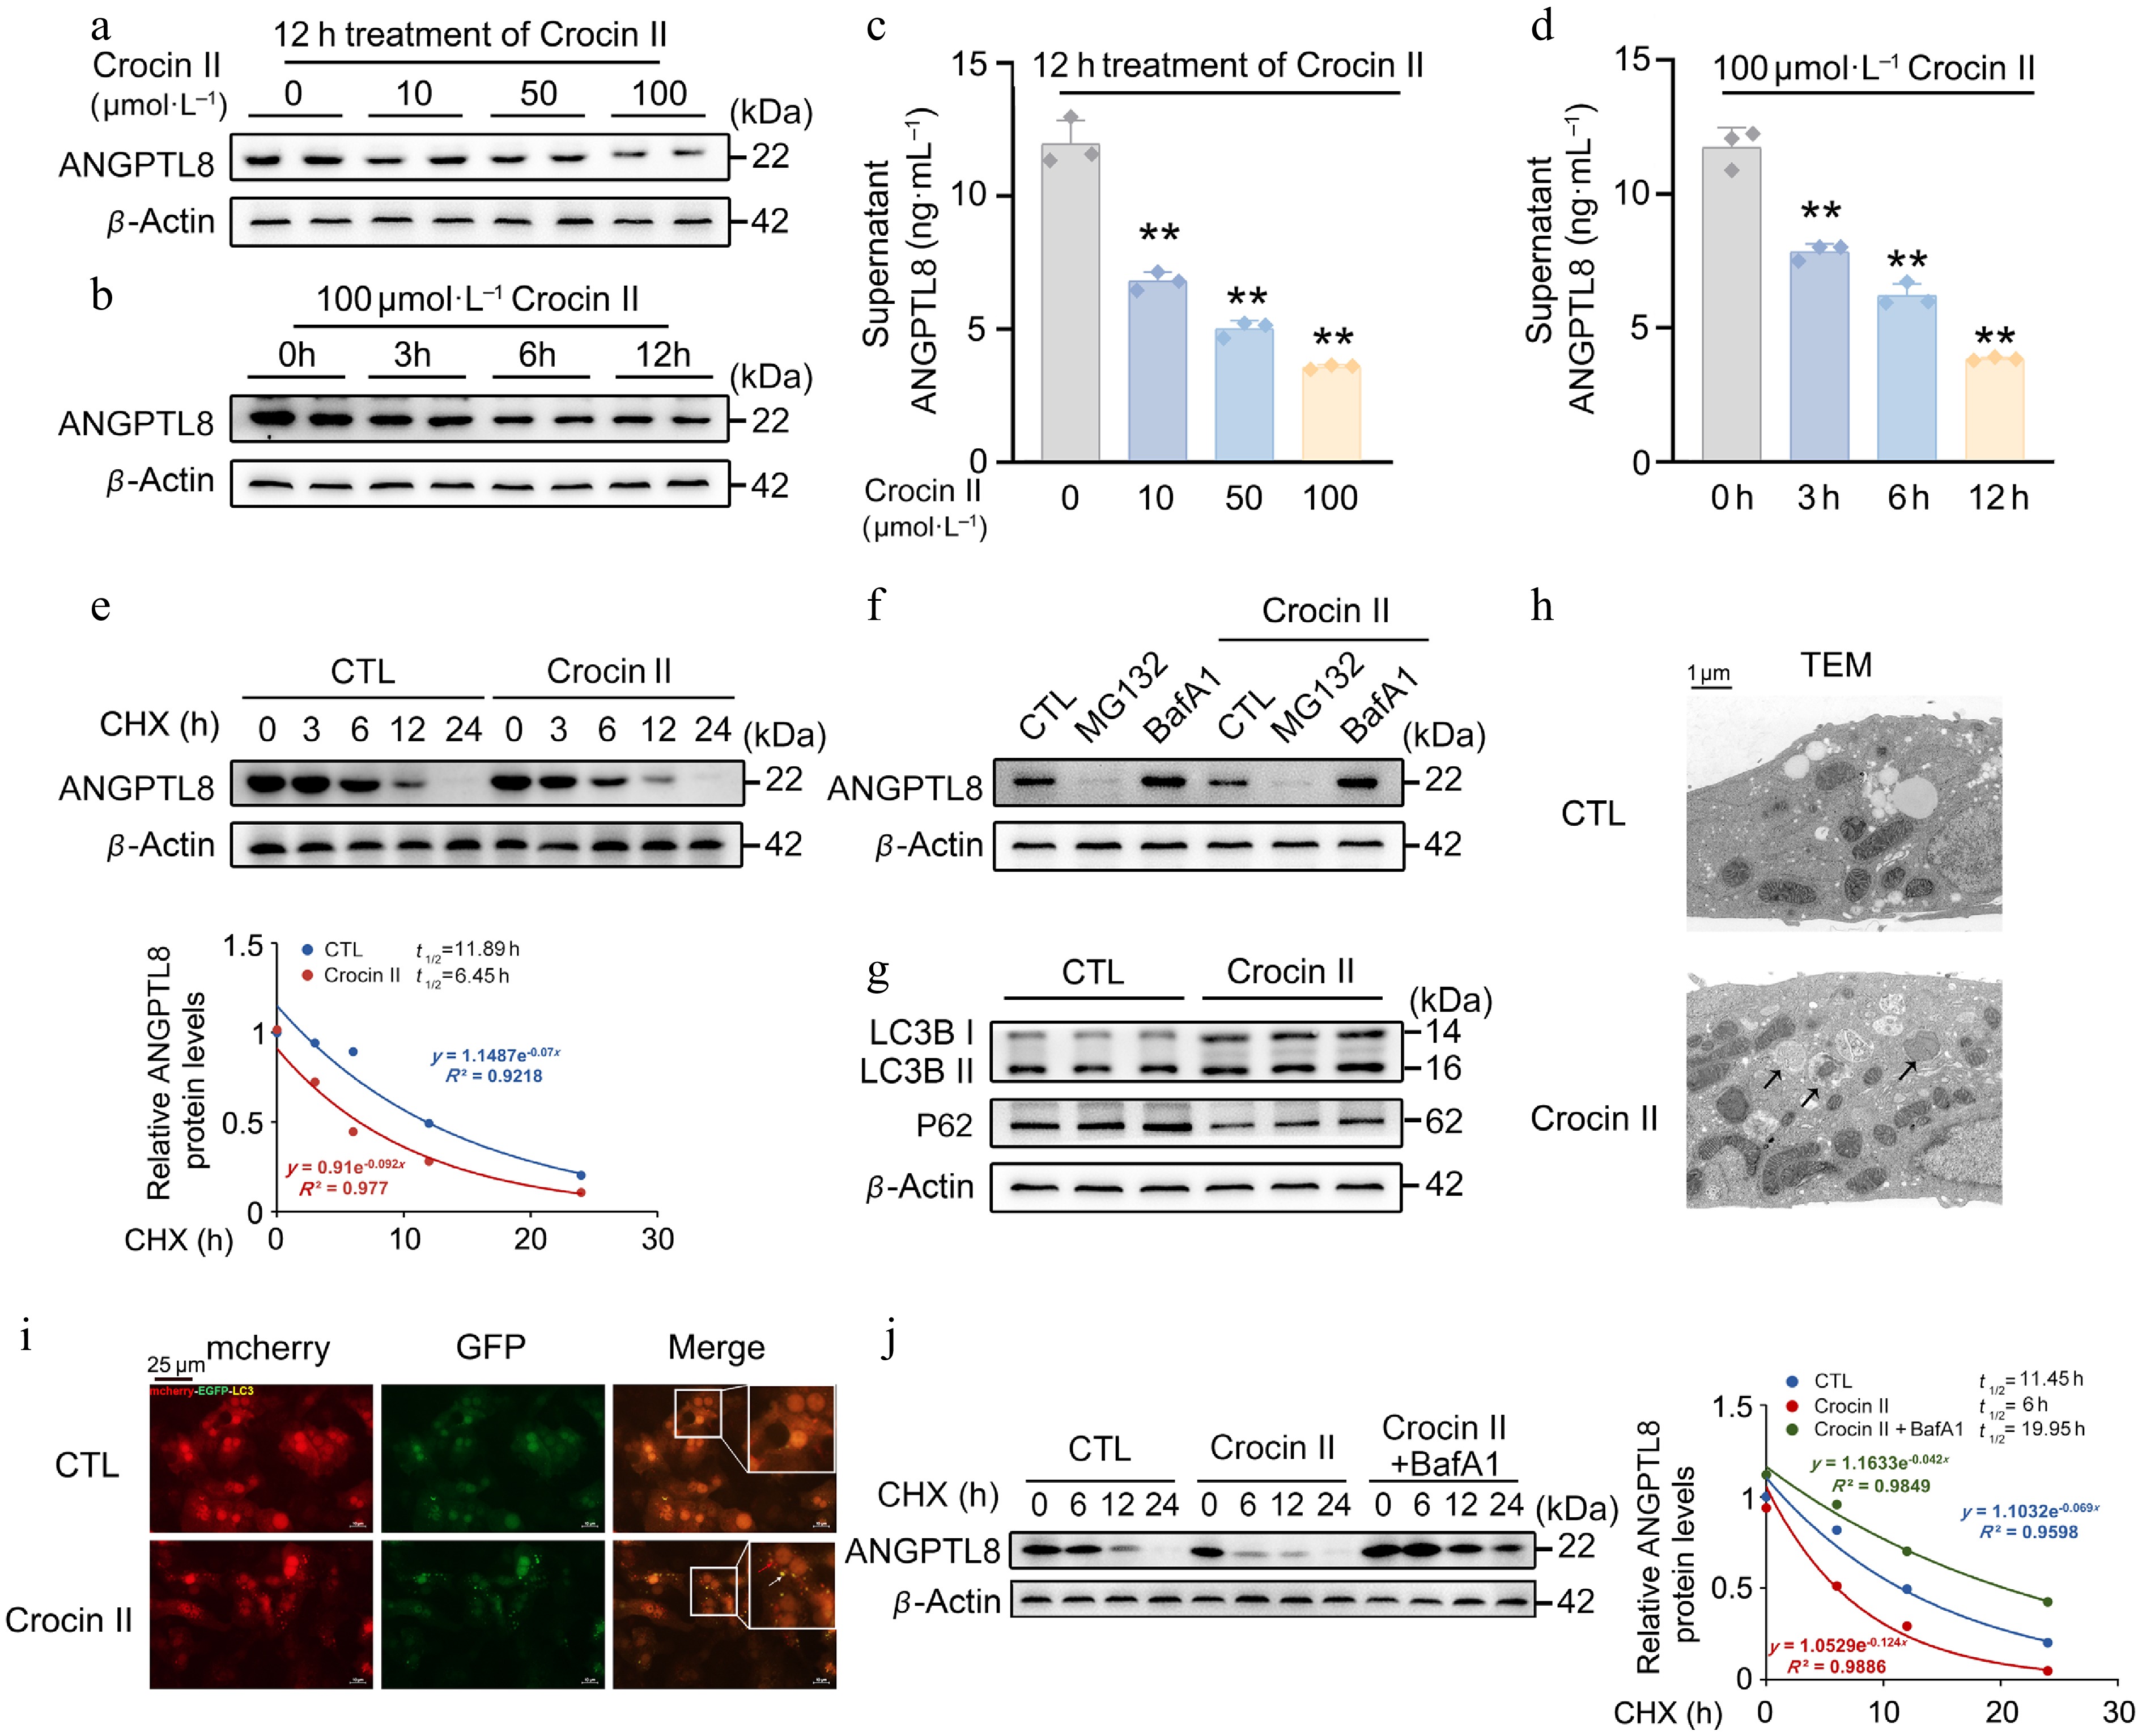
Figure 2.
Crocin II promotes the degradation of ANGPTL8 protein through the autophagosome-lysosome pathway. (a) The protein levels of ANGPTL8 in mouse PHs treated with different concentrations of Crocin II for 12 h. (b) The protein levels of ANGPTL8 in mouse PHs treated with 100 μmol·L−1 Crocin II for different time points. (c) Supernatant ANGPTL8 levels in mouse PHs treated with indicated different concentrations of Crocin II for 12 h. (d) Supernatant ANGPTL8 levels in mouse PHs treated with 100 μmol·L−1 Crocin II for different durations. (e) CHX chase assay to assess Crocin II-induced changes in ANGPTL8 protein stability in mouse PHs. CTL, control. (f) Western blot analysis of ANGPTL8 protein degradation pathways. (g) The protein levels of LC3B-II/I and P62 in mouse PHs treated with 100 μmol·L−1 Crocin II. (h) TEM analysis (arrows indicate autophagosomes). (i) mCherry-eGFP-LC3 fluorescence images (white arrows indicate autophagosomes, and the red arrows indicate autolysosomes), scale bar = 25 μm. (j) The protein levels of ANGPTL8 in mouse PHs treated with Crocin II or combined with BafA1. ** P < 0.01 vs 0 μmol·L−1 Crocin II group, one-way ANOVA followed by Bonferroni's post hoc test. Data are presented as the mean ± SEM, n = 3.
-
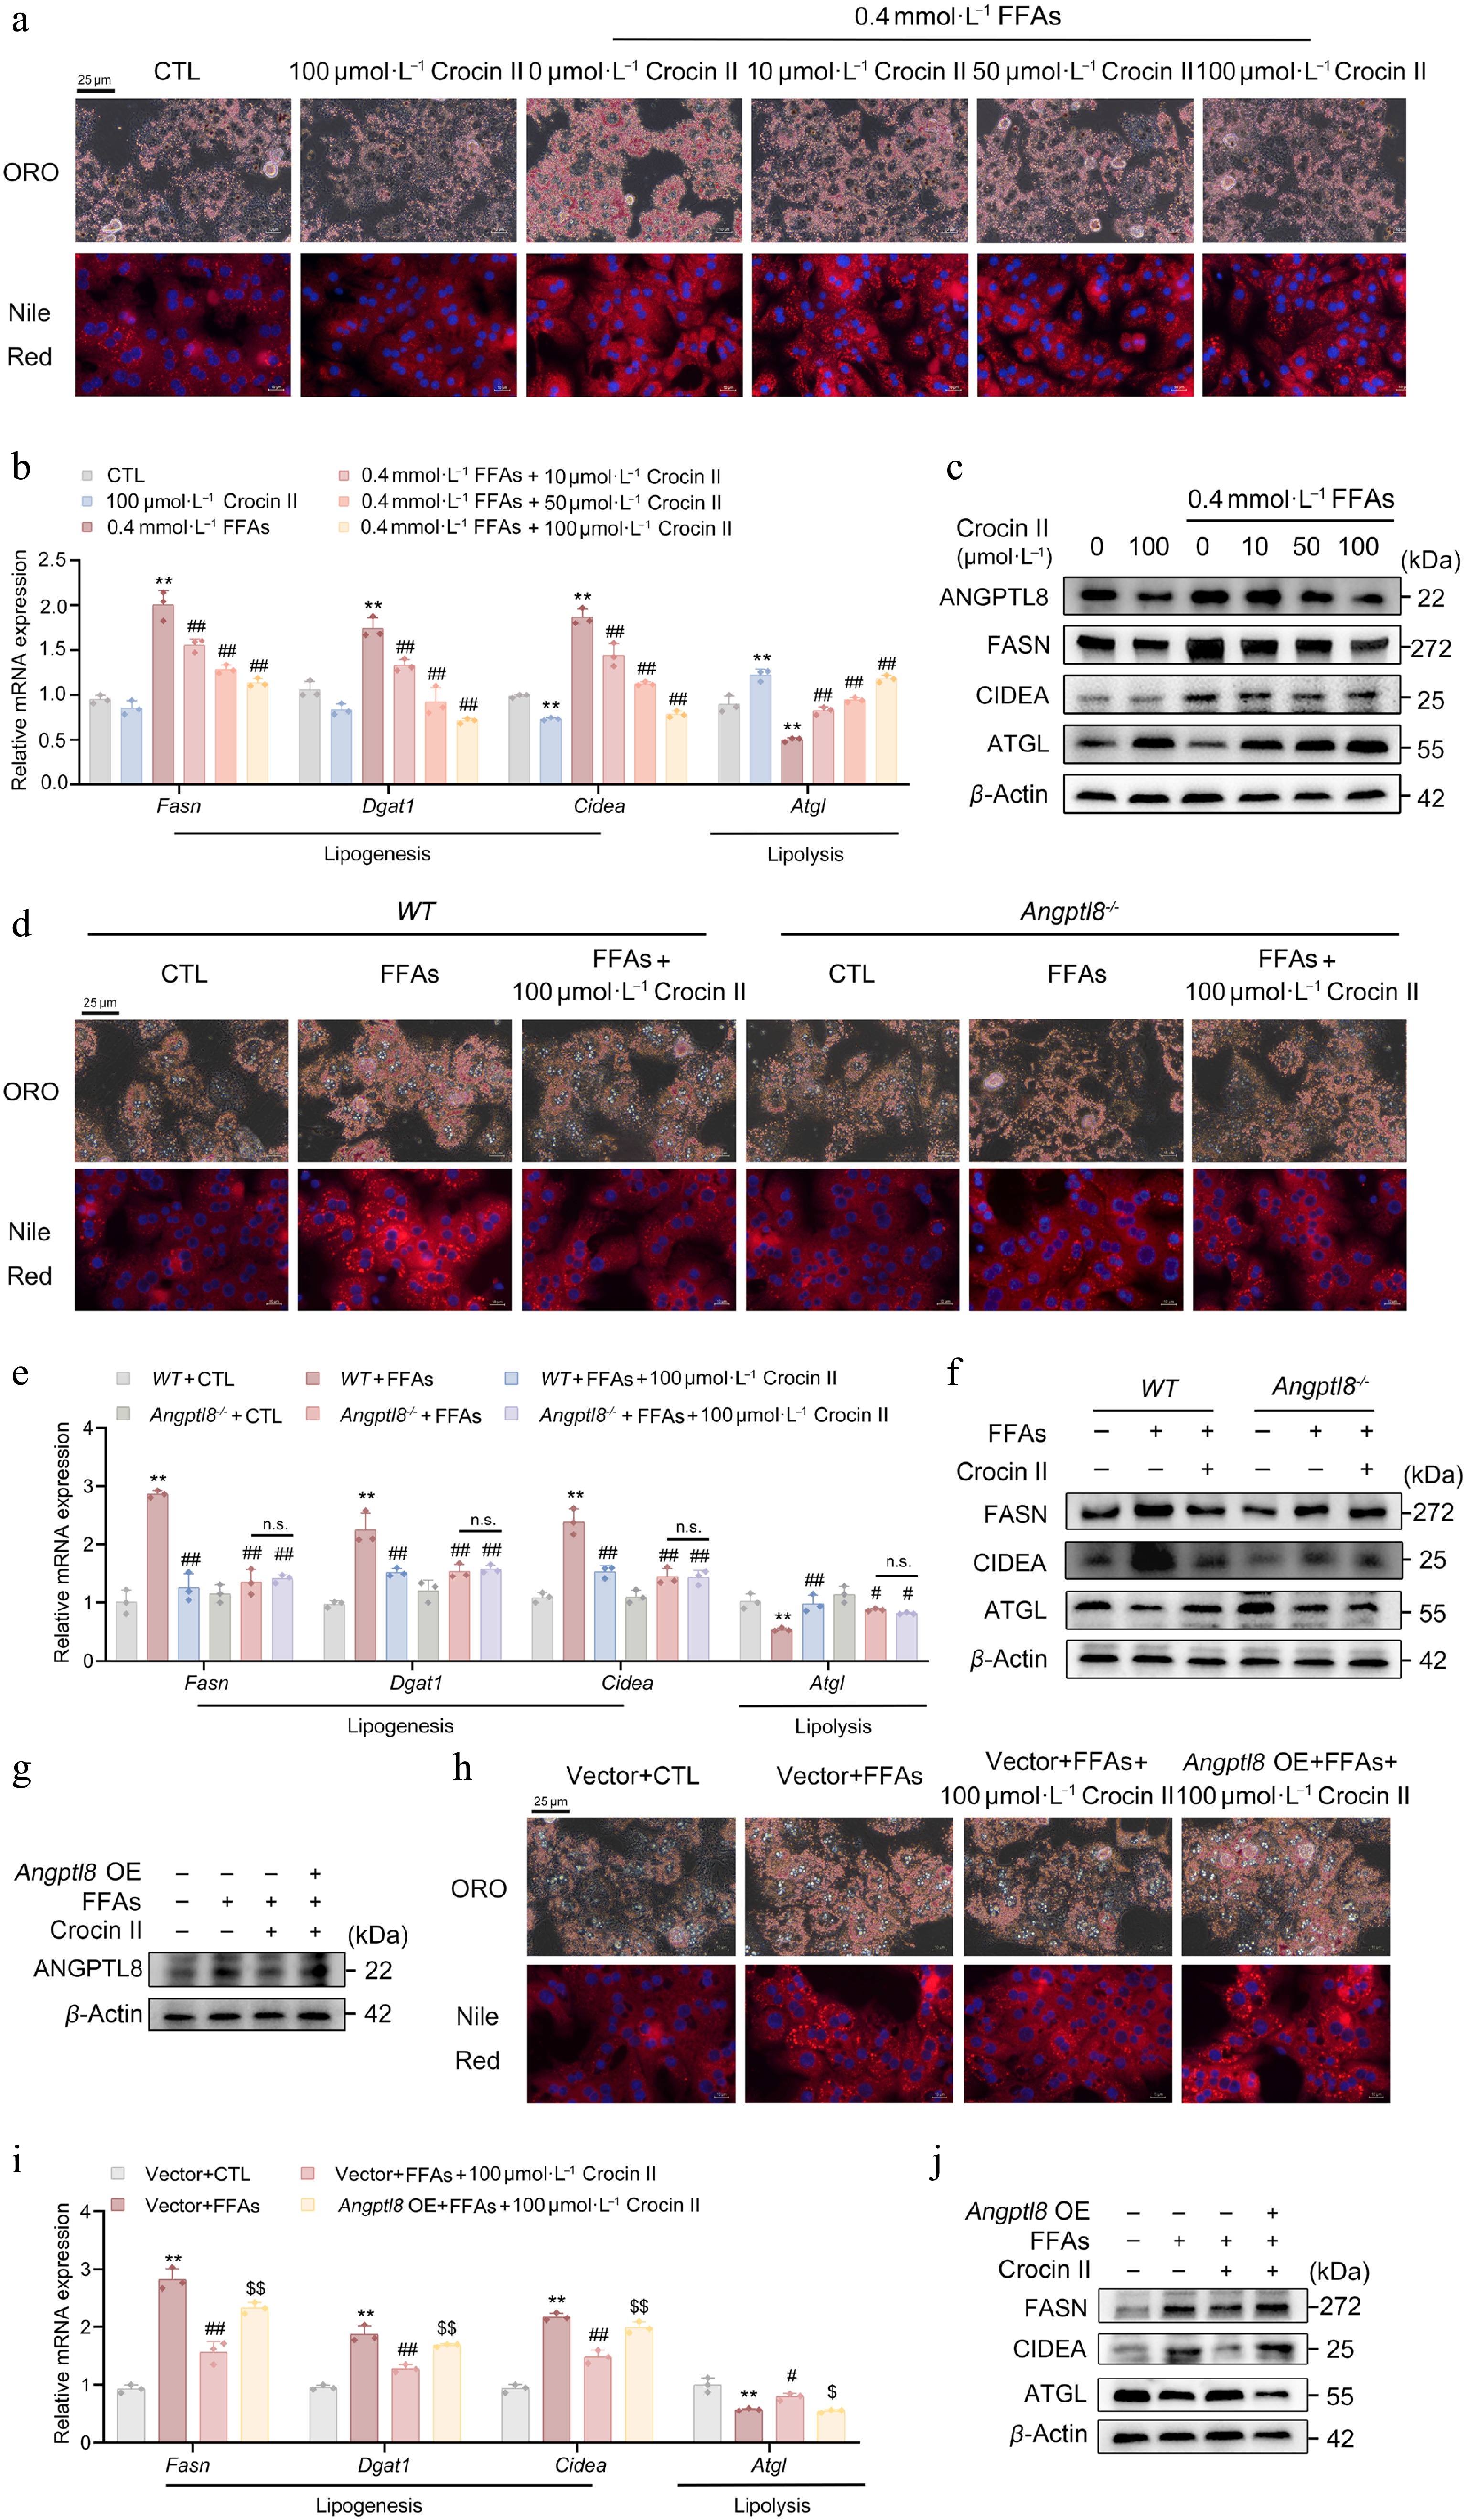
Figure 3.
ANGPTL8 mediates the lipid-lowering effects of Crocin II in mouse PHs. (a)–(c) Mouse PHs were pre-incubated with 100 μmol·L−1 Crocin II for 2 h, and then treated with 100 μmol·L−1 Crocin II and 0.4 mmol·L−1 FFAs for 24 h. (a) ORO staining and Nile Red staining. Scale bar = 25 μm. (b) The relative mRNA expression of Fasn, Dgat1, Cidea and Atgl. (c) The protein levels of ANGPTL8, FASN, CIDEA and ATGL. ** P < 0.01 vs CTL group, # P < 0.05, ## P < 0.01 vs 0.4 mmol·L−1 FFAs group, one-way ANOVA followed by Bonferroni's post hoc test. (d)–(f) Mouse PHs isolated from WT and Angptl8−/− mice were pre-incubated with 100 μmol·L−1 Crocin II for 2 h, and then treated with 100 μmol·L−1 Crocin II and 0.4 mM FFAs for 24 h. (d) ORO staining and Nile Red staining. Scale bar = 25 μm. (e) The relative mRNA expression of Fasn, Dgat1, Cidea and Atgl. (f) The protein levels of FASN, CIDEA and ATGL. n.s., no significance, ** P < 0.01 vs WT + CTL group, # P < 0.05 and ## P < 0.01 vs WT + FFAs group, one-way ANOVA followed by Bonferroni's post hoc test. (g)–(j) Mouse PHs were transfected with either Angptl8-overexpressing plasmid or empty vector (pcDNA3.0). 24 h later, cells were pre-incubated with 100 μmol·L−1 Crocin II for 2 h, and then treated with 100 μmol·L−1 Crocin II and 0.4 mmol·L−1 FFAs for 24 h. (g) The protein levels of ANGPTL8. (h) ORO staining and Nile Red staining. Scale bar = 25 μm. (i) The relative mRNA expression of Fasn, Dgat1, Cidea and Atgl. (j) The protein levels of FASN, CIDEA and ATGL. A8oe, Angptl8 overexpression. * P < 0.05 and ** P < 0.01 vs vector + CTL group, # P < 0.05 and ## P < 0.01 vs vector + FFAs group, or + FFAs group,
$^{\$} $ $^{{\$}{\$}} $ -
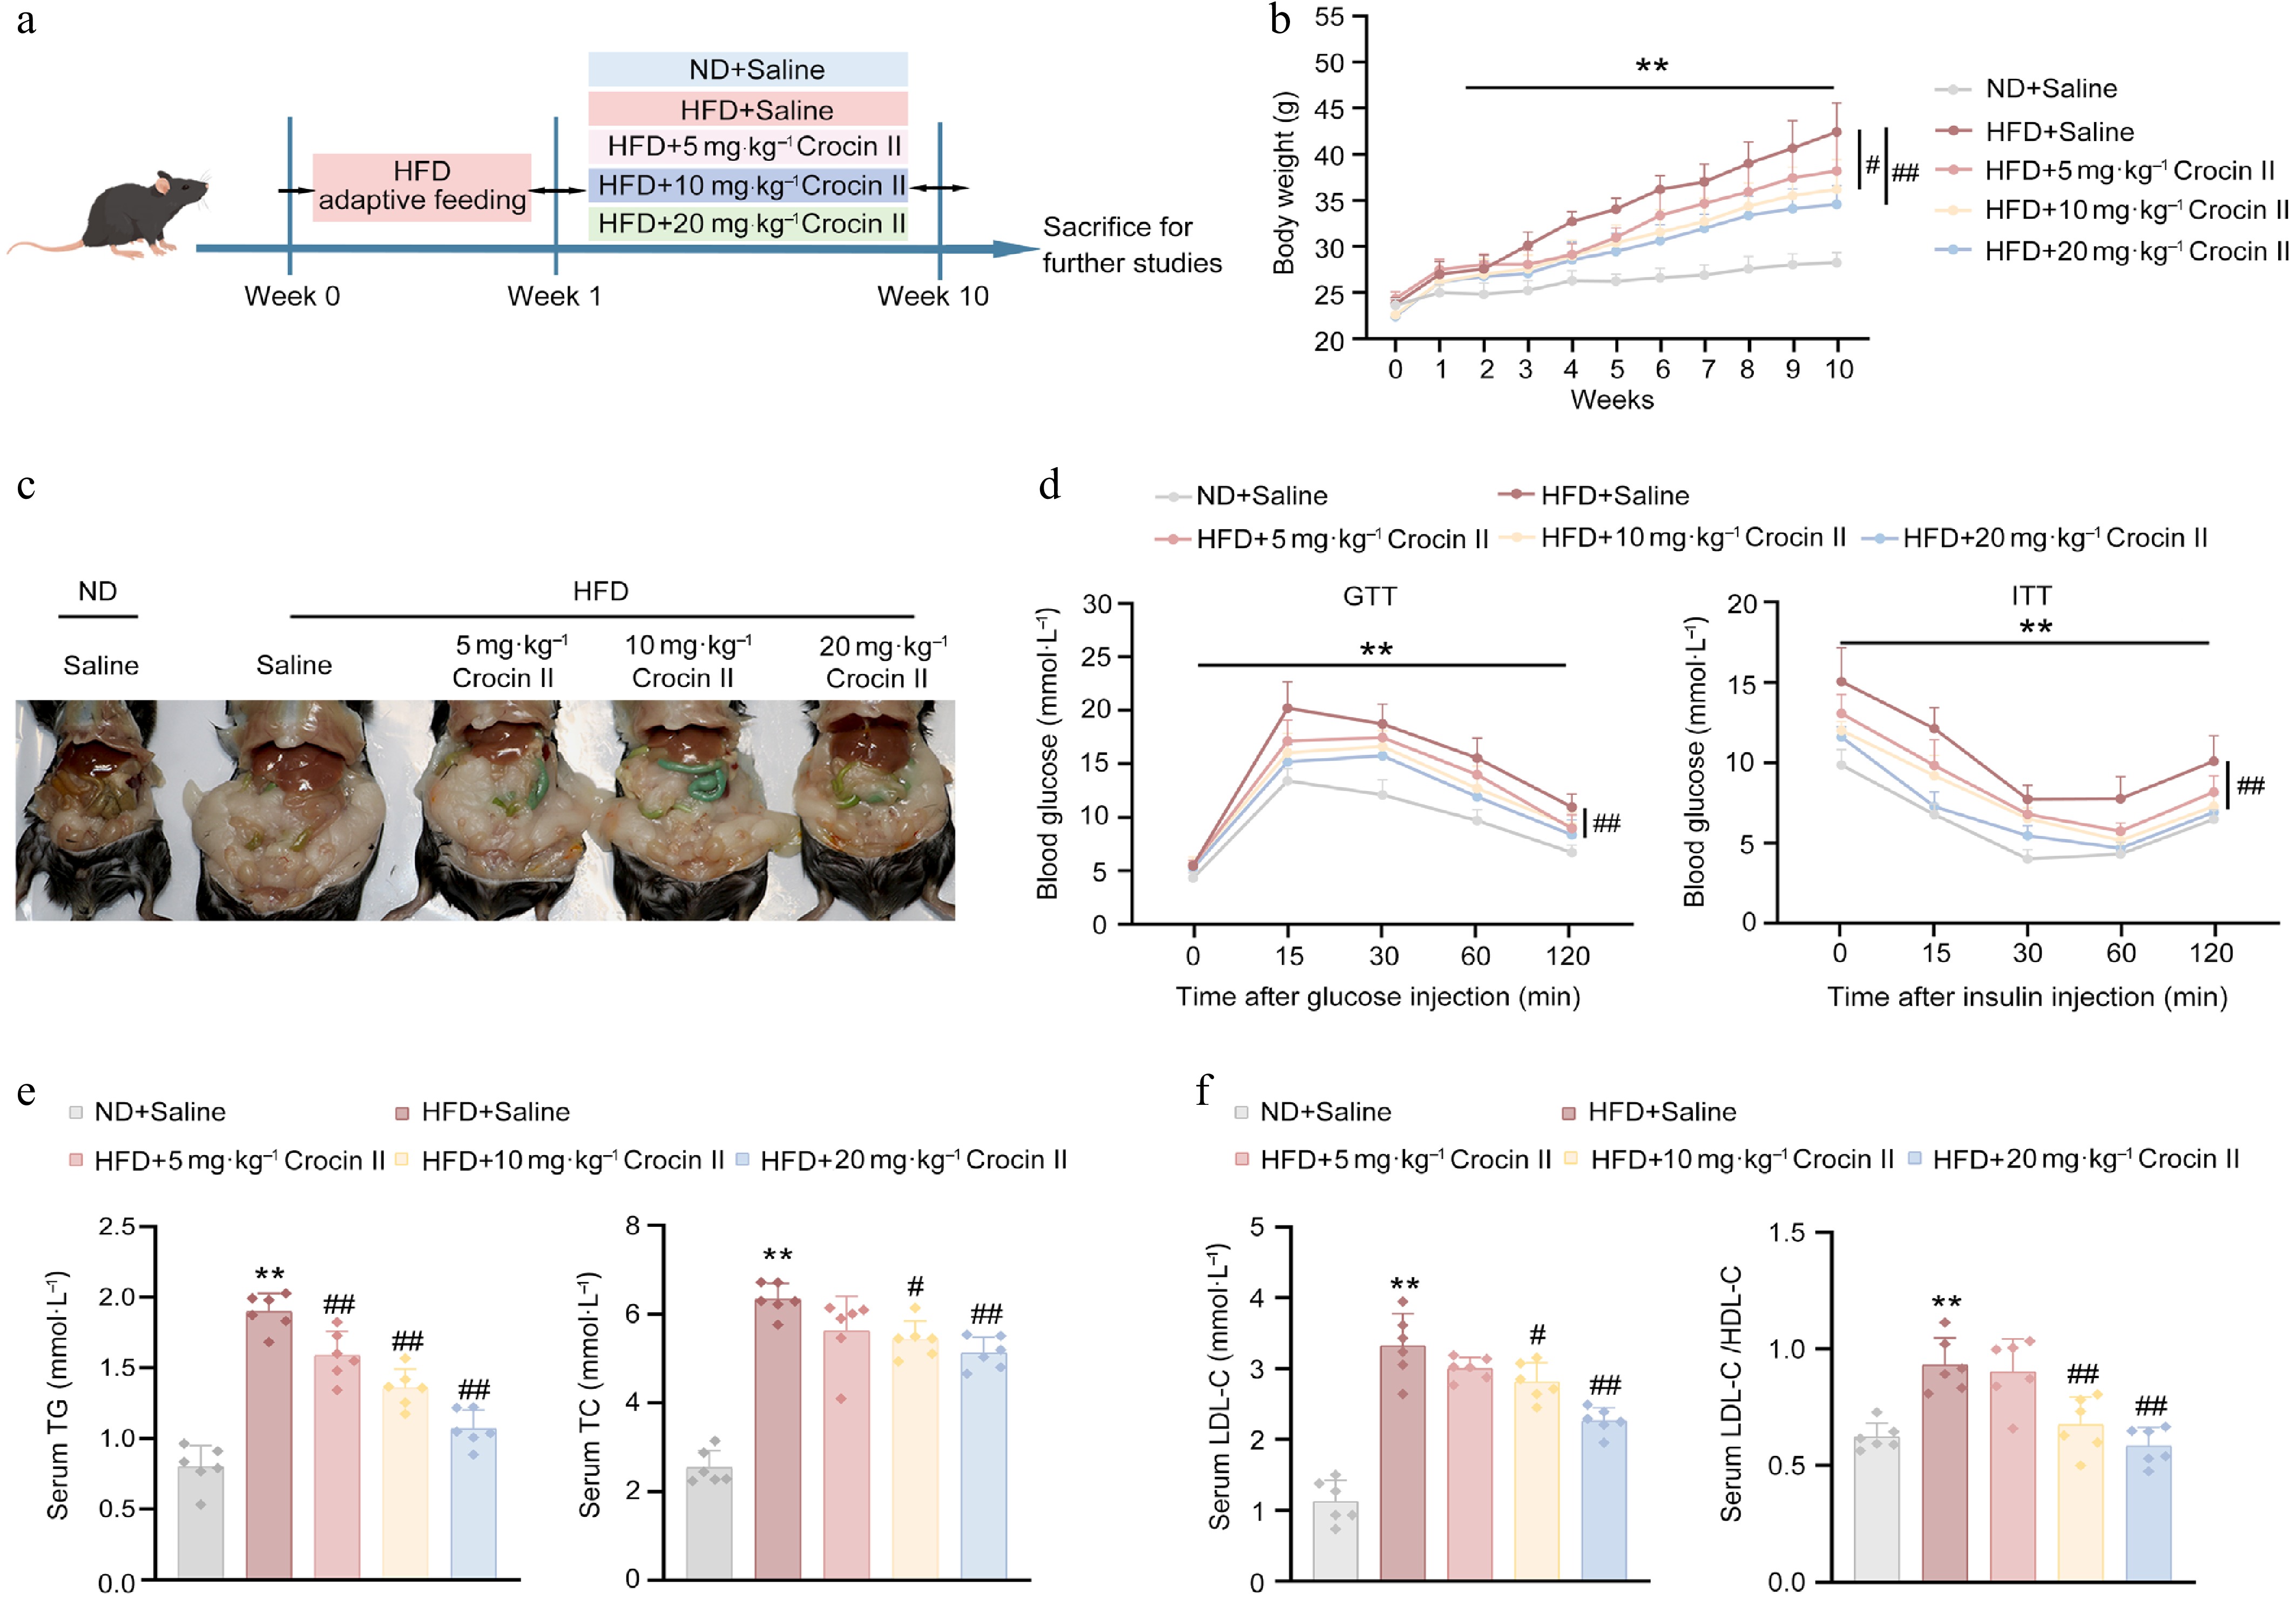
Figure 4.
Crocin II improves HFD-induced insulin resistance and hyperlipidemia in mice. Mice were fed a ND or HFD for 10 weeks to induce MASLD, with or without i.p. administration of Crocin II (5, 10, and 20 mg·kg−1 body weight) during the 10 weeks. (a) Schematic representation of the experimental animal procedure. (b) Body weight. (c) Morphological photos. (d) GTT and ITT analyses. (e) Serum TG and TC levels. (f) Serum LDL-C levels and the LDL-C/HDL-C ratio. ** P < 0.01 vs ND + saline group, # P < 0.05 and ## P < 0.01 vs HFD + saline group, one-way ANOVA followed by Bonferroni's post hoc test. Data are presented as the mean ± SEM, n = 6.
-
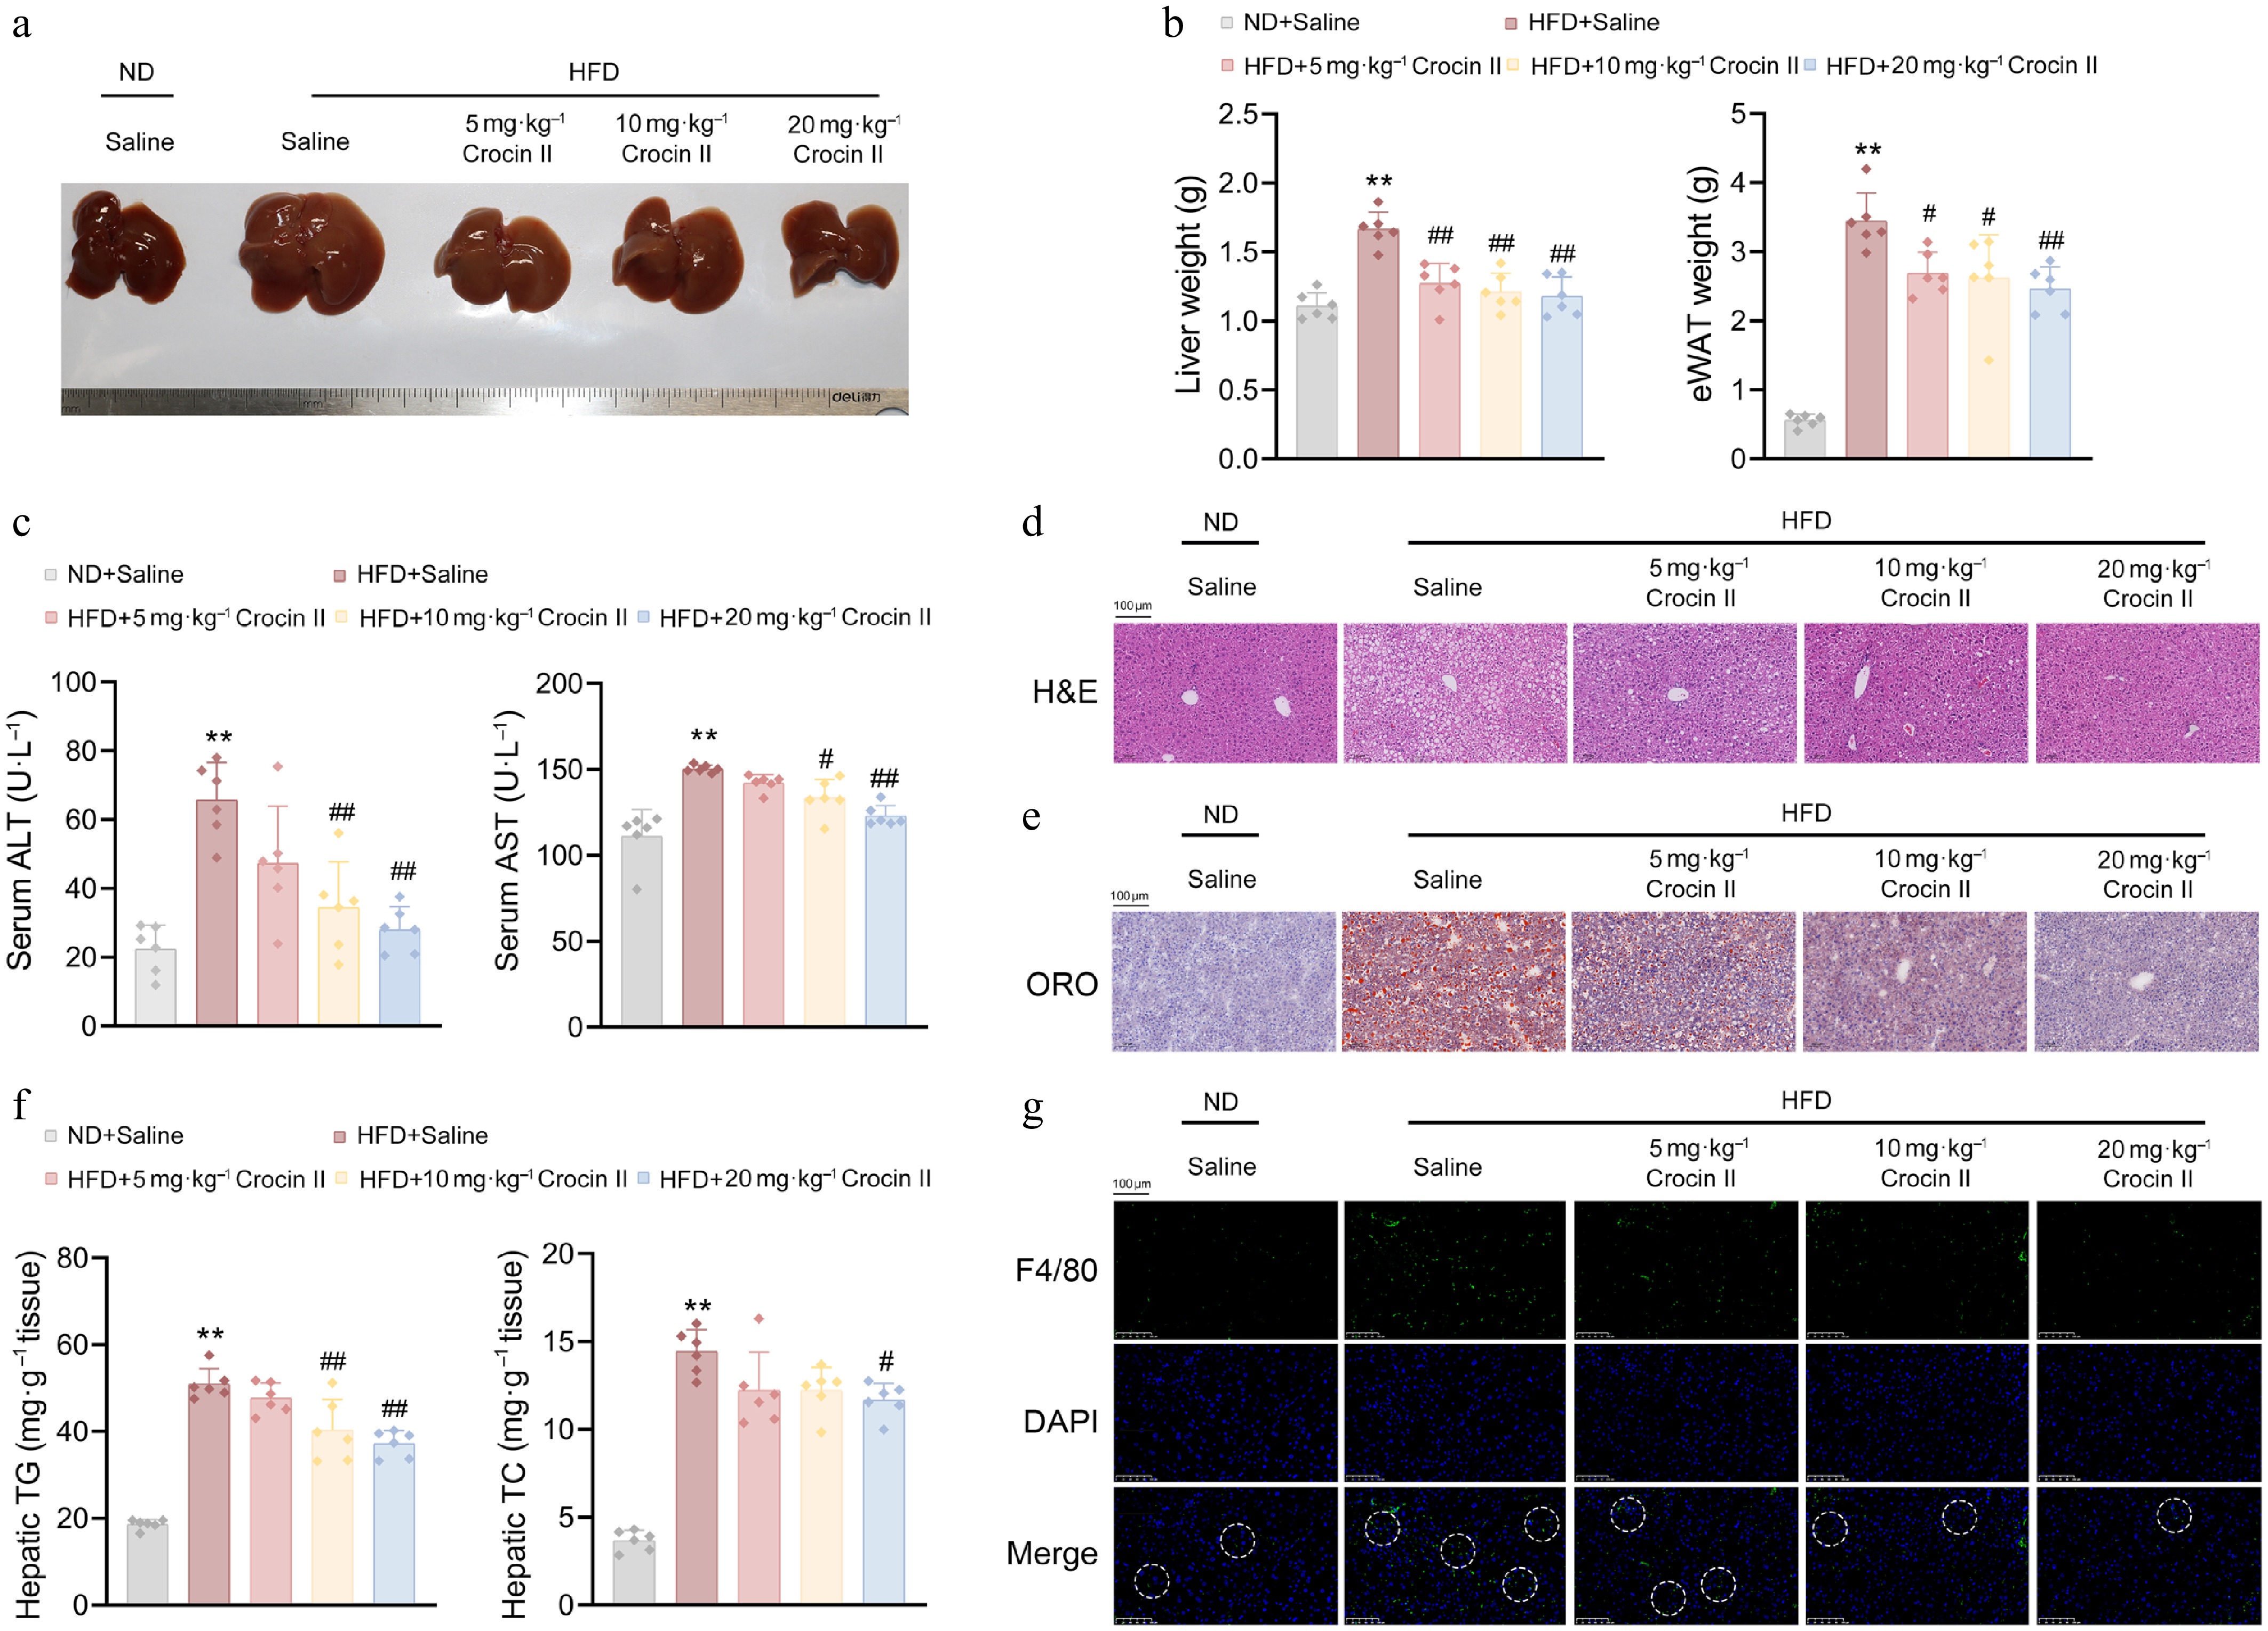
Figure 5.
Crocin II ameliorates HFD-induced hepatic steatosis in mice. (a) Image of liver morphology. (b) Liver and eWAT weights. (c) Serum ALT and AST levels. (d) Representative images of livers by H&E staining. Scale bar = 100 μm. (e) Representative images of livers by Oil Red O staining. Scale bar = 100 μm. (f) Liver TG and TC contents. (g) Representative images showed F4/80 staining of liver tissues. Scale bar = 100 μm. ** P < 0.01 vs ND + Saline group, # P < 0.05 and ## P < 0.01 vs HFD + Saline group, one-way ANOVA followed by Bonferroni's post hoc test. Data are presented as the mean ± SEM, n = 6.
-
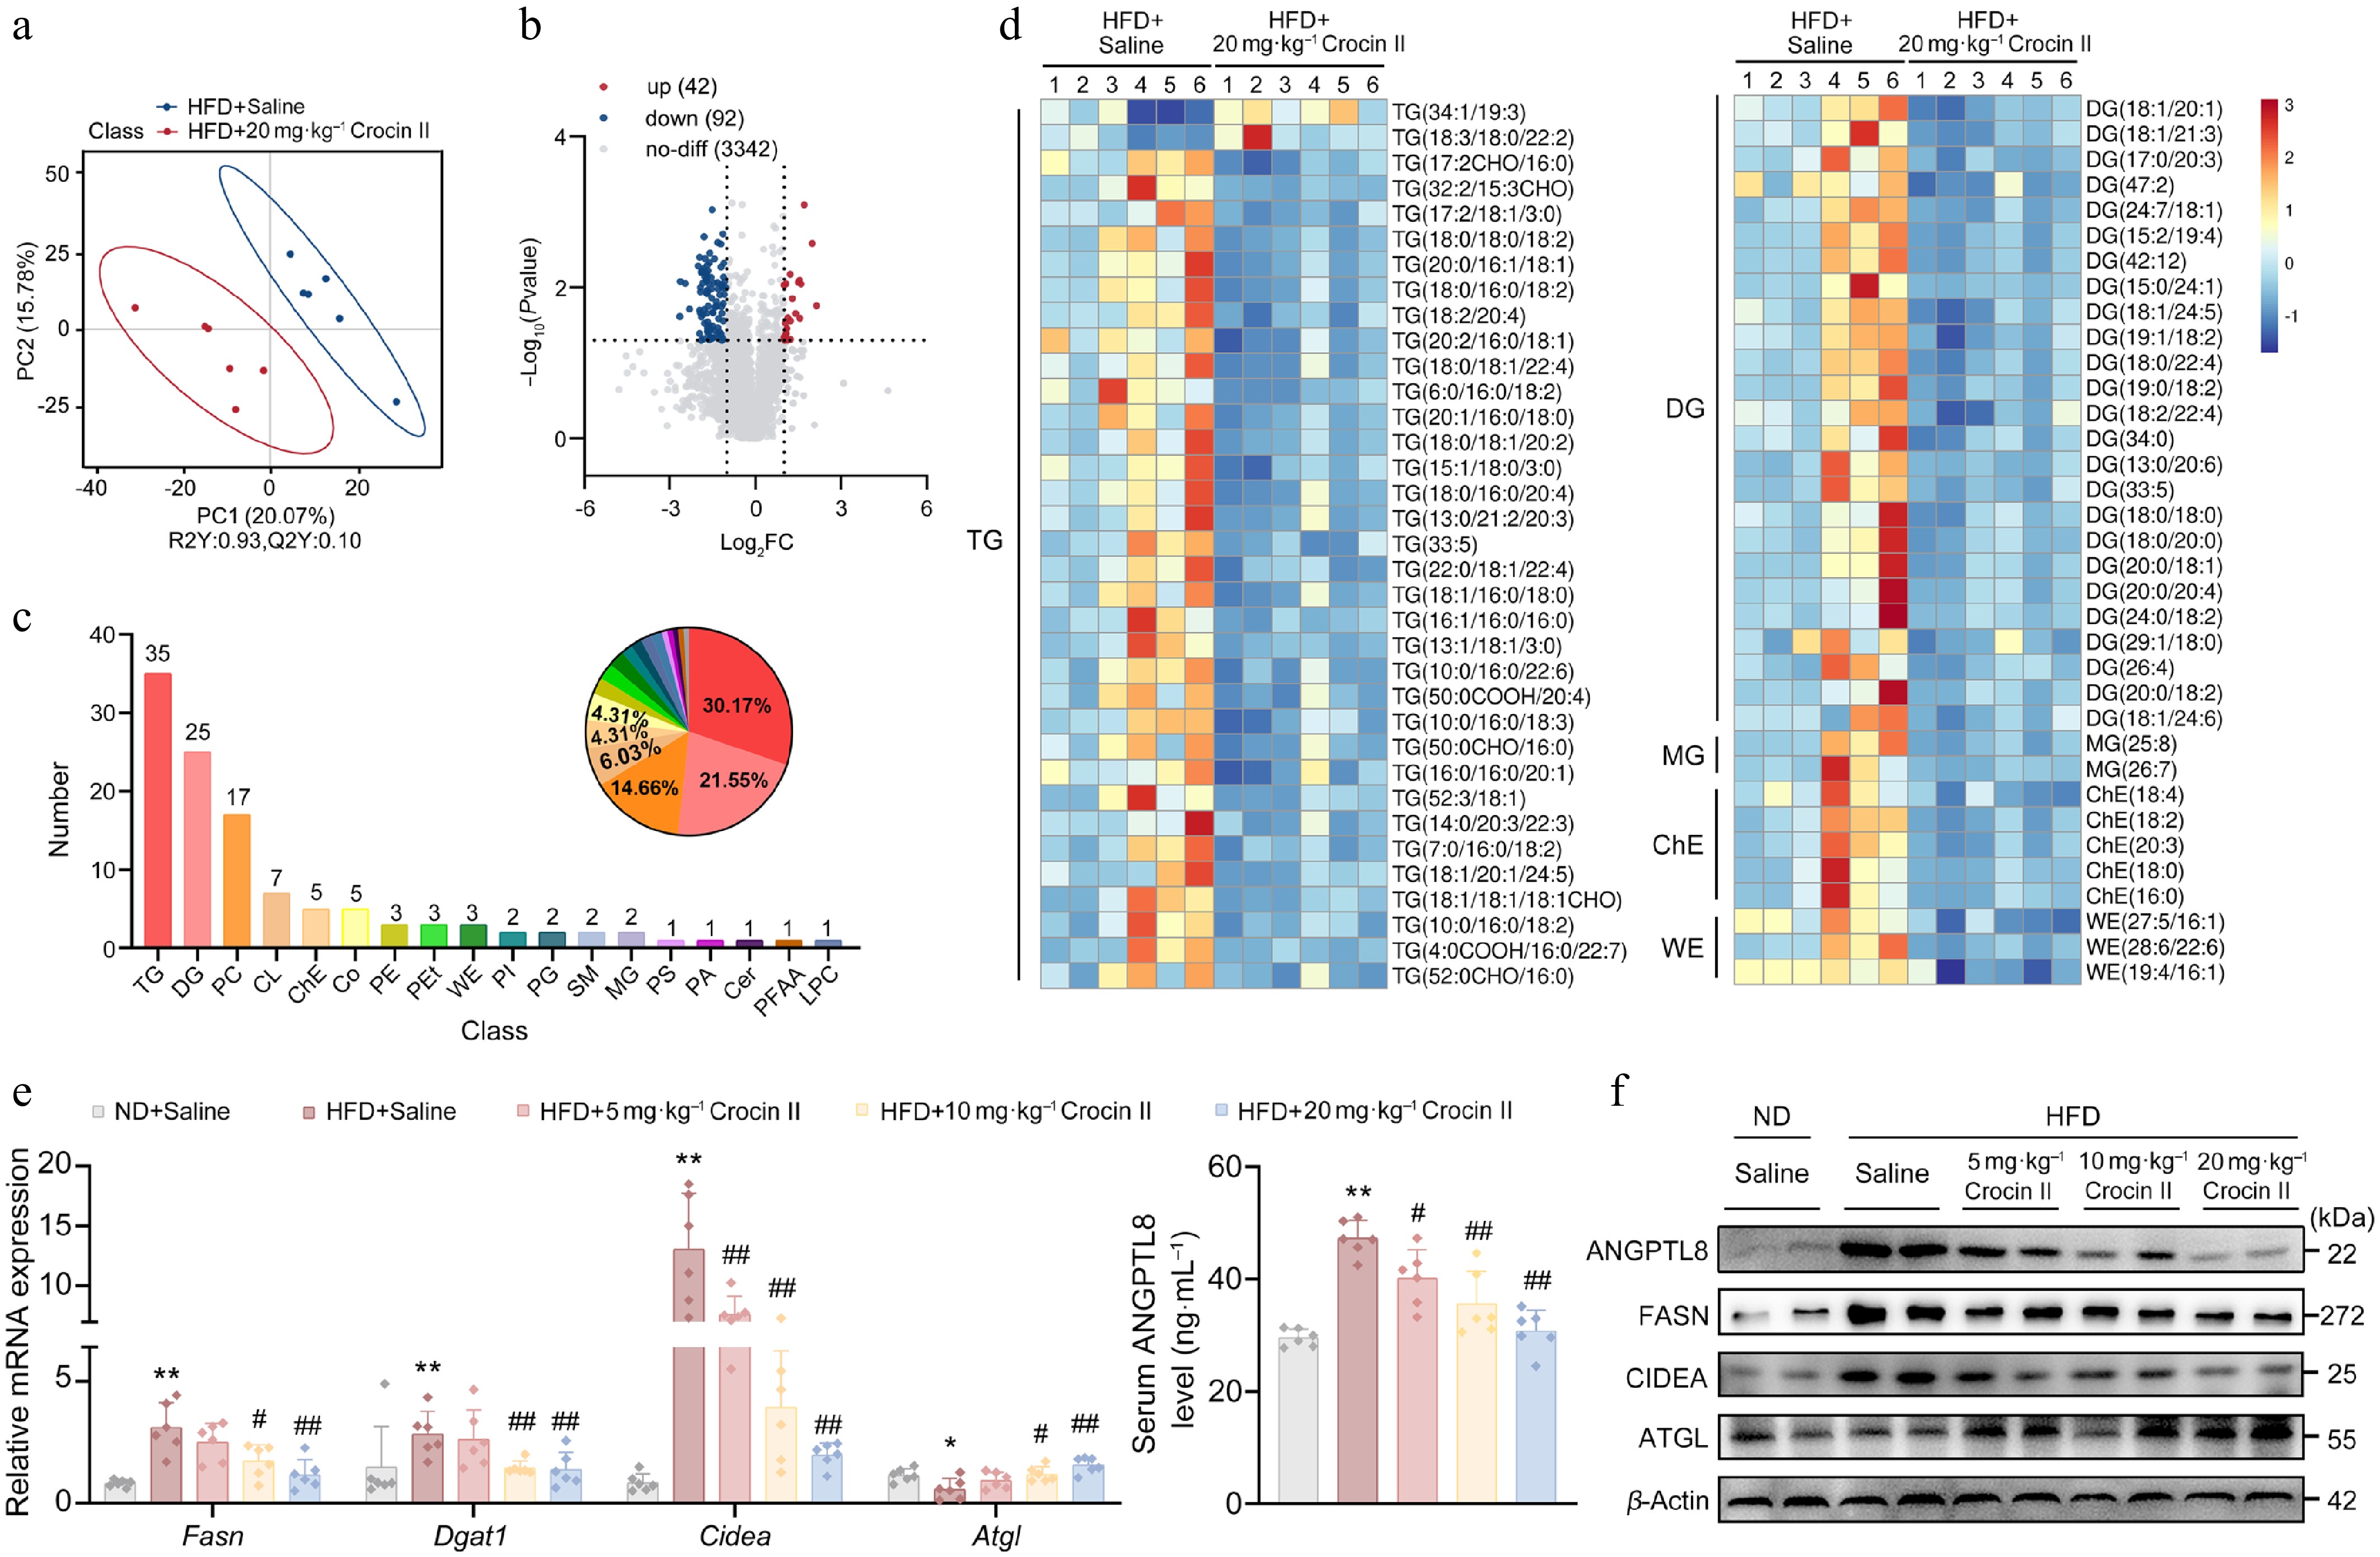
Figure 6.
Crocin II reprograms hepatic lipidomic landscape in HFD-induced MASLD mice. (a) PLS-DA score of liver lipidome in mice from HFD + saline group and HFD + 20 mg·kg−1 Crocin II group. (b) Volcano plot. (c) Statistical plot of differential lipid categories. (d) Heatmap of differential lipids. (e) The relative mRNA expression of Fasn, Dgat1, and Cidea (left). The supernatant Angptl8 levels in mouse serum detected (right). (f) The protein levels of ANGPTL8, FASN, DGAT1 and CIDEA. ** P < 0.01 vs ND + saline group, # P < 0.05 and ## P < 0.01 vs HFD + saline group, one-way ANOVA followed by Bonferroni's post hoc test. Data are presented as the mean ± SEM, n = 6.
-
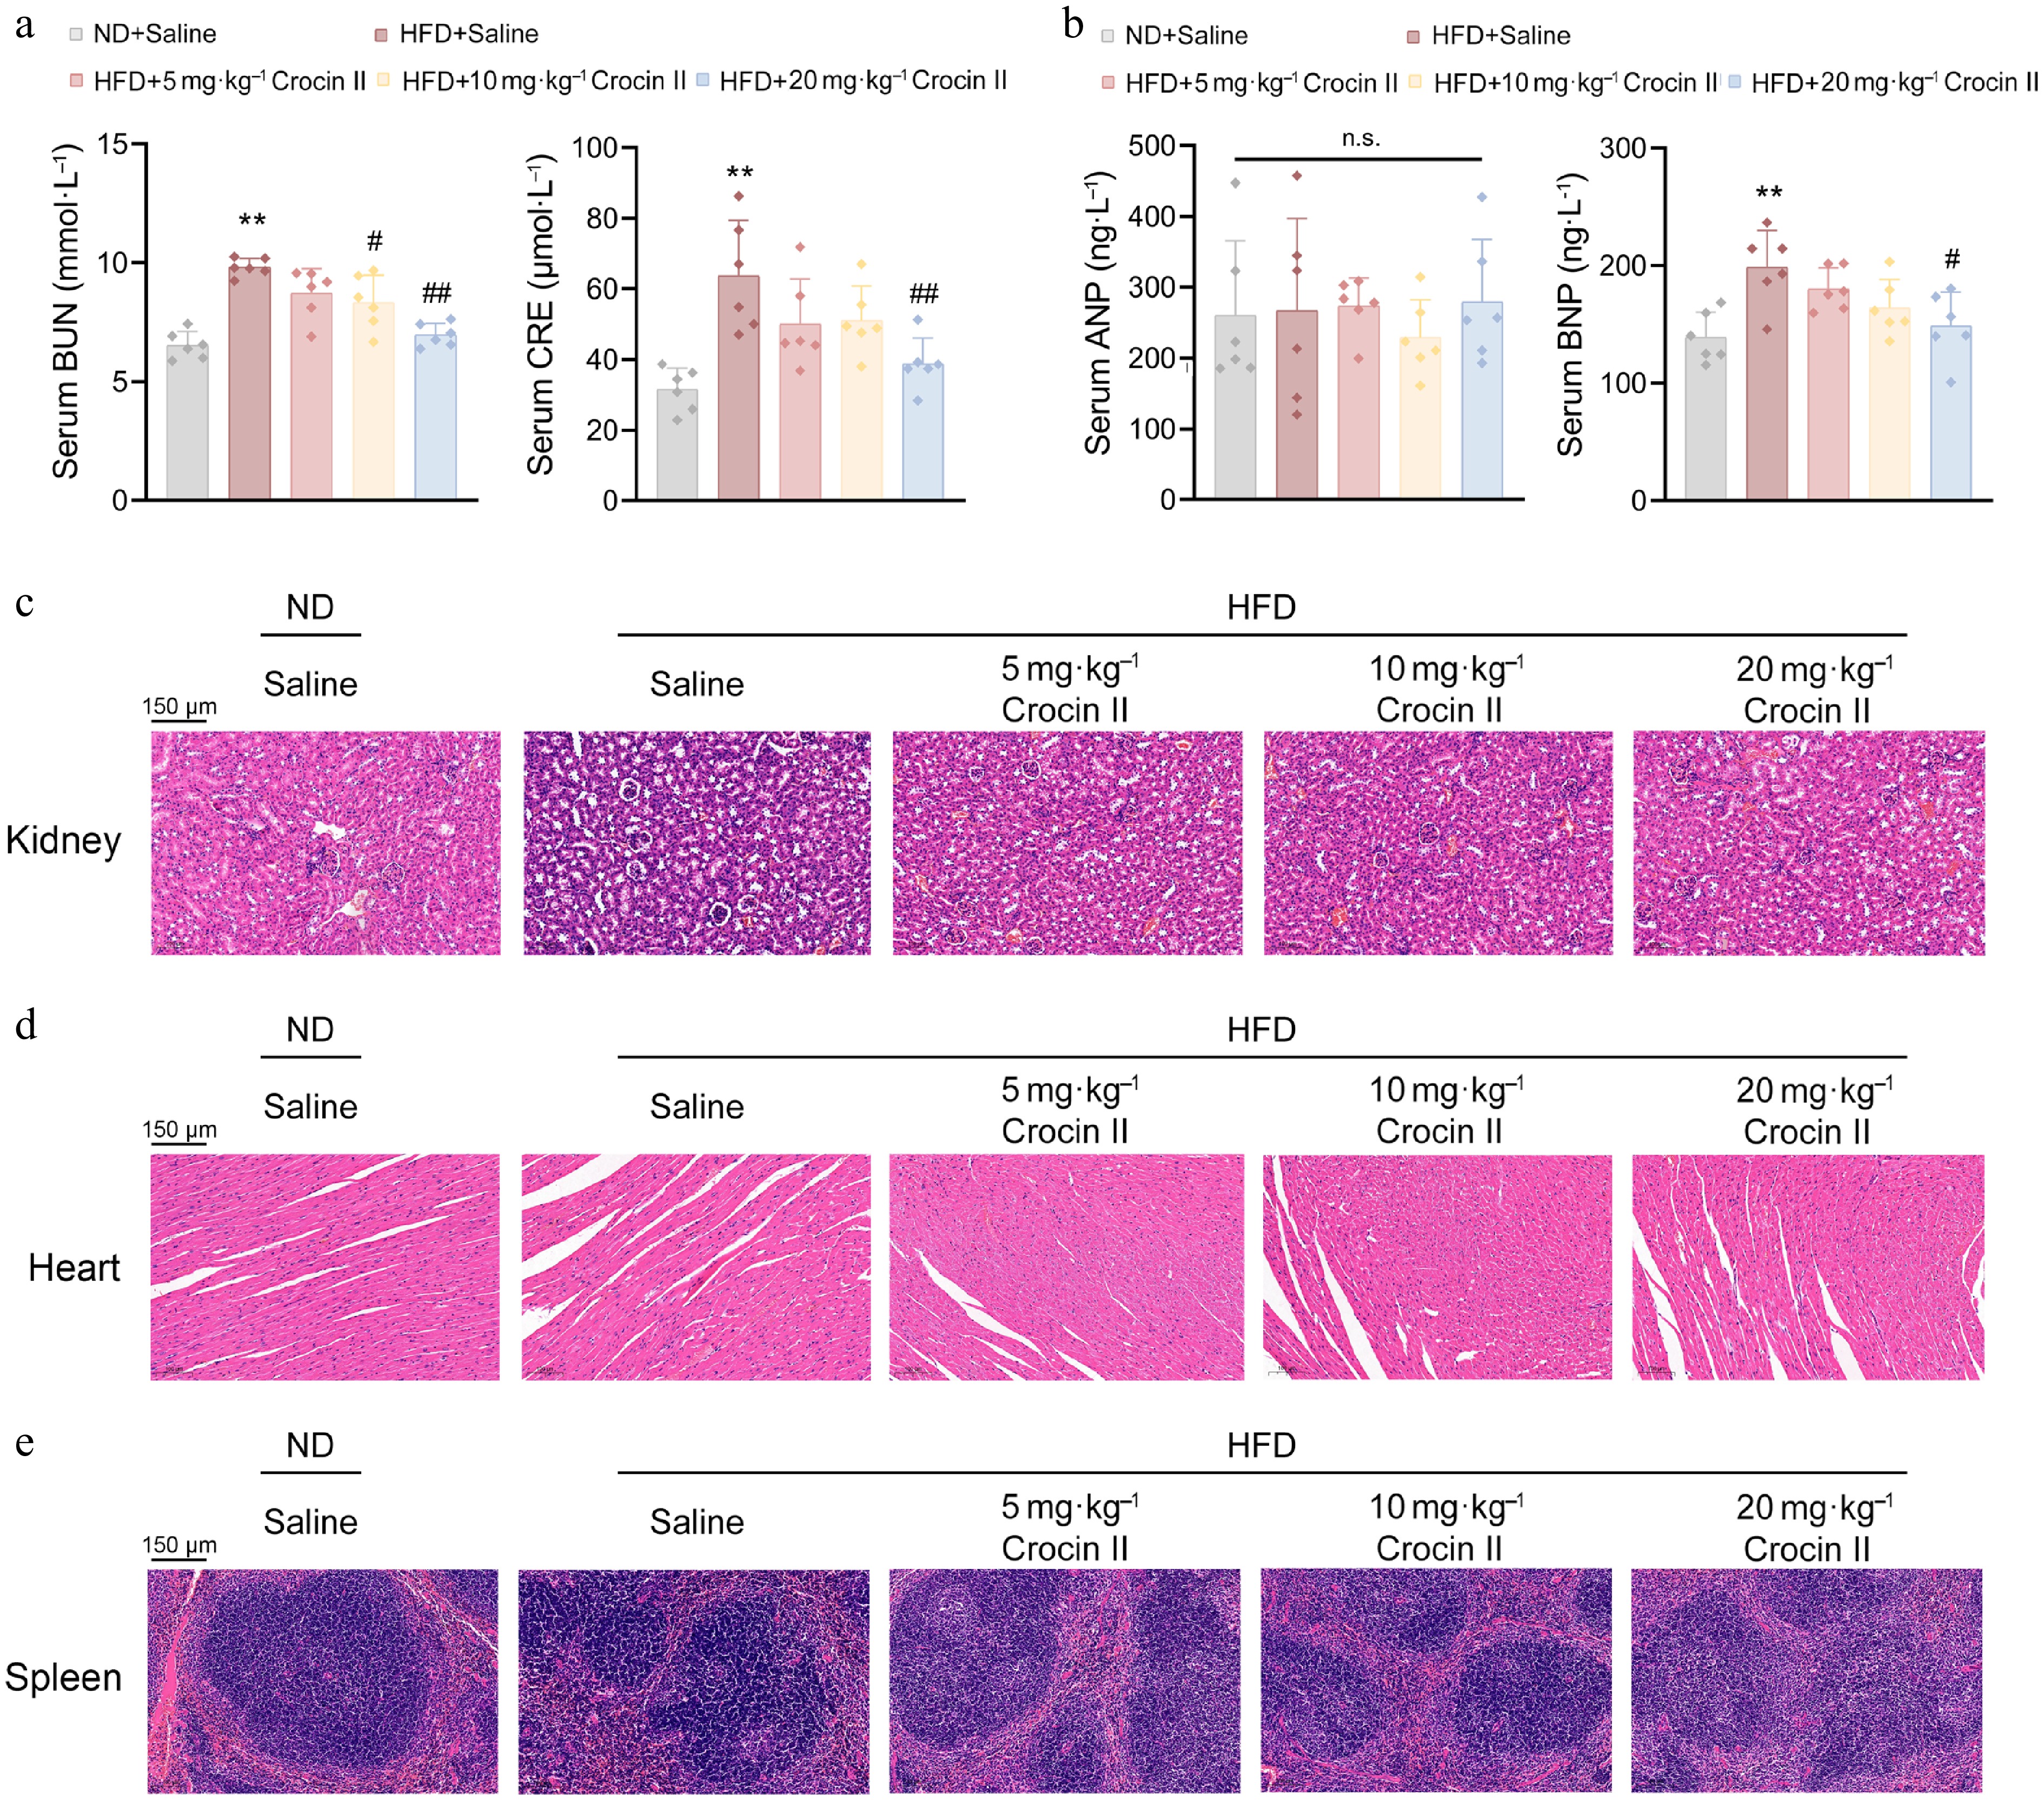
Figure 7.
Crocin II exerts in vivo organ safety. (a) The serum levels of BUN and CRE. (b) The serum levels of ANP and BNP. (c) Representative images of the kidney by H&E staining. (d) Representative images of the heart by H&E staining analysis. (d) Representative images of the spleen by H&E staining analysis. n.s., no significance, ** P < 0.01 vs ND + saline group, # P < 0.05 and ## P < 0.01 vs HFD + saline group, one-way ANOVA followed by Bonferroni's post hoc test.Data are presented as the mean ± SEM, n = 6.
Figures
(7)
Tables
(0)