-
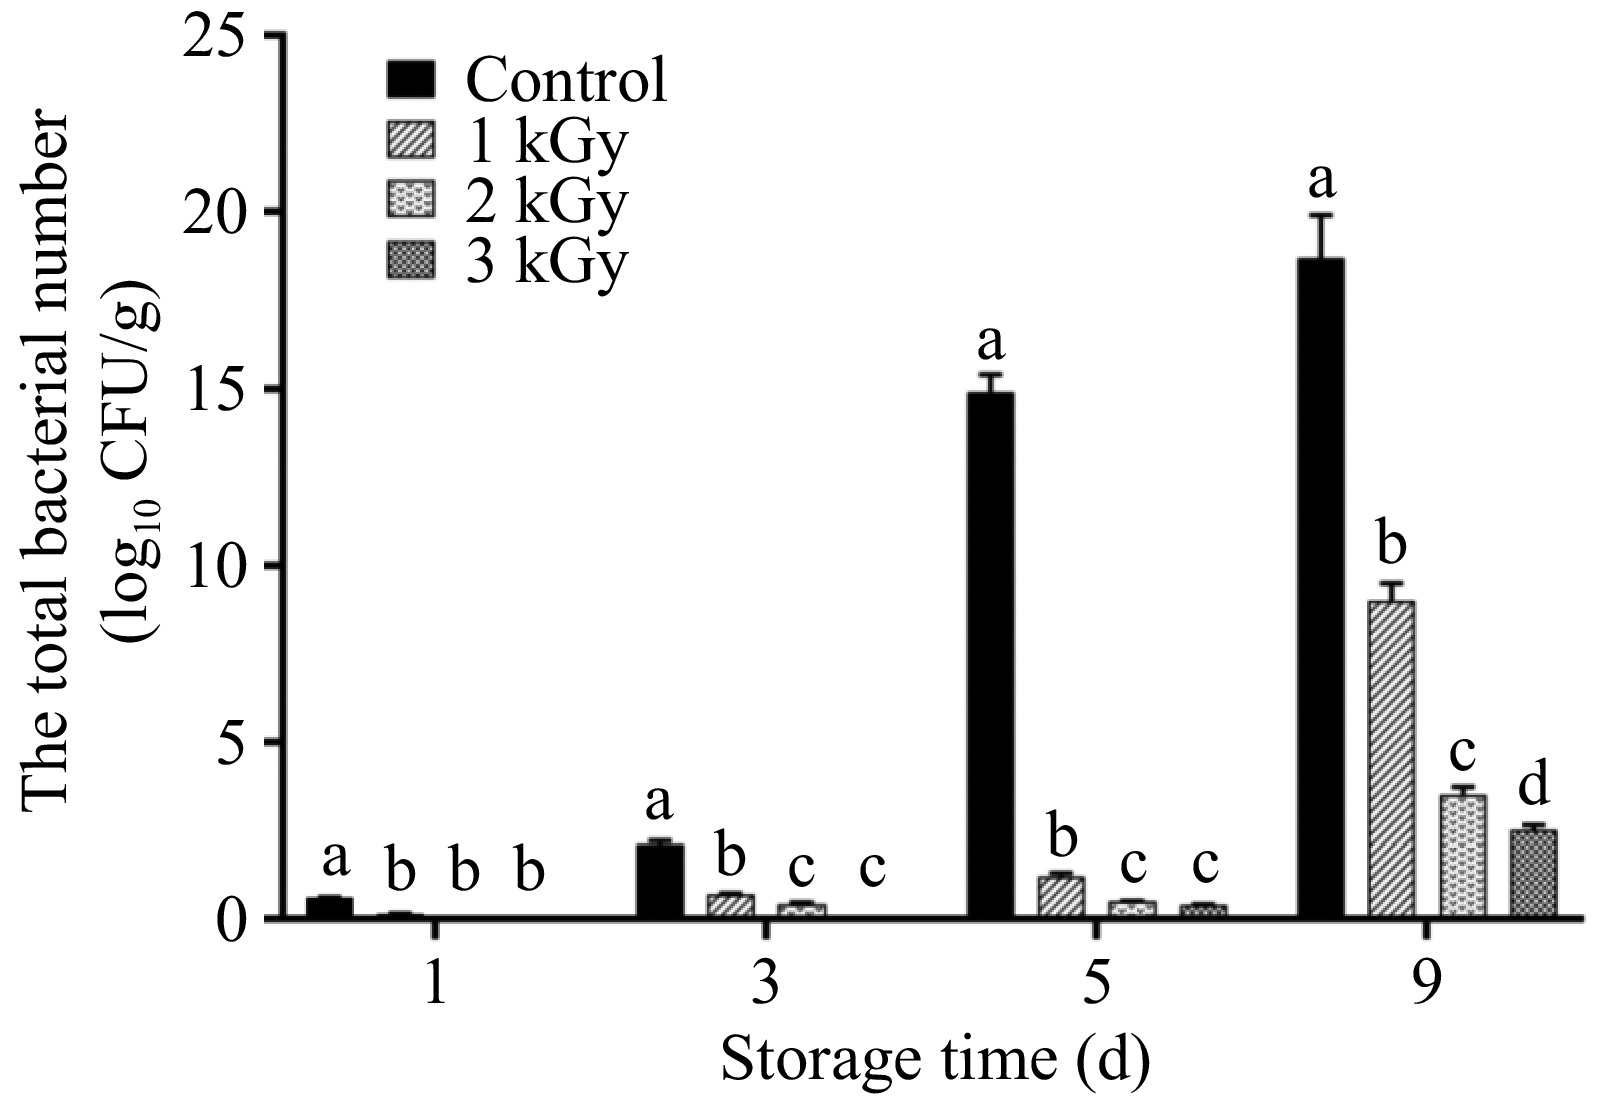
Figure 1.
Effects of irradiation on microbial contamination of fresh-cut lotus root during storage.
-
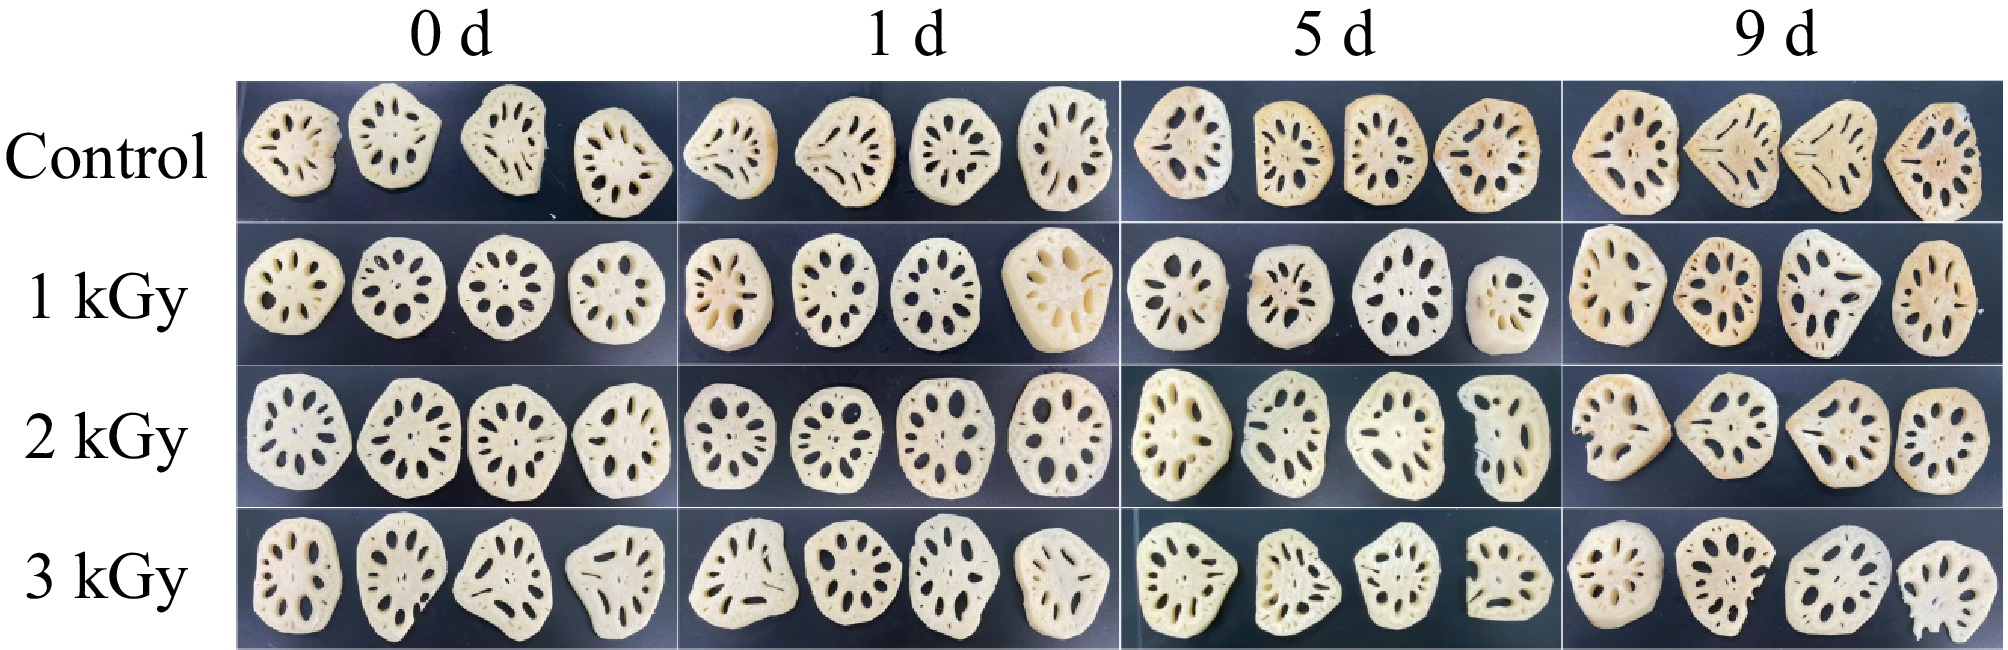
Figure 2.
Pictures of fresh-cut lotus root subjected to 60Co-γ irradiation at 1, 2, and 3 kGy during storage.
-
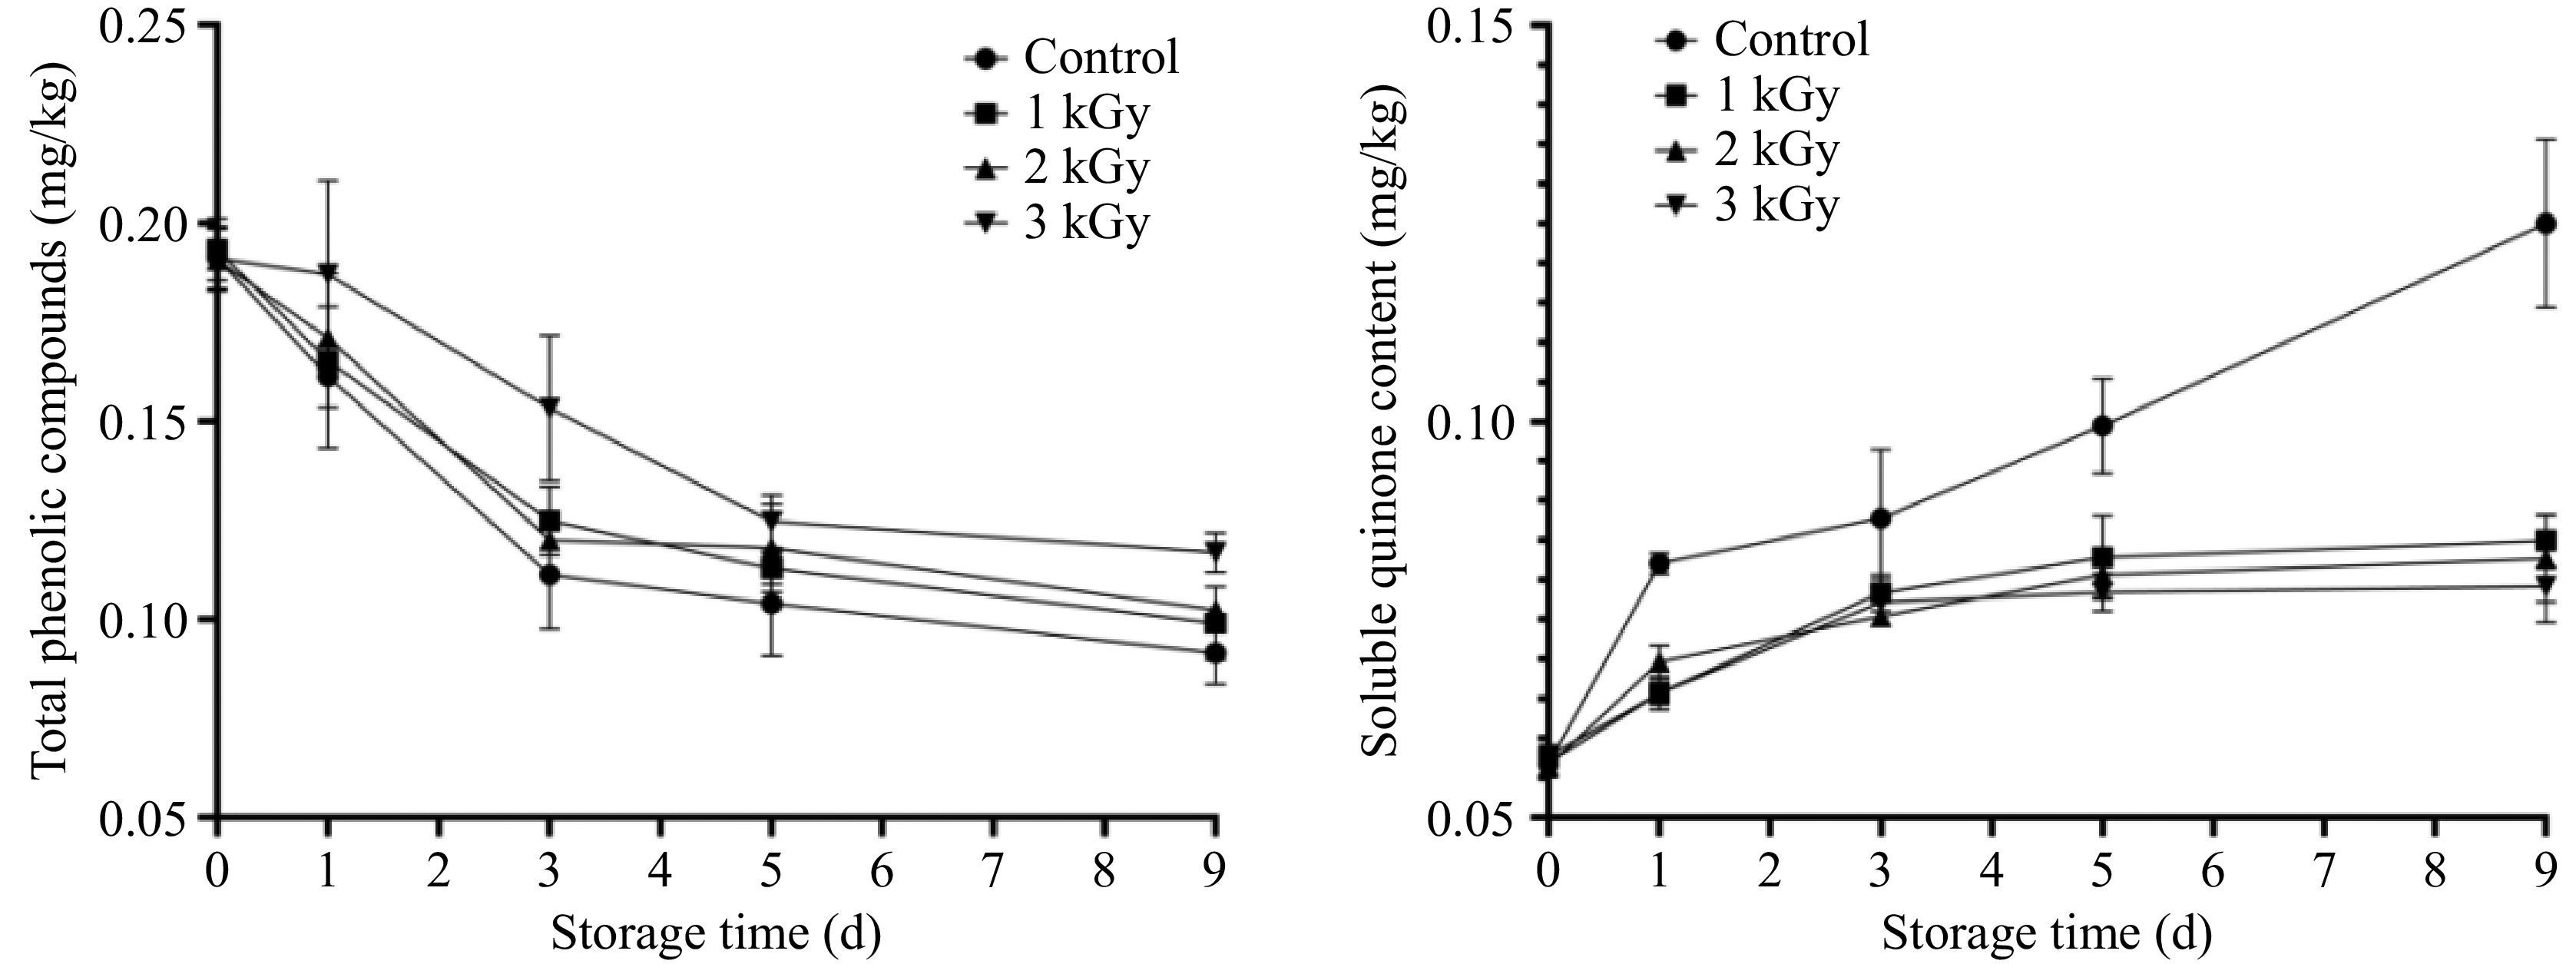
Figure 3.
The dynamic changes of total phenolic compounds, and soluble quinone content of lotus root slices subjected to irradiation during storage.
-
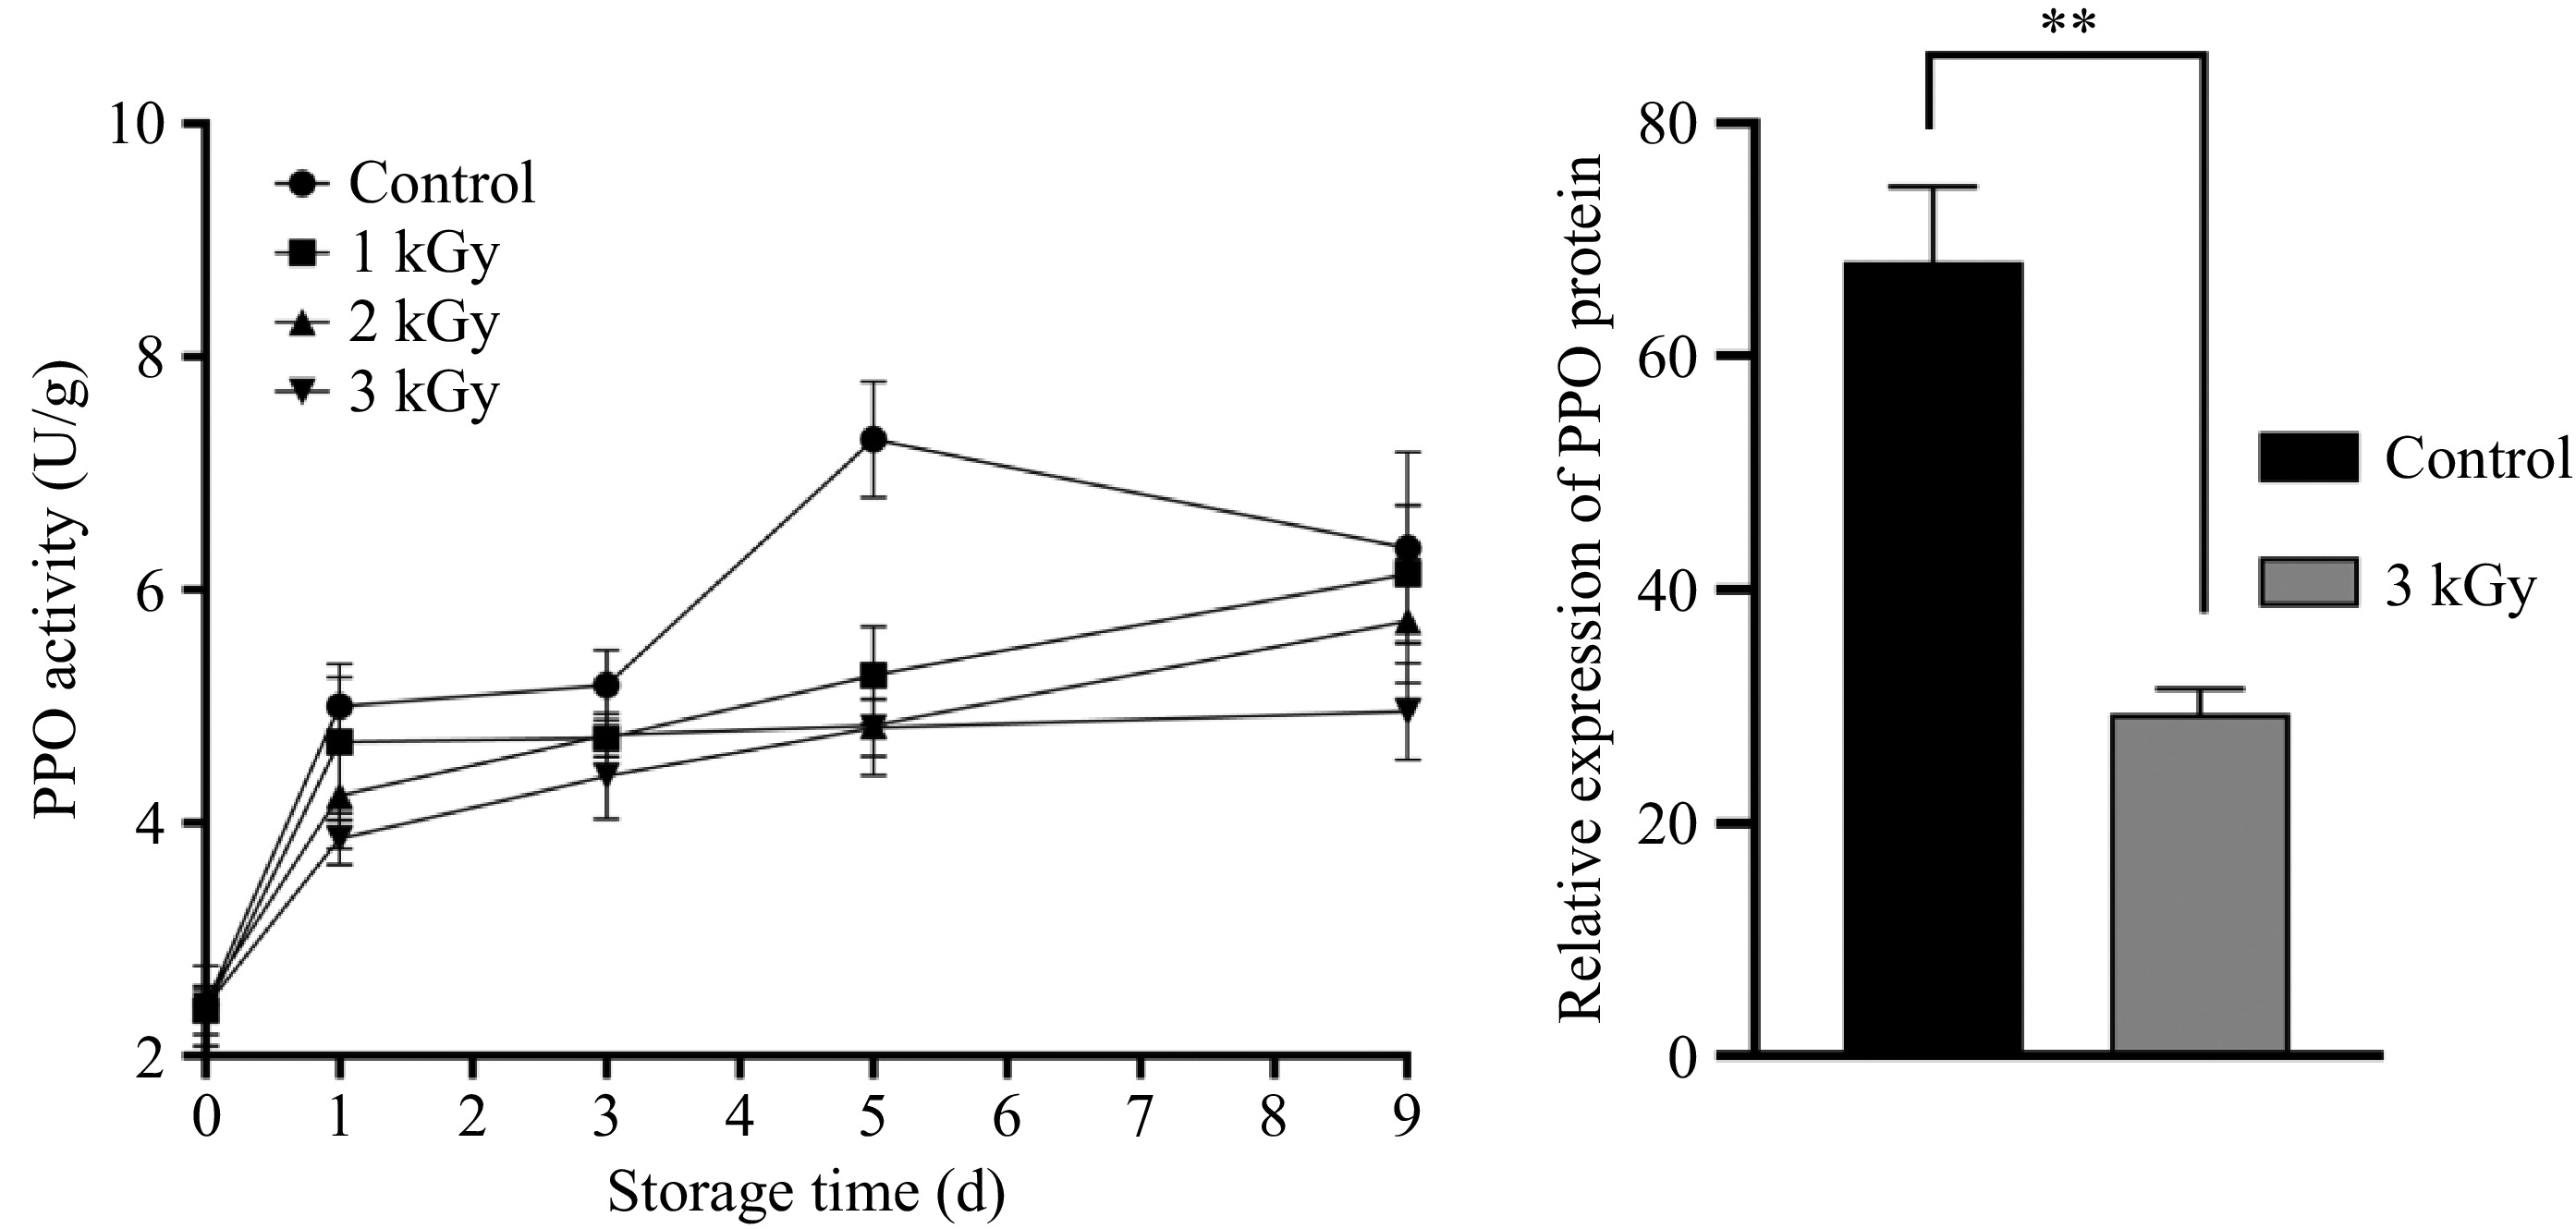
Figure 4.
The PPO activity, and relative gene expression of PPO of lotus root slice samples with and without irradiation. ** Represents significant different between treatments (p < 0.05).
-
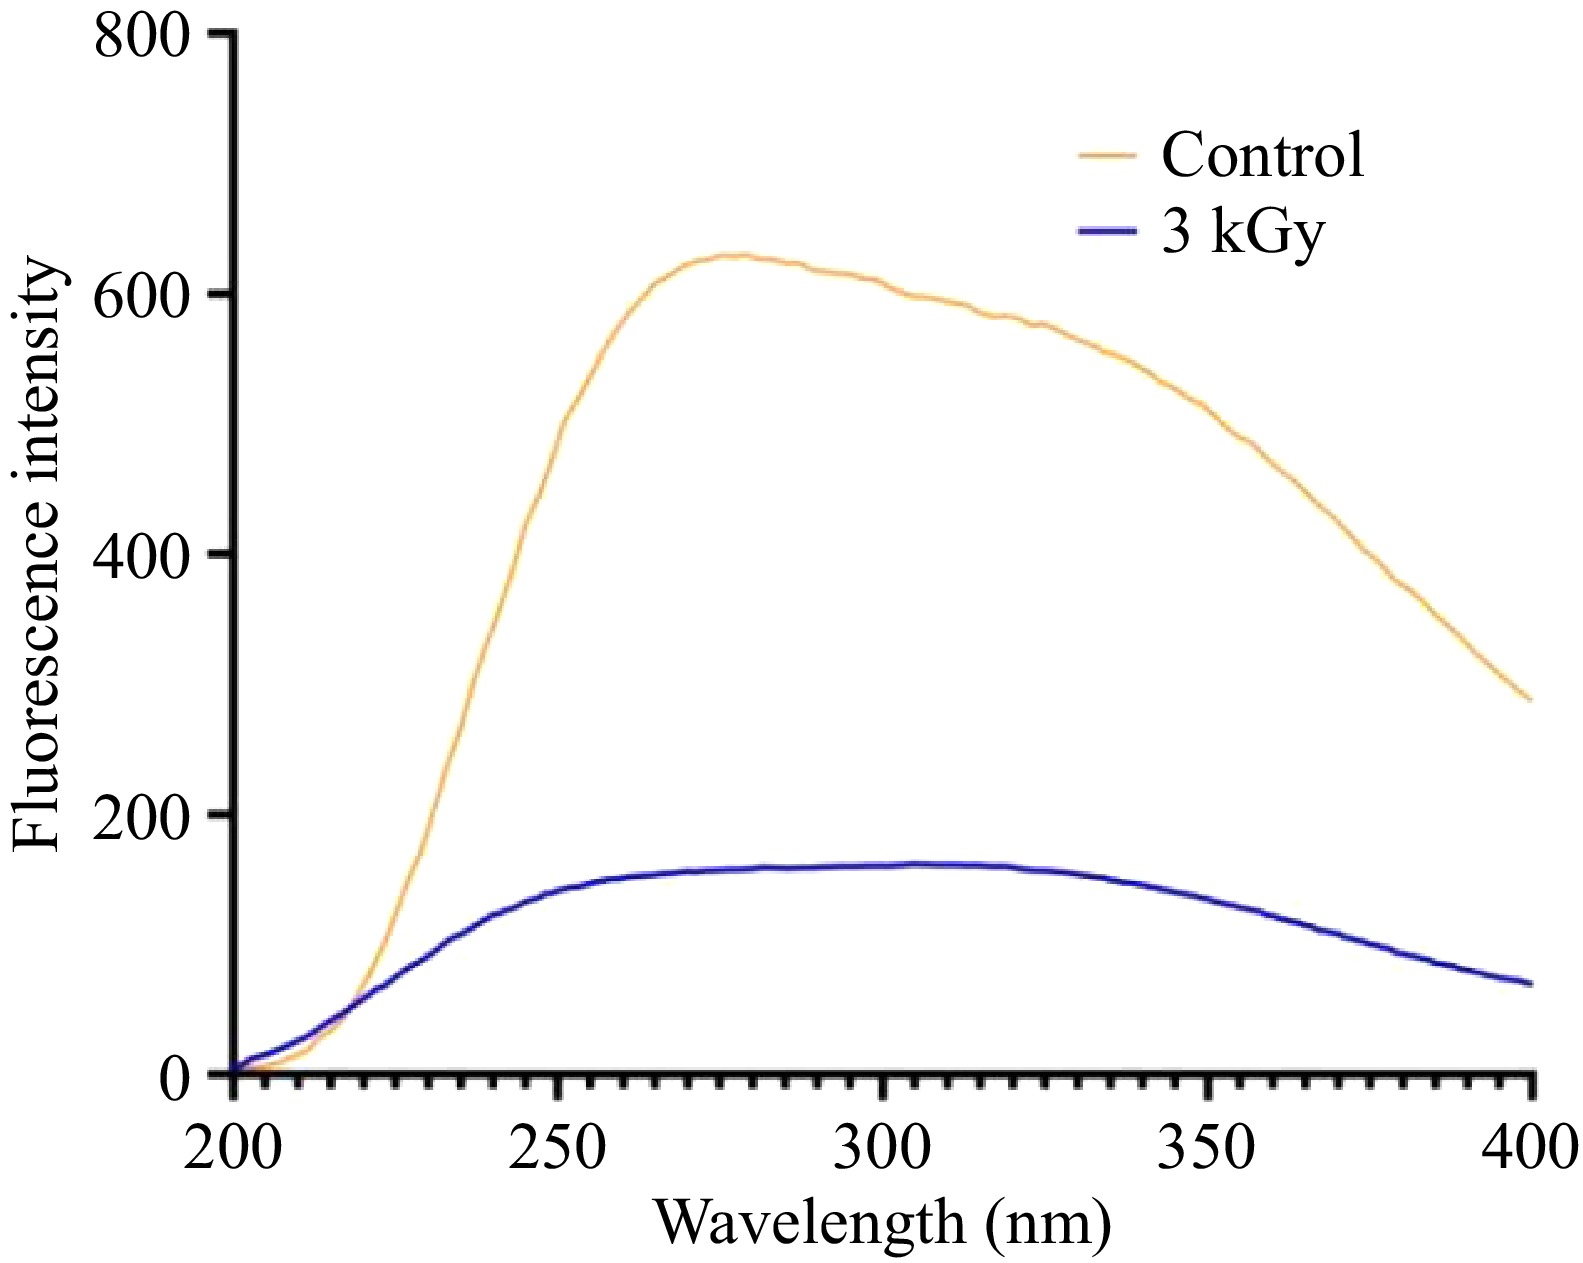
Figure 5.
Fluorescence spectra of PPO with and without 60Co-γ irradiation.
-
Parameters Storage time (d) Treatments Control 1 kGy 2 kGy 3 kGy Color
(L*)0 50.91 ± 1.99b 50.21 ± 0.85a 50.98 ± 0.77b 50.13 ± 1.58ab 3 41.81 ± 1.32a 40.48 ± 1.07b 40.34 ± 1.41b 40.68 ± 0.78b 5 40.02 ± 1.94a 38.98 ± 2.00a 39.70 ± 2.08a 40.23 ± 2.00a 9 31.70 ± 1.85c 32.14 ± 1.60c 35.62 ± 2.66b 38.98 ± 2.28a Color
(ΔE)0 45.51 ± 1.61a 44.08 ± 1.80a 45.46 ± 1.73a 44.48 ± 1.89a 3 47.74 ± 1.33a 46.67 ± 0.89b 46.6 ± 1.11b 46.33 ± 0.63b 5 54.67 ± 1.86c 56.96 ± 0.84a 54.98 ± 0.68bc 56.1 ± 1.49ab 9 44.28 ± 2.07a 36.64 ± 1.94c 40.19 ± 2.73b 35.88 ± 2.07c Browning Index (BI) 0 4.87 ± 0.80a 4.87 ± 1.28a 4.80 ± 1.12a 4.83 ± 1.15a 3 8.94 ± 2.59c 7.19 ± 0.73b 6.68 ± 0.92ab 6.38 ± 1.62a 5 14.07 ± 2.07c 7.37 ± 0.31a 7.13 ± 0.82ab 6.91 ± 2.06b 9 15.57 ± 2.73a 10.88 ± 0.48c 9.84 ± 0.52c 7.98 ± 0.67b Different letters in the same row indicate significant difference (p < 0.05). Table 1.
Changes in color and browning index of fresh-cut lotus root during storage.
-
Parameters Storage
time (d)Treatments (U/g FW) Control 1 kGy 2 kGy 3 kGy PAL
activity0 6.05 ± 0.67a 6.65 ± 0.57a 6.15 ± 1.32a 6.45 ± 2.89a 3 10.71 ± 0.06a 10.89 ± 1.30a 9.09 ± 1.22a 9.21 ± 1.65a 5 10.42 ± 0.71a 12.02 ± 0.73b 9.97 ± 0.24a 10.58 ± 0.29a 9 9.46 ± 0.68a 9.23 ± 0.57a 9.75 ± 1.86a 9.98 ± 0.72a POD
activity0 39.77 ± 5.38a 39.91 ± 3.30a 38.23 ± 3.27a 38.76 ± 4.19a 3 56.84 ± 8.71a 54.75 ± 1.86a 56.38 ± 1.95a 53.49 ± 1.13a 5 53.48 ± 1.13a 59.51 ± 9.73b 59.70 ± 8.11b 53.48 ± 4.36a 9 51.47 ± 2.10a 55.62 ± 0.97a 53.16 ± 5.62a 54.89 ± 8.75a Different letters in the same row indicate significant difference (p < 0.05). Table 2.
The activities of PAL and POD in lotus roots slices subjected to different doses of 60Co-γ irradiation during storage.
-
Treatment α-Helix (%) β-Sheet (%) β-Corner (%) Random coil (%) Control 35.4 ± 0.4a 20.6 ± 0.5a 14.0 ± 0.1a 30.1 ± 0.9a 3 kGy 18.4 ± 0.2b 28.5 ± 0.1b 14.2 ± 0.1a 39.0 ± 0.3b The different letters in the same row means significant difference (p < 0.05). Table 3.
Effect of 60Co-γ irradiation on the percentage content of lotus PPO secondary structures.
Figures
(5)
Tables
(3)