-
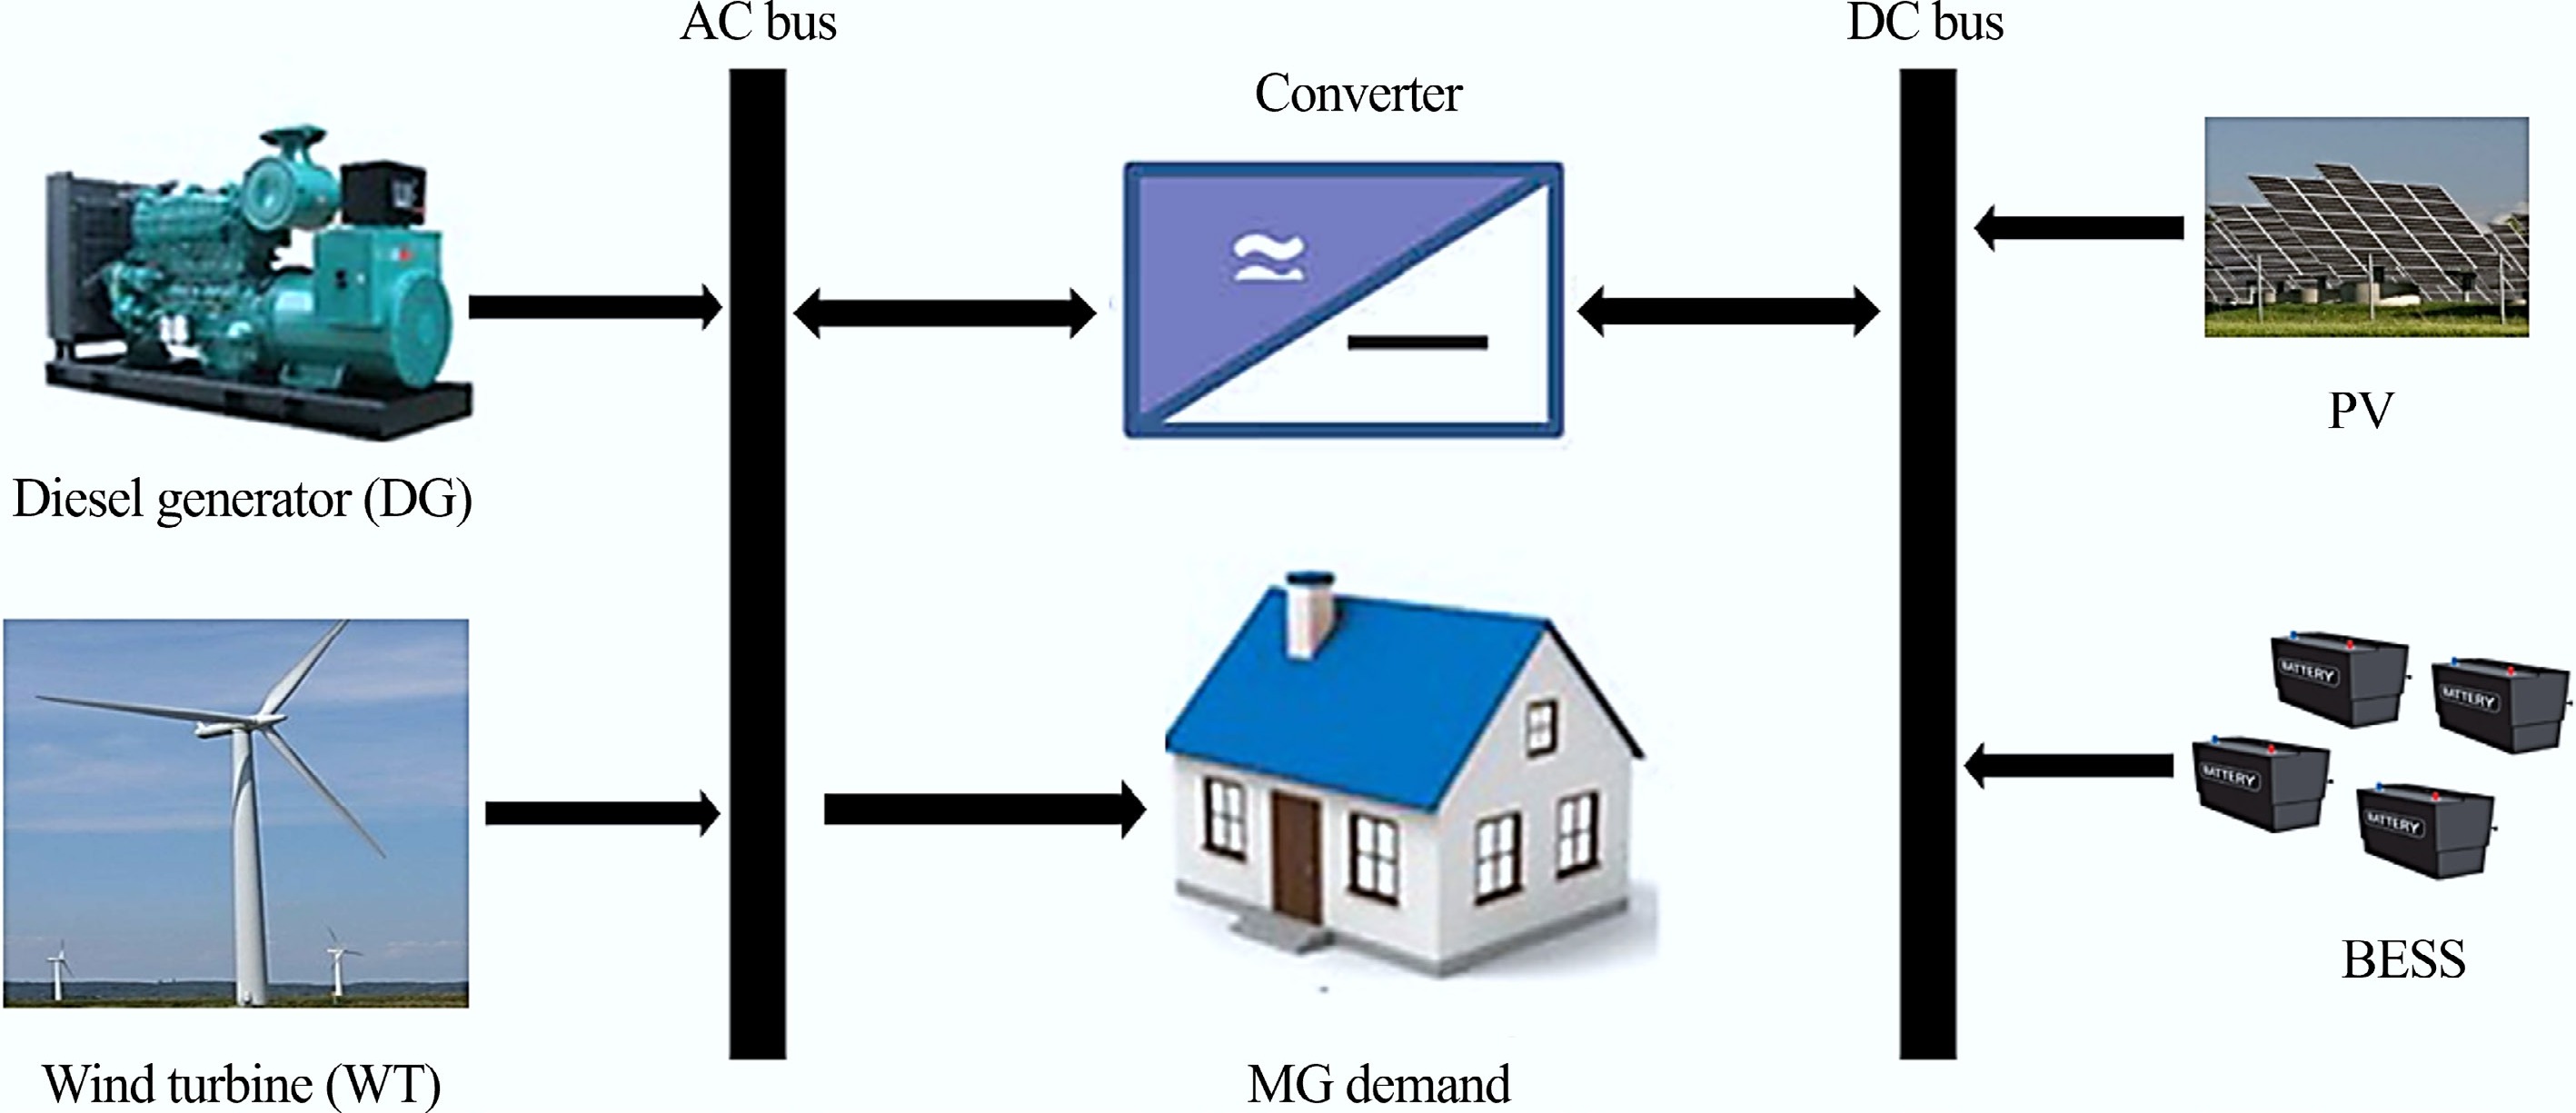
Figure 1.
Hybrid residential microgrid under consideration.
-
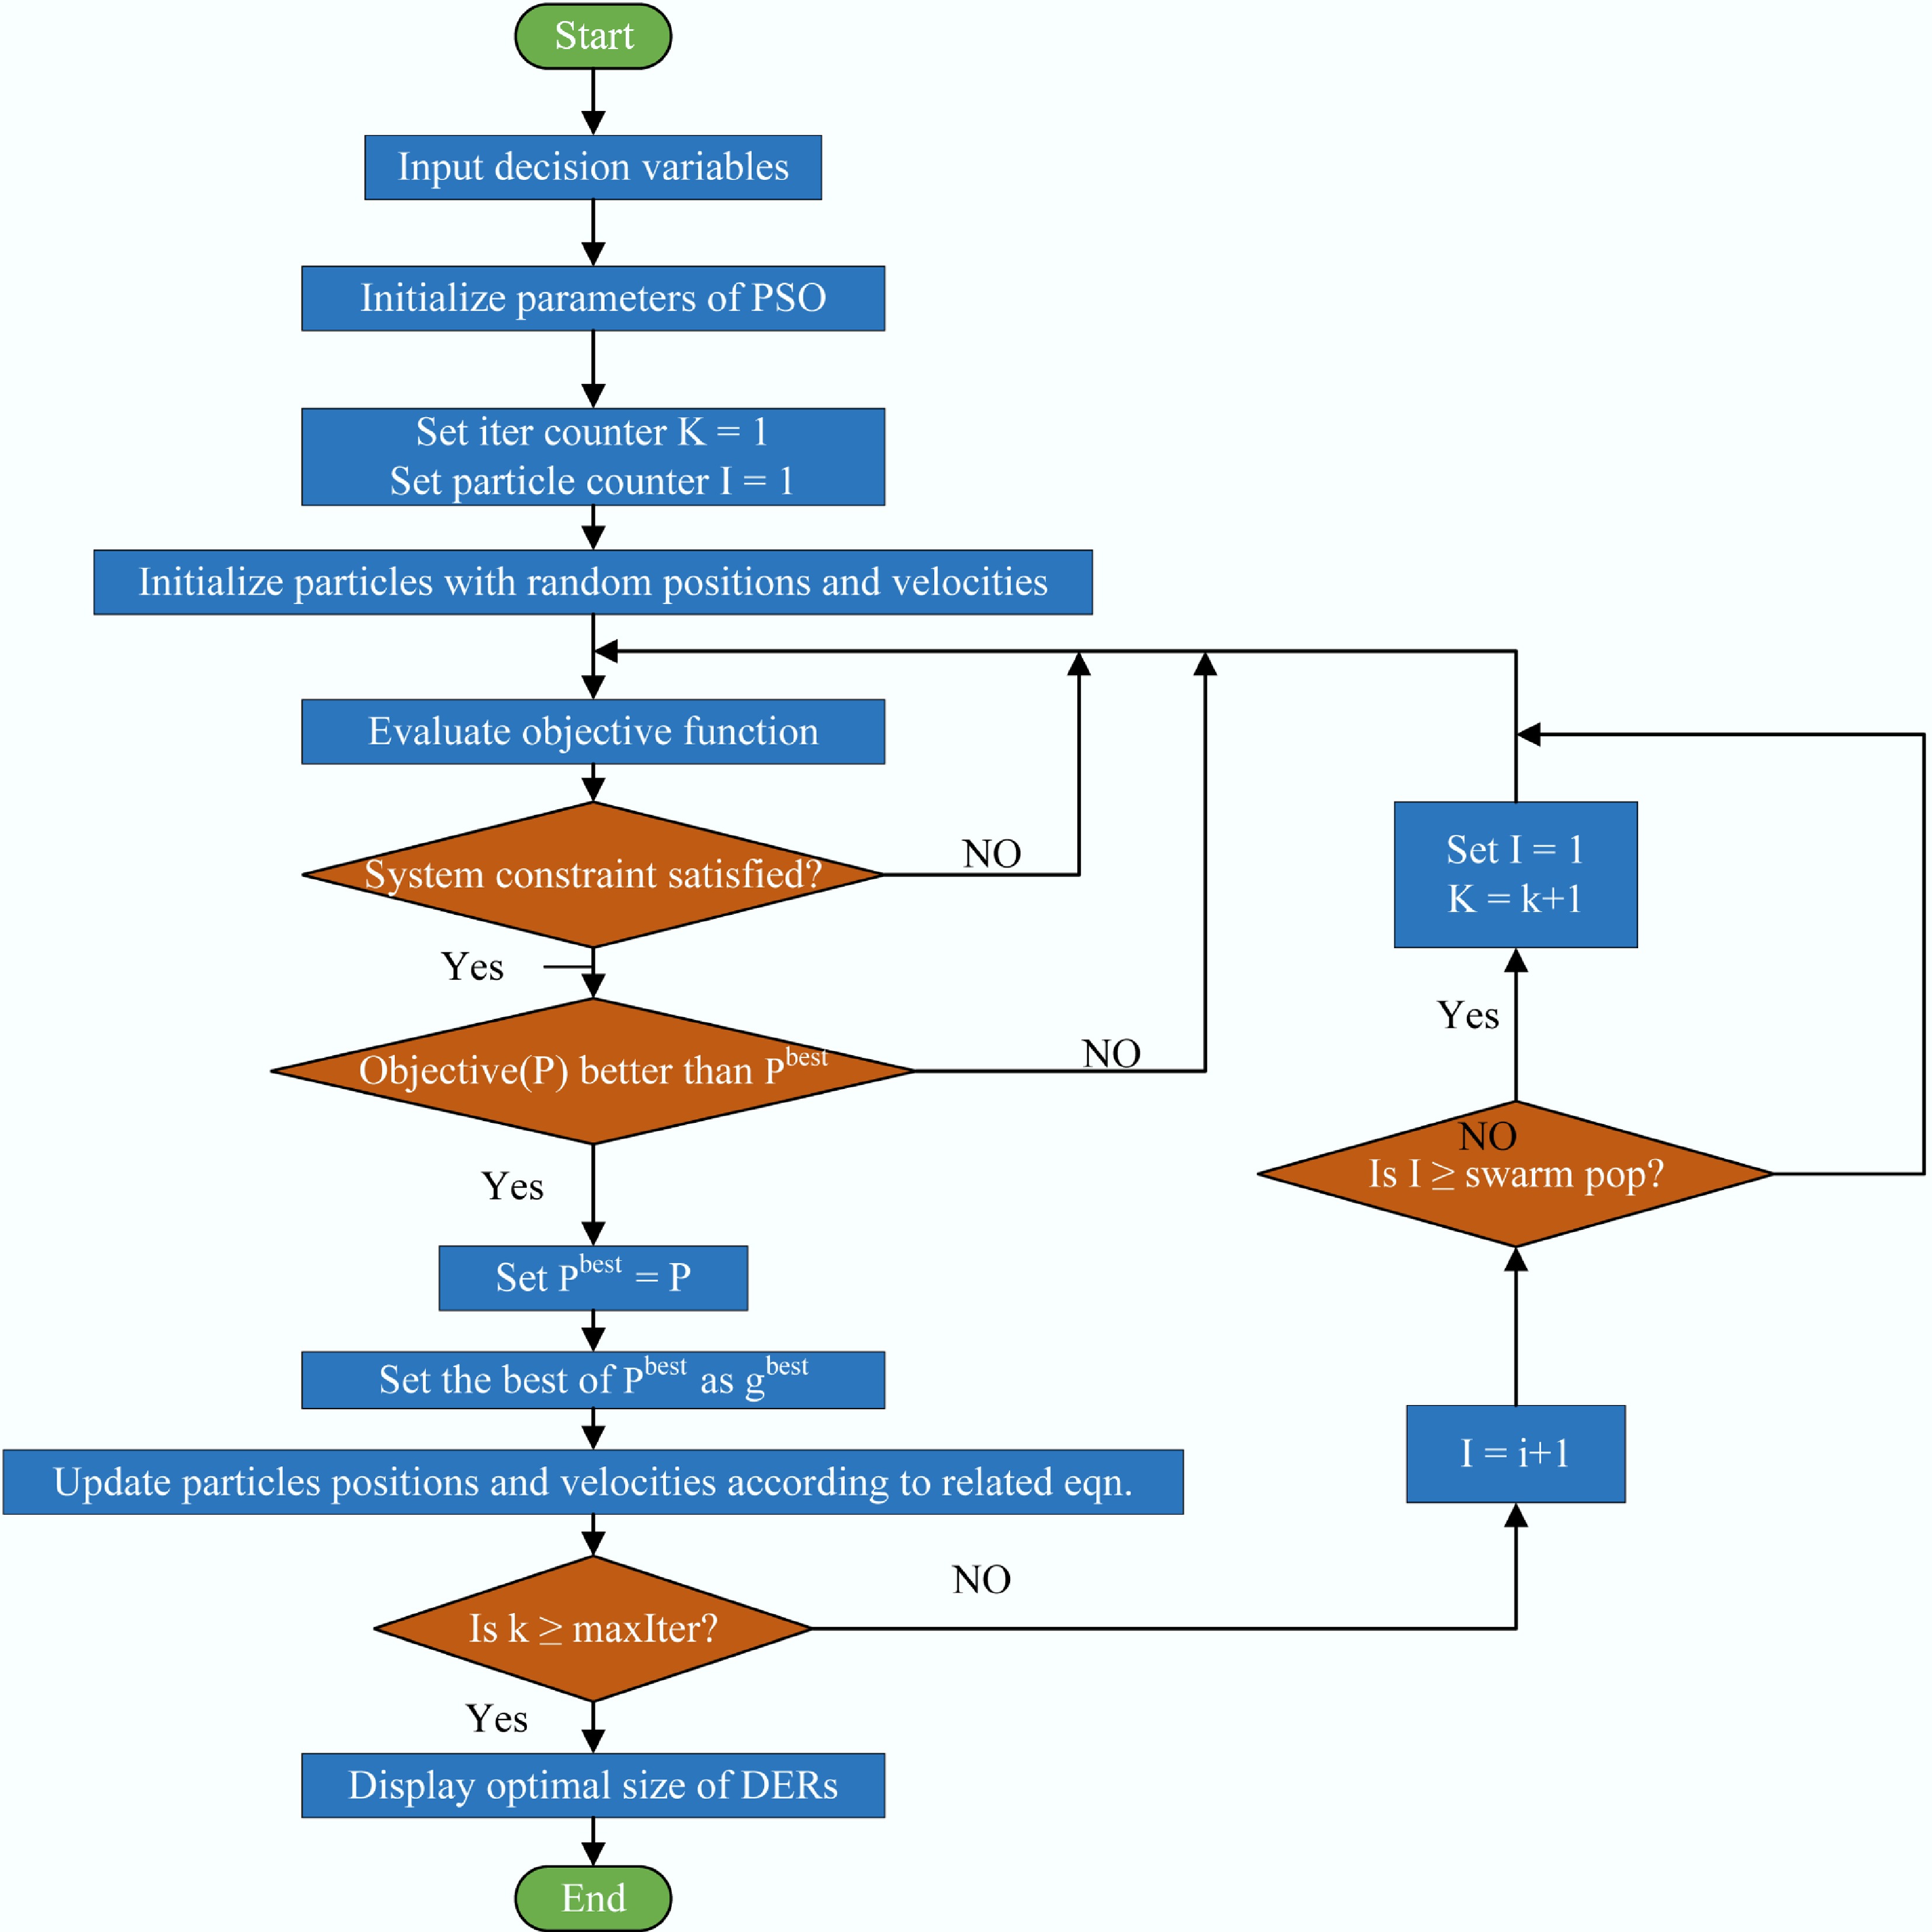
Figure 2.
Flowchart of the proposed methodology.
-
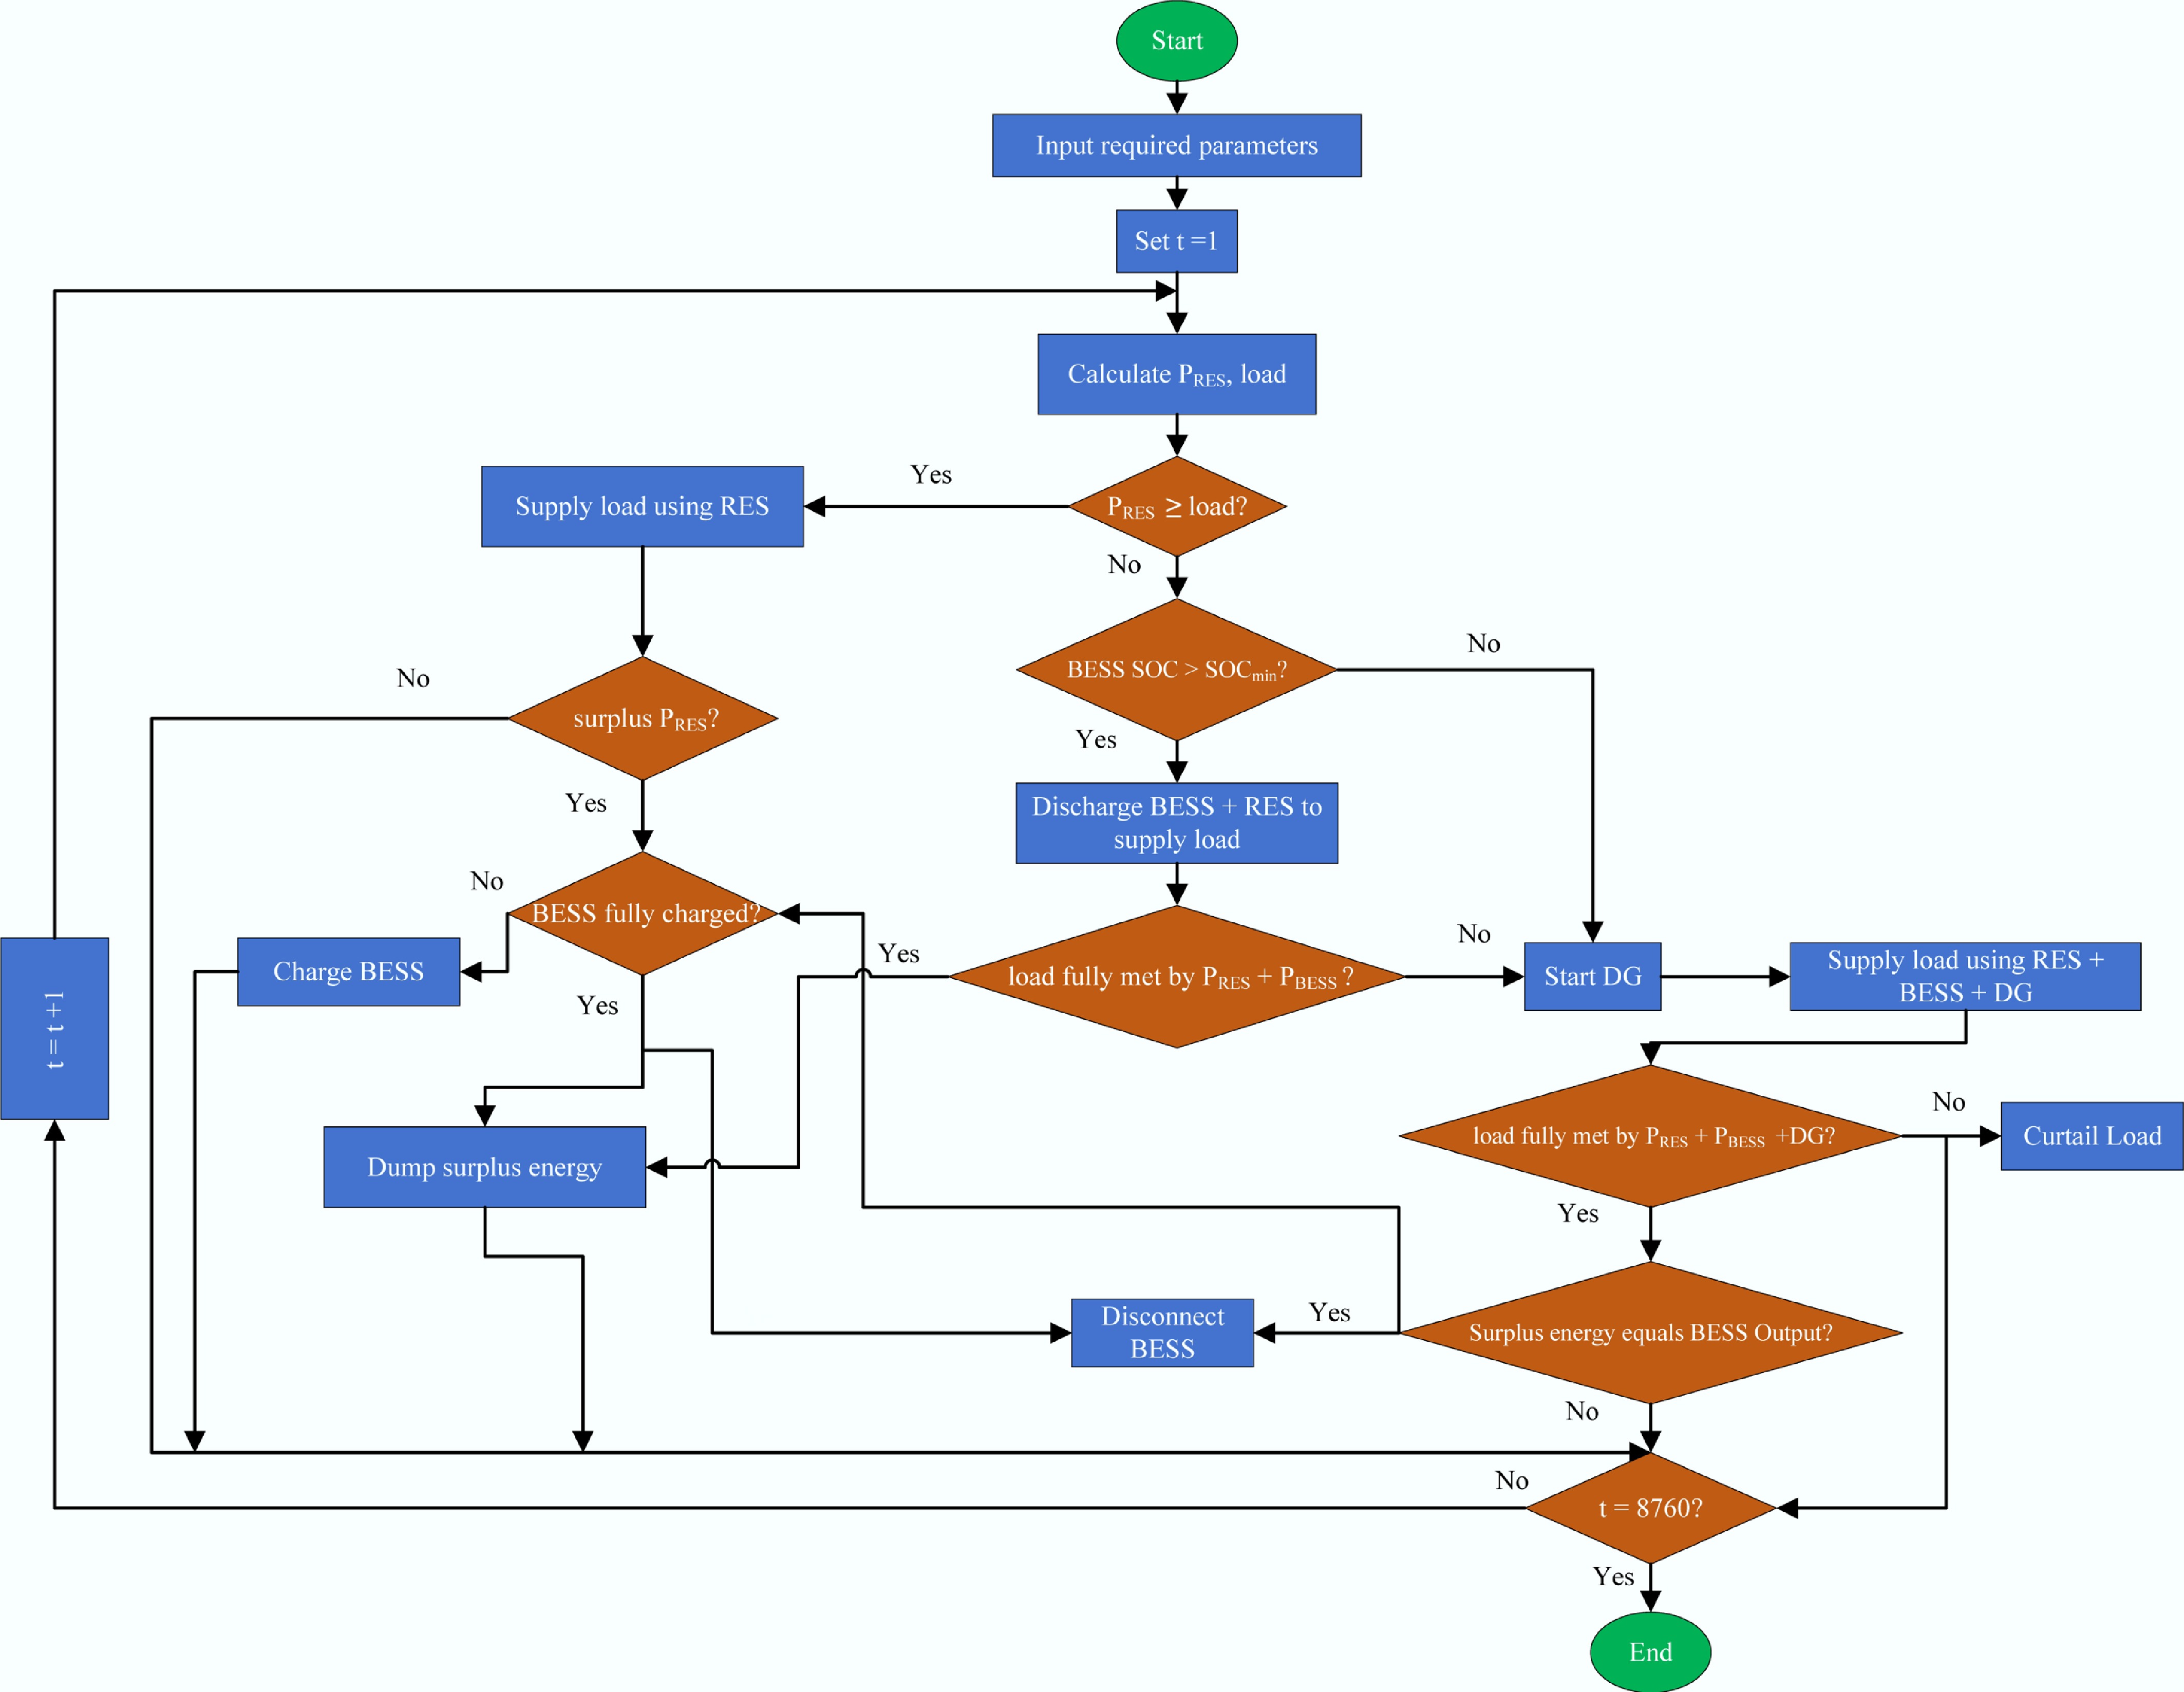
Figure 3.
Flowchart of the proposed energy management strategy.
-
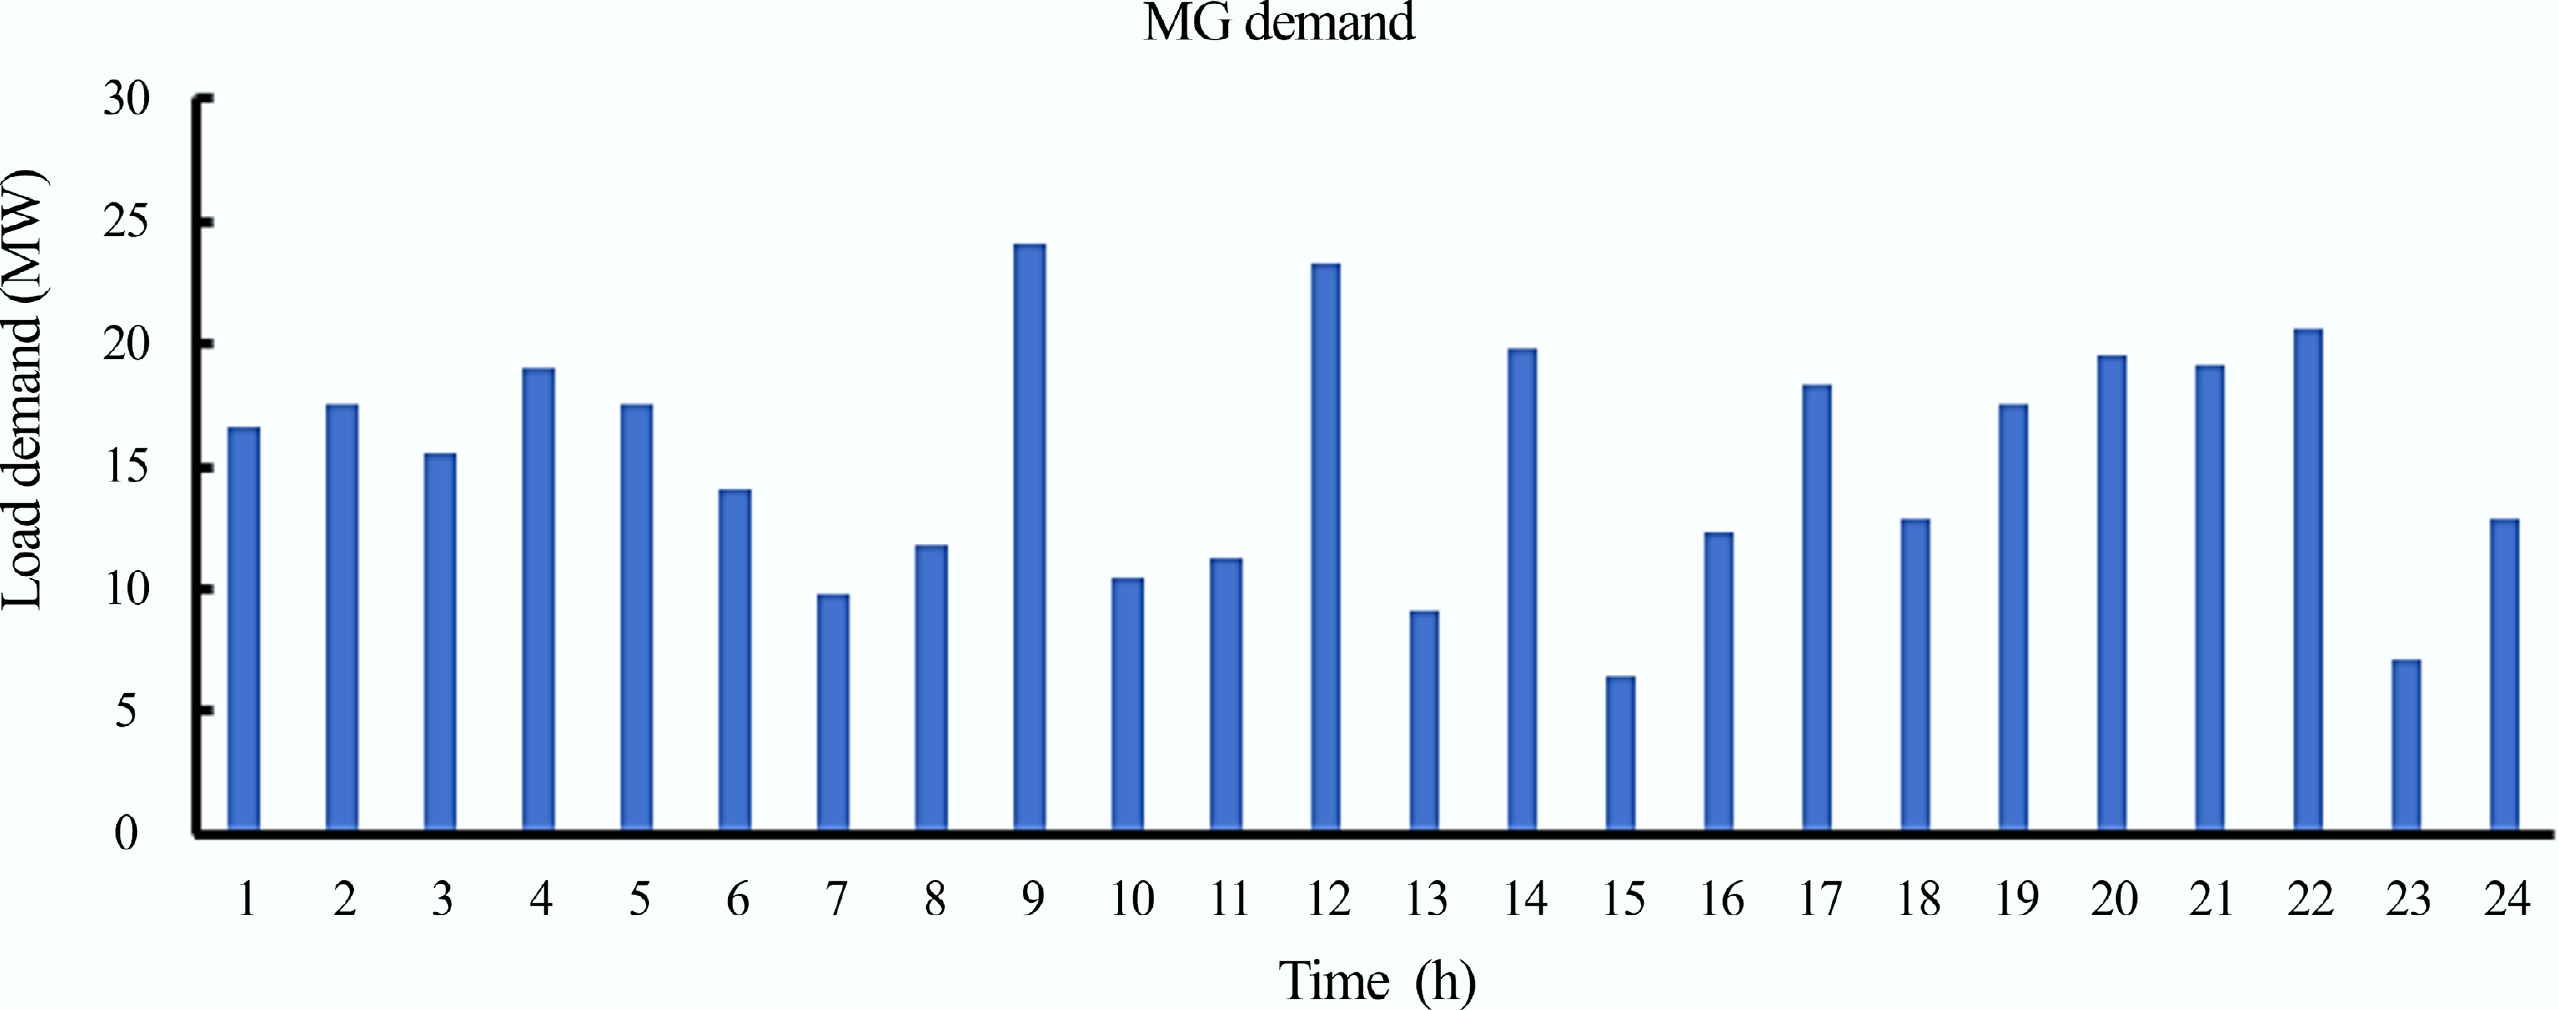
Figure 4.
Hourly load demand (MW) over a 24 h period.
-
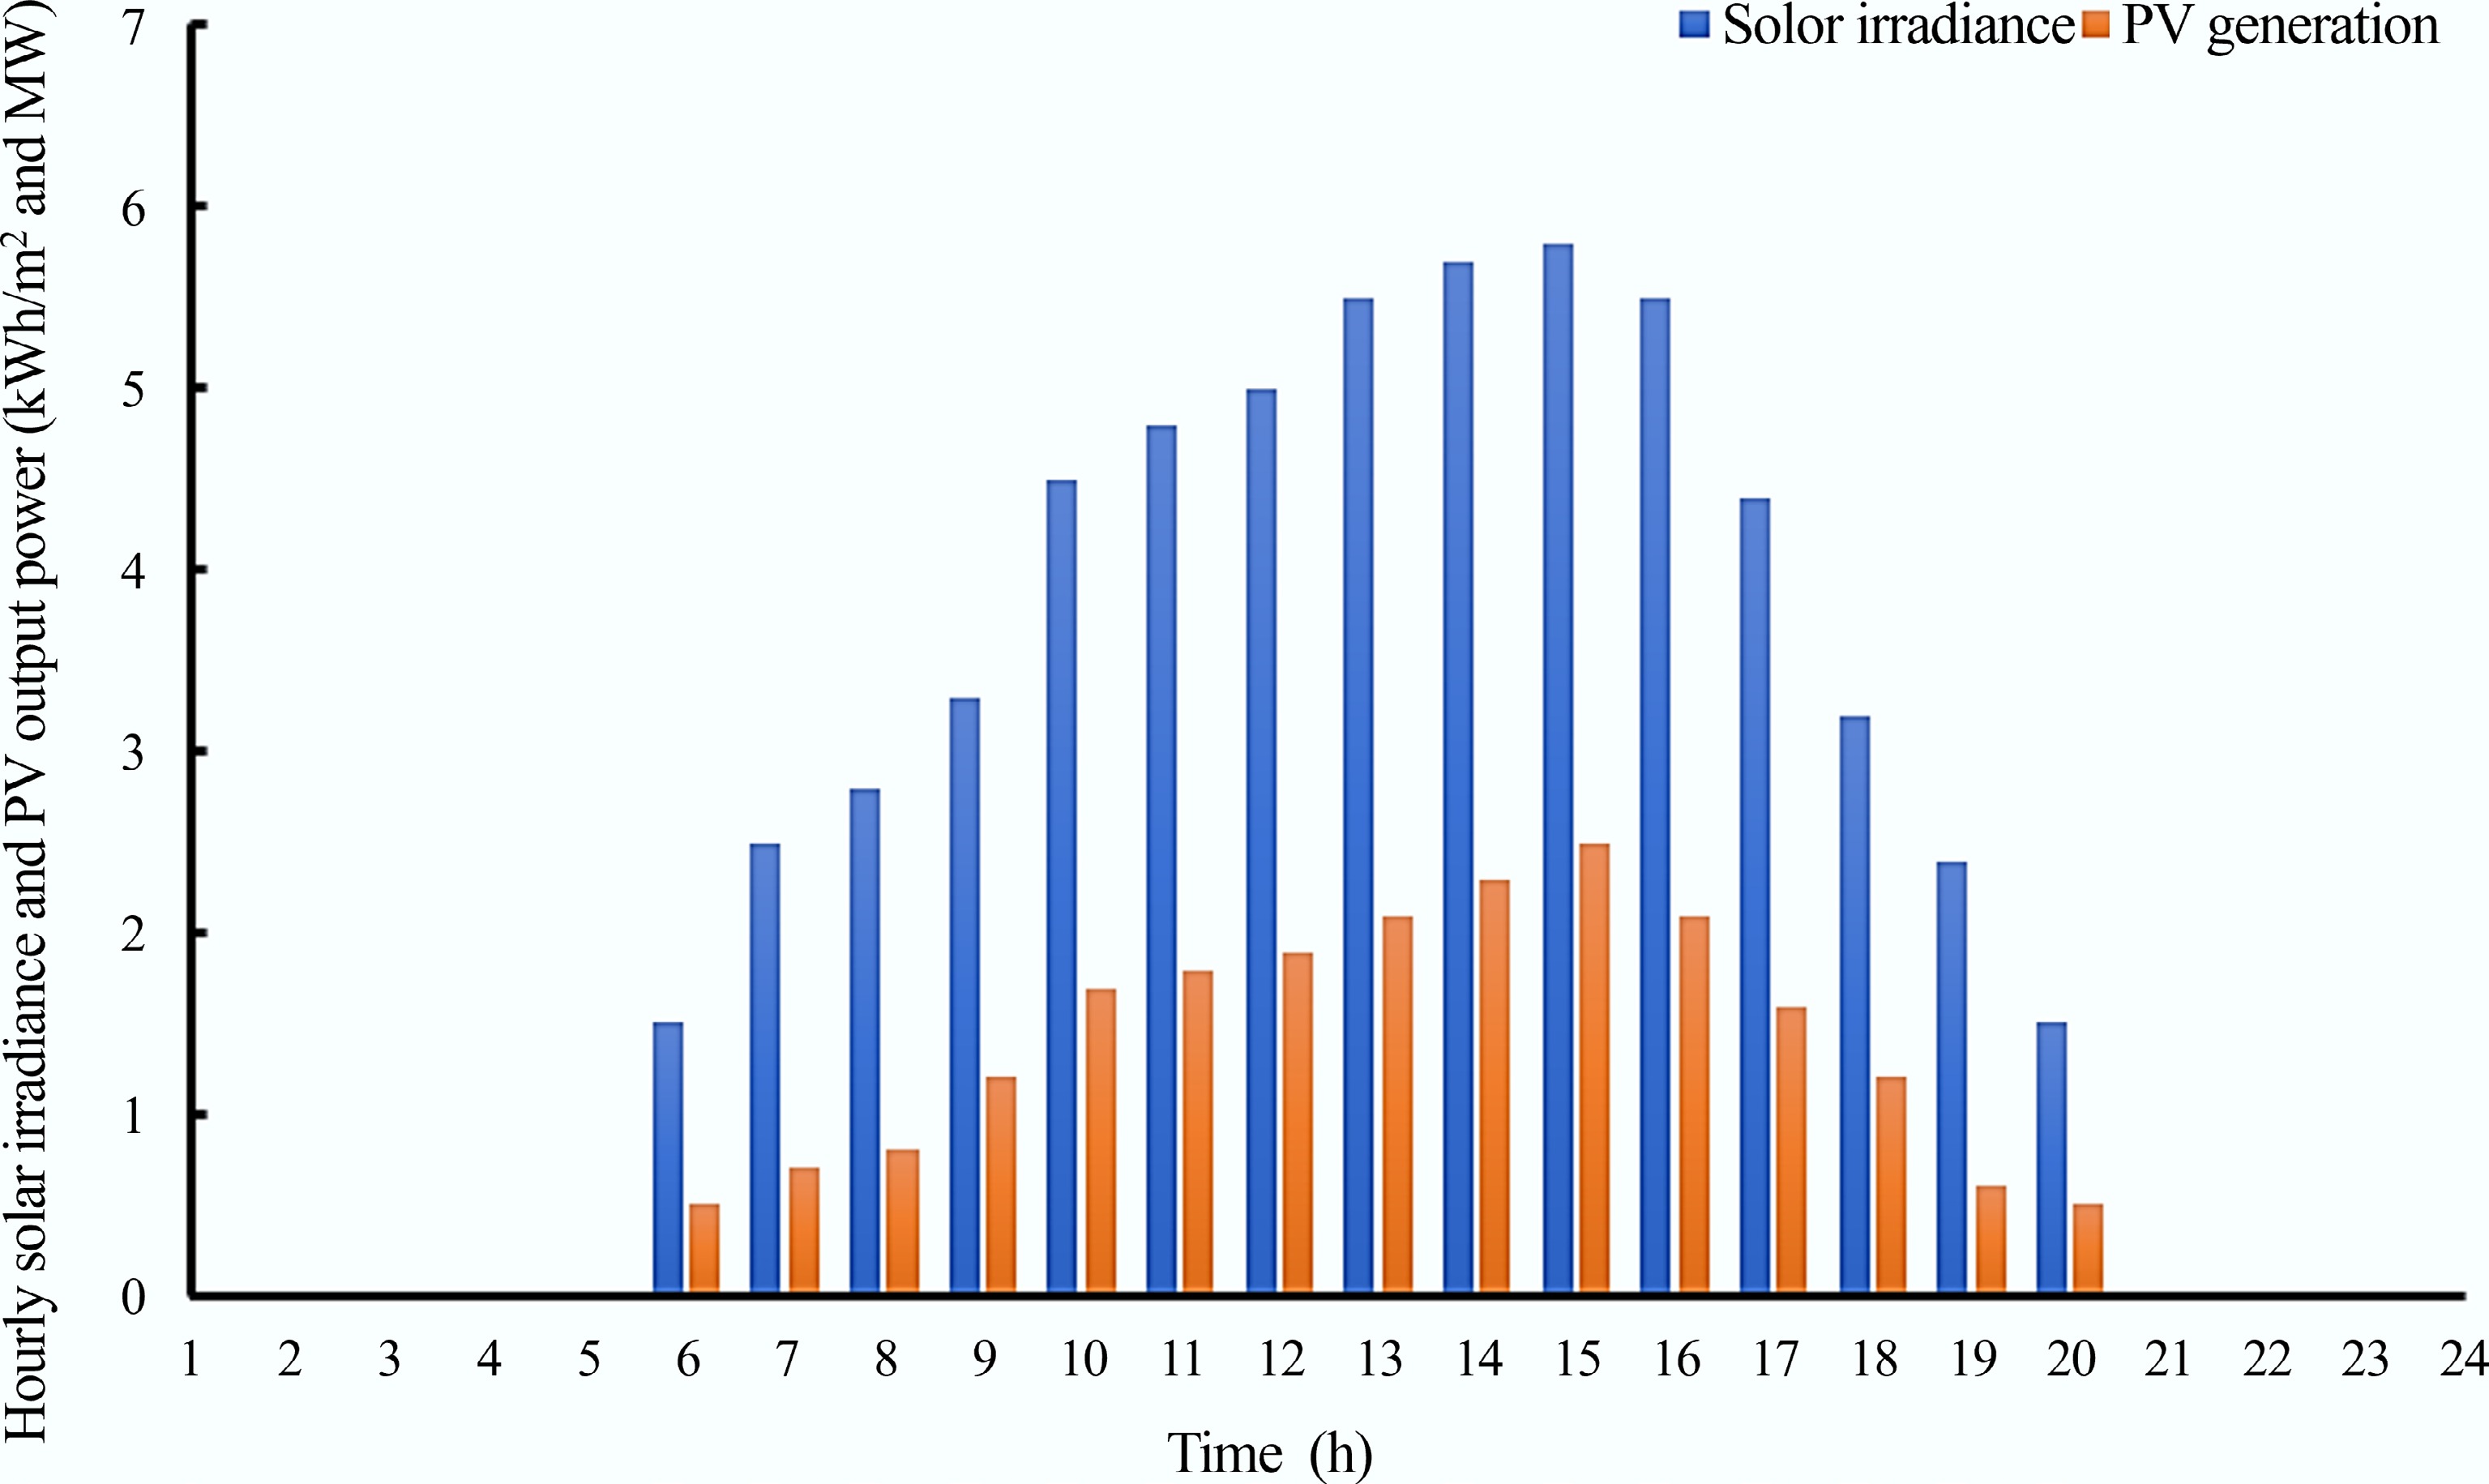
Figure 5.
Hourly solar irradiance (kWh/m2), and PV power generation (MW) over a 24 h period.
-
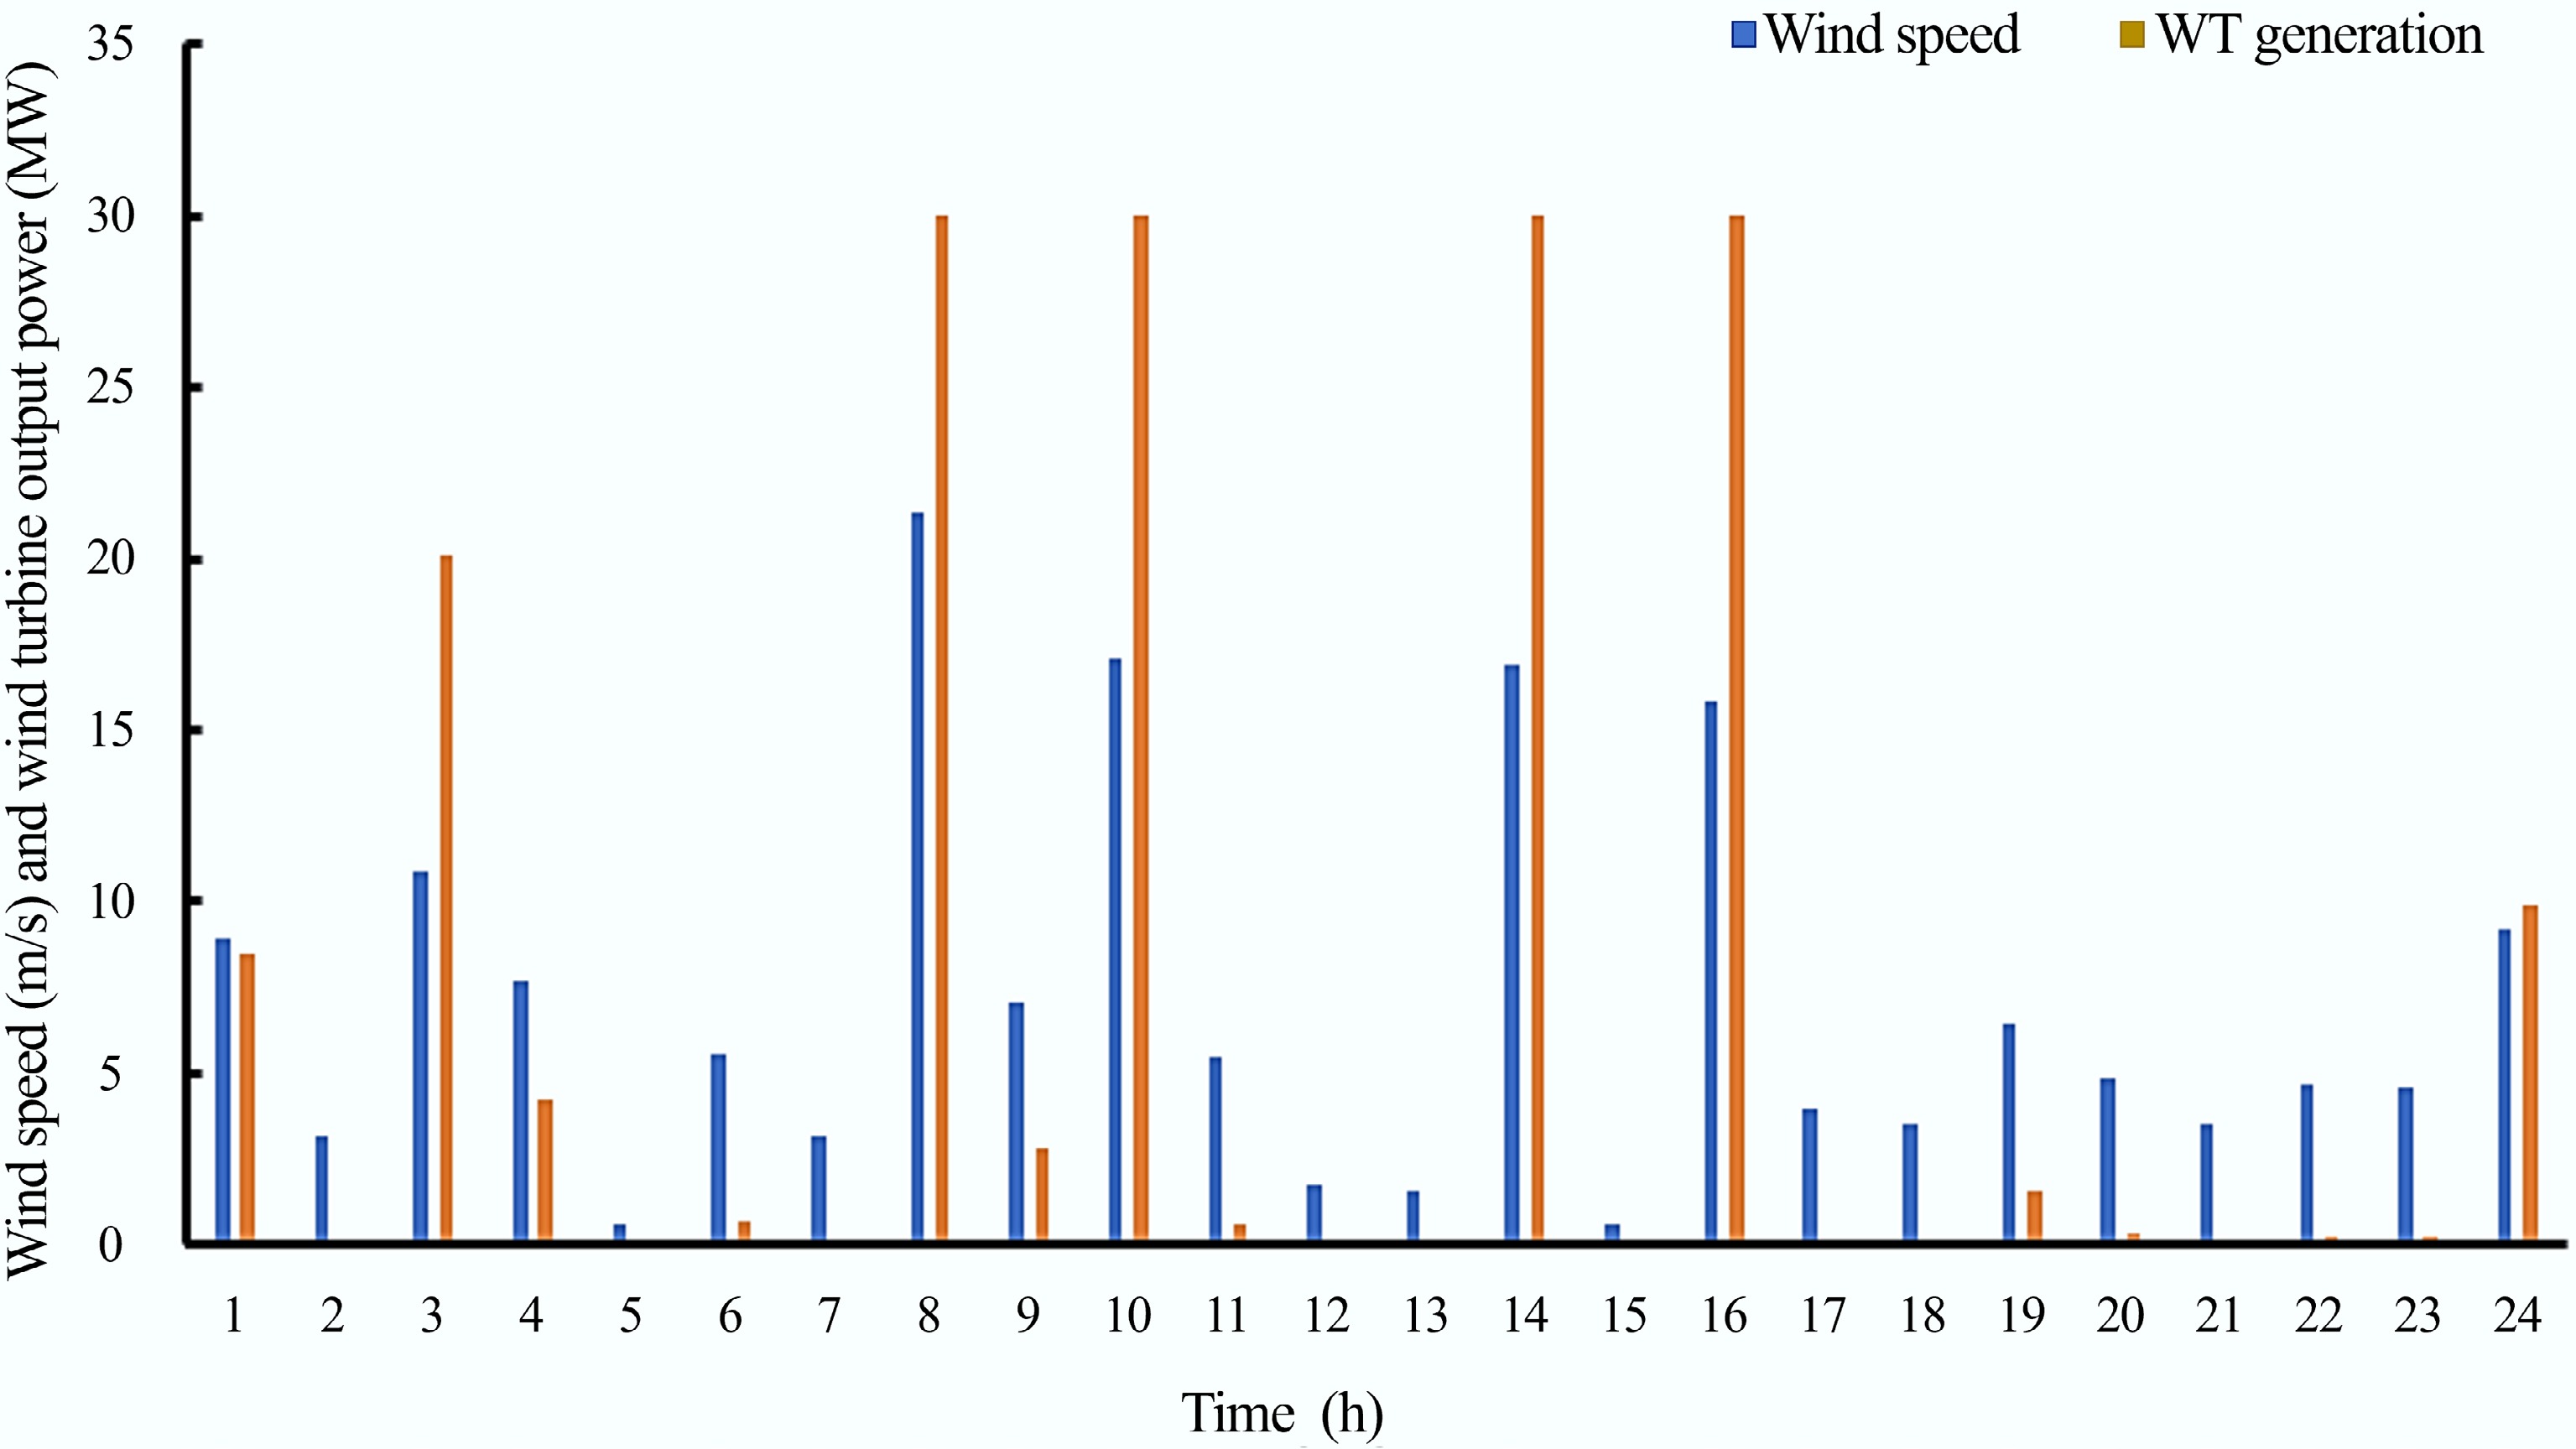
Figure 6.
Wind speed (m/s), and the wind turbine power generation (MW) over a 24 h period.
-
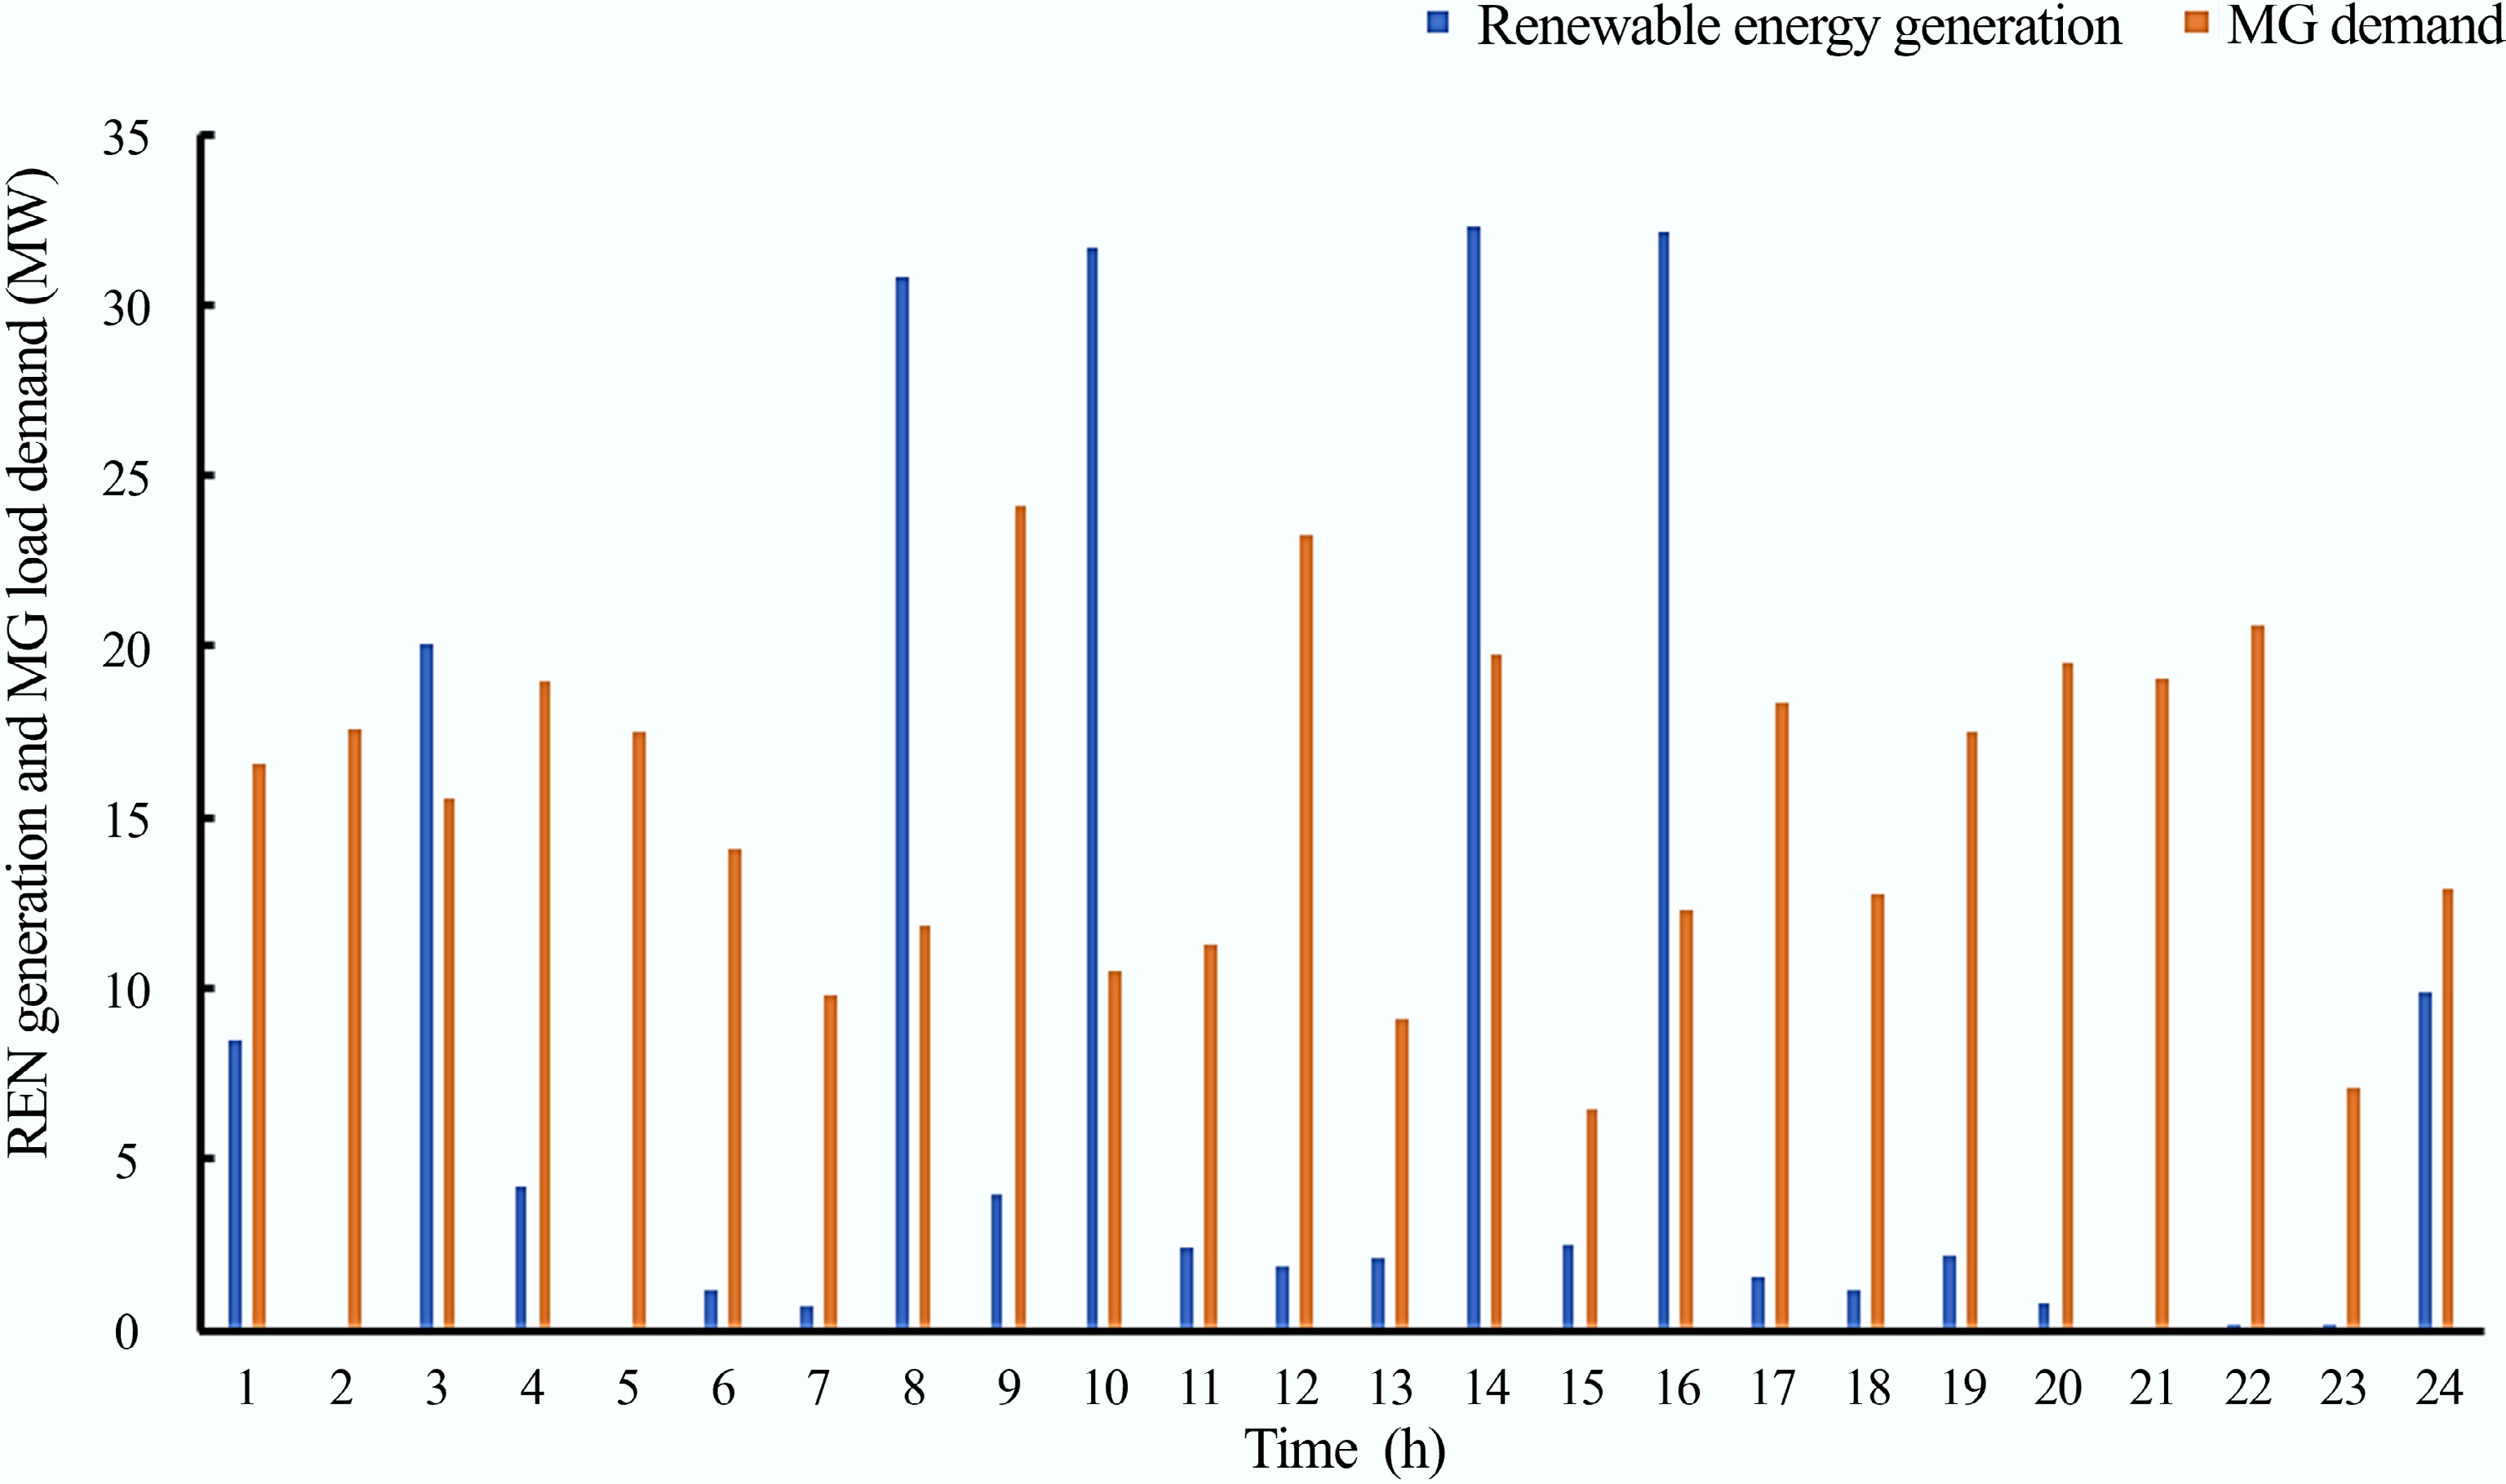
Figure 7.
Renewable energy generation against MG load demand over a 24 h period.
-
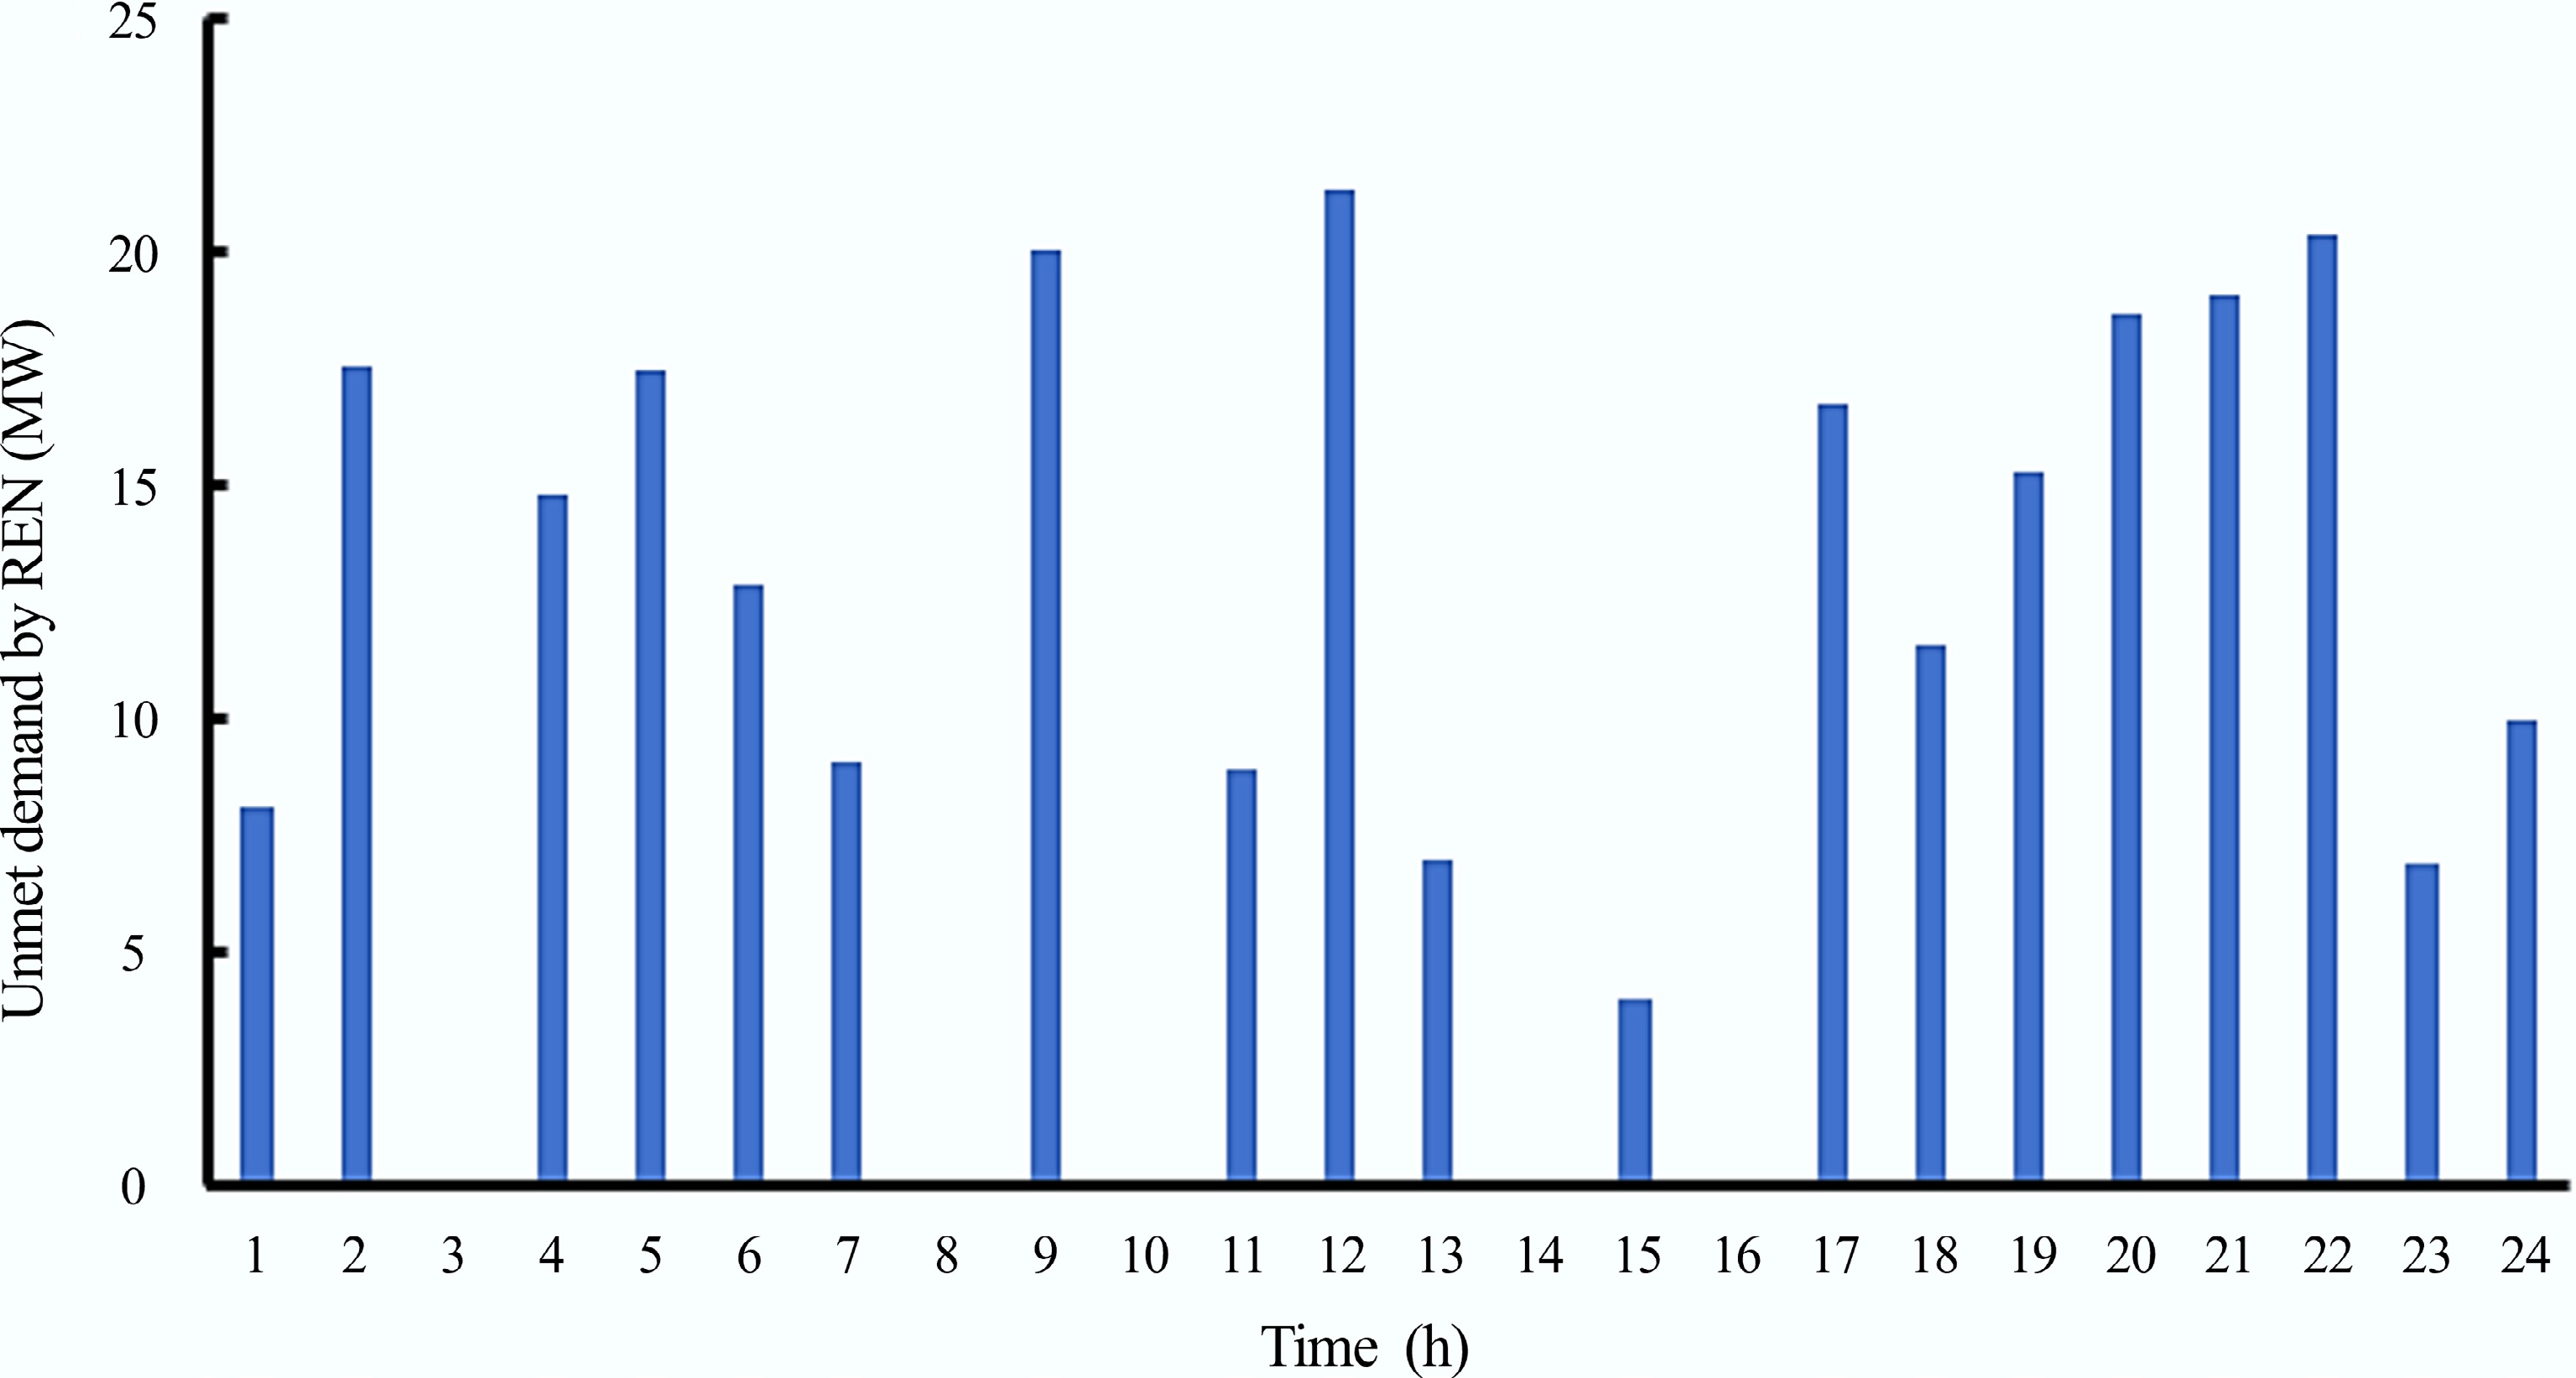
Figure 8.
MG unmet demand by RES over a 24 h period.
-
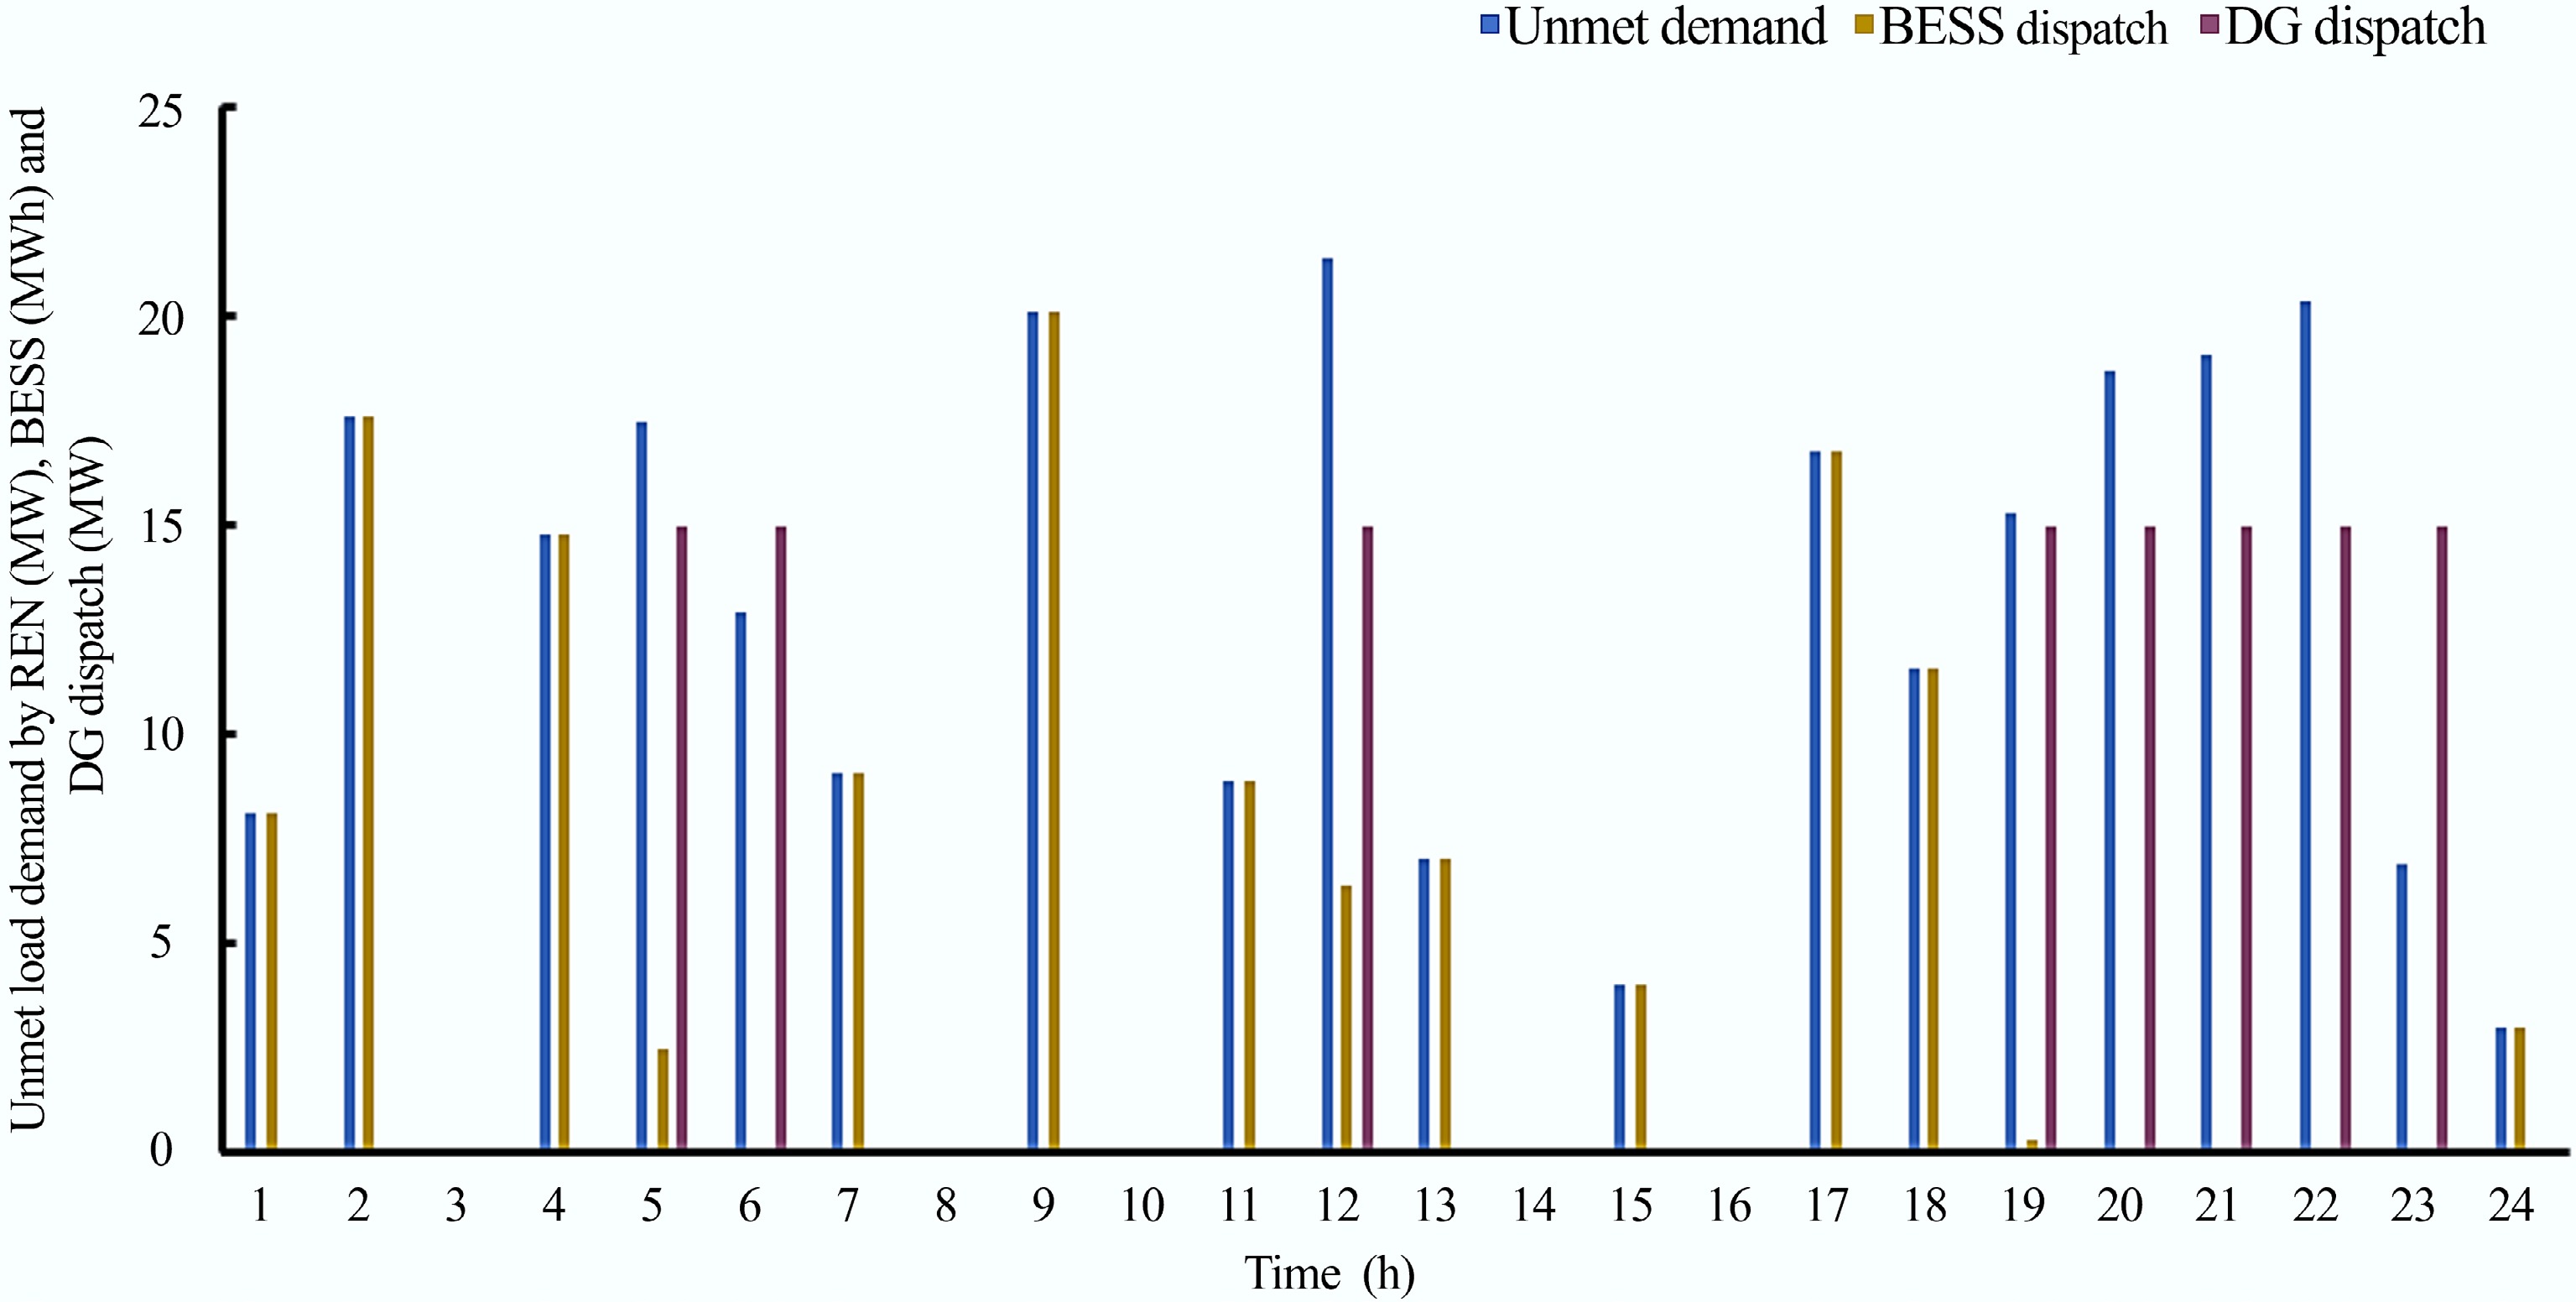
Figure 9.
Unmet demand by Ren Generation (MW), BESS (MWh), and DG Dispatch (MW) over a 24 h period.
-
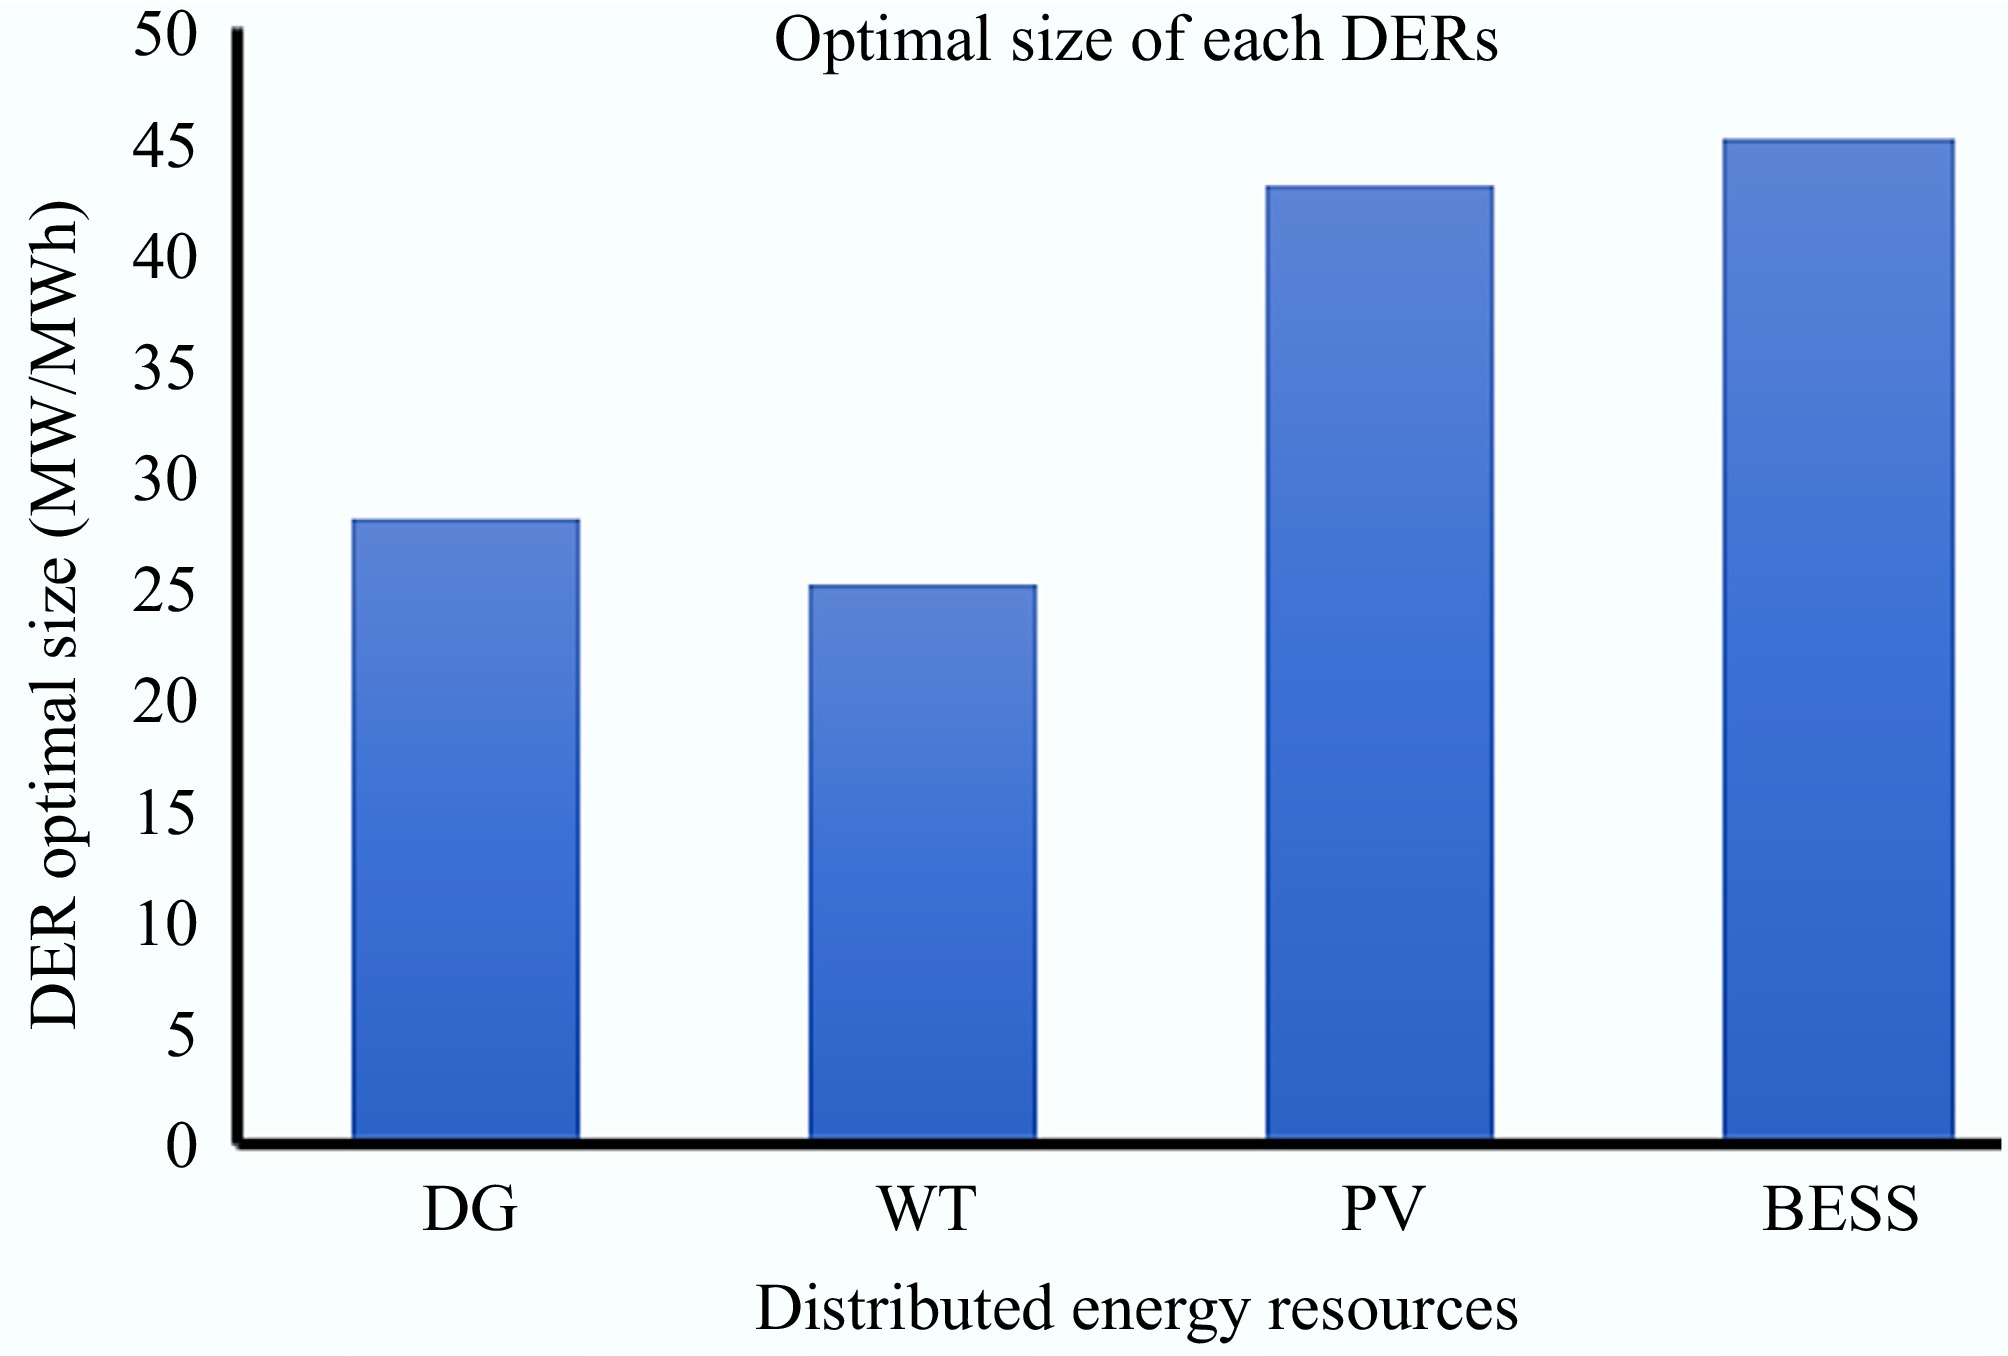
Figure 10.
Optimal size of each DER for the optimum configuration.
-
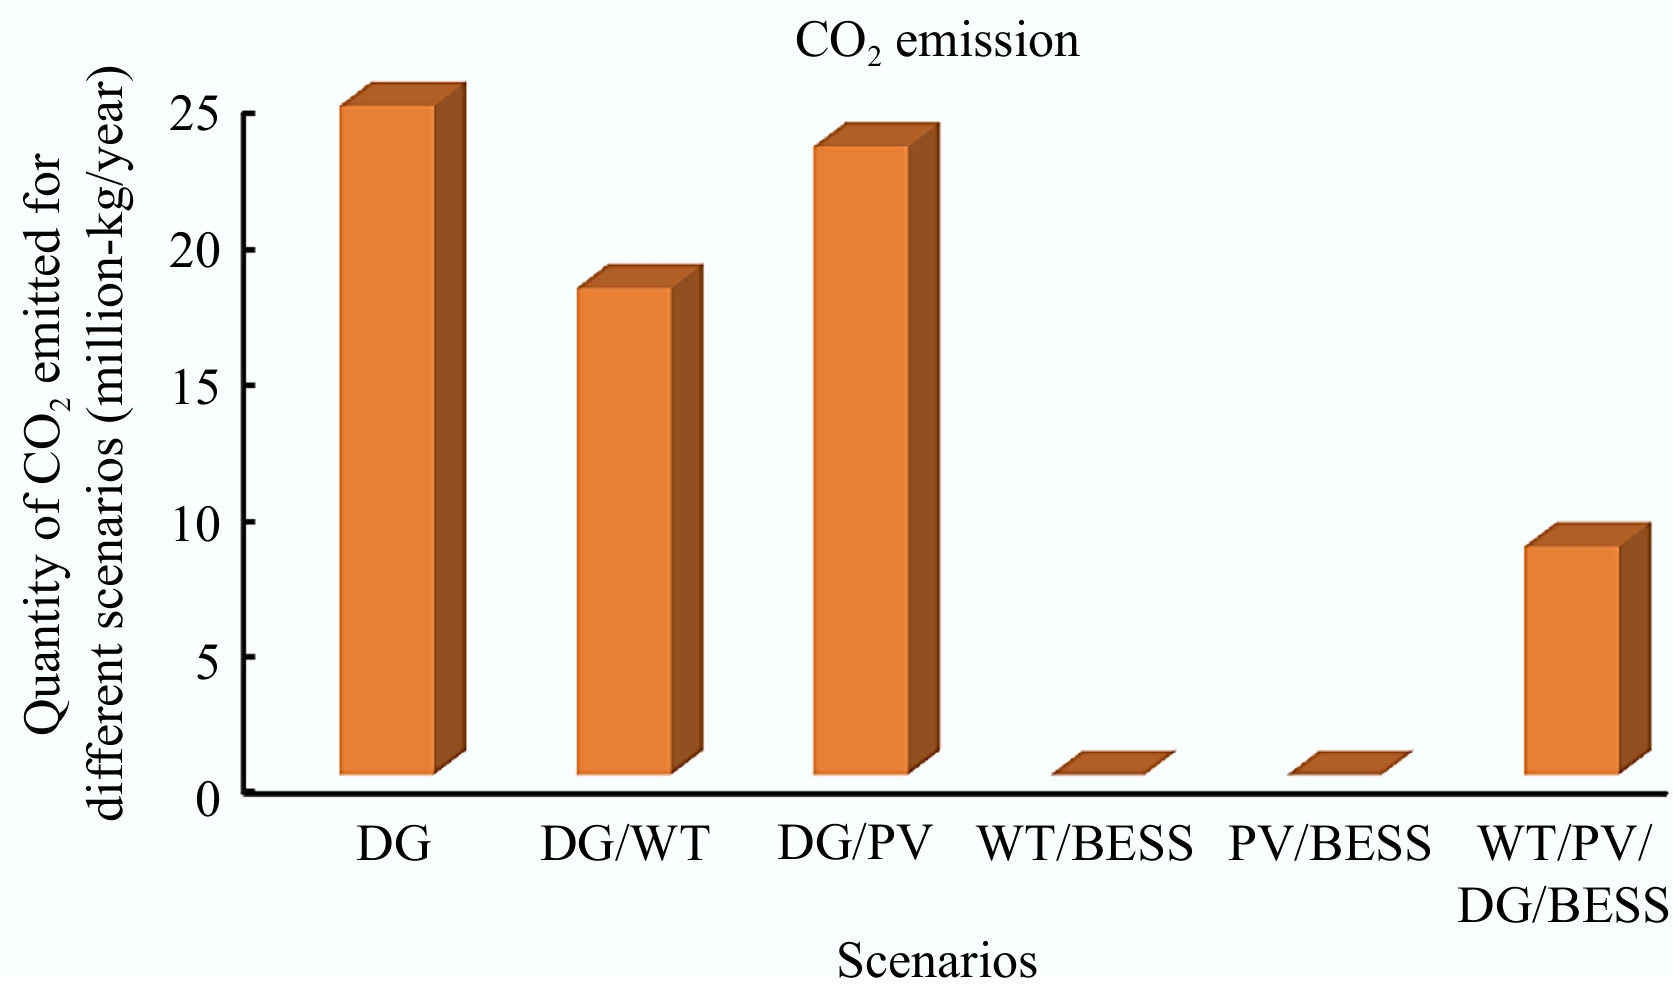
Figure 11.
Quantity of CO2 emitted by the different scenarios.
-
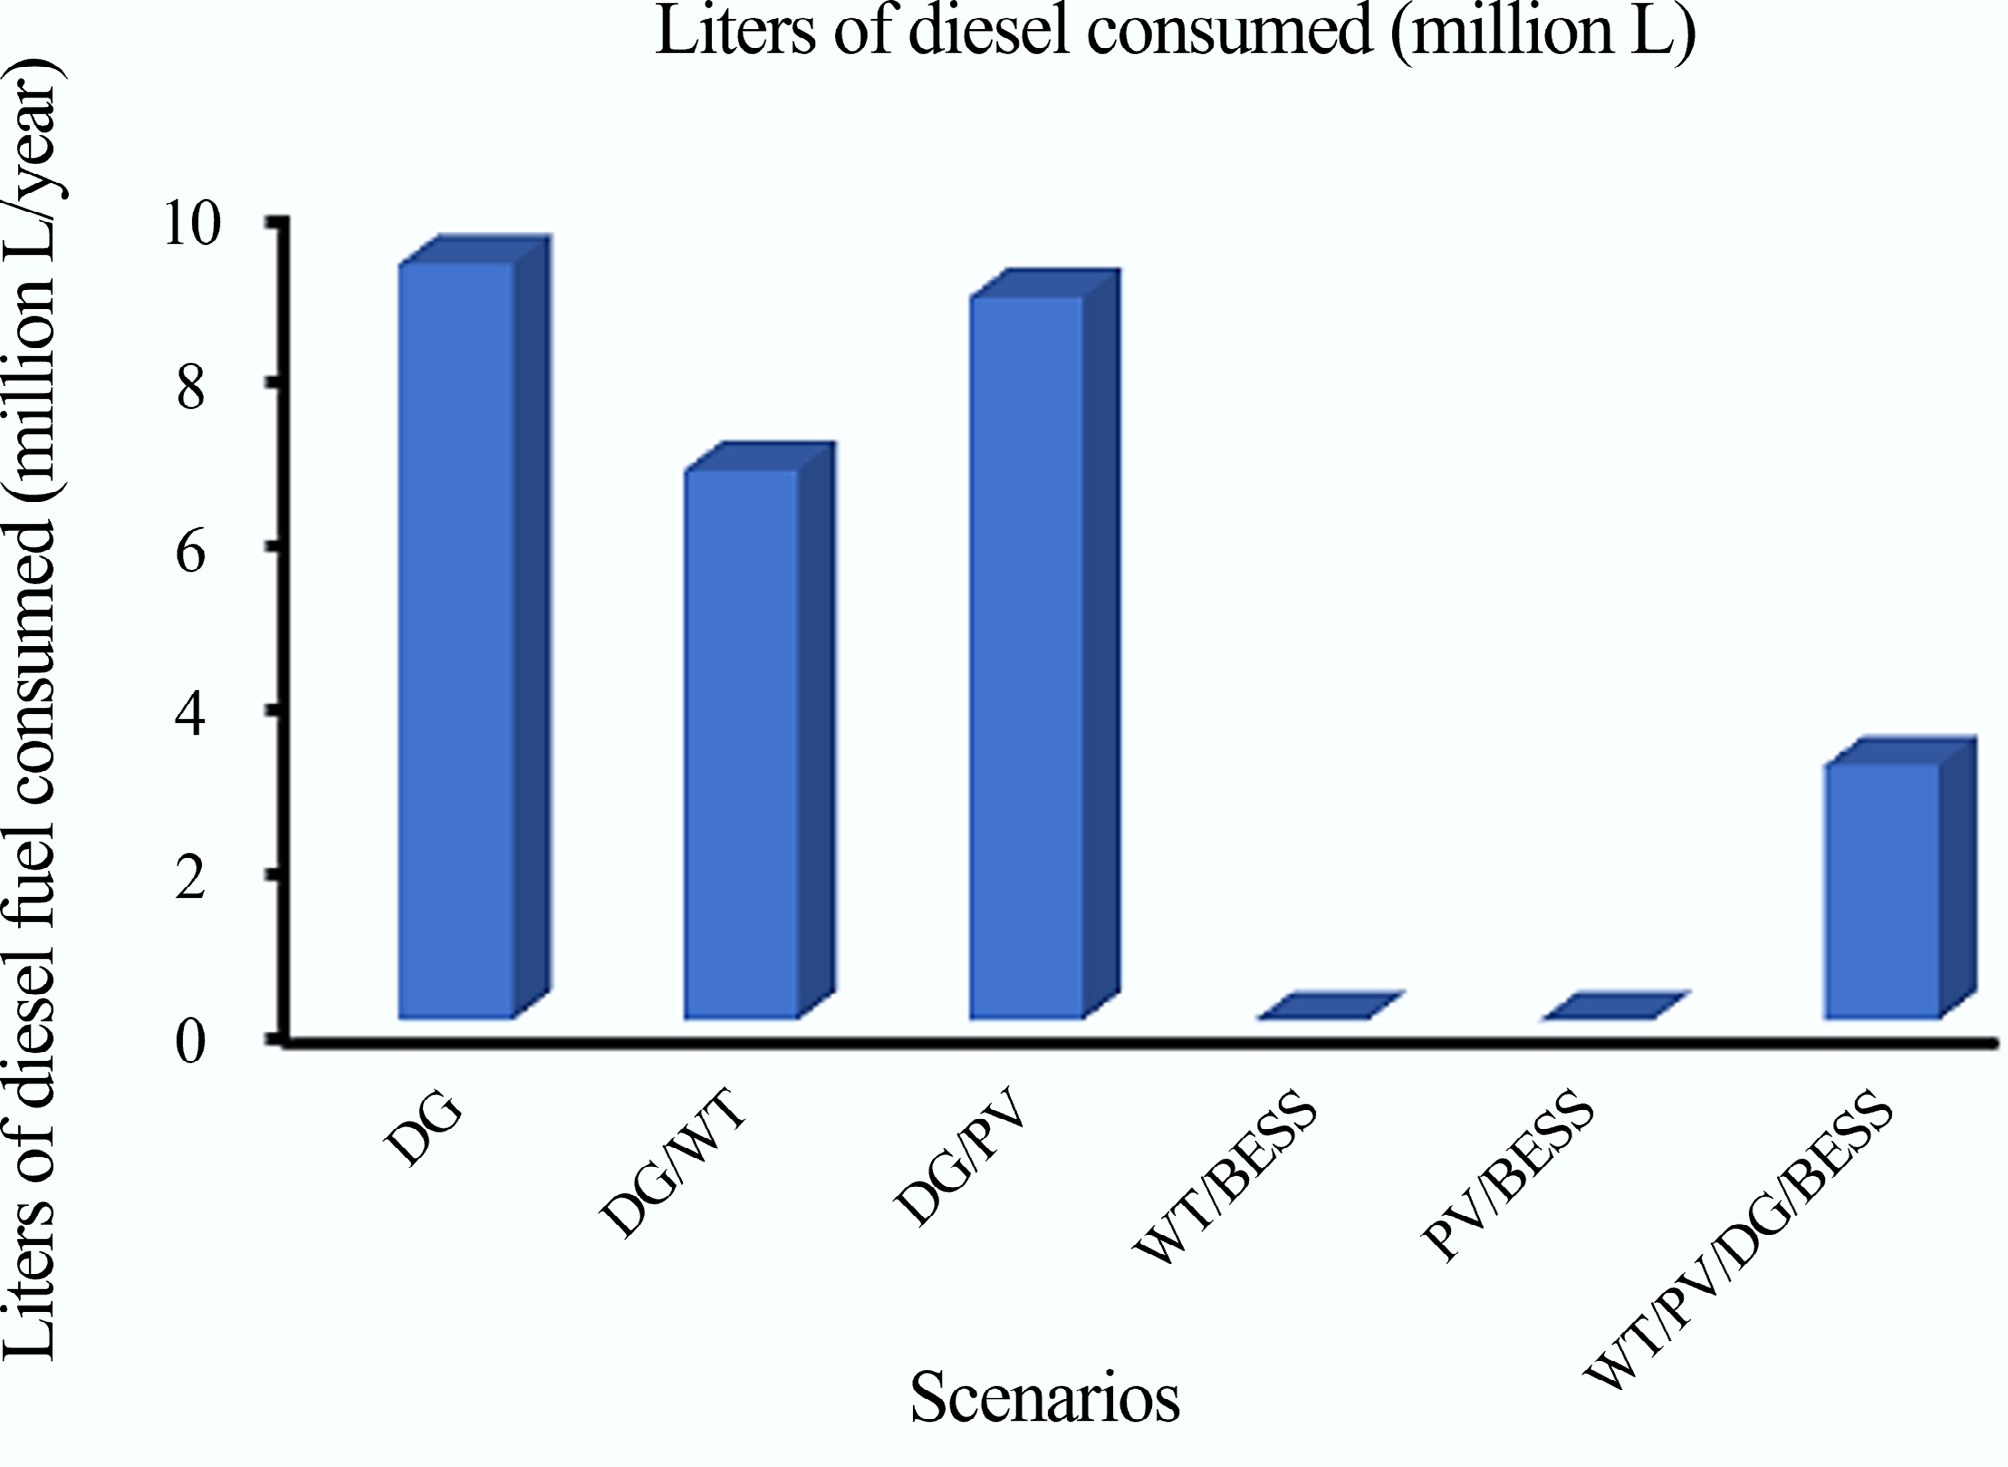
Figure 12.
Fuel consumption under different scenarios.
-
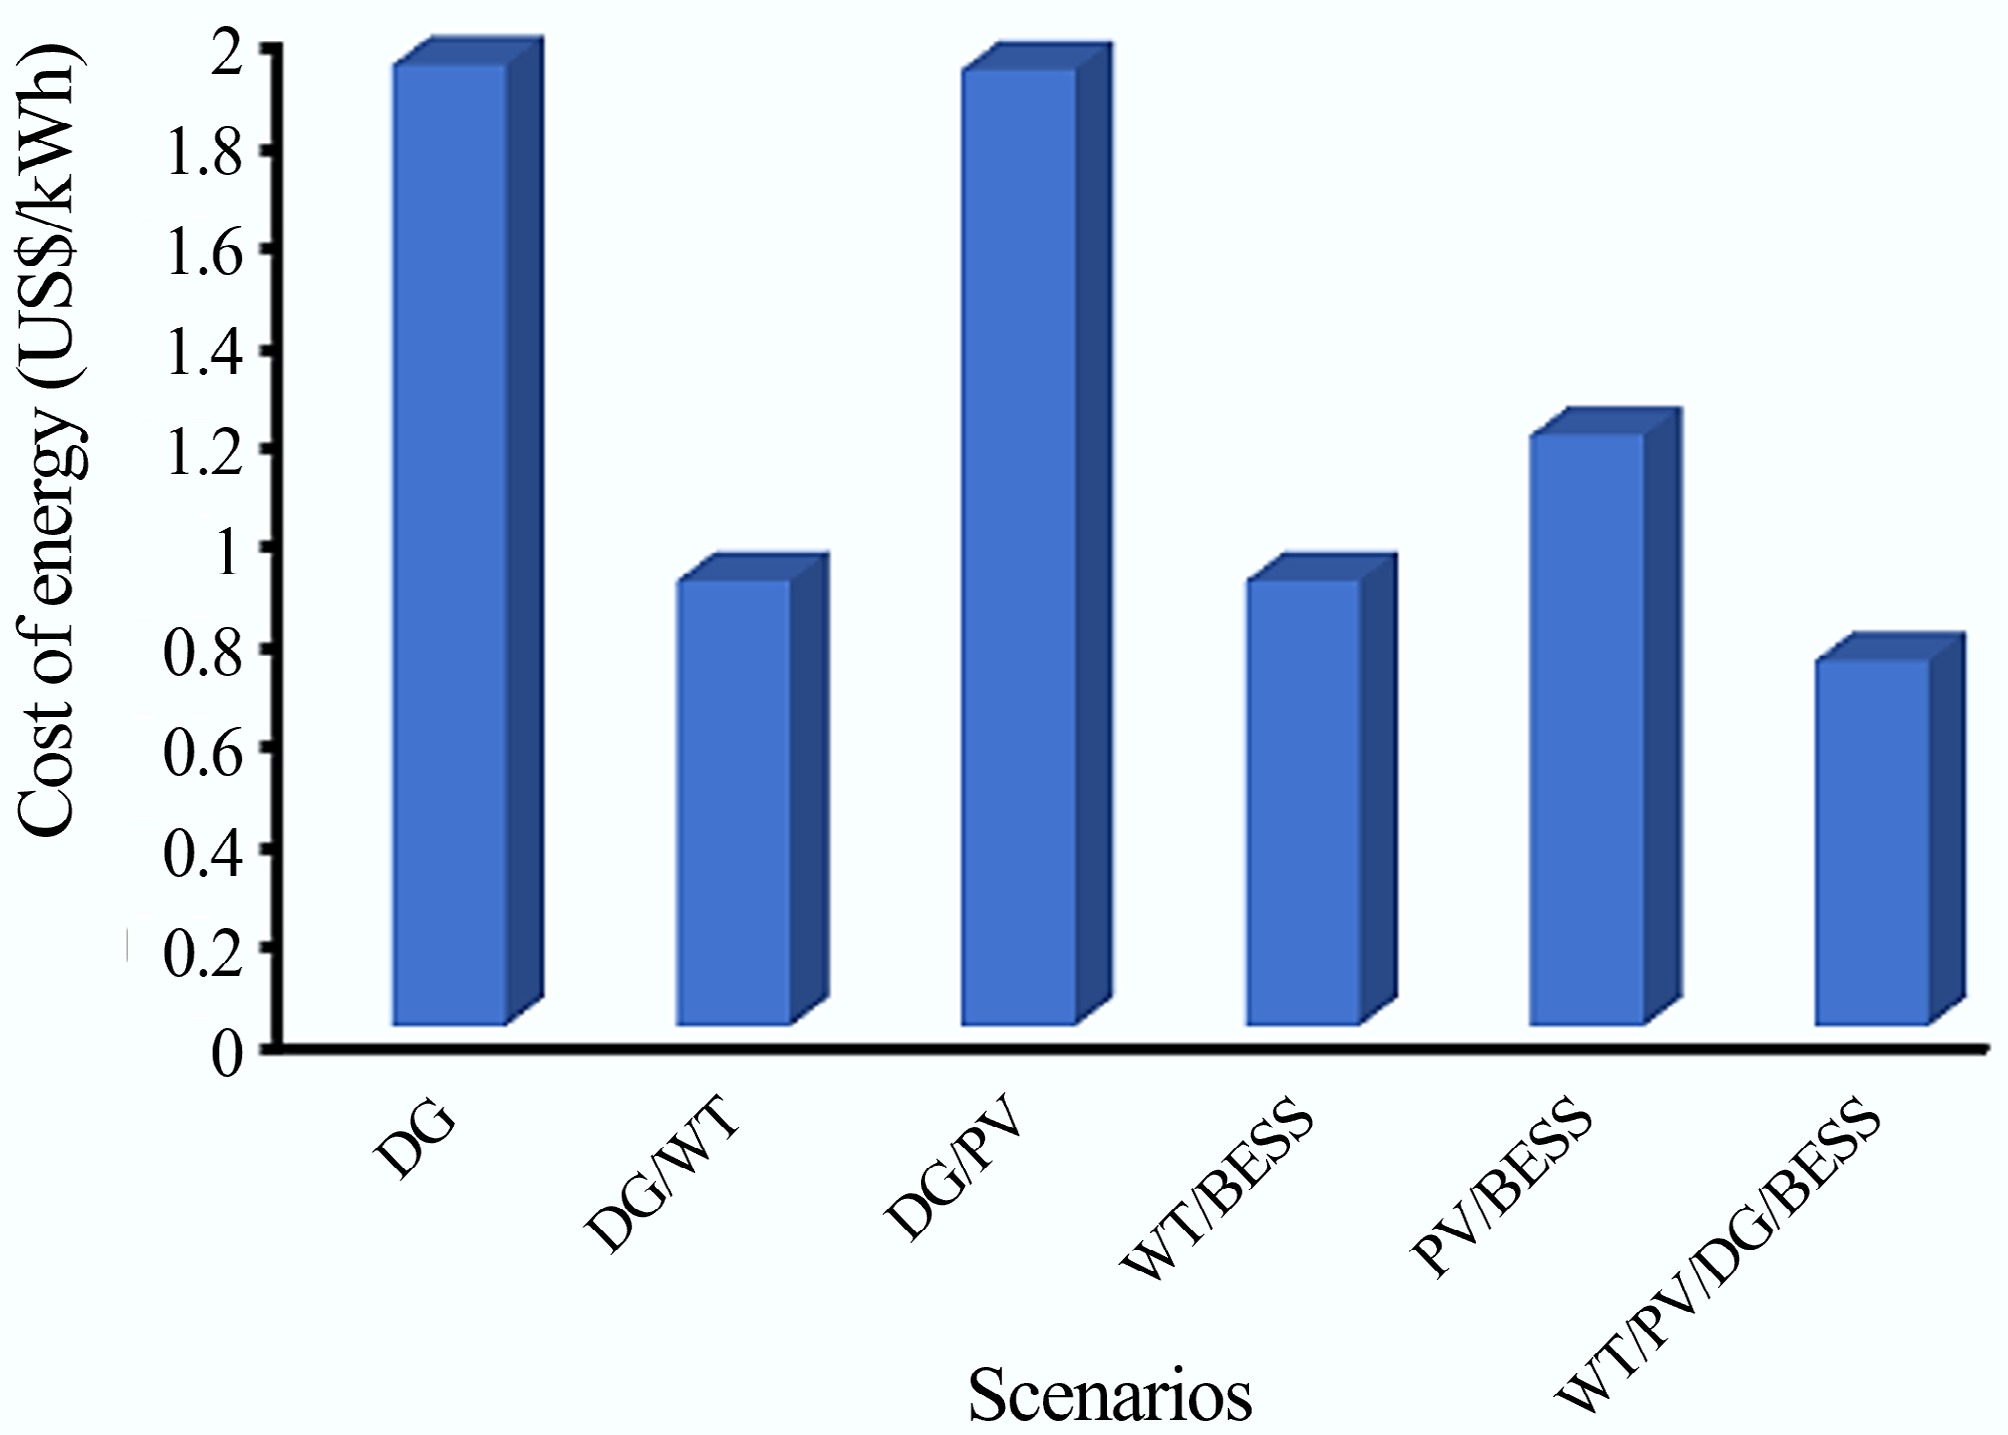
Figure 13.
Cost of energy for the different scenarios.
-
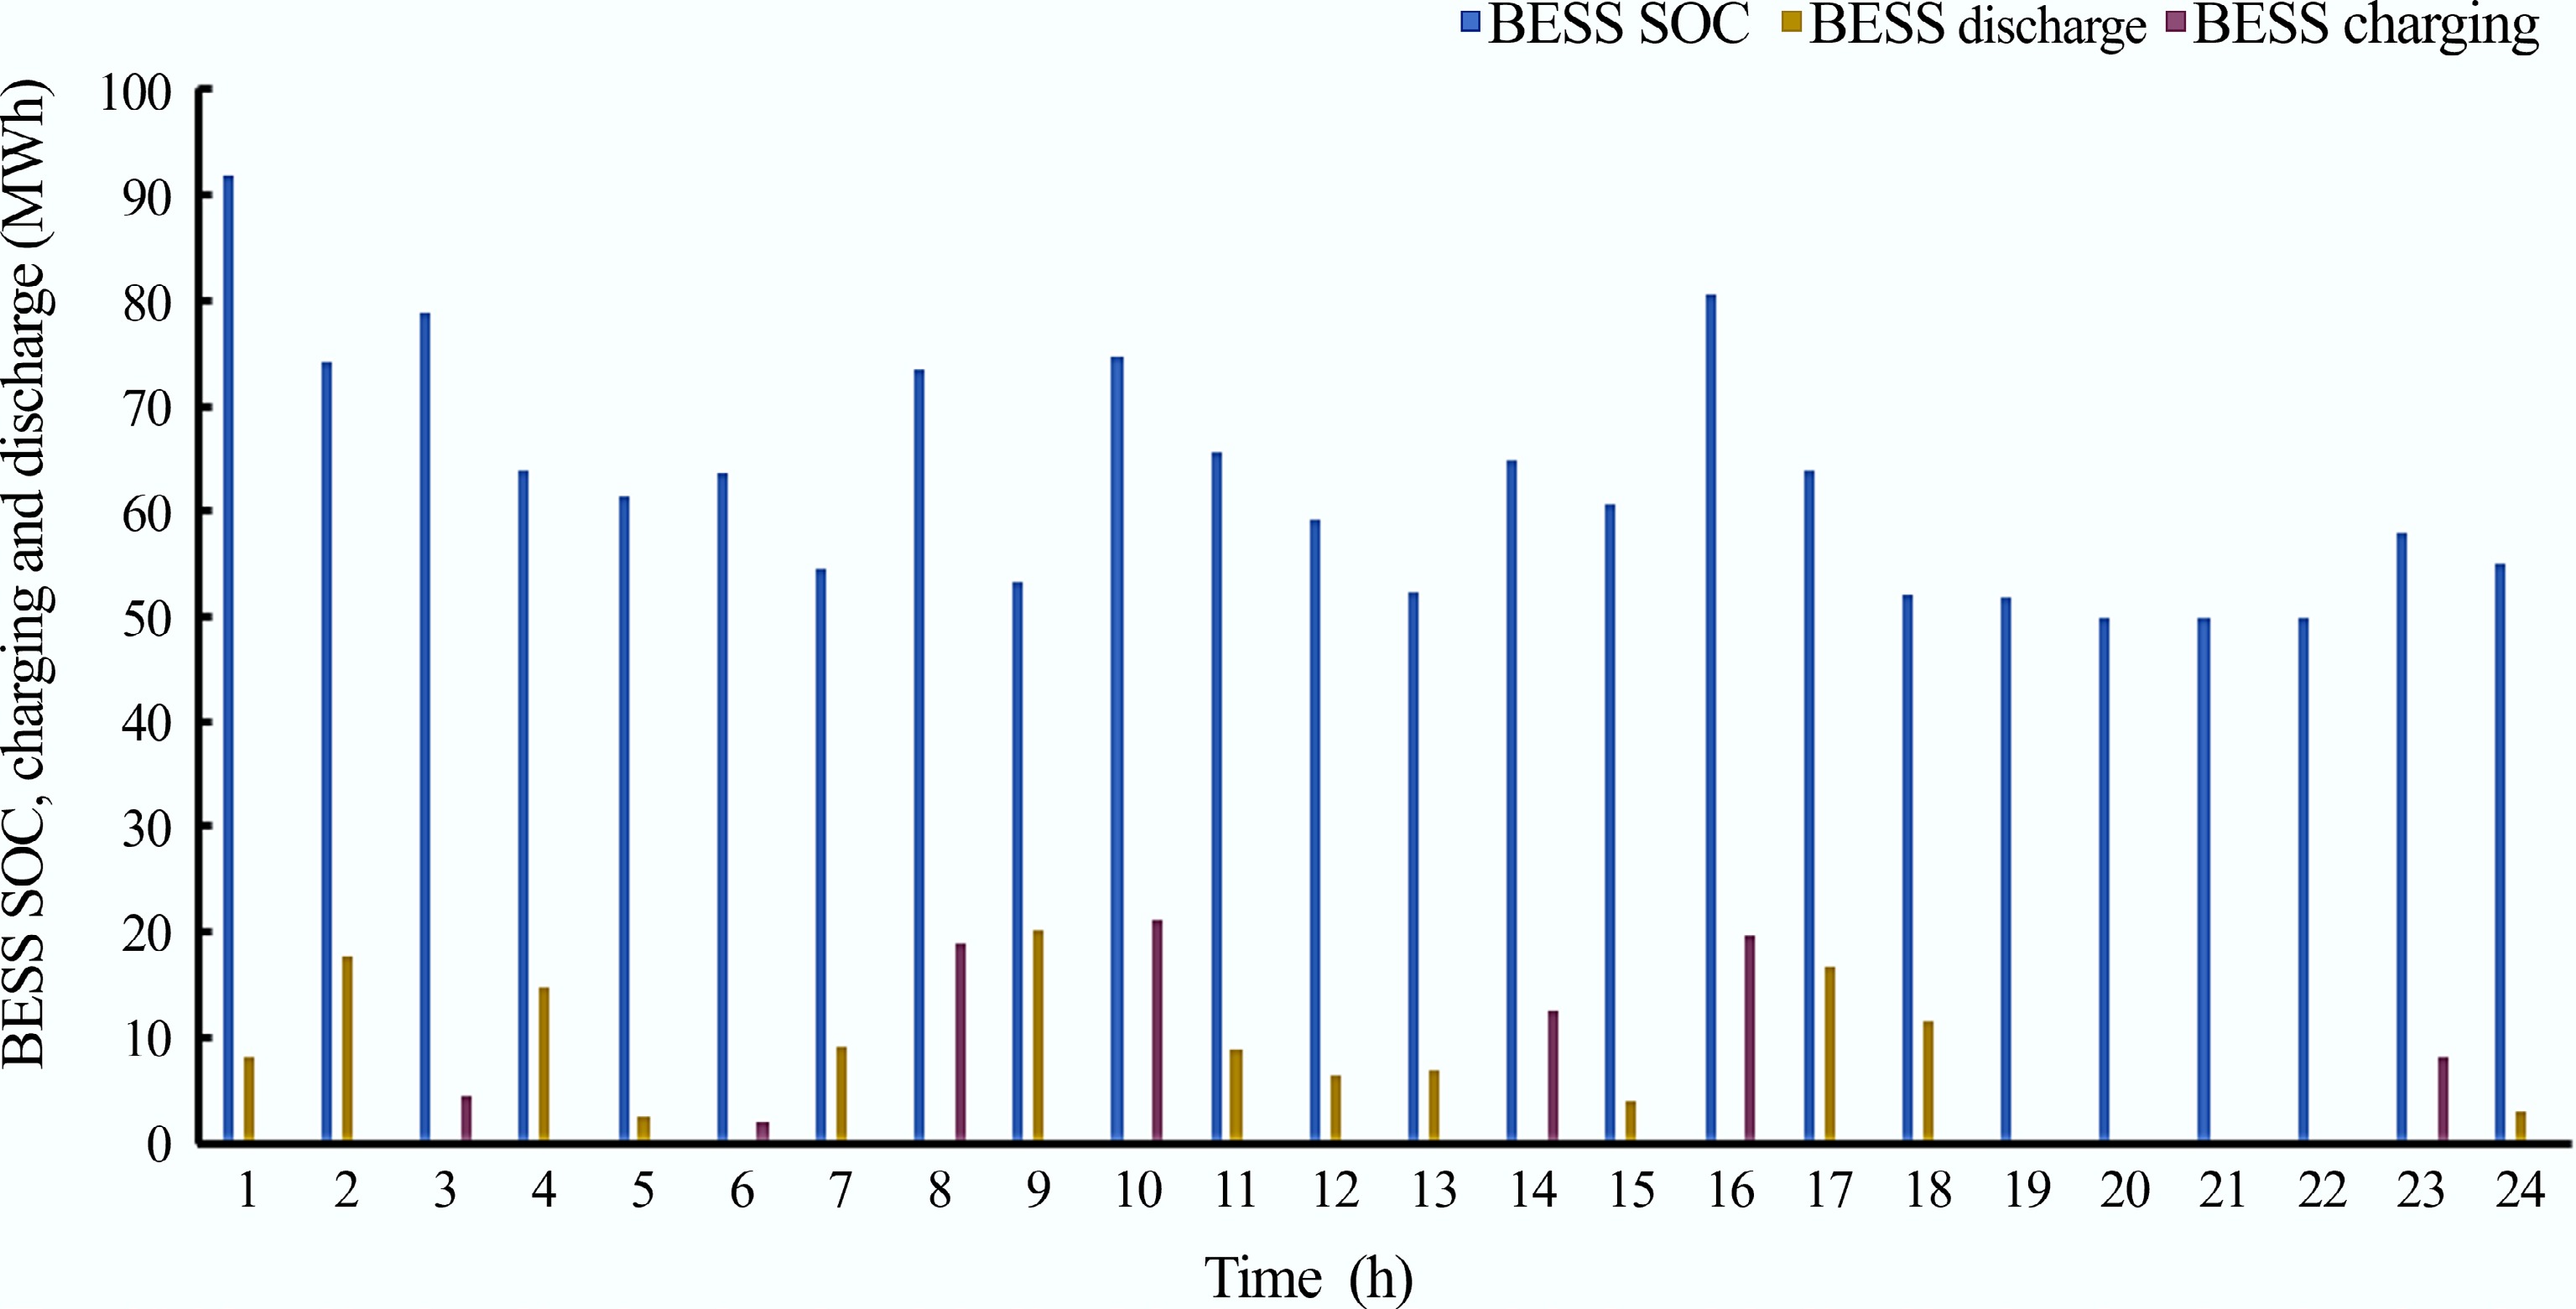
Figure 14.
BESS SoC, charging and discharging (MWh) characteristics.
-
Parameter Value Swarm size 50 Number of iterations 1,000 Inertia weight (w) 0.5 Personal learning factor (c1) 1.5 Social learning factor (c2) 2.0 Velocity limit 15% Table 1.
Parameters of PSO
-
Type of DER unit Capital cost
(US$\boldsymbol{\$} $ O&M cost
(US${\boldsymbol\$} $ Replacement cost
(US${\boldsymbol\$} $ PV 1,200 70 1,200 WT 8,200 100 5,400 BESS 1,500 15 1,500 DG 3,000 0.04 (US ${\$} $ 3,000 Table 2.
System economics in terms of component cost[13]
-
Parameter HOMER PSO Project lifespan (years) 25 25 Discount rate (%) 8 8 DG lifespan (years) 15 15 WT lifespan (years) 20 20 BESS lifespan (years) 10 10 Table 3.
Project and economic parameters
-
Scenarios Fuel
(million L)Emission
(million kg/yr)COE
(US${\boldsymbol\$} $ NPC (US ${\boldsymbol\$} $ DG 9.2 24.6 1.92 123,048,558.97 DG/WT 6.7 17.9 1.08 98,042,498.96 DG/PV 8.8 22.1 1.74 116,729,972.92 WT/BESS 0 0 0.99 110,167,373.27 PV/BESS 0 0 1.09 104,354,936,54 PV/WT/DG/BESS 2.1 8.4 0.73 85,542,372.16 Table 4.
Simulation results of the different scenarios
-
Metric PSO HOMER Optimal system PV/WT/DG/BESS PV/WT/DG/BESS NPC US ${\$} $ US ${\$} $ COE 0.73 0.87 CO2 emission (million kg/yr) 8.4 10.2 Liters of diesel fuel consumed (million L/yr) 2.1 4.2 Computation time Moderately high, depending on iterations Moderately low Table 5.
A comparison of the proposed PSO-based methodology against HOMER
Figures
(14)
Tables
(5)