-
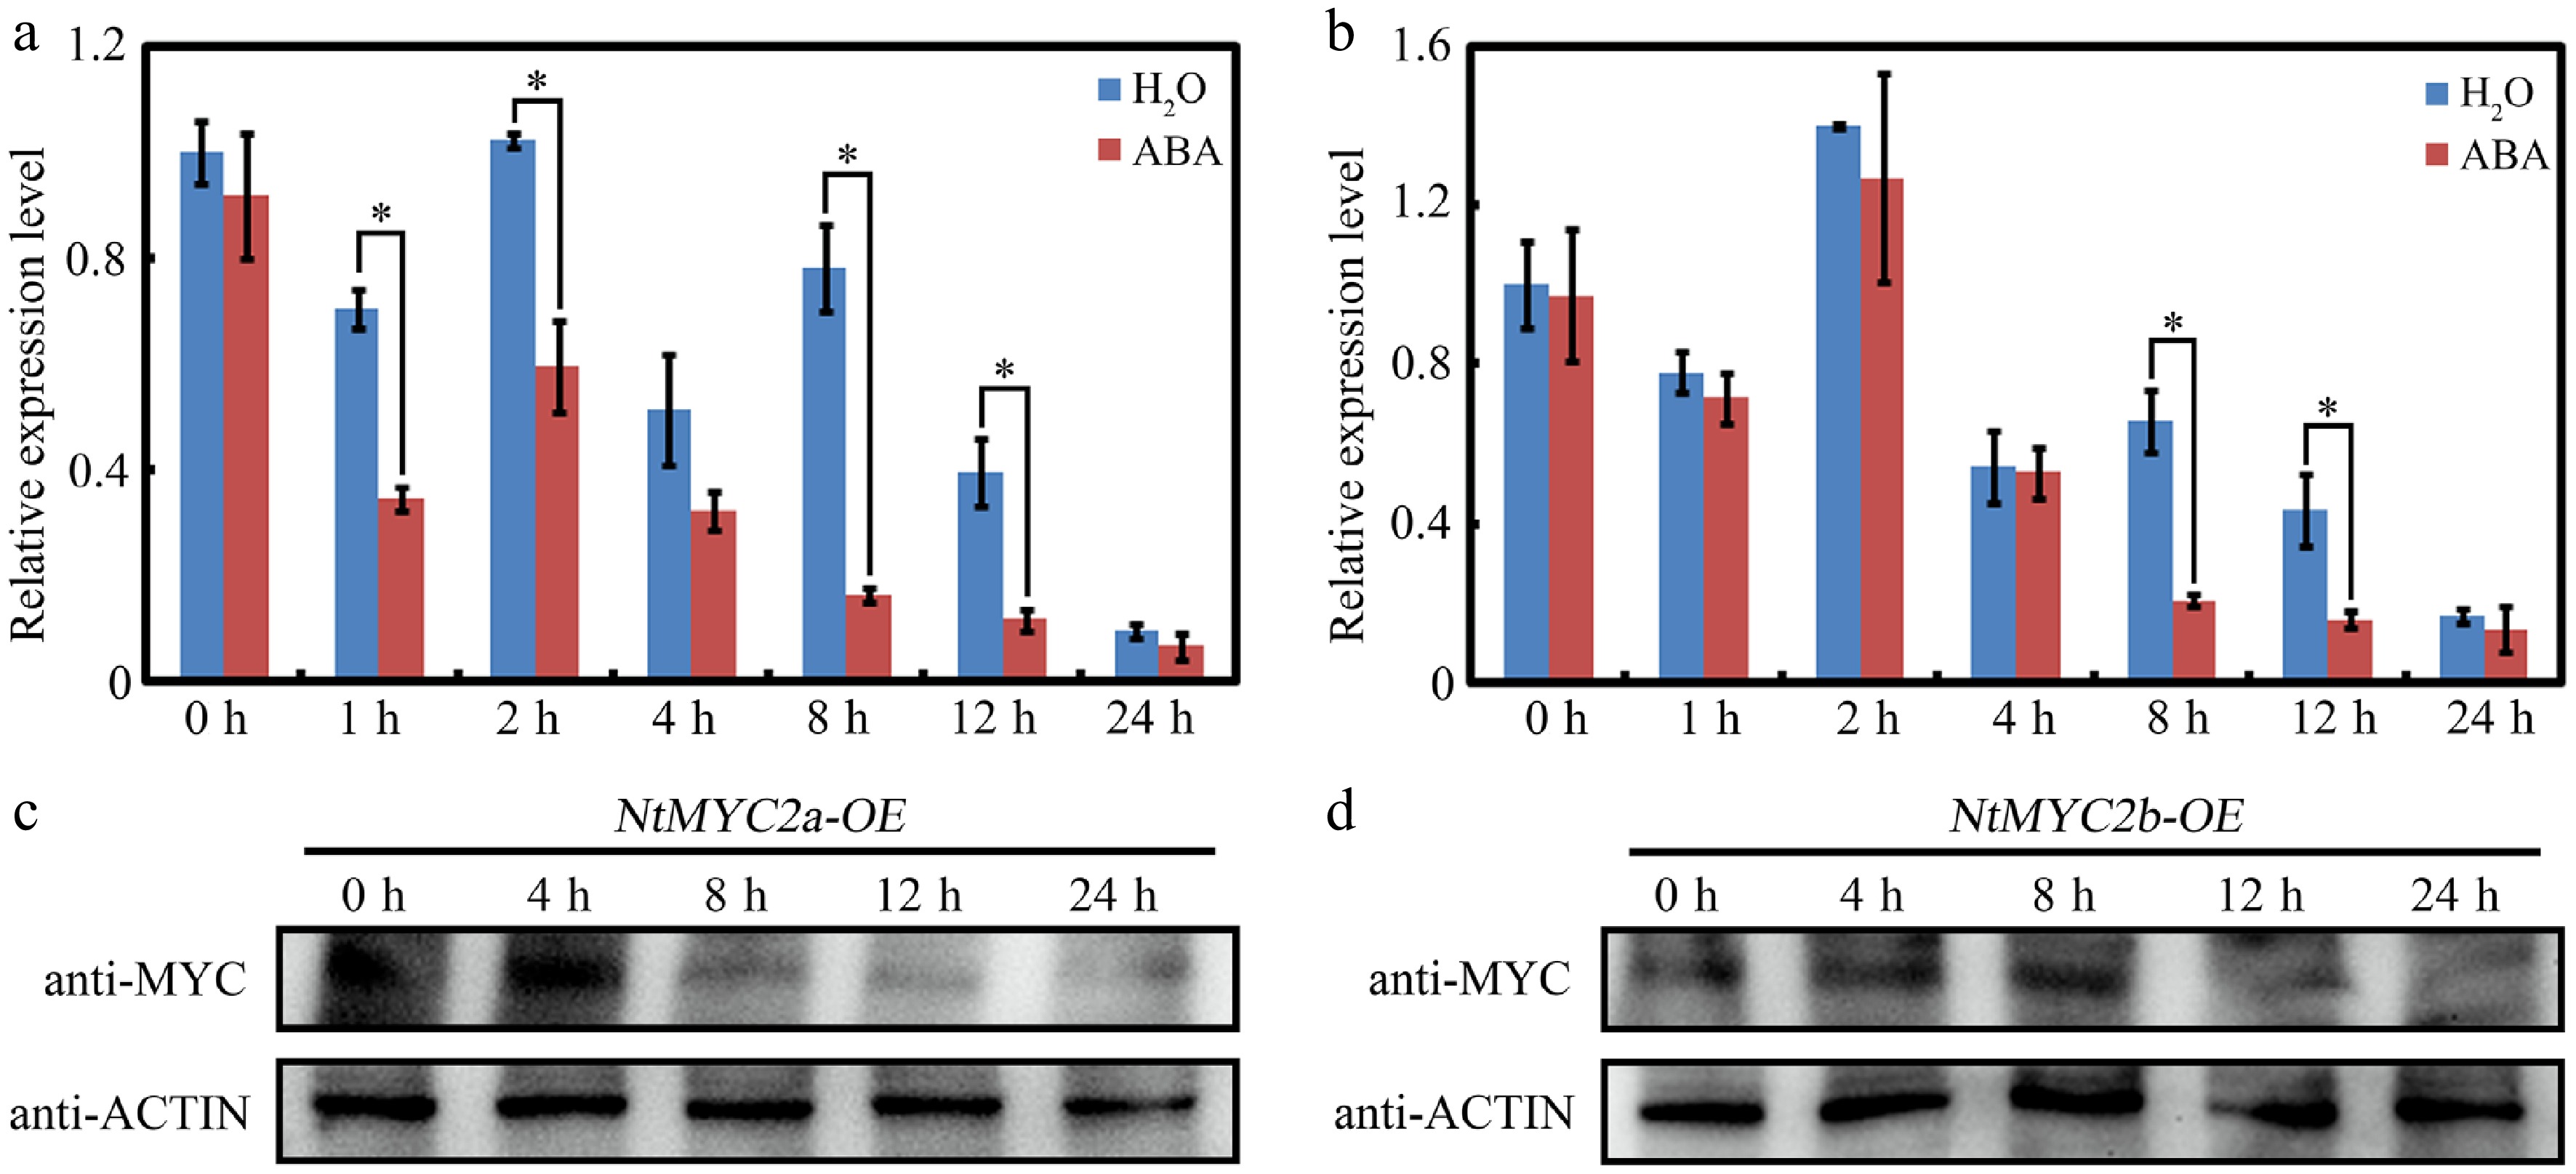
Figure 1.
Expression of NtMYC2a and NtMYC2b upon ABA treatment. (a) and (b) RT-qPCR analysis of transcript levels of NtMYC2a and NtMYC2b after ABA treatment. Samples were collected after ABA treatment for the indicated time. All data are presented as the mean ± SD from three independent biological replicates. Asterisks indicate Student's t-test significant differences as compared to controls, * p < 0.05. (c) and (d) Western blot analysis of NtMYC2a/2b protein accumulation in transgenic 35S:MYC-NtMYC2a/2b plants after ABA treatment for the indicated time. An anti-MYC antibody was used to detect MYC-NtMYC2a/2b. Actin was used as an internal control.
-
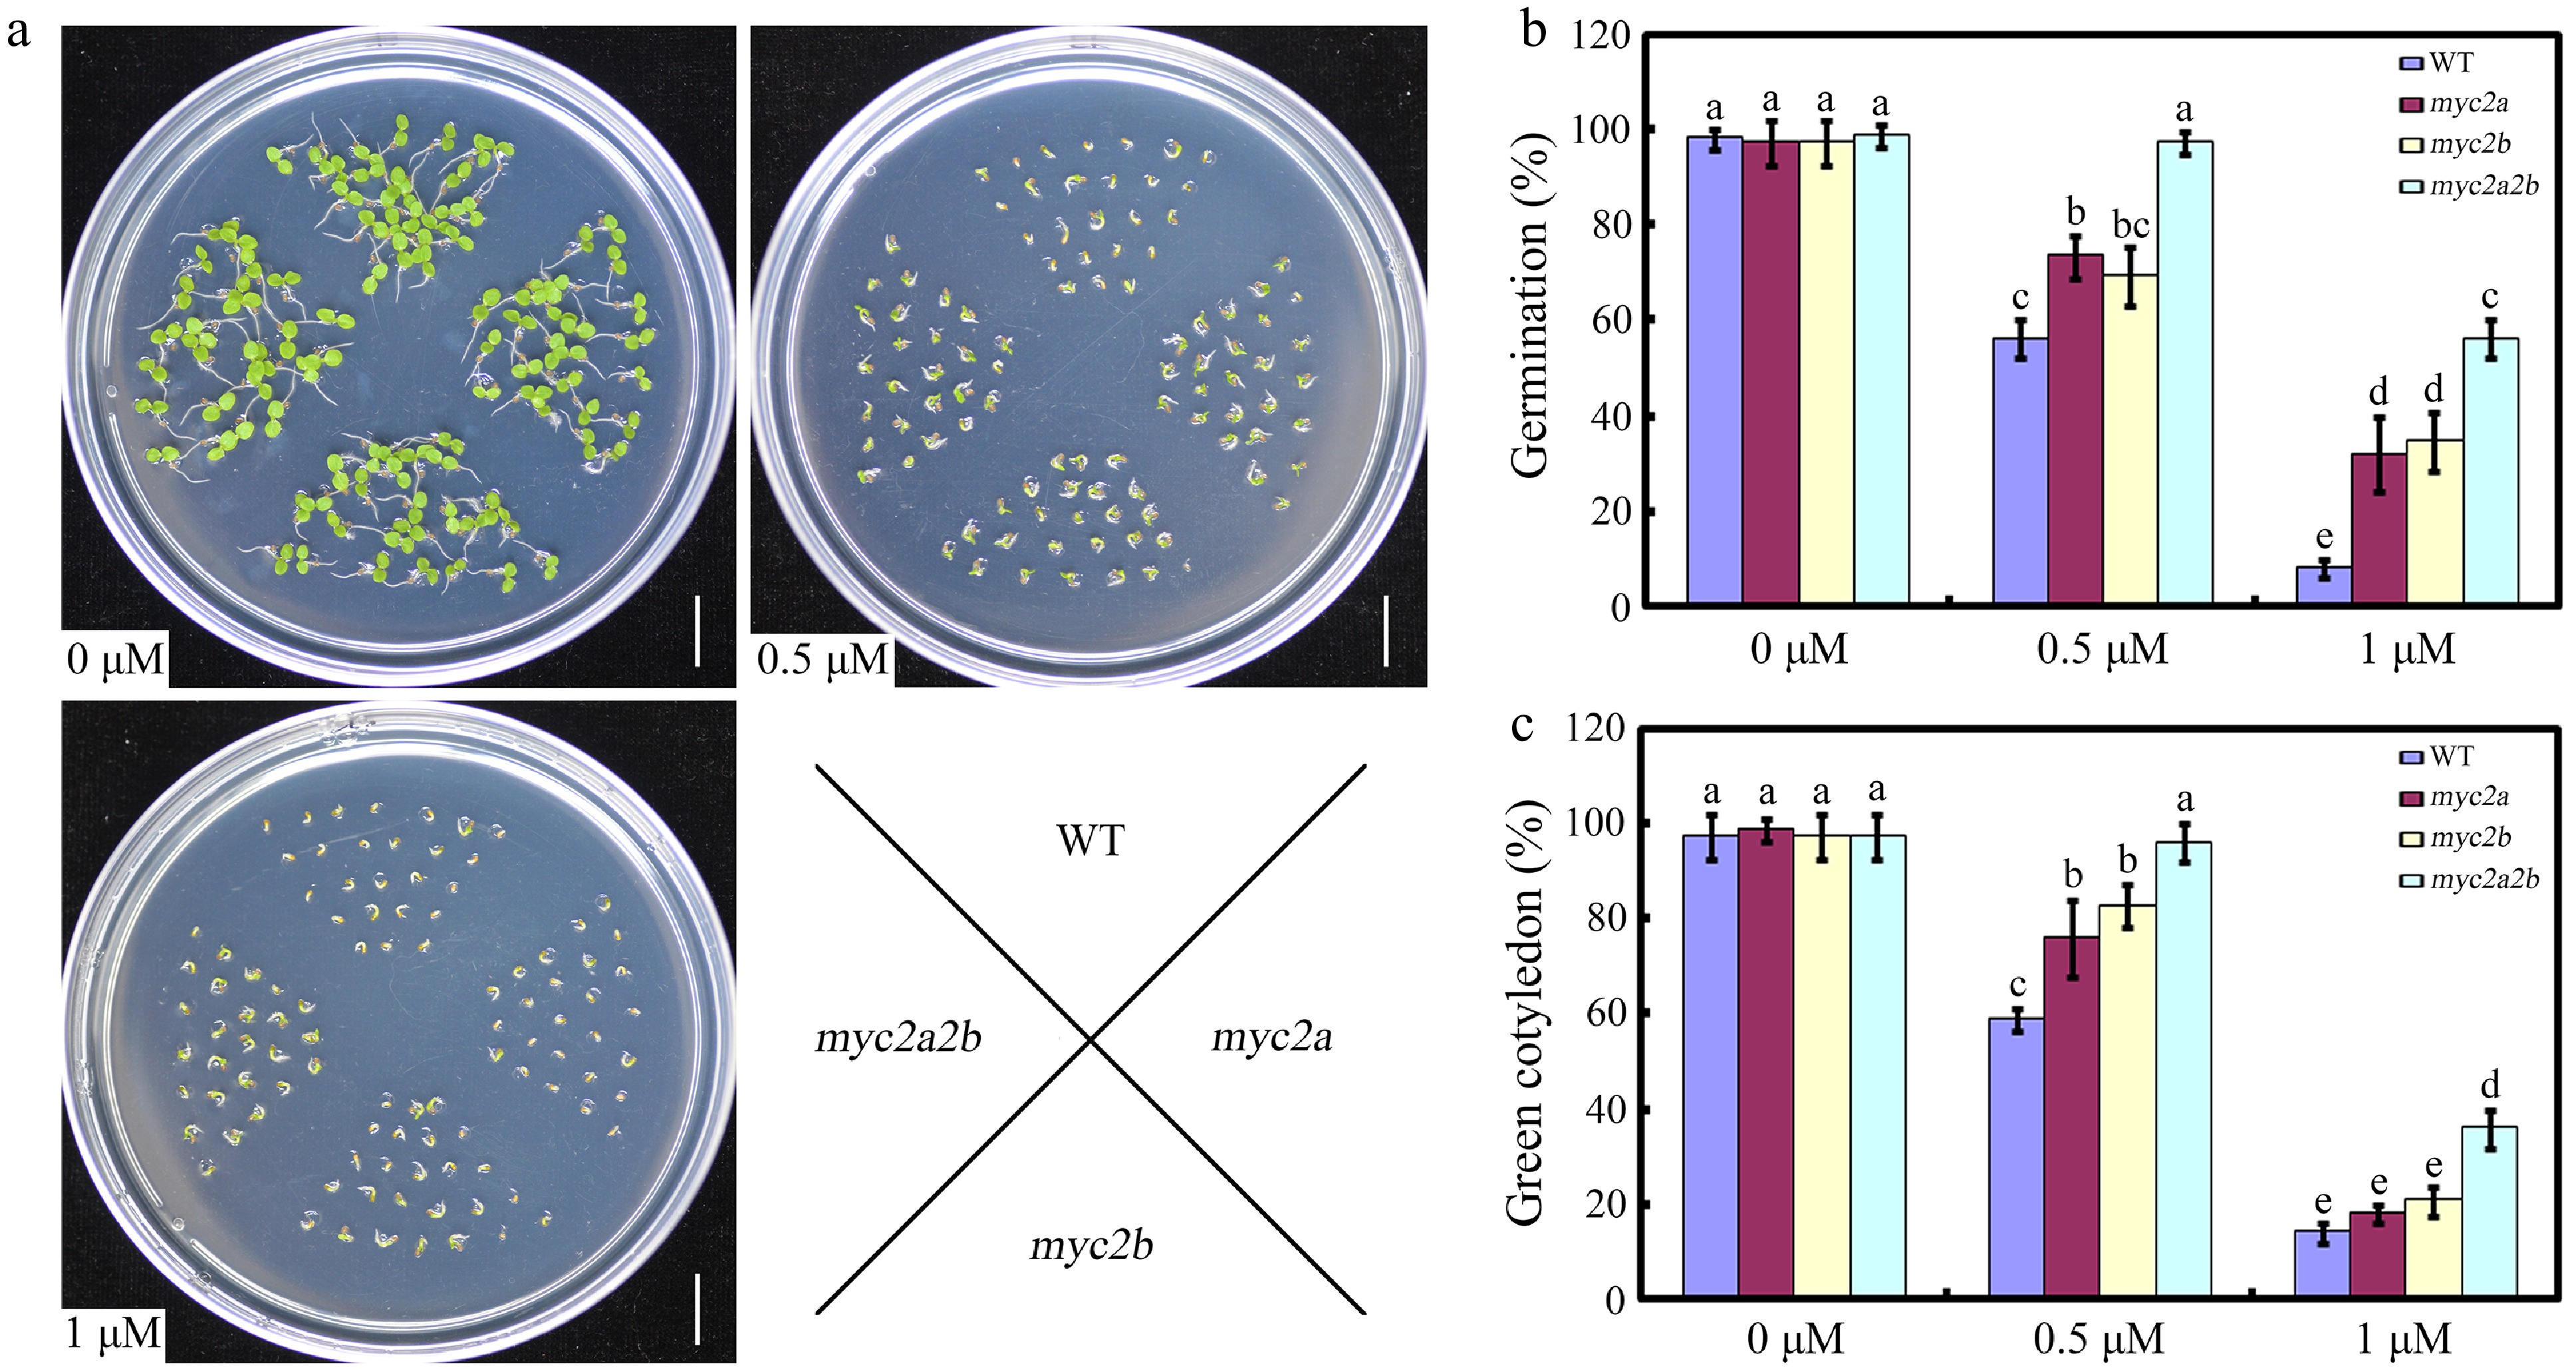
Figure 2.
The effect of NtMYC2a and NtMYC2b mutation on seed germination. (a) Seedlings of the indicated genotypes observed 7 d after germination on medium supplemented with 0, 0.5 or 1 µM ABA. (b) Statistic analysis of germination rate in the indicated genotypes. The seeds were scored 5 d after stratification on medium containing different concentrations of ABA. Germination is defined by radical emergence. (c) Statistic analysis of the indicated genotypes for cotyledon greening. Cotyledon greening was scored 7 d after stratification on medium containing different concentrations of ABA. All data are presented as the mean ± SD from three independent biological replicates. These data were analyzed by a two-way ANOVA using Tukey's HSD test. Bars with different letters are significantly different from each other (p < 0.05).
-
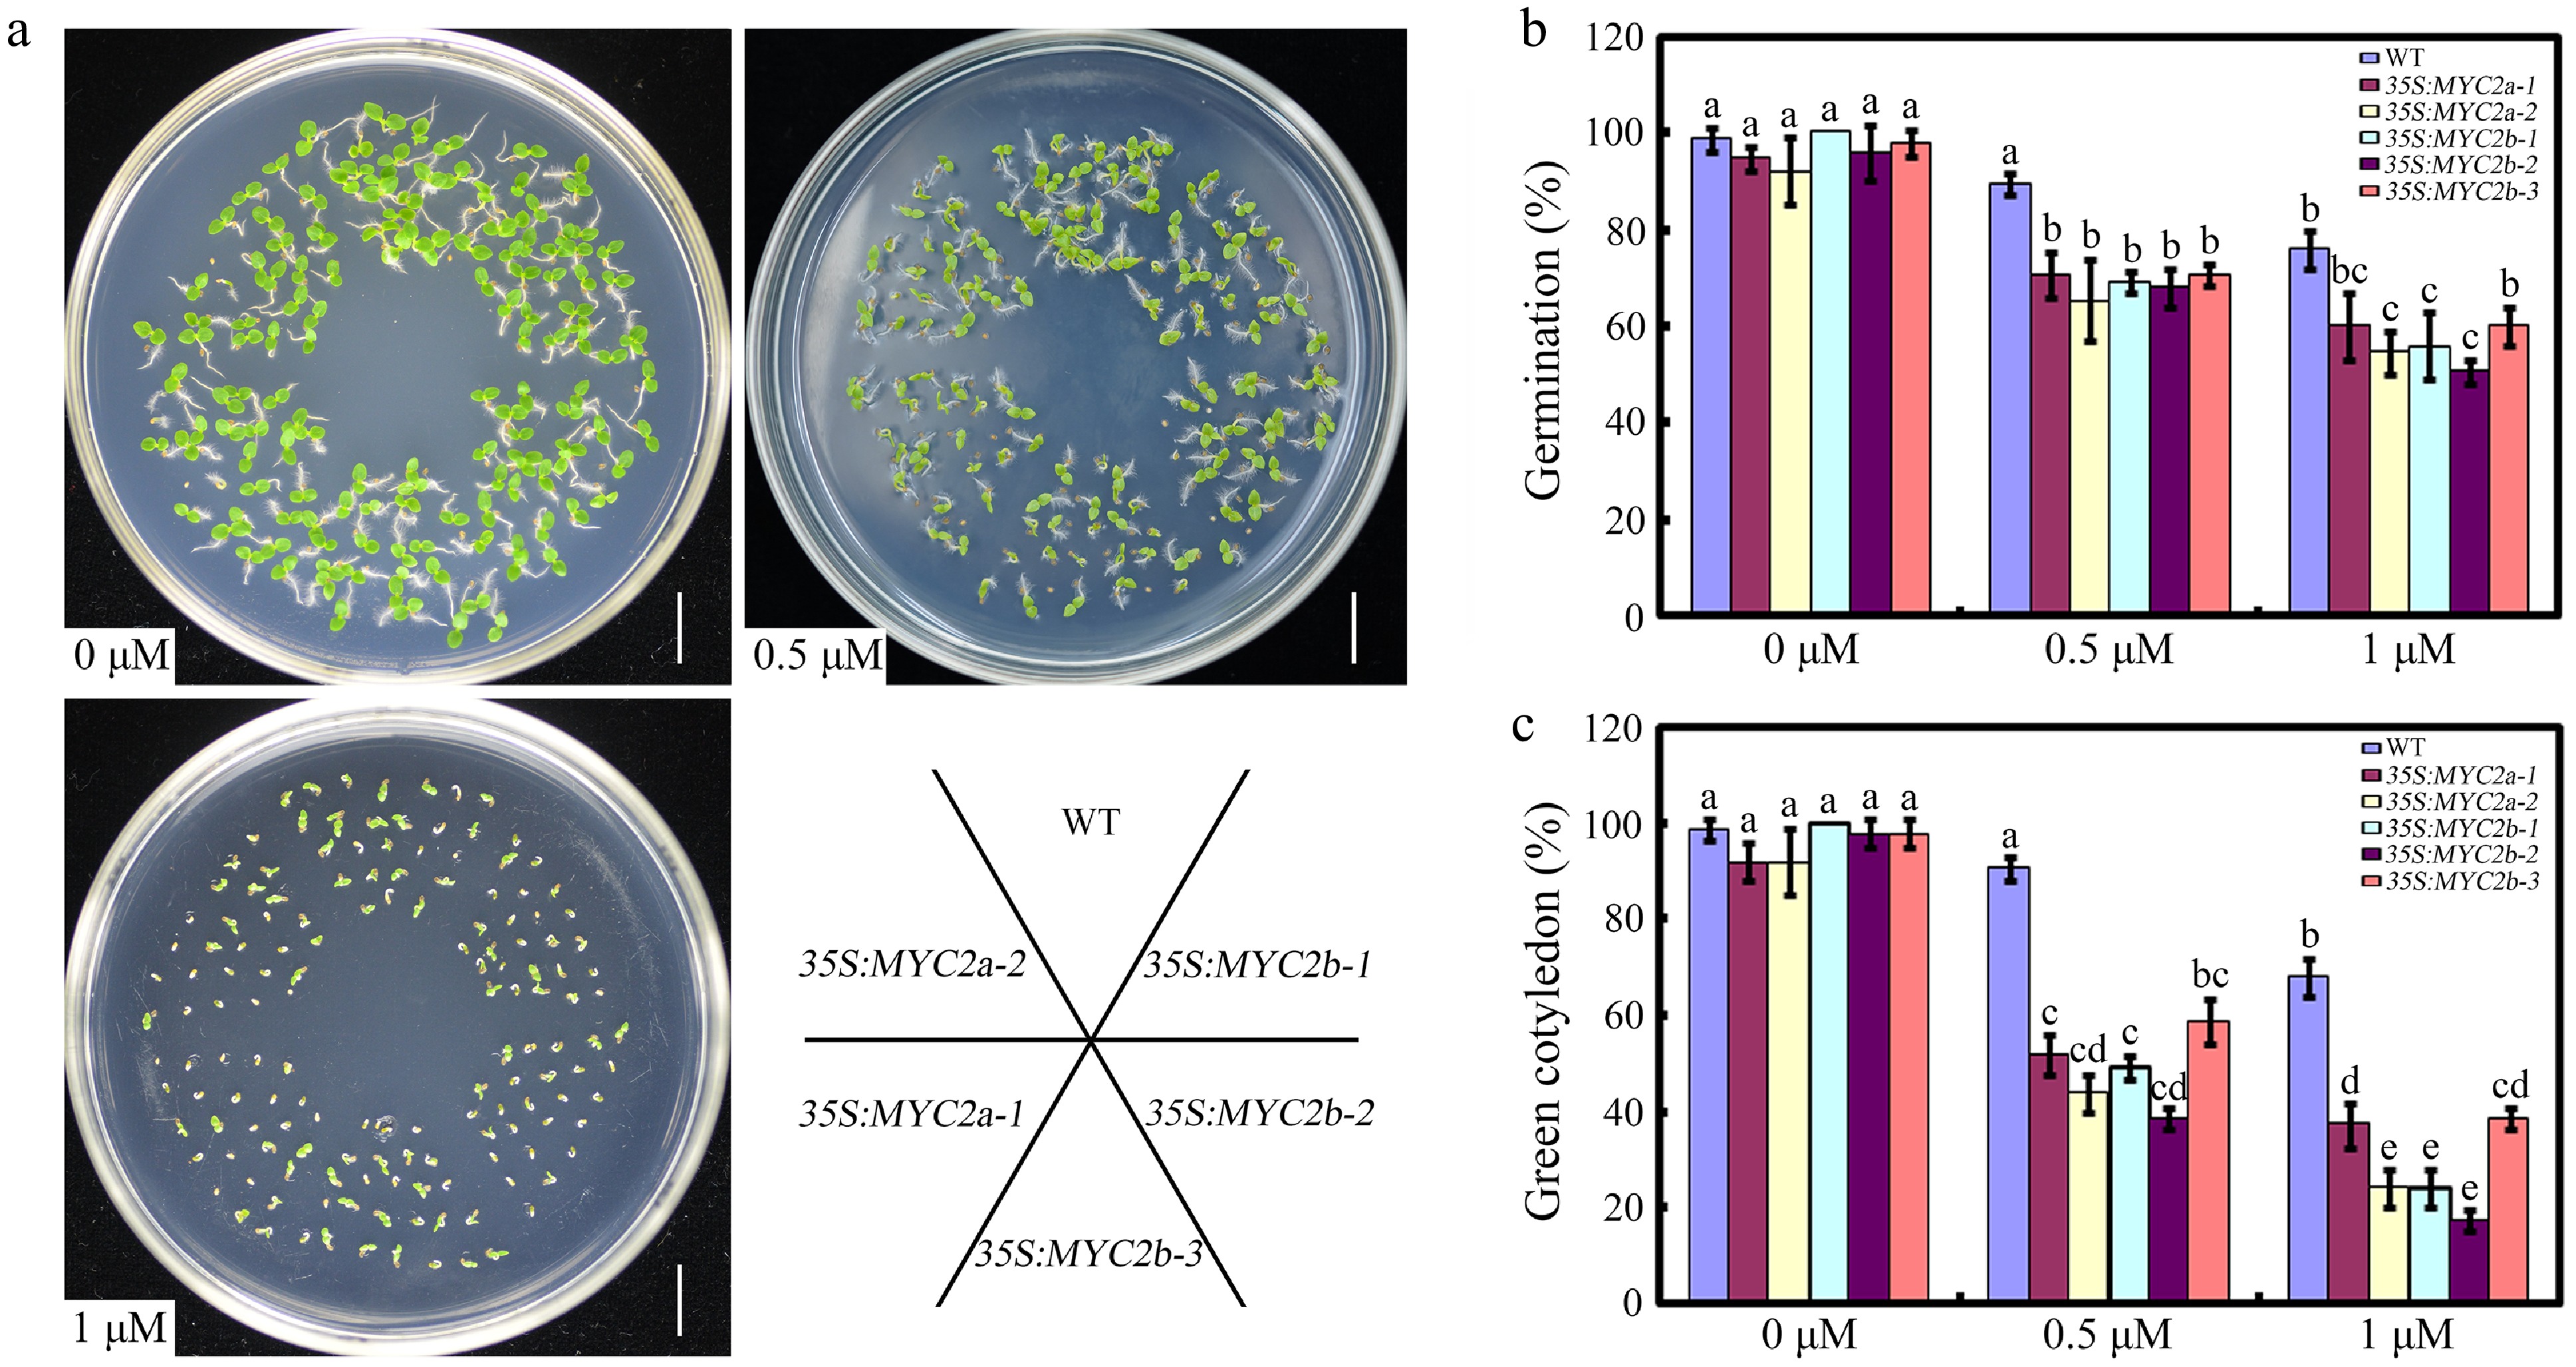
Figure 3.
The effect of NtMYC2a or NtMYC2b overexpression on seed germination. (a) Seedlings of the indicated genotypes observed 10 d after germination on medium supplemented with 0, 0.5 or 1 µM ABA. (b) Statistic analysis of germination rate in the indicated genotypes. The seeds were scored 8 d after stratification on medium containing different concentrations of ABA. Germination is defined by radical emergence. (c) Statistic analysis of the indicated genotypes for cotyledon greening. Cotyledon greening was scored 10 d after stratification on medium containing different concentrations of ABA. Error bars (mean ± SD) are derived from three biological replicates. Data were analyzed by a two-way ANOVA using Tukey's HSD test. Bars with different letters are significantly different from each other (p < 0.05).
-
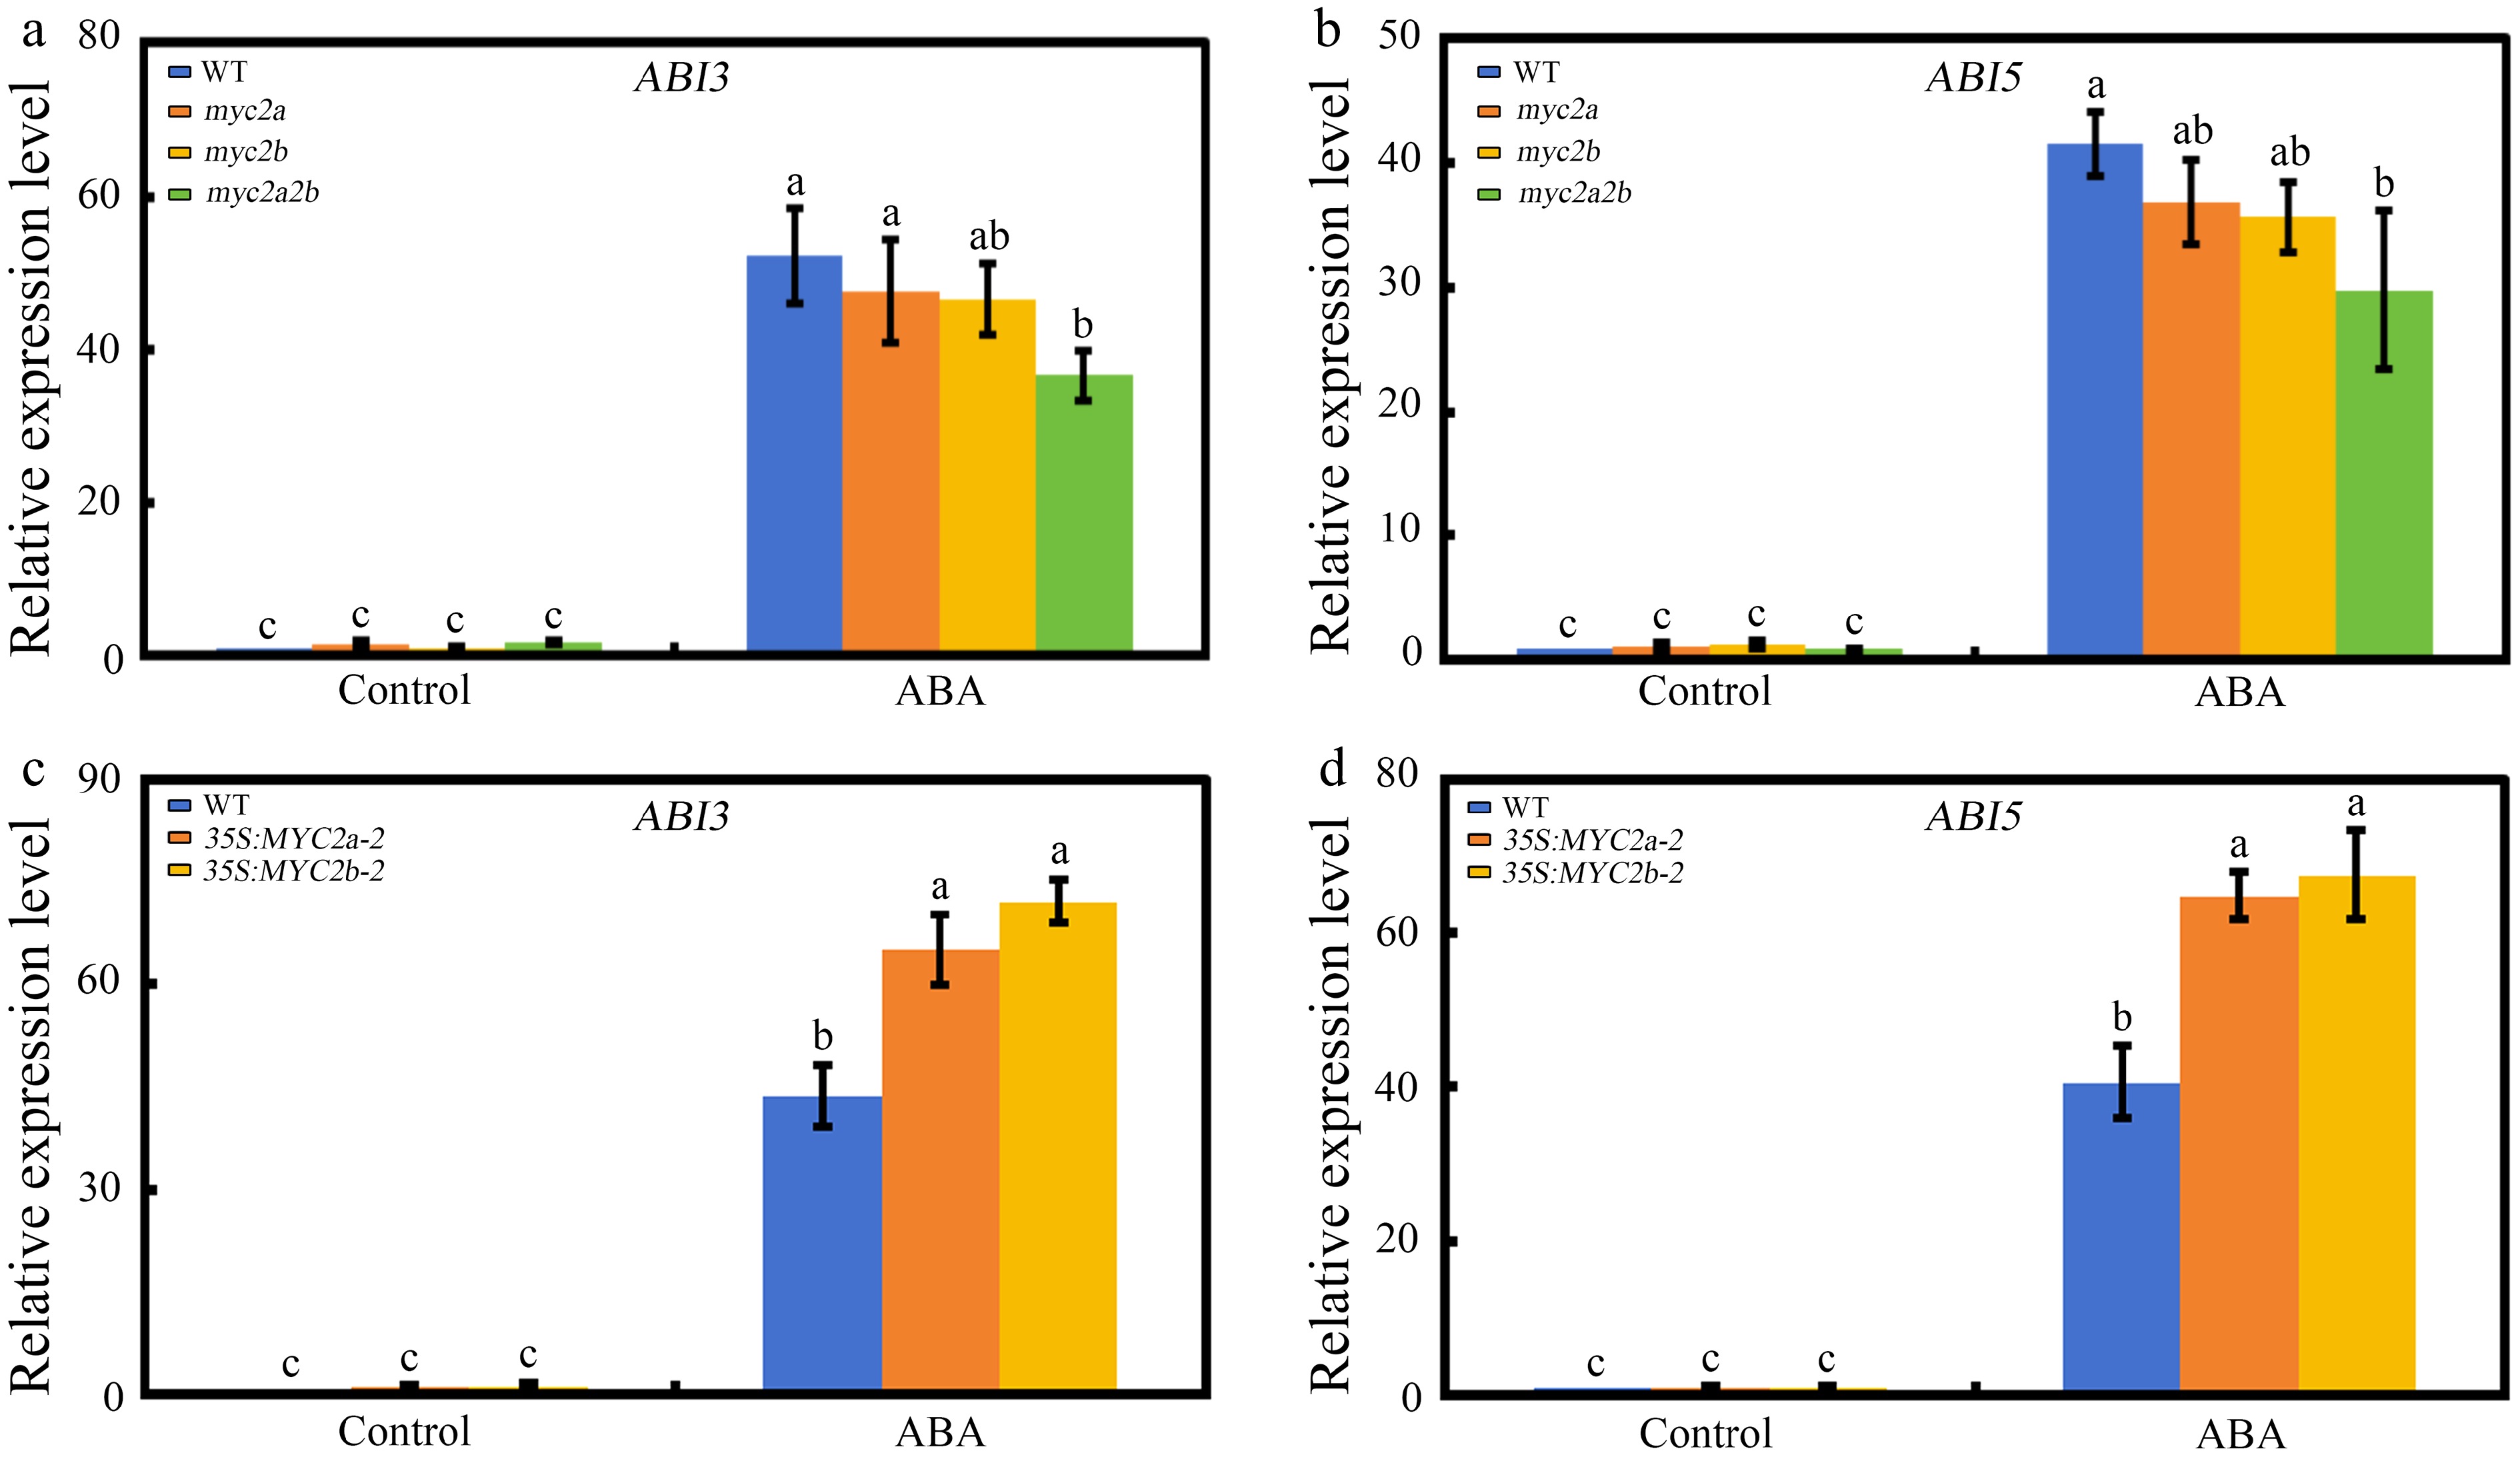
Figure 4.
The effect of NtMYC2a/2b mutation or overexpression on NtABI3 and NtABI5 expression. (a) and (b) Expression levels of NtABI3 and NtABI5 in Ntmyc2a and Ntmyc2b single mutant, Ntmyc2a2b double mutant and wild-type tobacco seeds grown on medium containing 1 µM ABA or not for 3 d. (c) and (d) Expression levels of NtABI3 and NtABI5 in NtMYC2a or NtMYC2b overexpression line and wild-type tobacco seeds grown on medium containing 1 µM ABA or not for 3 d. The data is shown as mean ± SD, error bars represent SD from three independent biological replicates, which were analyzed by a two-way ANOVA using Tukey's HSD test. Bars with different letters are significantly different from each other (p < 0.05).
-
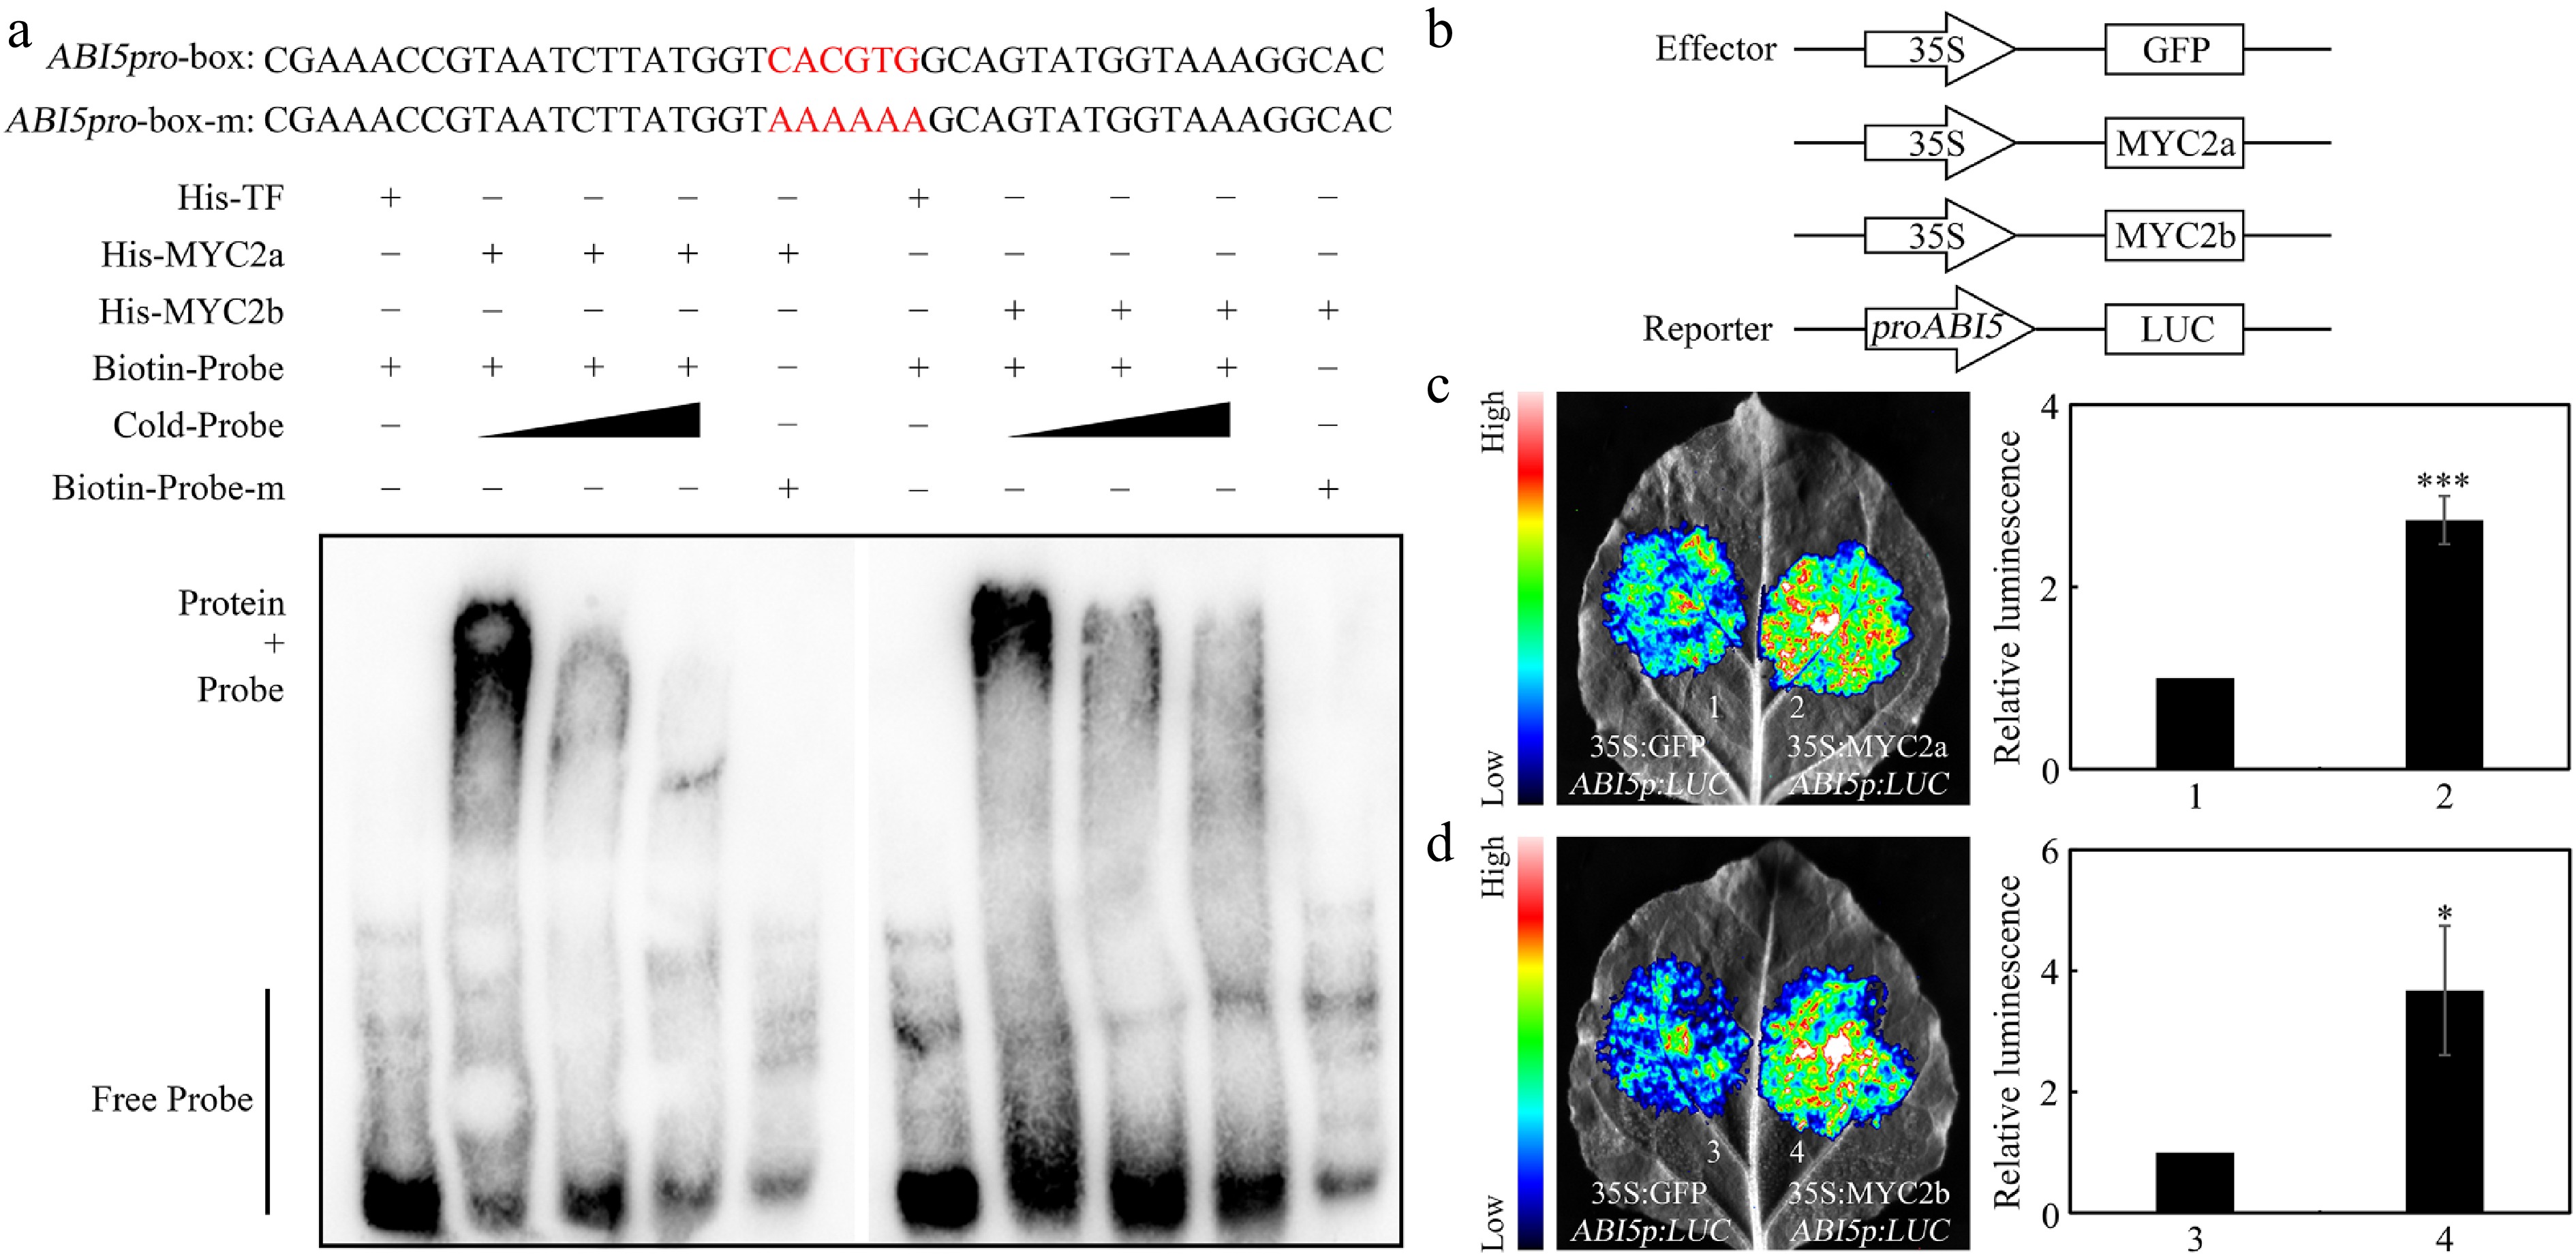
Figure 5.
NtMYC2a/2b bind the promoter of NtABI5 to activate its expression. (a) EMSA results revealed that NtMYC2a/2b can bind to the promoter of NtABI5. The probes were synthesized according to the G-box element within the NtABI5 promoter. The red sequence signifies G-box sequence and the mutated base in the G-box element. His, His-NtMYC2a/2b, biotin-probe, biotin-probe-m and cold probes were present (+), or absent (−) in each reaction. (b) Schematic of the NtABI5p:LUC reporter and NtMYC2a/2b and GFP effectors. (c) and (d) Transient transcriptional activity assays. NtMYC2a/2b could activate NtABI5 expression in N. benthamiana leaves. Both representative leaf images and quantification of corresponding relative luminescence intensities were presented. Error bars represent ± SD. Asterisks indicate student's t-test significant differences as compared to controls, * p < 0.05, *** p < 0.001.
-
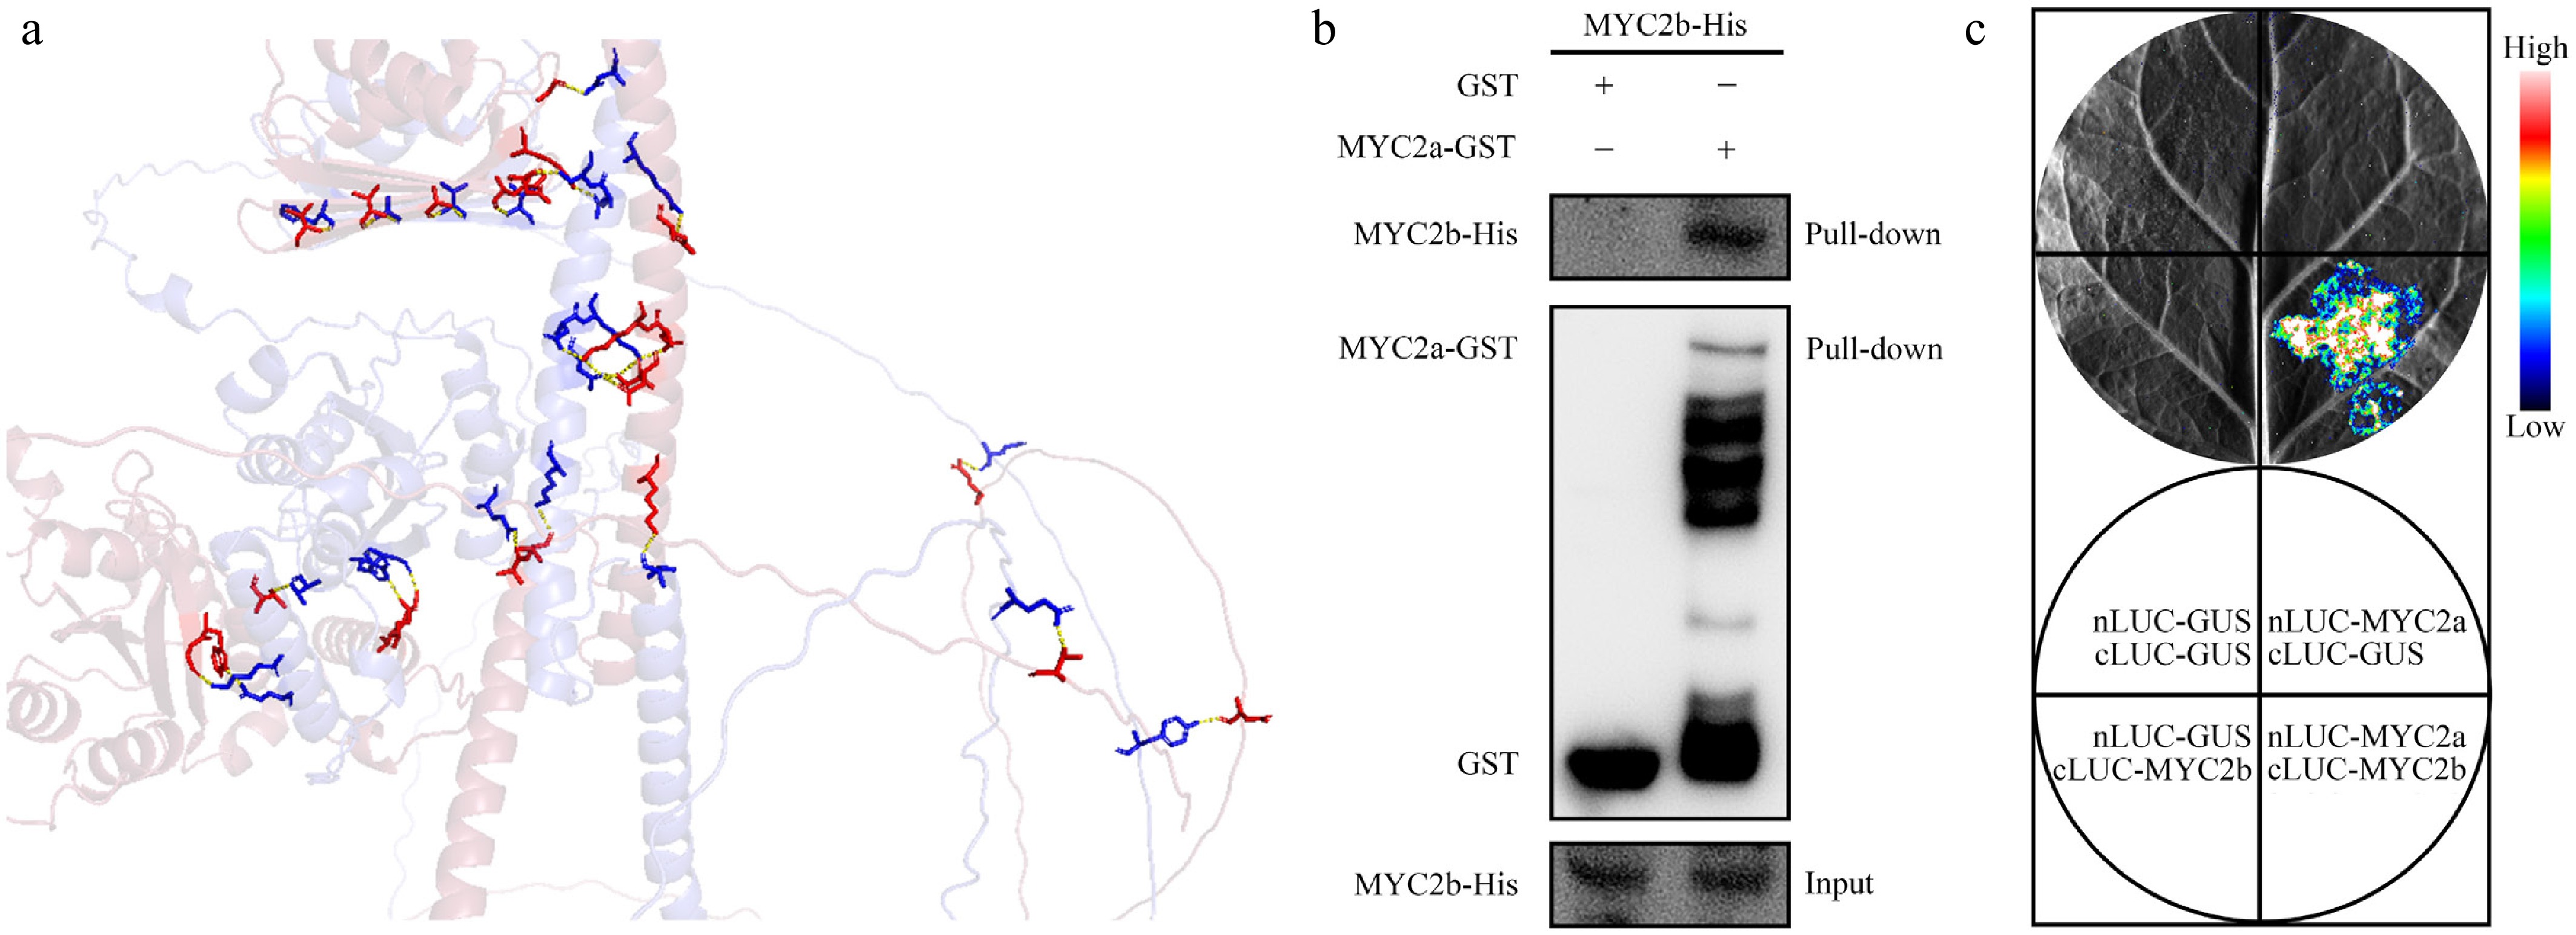
Figure 6.
Interaction between NtMYC2a and NtMYC2b. (a) The predicted cartoon diagram showing the interaction between NtMYC2a and NtMYC2b, as analysed via AlphaFold and PyMOL. The hydrogen bonds were shown as yellow dashed lines, the protein complex structures were shown as colored sticks, blue represents NtMYC2a, red represents NtMYC2b. (b) Pull-down assay confirming the interaction between NtMYC2a-GST and NtMYC2b-His. GST alone served as a negative control. (c) Split-luciferase complementation (split-LUC) assay confirming NtMYC2a-NtMYC2b interaction in N. benthamiana. A representative image of leaf taken 48 h after infiltration is shown, with luminescence intensity indicated by the pseudocolor bar.
-
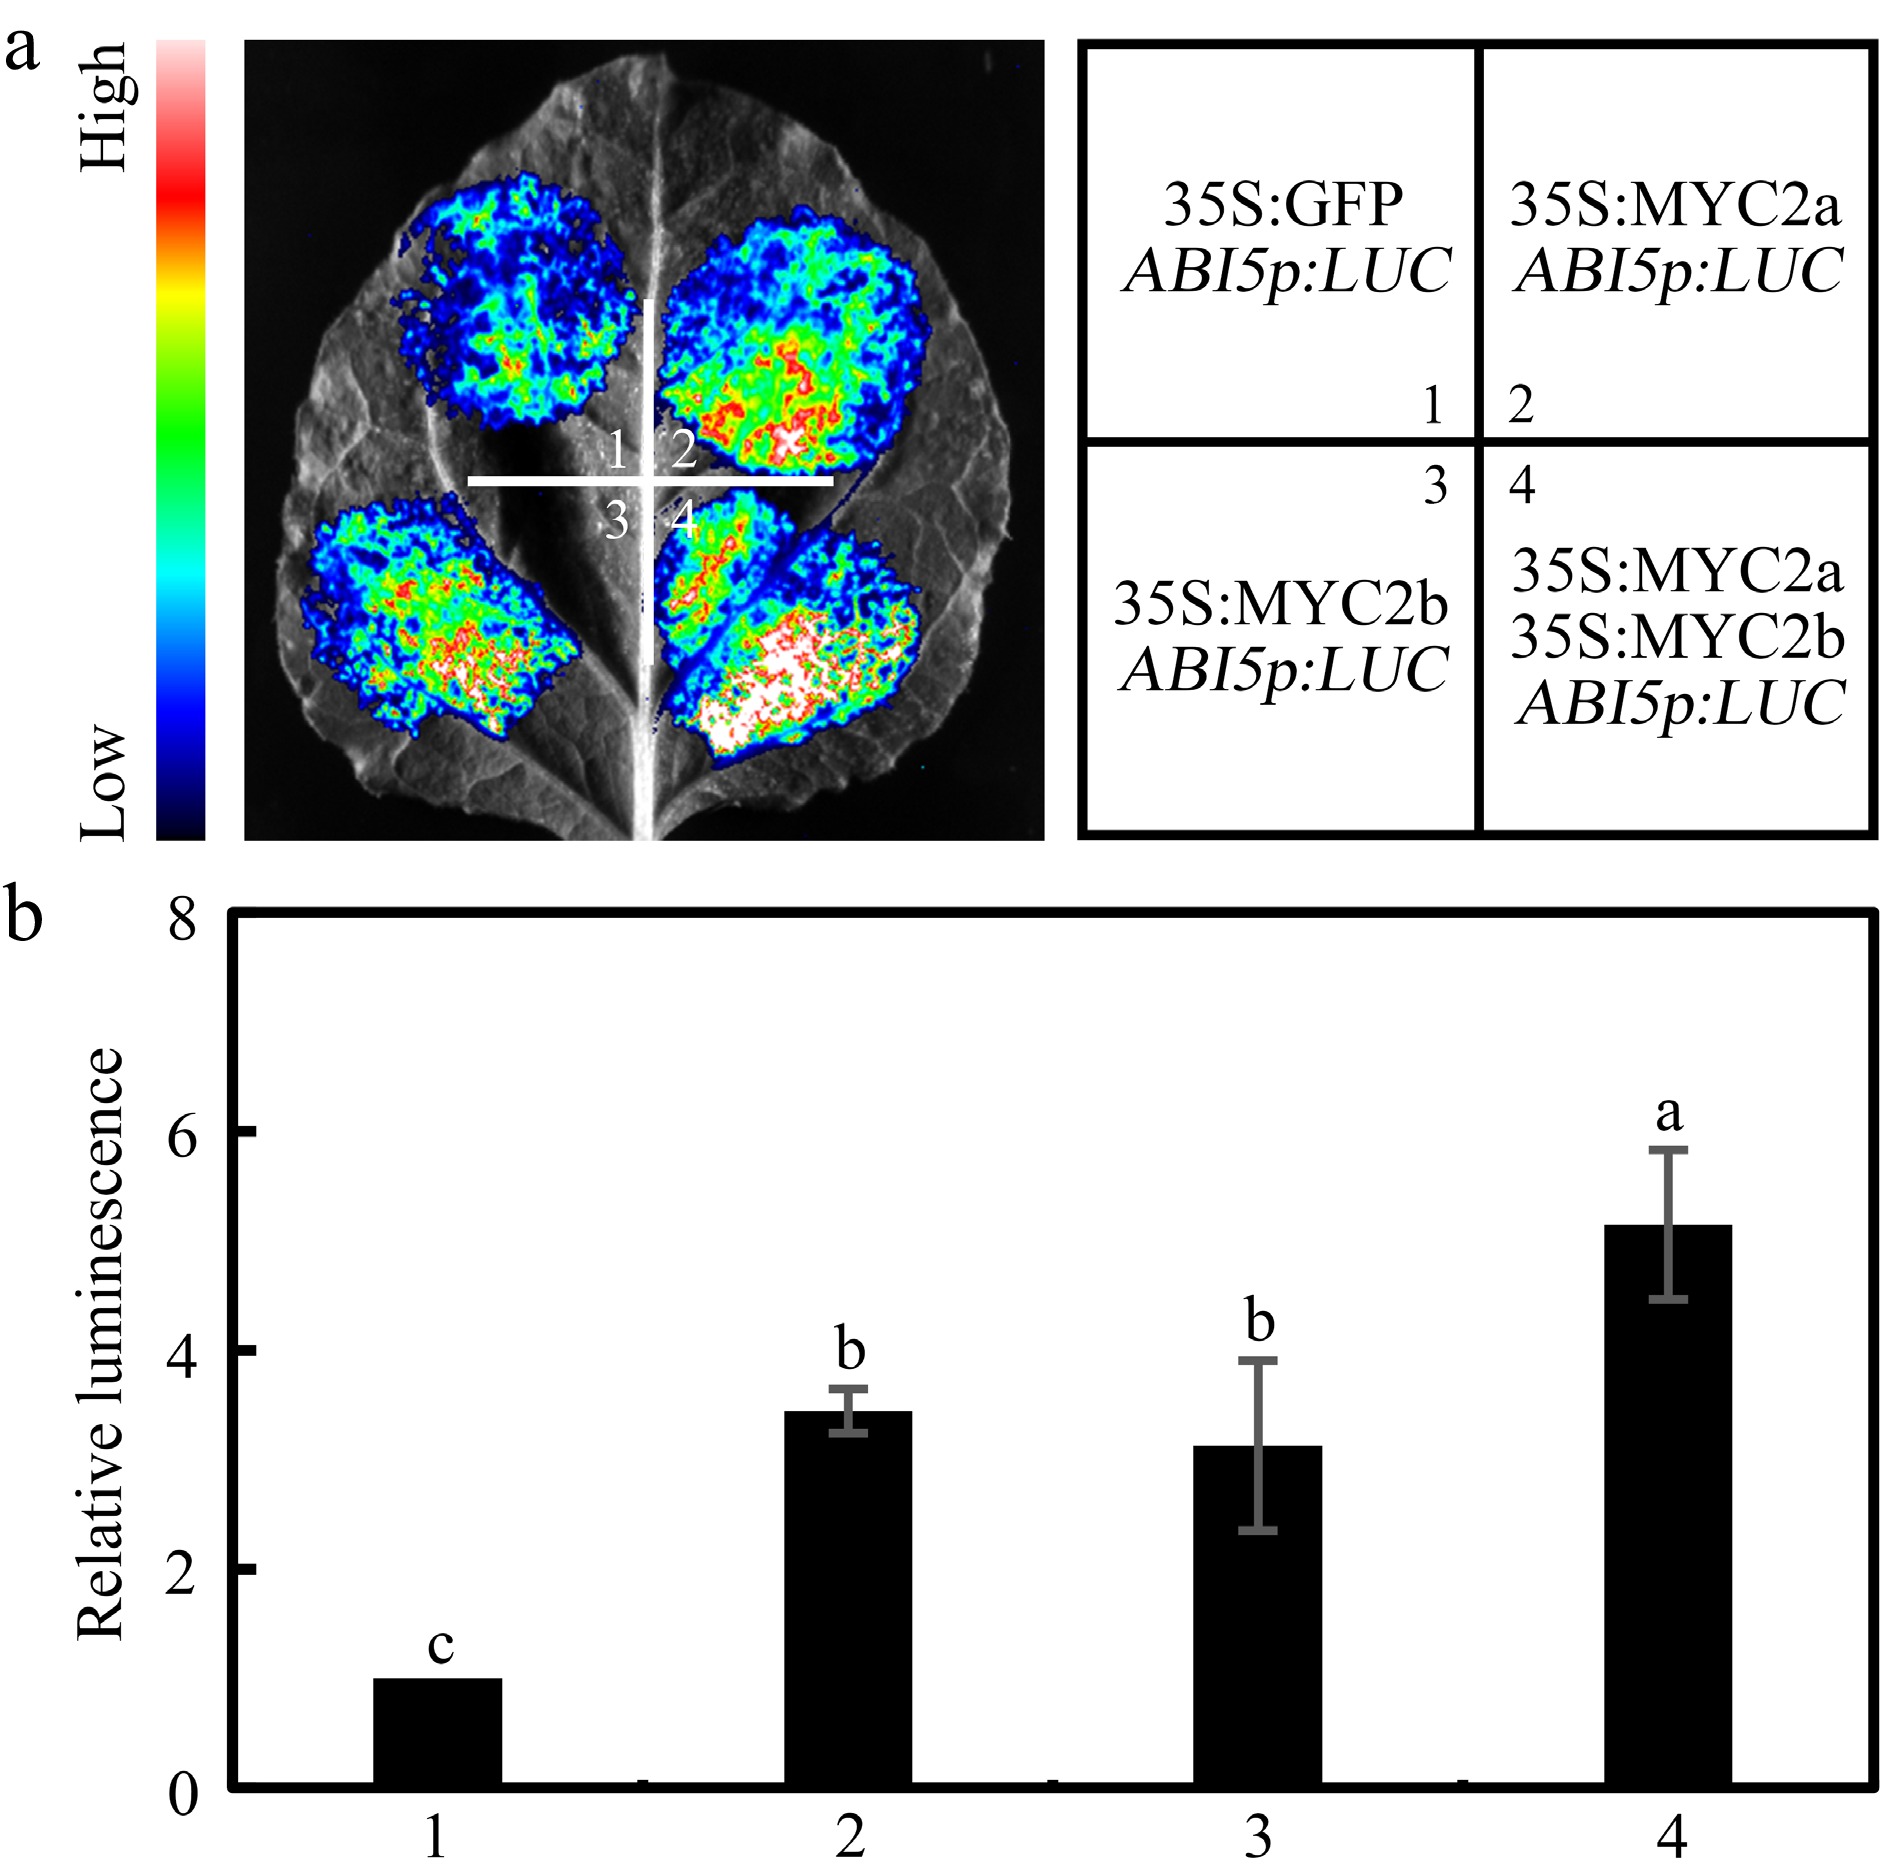
Figure 7.
NtMYC2a and NtMYC2b synergistically activate NtABI5 expression. Transient expression analysis in N. benthamiana leaves to show that NtMYC2a and NtMYC2b can synergistically activate NtABI5 expression. Both the (a) representative leaf image, and the (b) corresponding relative luminescence intensity, were presented. Three biological replicates data were analyzed by a one-way ANOVA using Tukey's HSD test. Bars with different letters are significantly different from each other (p < 0.05).
Figures
(7)
Tables
(0)