-
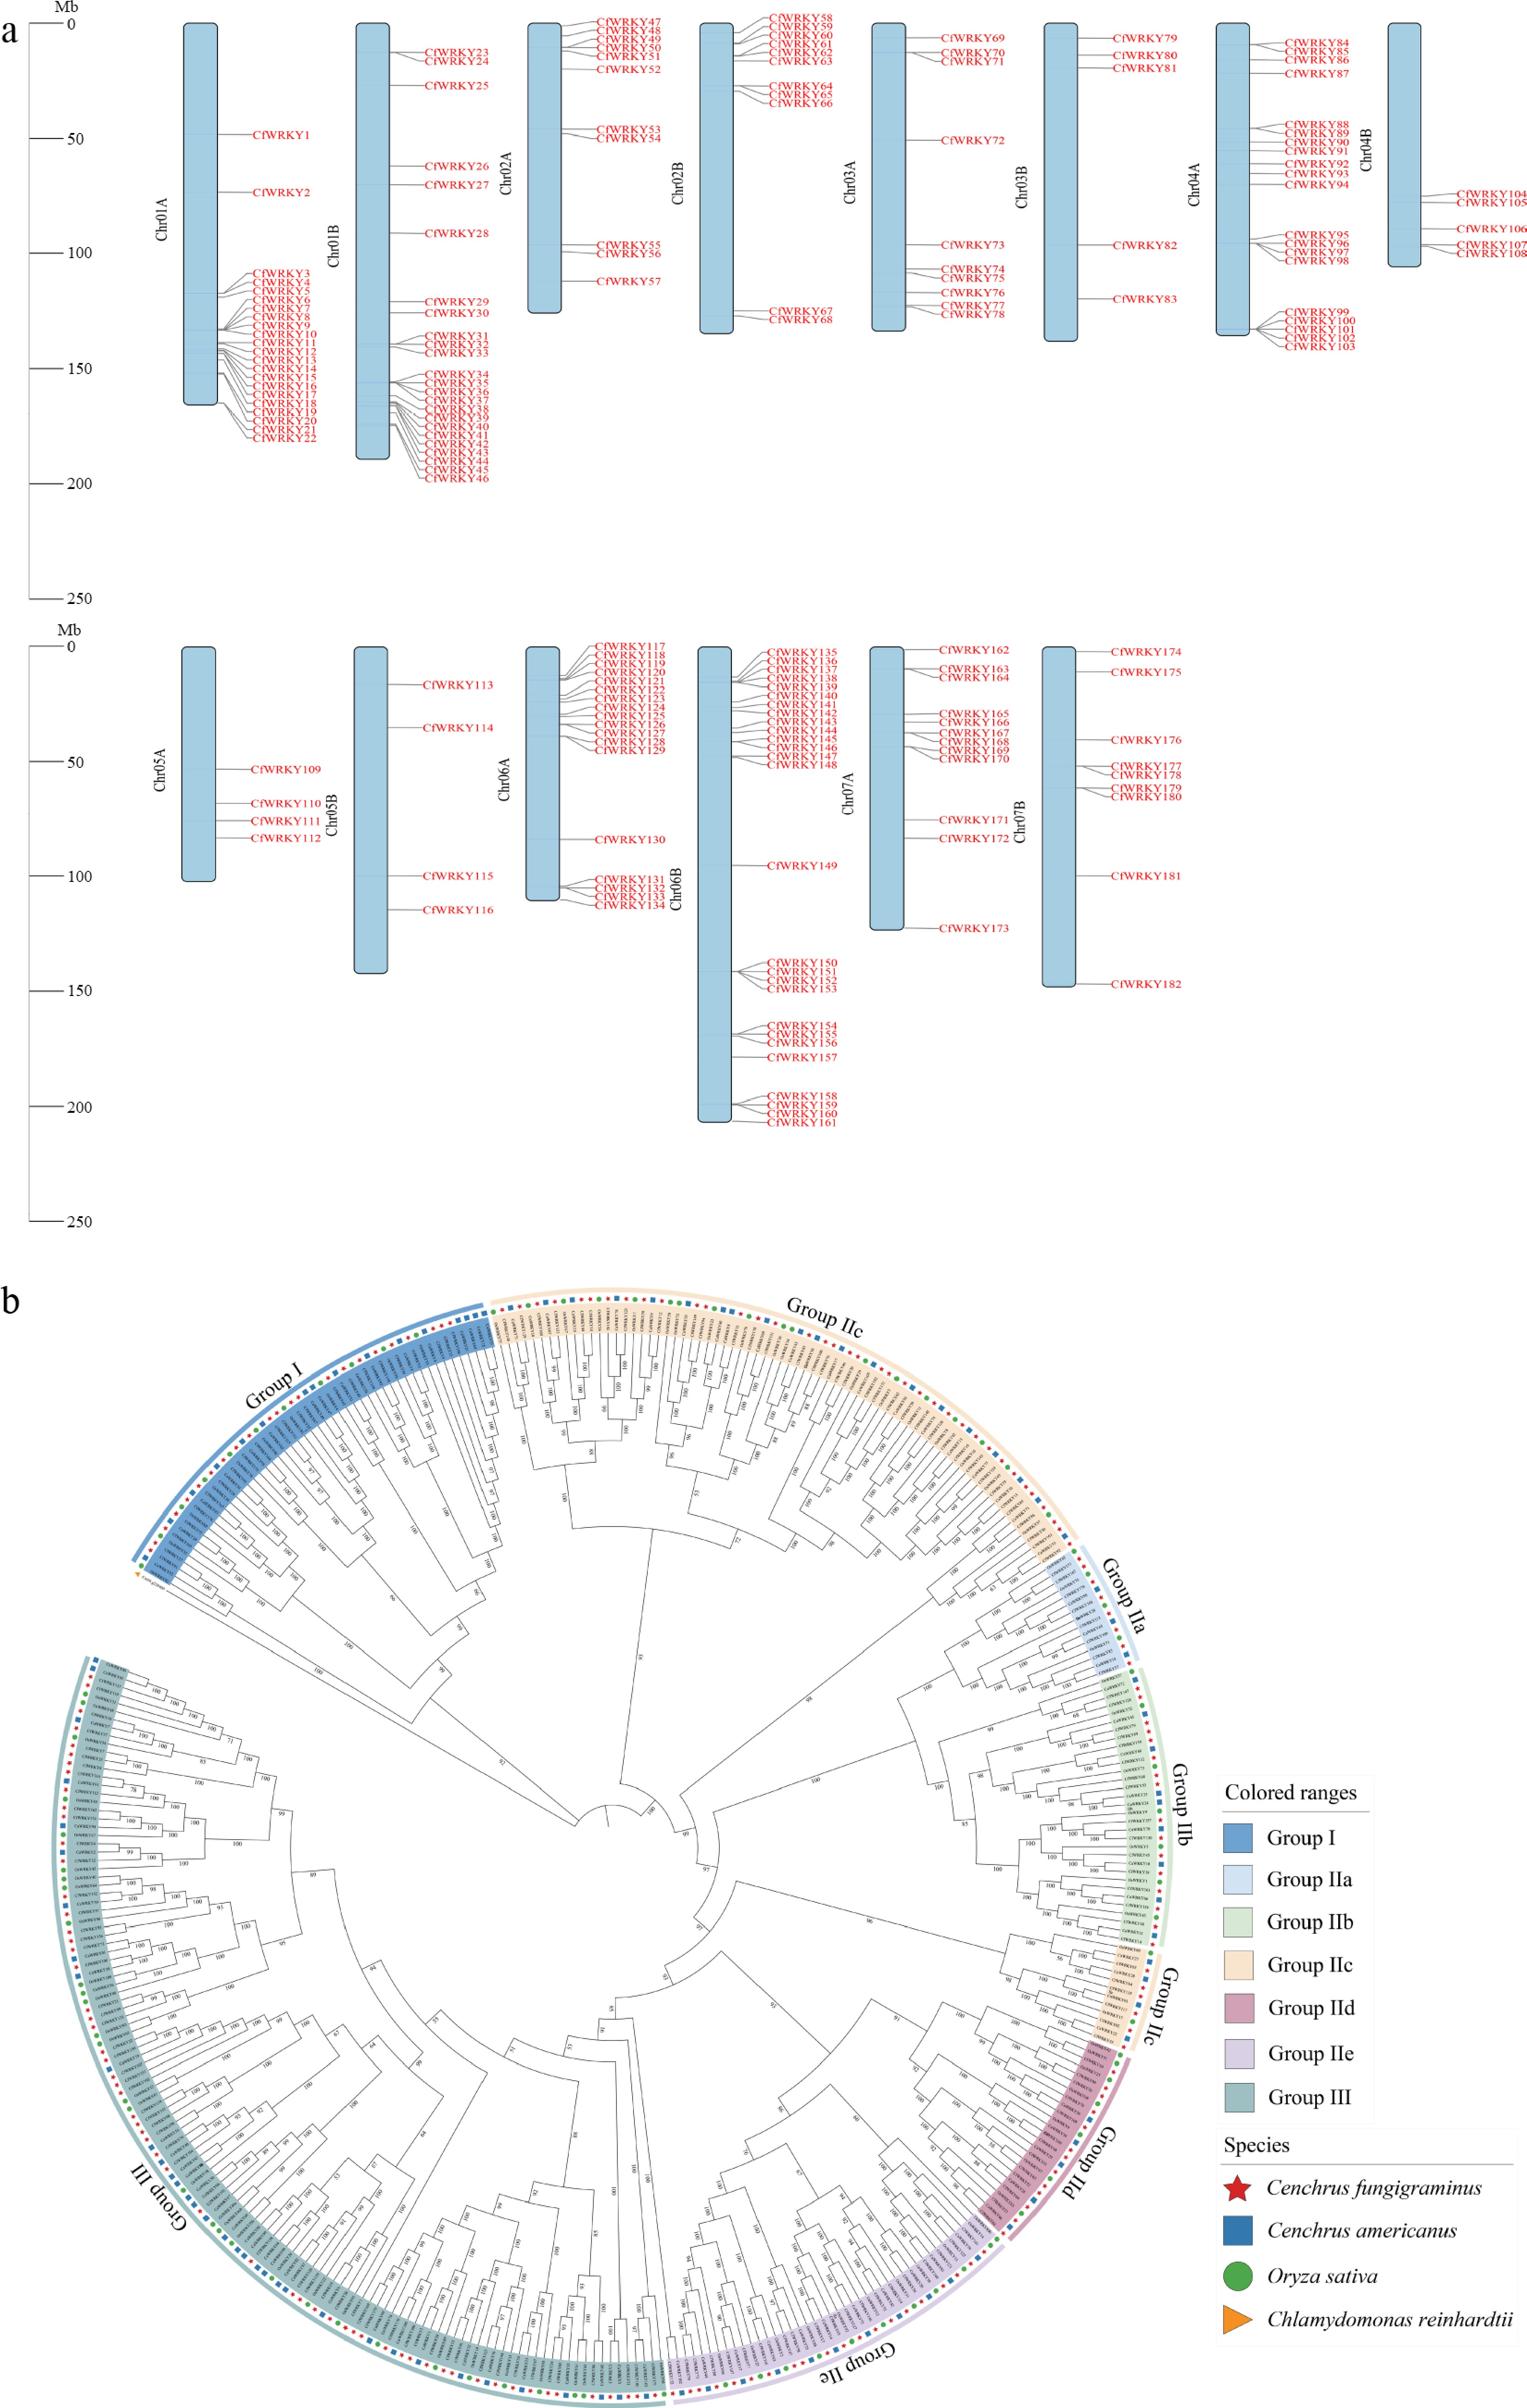
Figure 1.
Chromosomal distribution and phylogenetic analysis of CfWRKY genes in Cenchrus fungigraminus. (a) A total of 182 CfWRKY genes were mapped onto the 14 chromosomes (Chr01A–Chr07B) of C. fungigraminus. Chromosomes are shown as colored bars, and gene positions are indicated in red. (b) Phylogenetic analysis of CfWRKY proteins together with WRKY members from C. americanus, O. sativa, and C. reinhardtii (outgroup). CfWRKY genes are marked with red stars, and different groups are indicated by distinct colors.
-
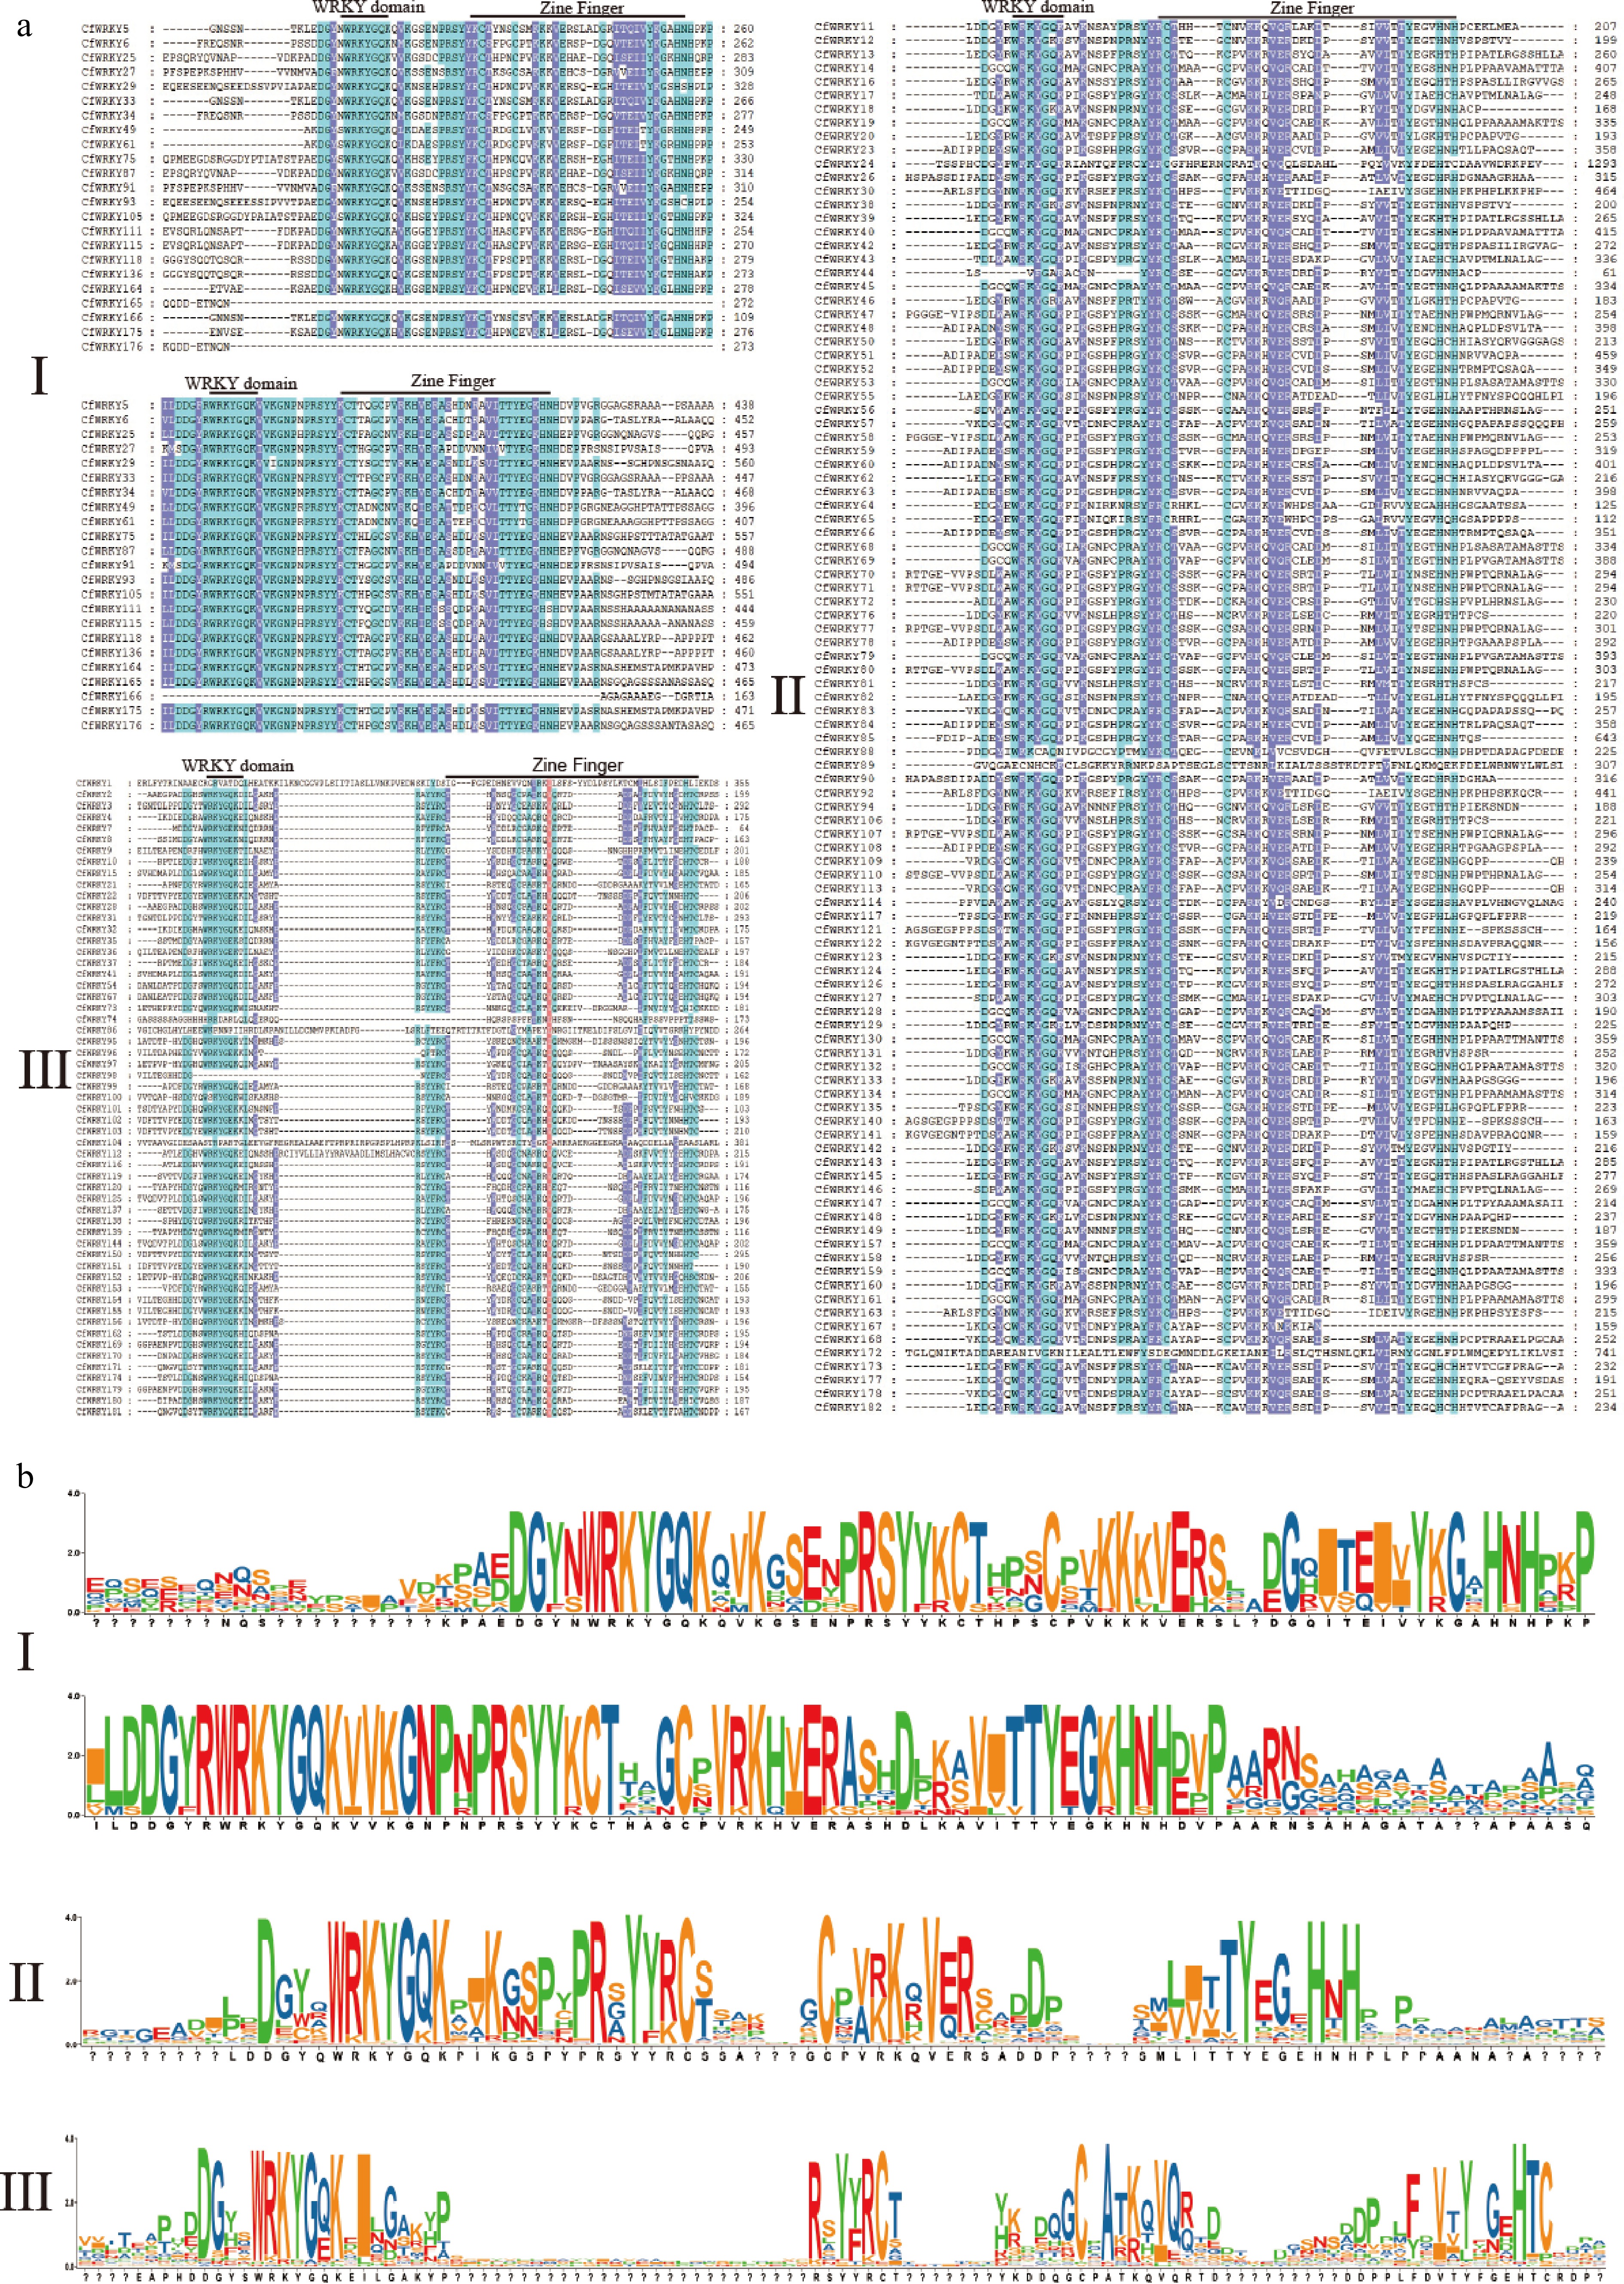
Figure 2.
Conserved domain analysis of WRKY proteins in C. fungigraminus. (a) Multiple sequence alignment of WRKY proteins. Based on phylogenetic classification, the CfWRKY proteins were grouped into I, II, and III. The conserved WRKY domain and the associated zinc-finger motifs are indicated above the aligned sequences. The number displayed on the far right of each row indicates the position of the corresponding sequence within the full-length protein. (b) Sequence logos of the WRKY domain regions from the three groups, showing the degree of amino-acid conservation; the larger the letter height, the higher the conservation at that position.
-
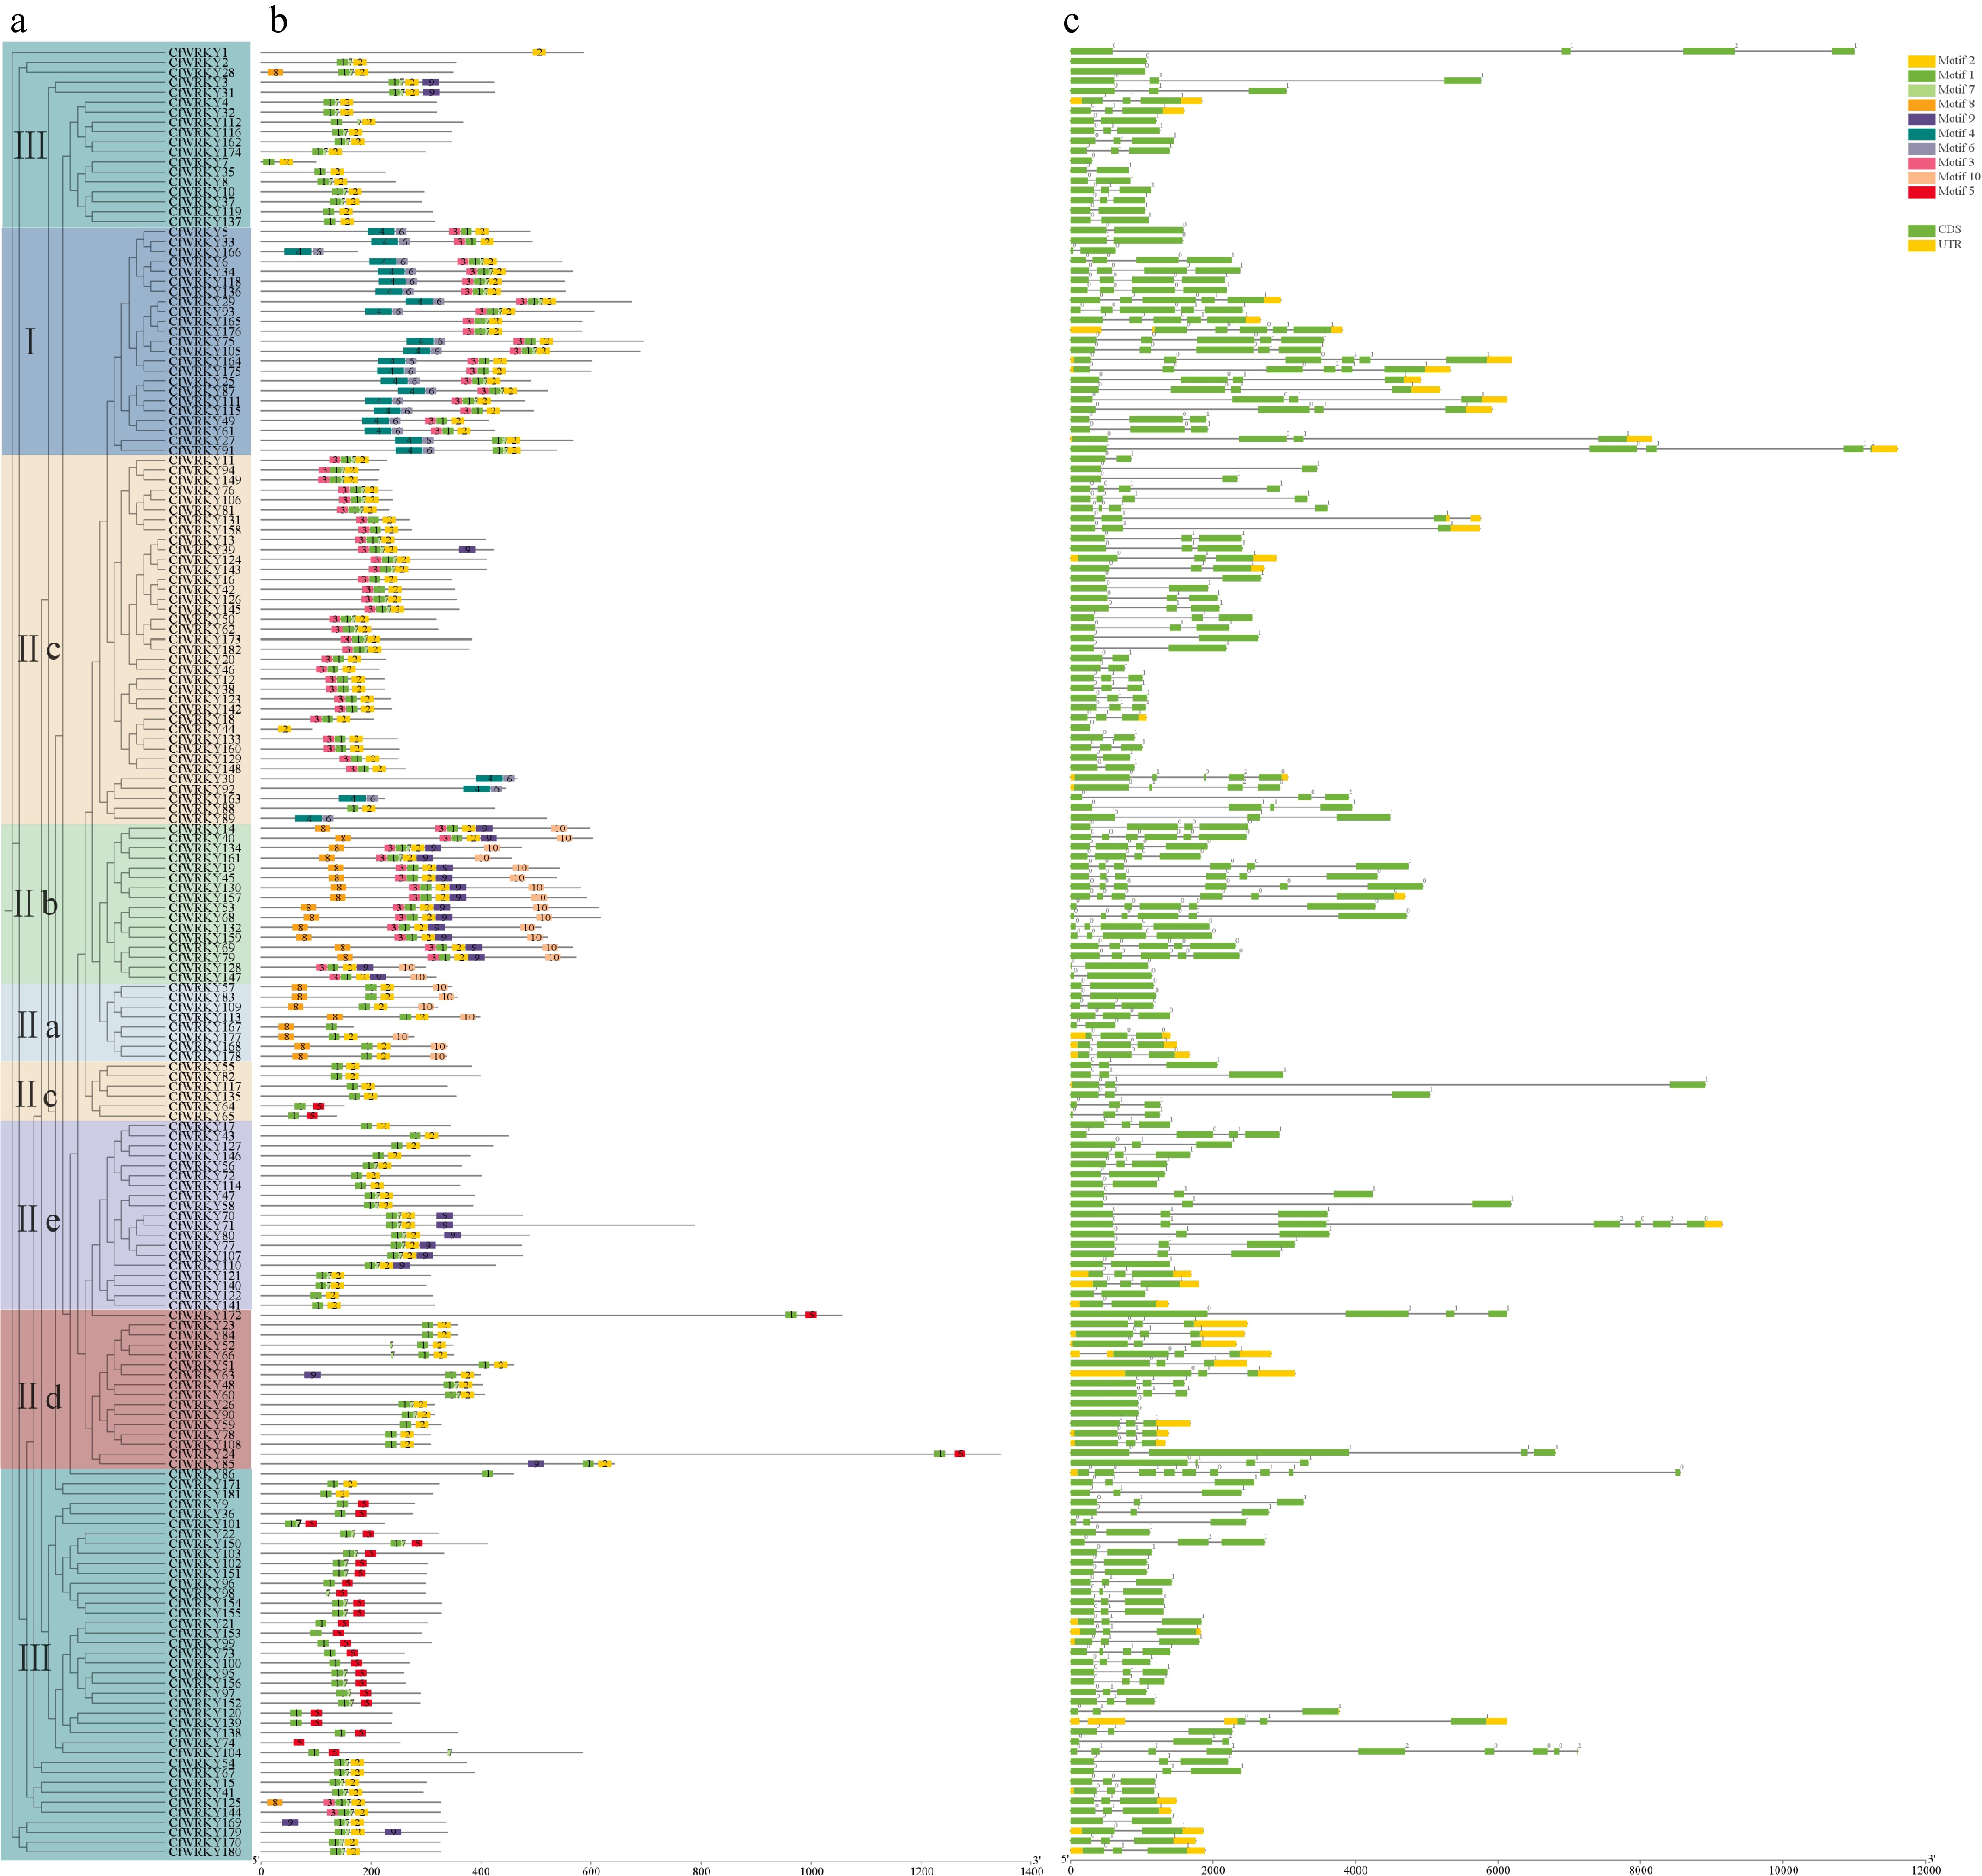
Figure 3.
Conserved motif architecture and exon–intron structures of CfWRKY genes. (a) MEME-derived motifs (motifs 1–10) along CfWRKY protein sequences, grouped by phylogenetic clades (I, II, III). (b) Exon–intron organizations of CfWRKY genes. Members within the same subgroup generally share similar motif composition/arrangement and comparable gene structures.
-
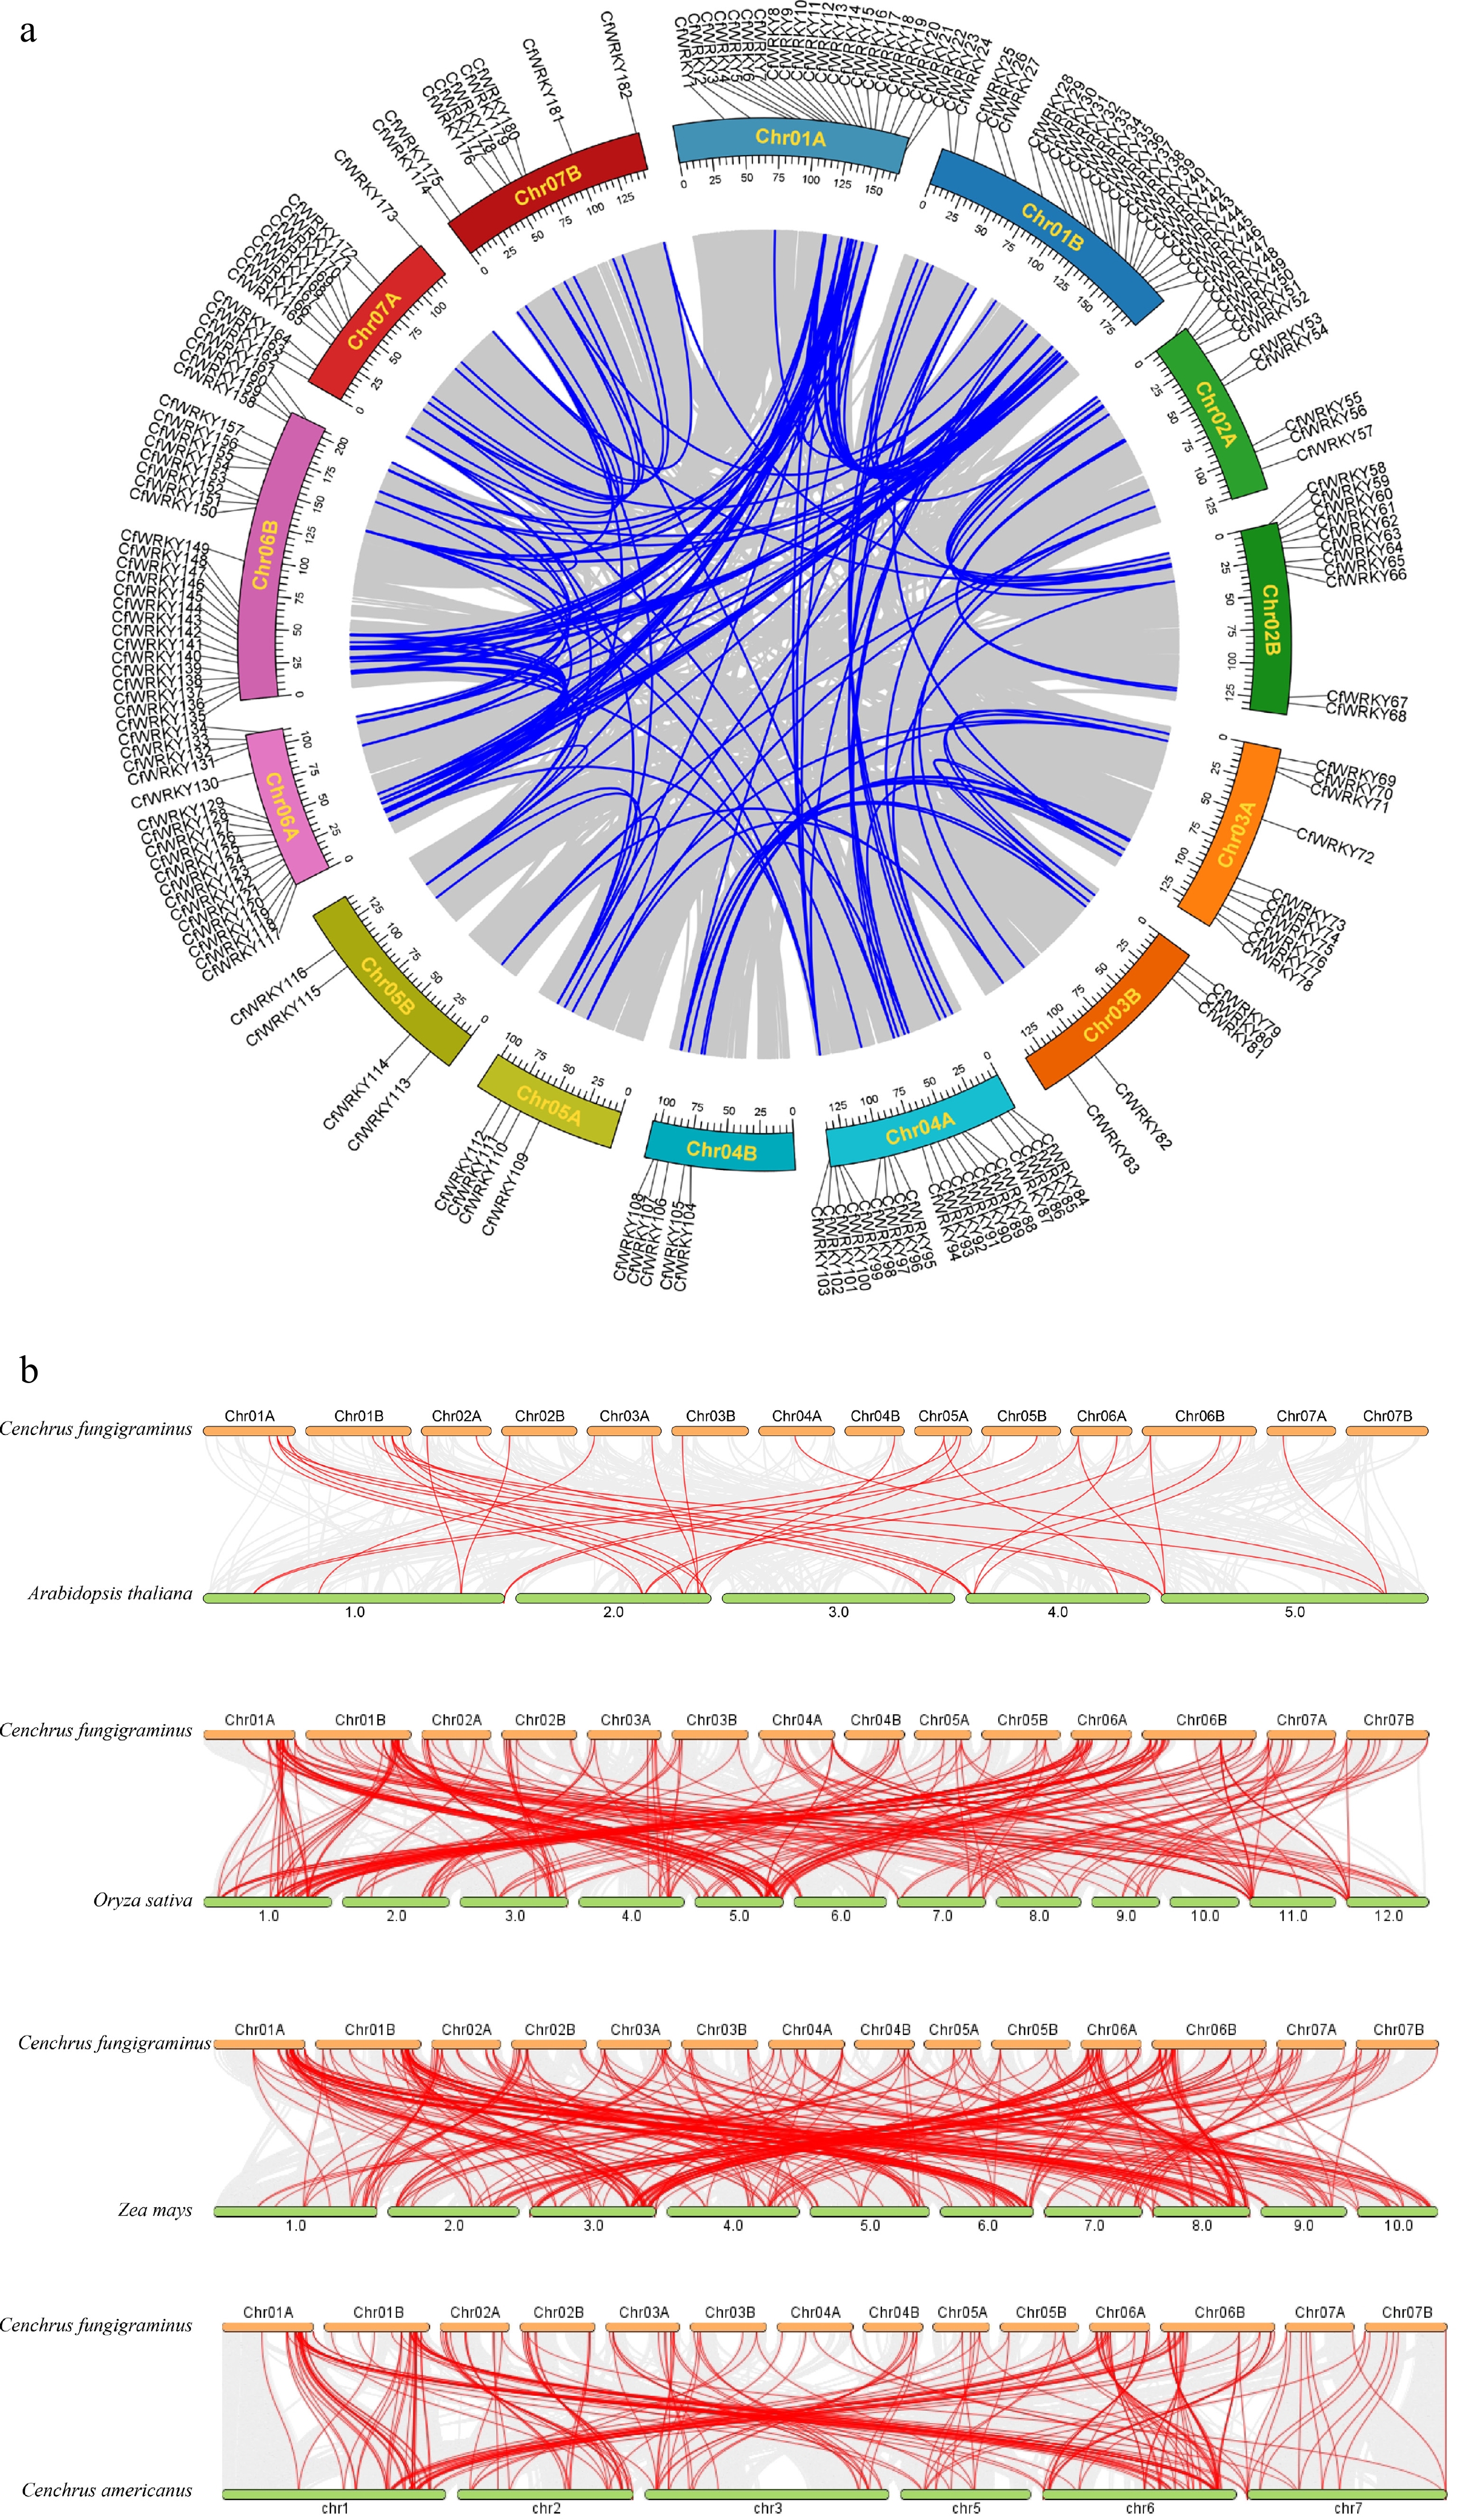
Figure 4.
Synteny analysis of the CfWRKY gene family. (a) Intraspecific synteny and chromosomal distribution of CfWRKY genes in C. fungigraminus. The outer track indicates the positions of 182 CfWRKY genes on 14 chromosomes (Chr01A–Chr07B). Blue lines inside the circle represent segmentally duplicated CfWRKY gene pairs. Chromosomes are drawn to scale (Mb). (b) Comparative interspecific synteny of WRKY genes between C. fungigraminus and A. thaliana, O. sativa, Z. mays, and C. americanus, illustrating conserved orthologous gene pairs and their evolutionary relationships.
-
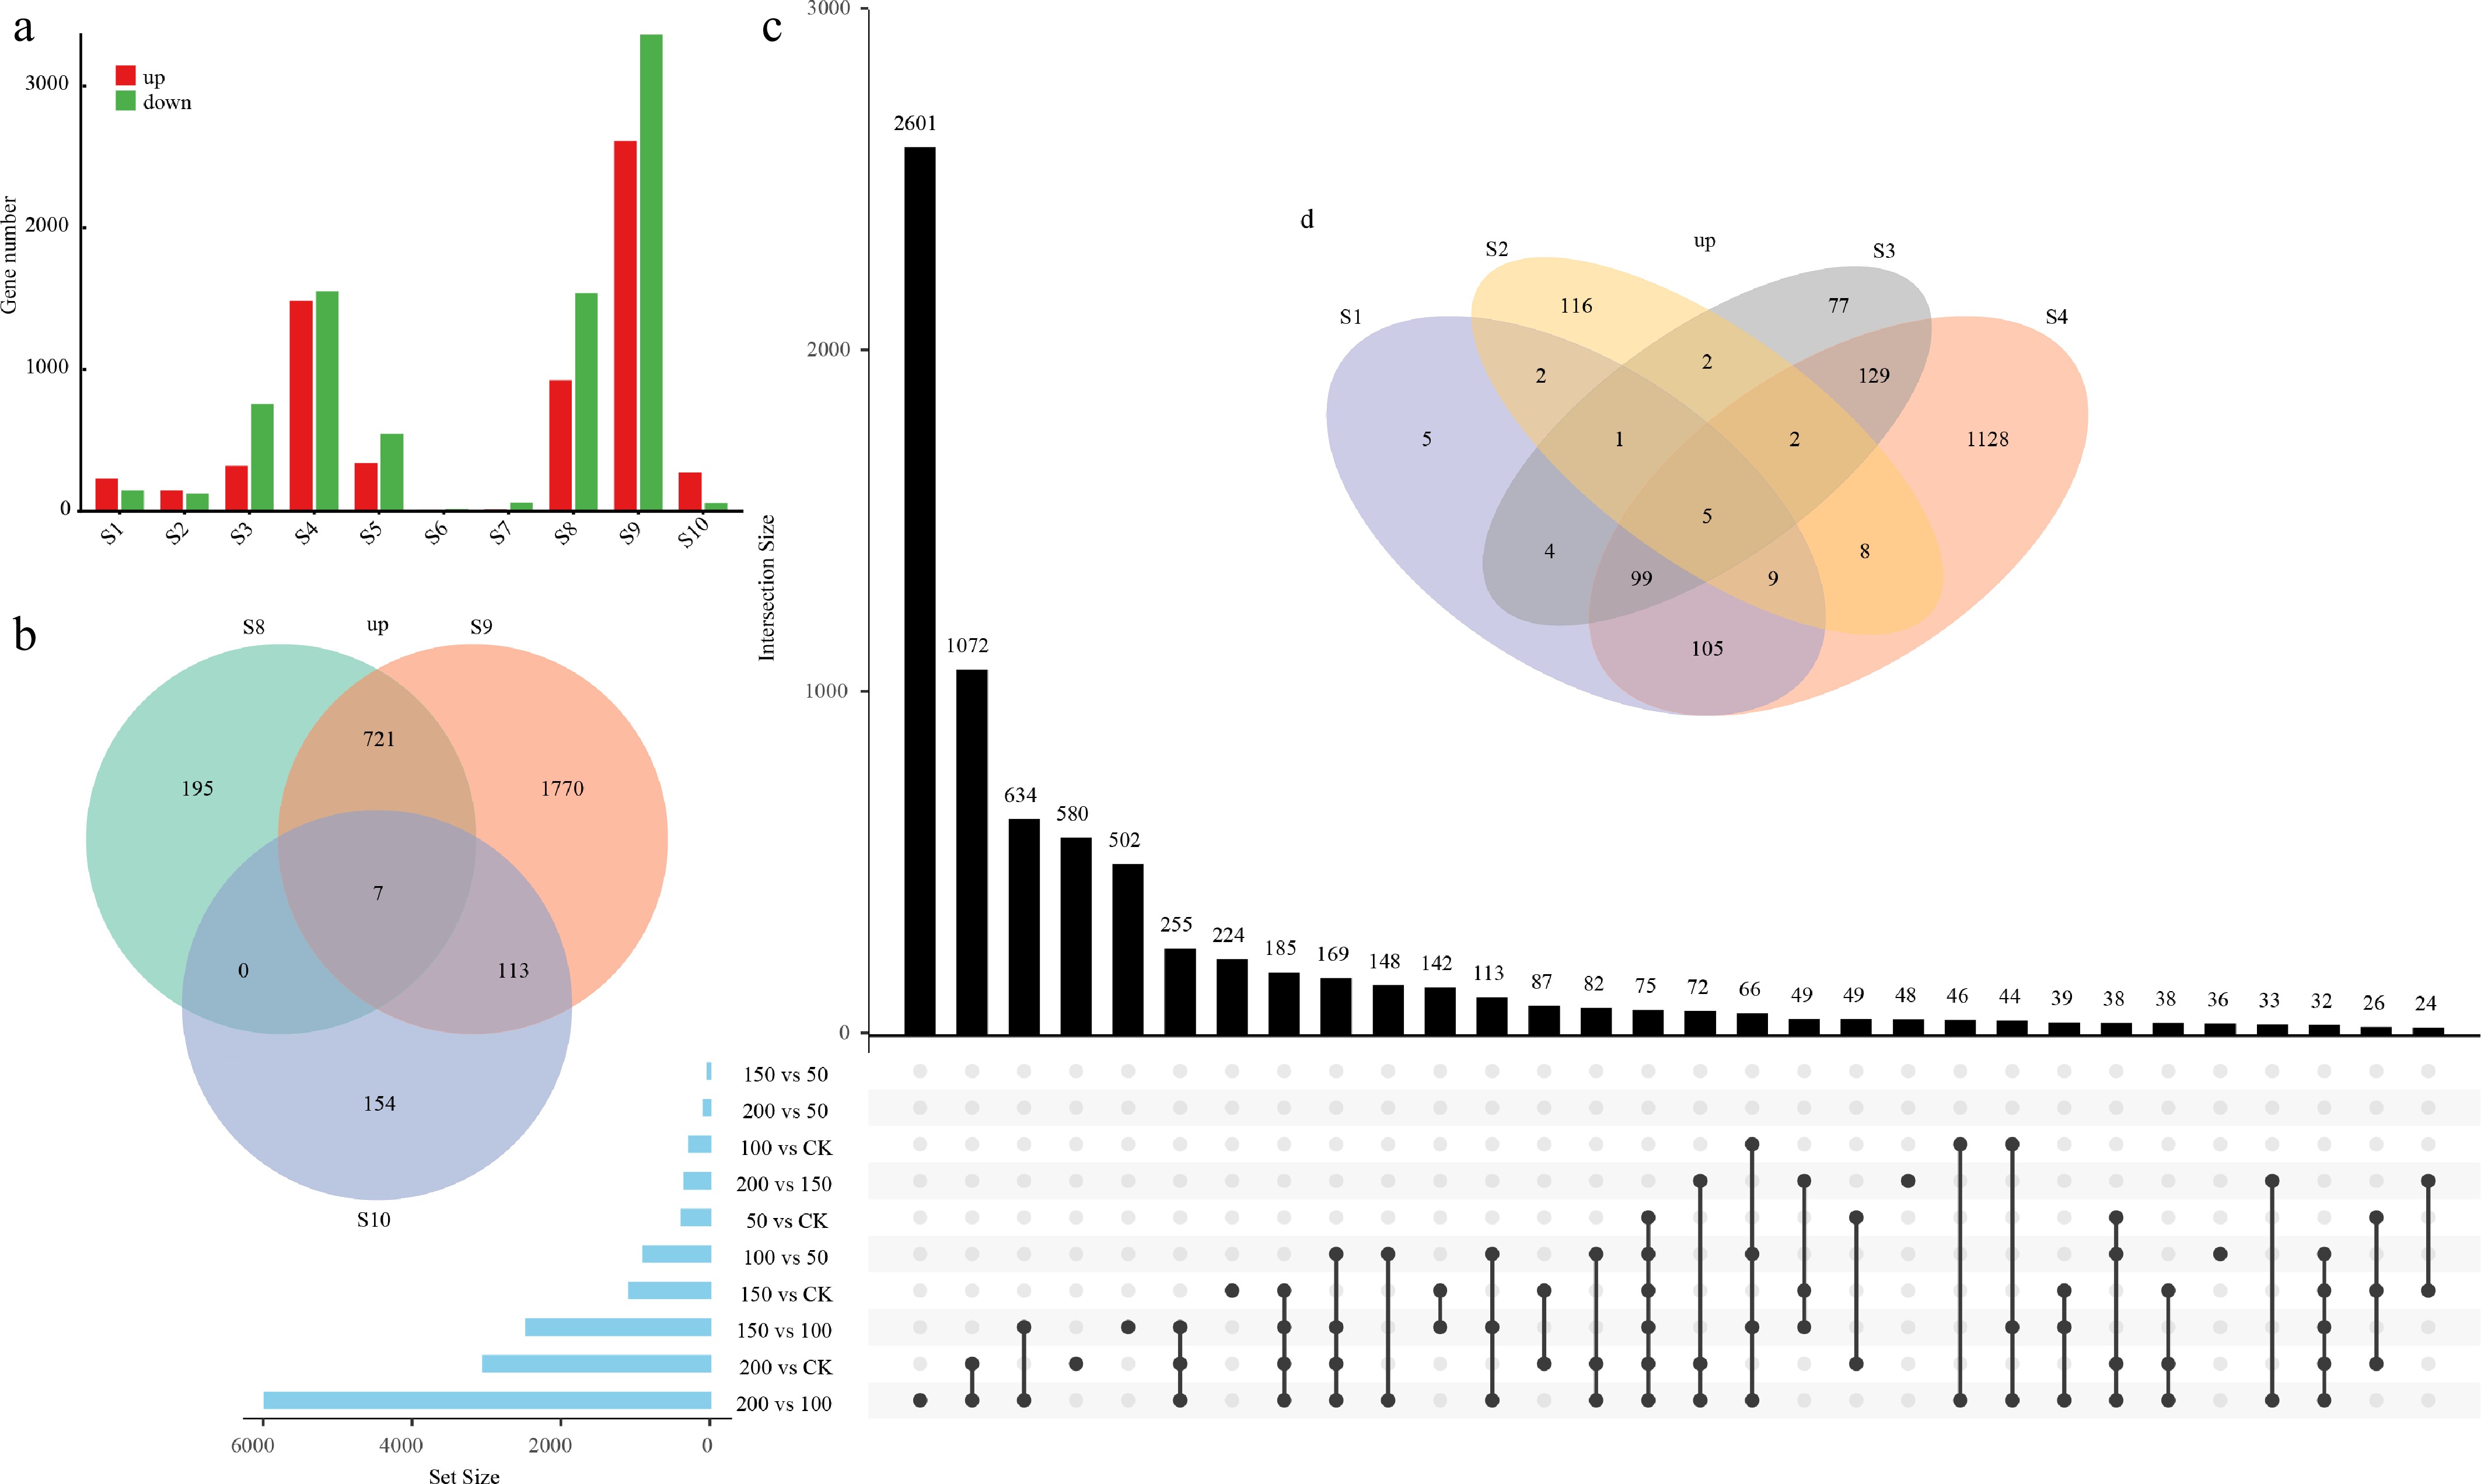
Figure 5.
Distribution and overlap of differentially expressed genes (DEGs) under various treatment conditions. (a) Numbers of upregulated and downregulated DEGs identified in each comparison group (S1–S10). The comparison groups are defined as follows: S1, 50 vs CK; S2, 100 vs CK; S3, 150 vs CK; S4, 200 vs CK; S5, 100 vs 50; S6, 150 vs 50; S7, 200 vs 50; S8, 150 vs 100; S9, 200 vs 100; and S10, 200 vs 150. The variation in DEG numbers across comparisons reflects the transcriptional responses under different stress intensities and contrasts. (b) Venn diagram showing the shared and unique upregulated DEGs among S8 (150 vs 100), S9 (200 vs 100), and S10 (200 vs 150). (c) UpSet plot illustrating the intersection patterns and set sizes of DEGs across all comparison groups (S1–S10), revealing both common and distinct transcriptional responses across the stress gradient. (d) Venn diagram showing the overlap of upregulated DEGs among S1 (50 vs CK), S2 (100 vs CK), S3 (150 vs CK), and S4 (200 vs CK), highlighting the core stress-responsive genes under increasing treatment intensities relative to the control.
-
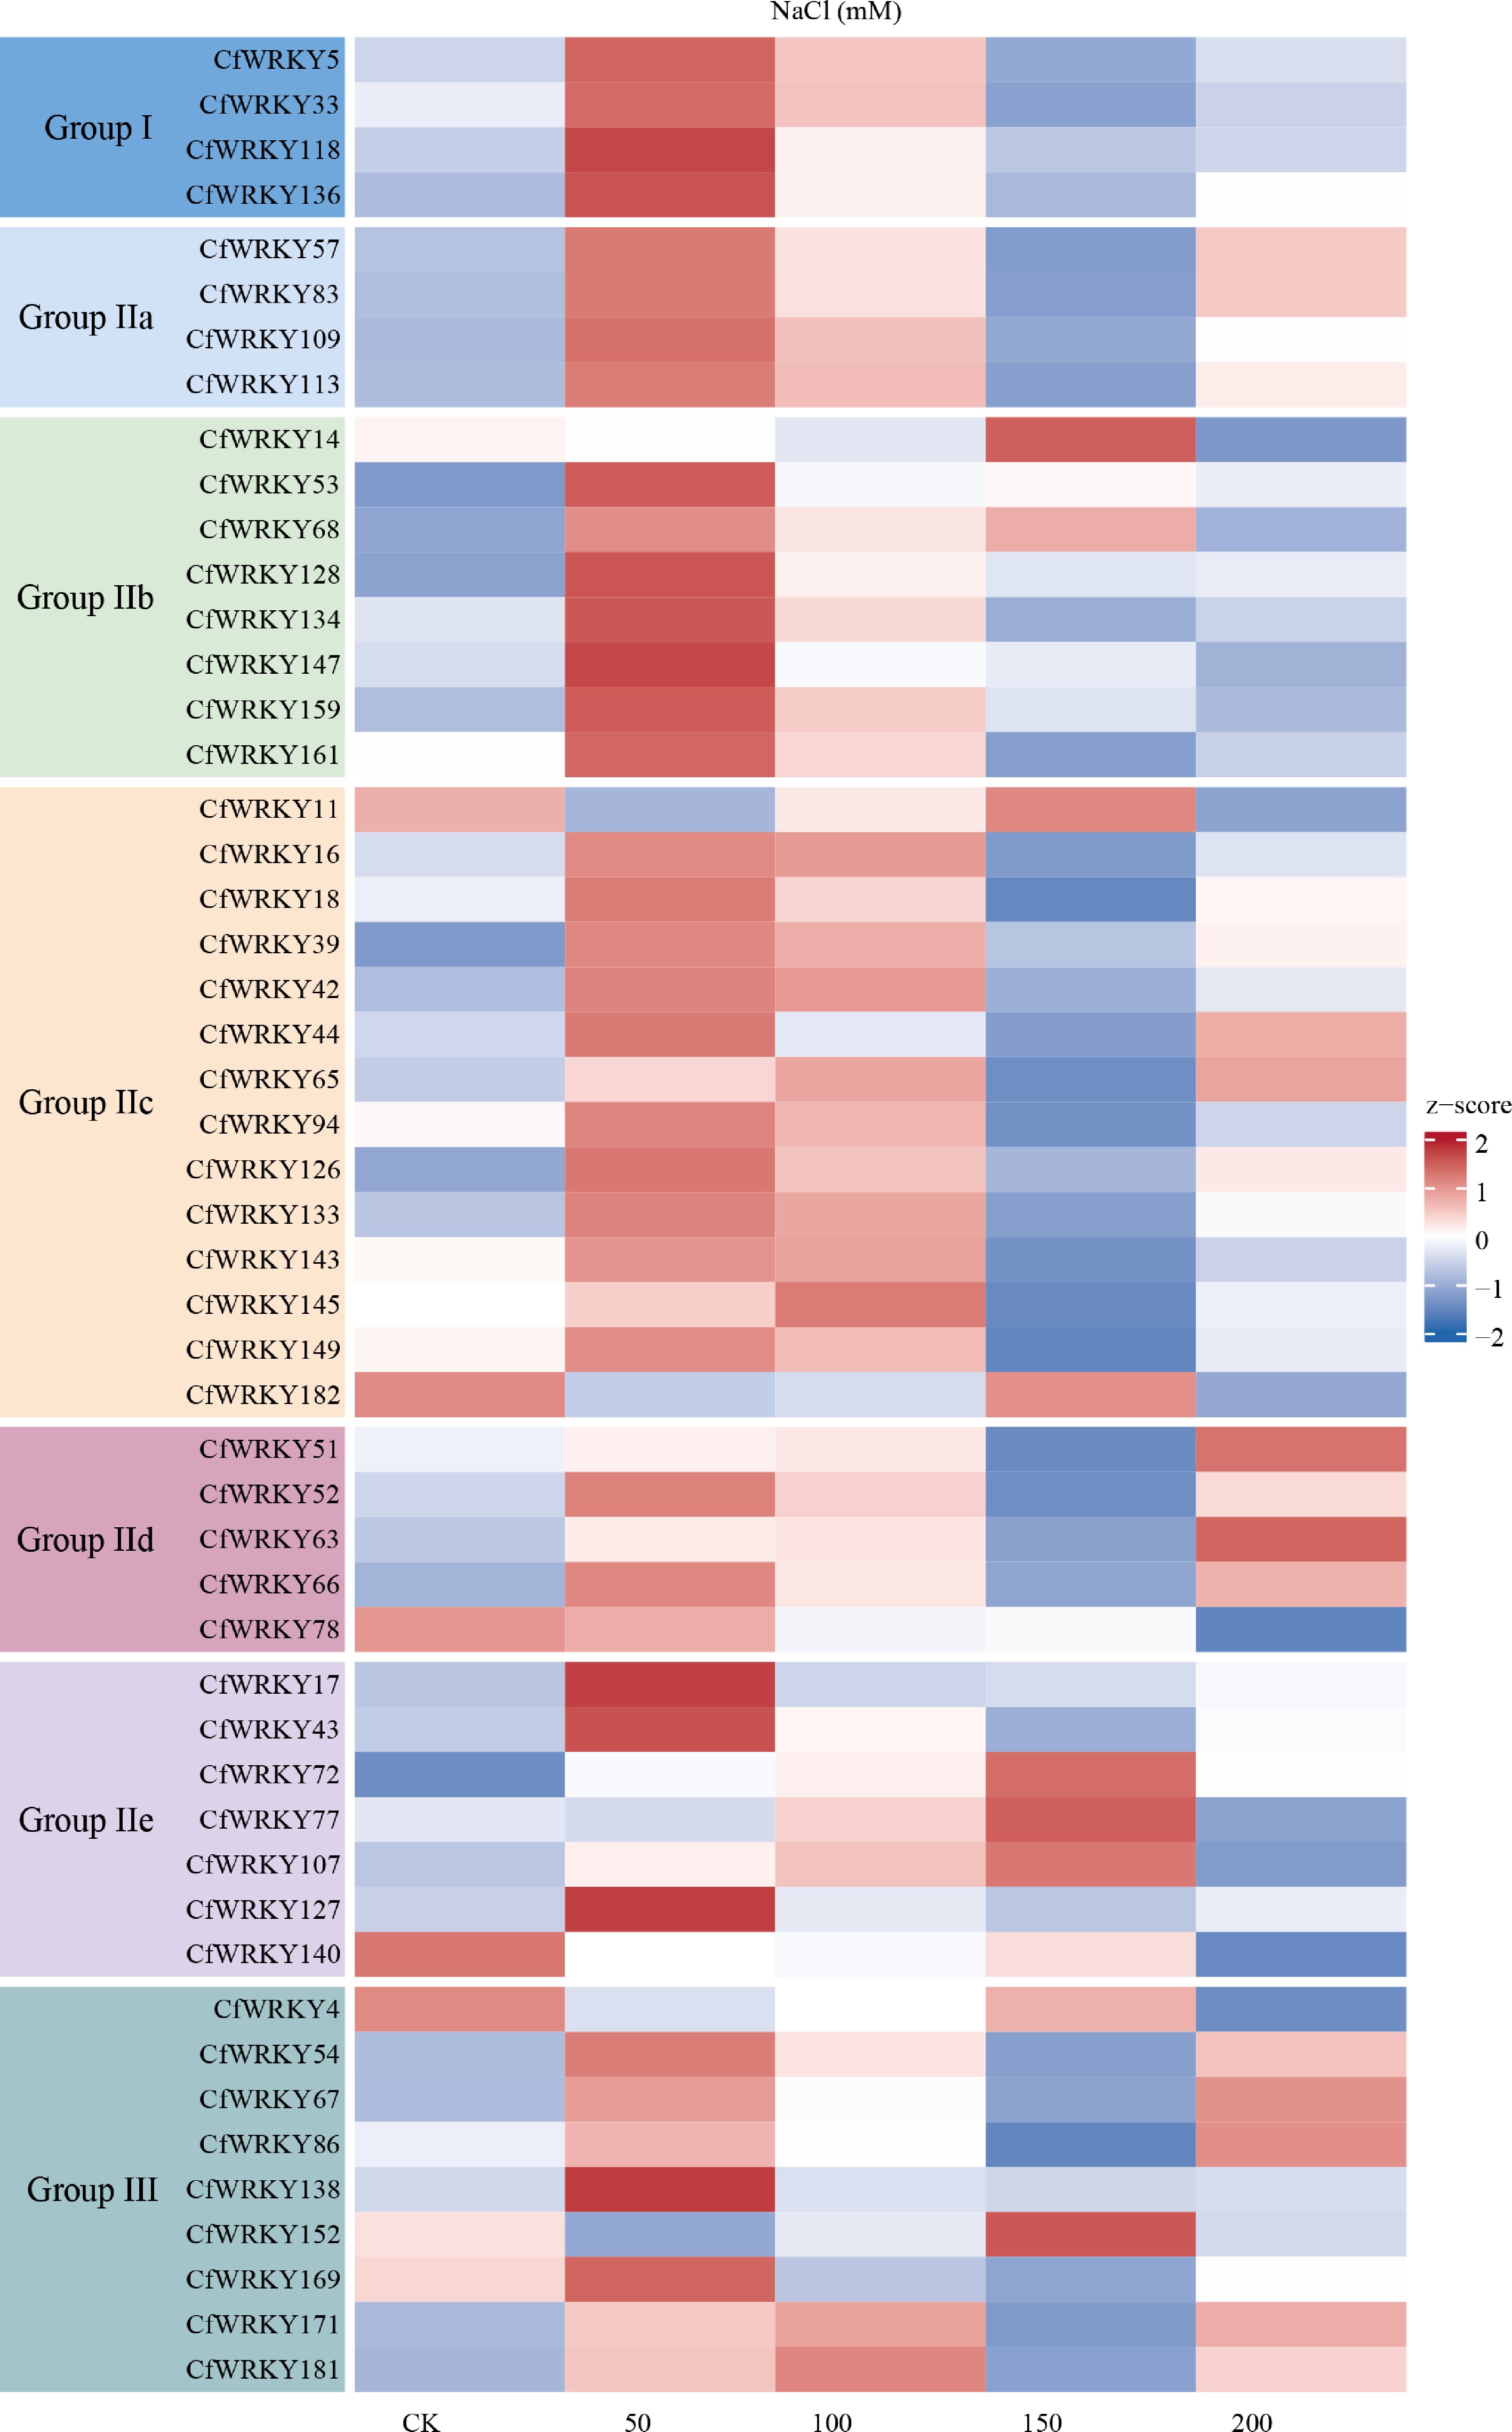
Figure 6.
Heatmap of WRKY transcription factor (TF) gene expression in C. fungigraminus under salt stress. Gene expression levels were derived from RNA-seq data and transformed as log2(TPM + 1) for visualization. The x-axis shows control (CK) and NaCl treatments at 50, 100, 150, and 200 mM with biological replicates; the y-axis lists all 51 WRKY family members. The color scale represents relative expression from low (blue) to high (red), and genes are organized by phylogenetic group, as indicated by colored blocks on the left.
-
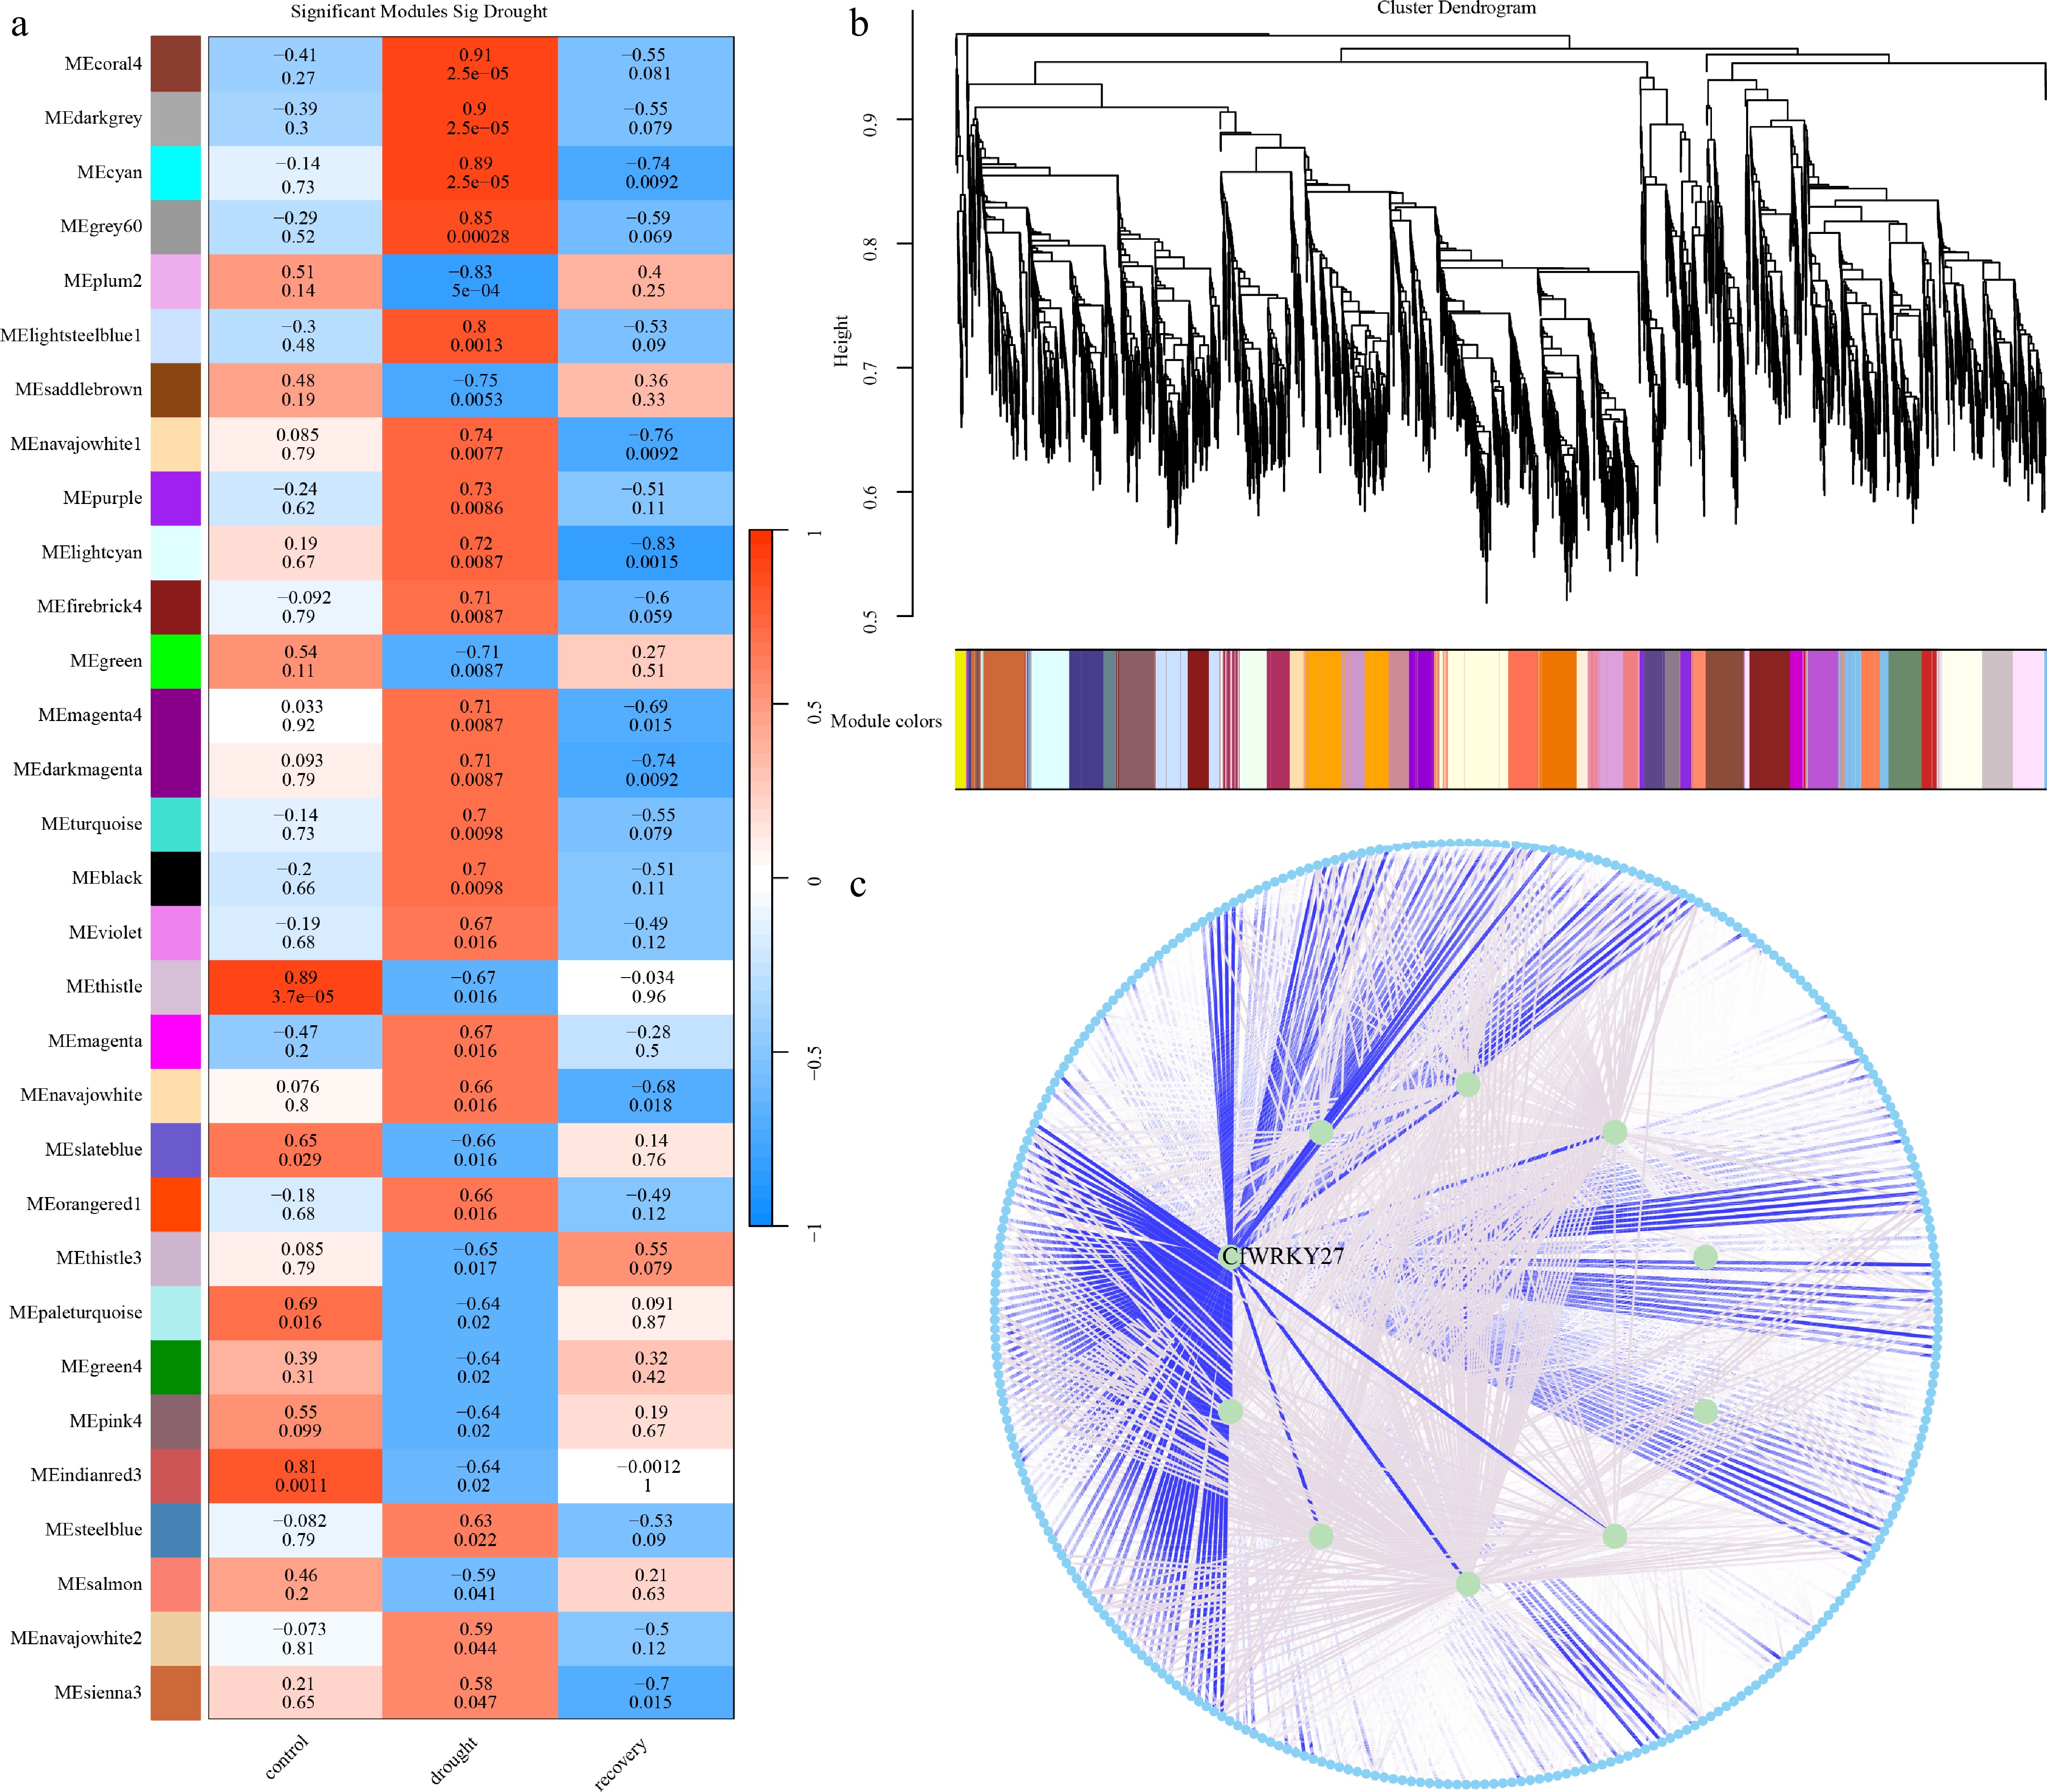
Figure 7.
WRKY-associated drought modules and hub network in C. fungigraminus. (a) Module–trait correlations under control, drought, and recovery conditions, showing drought-responsive modules. (b) Gene clustering dendrogram and WGCNA module assignment. (c) Drought-responsive coexpression network highlighting the hub transcription factor CfWRKY27, which displays strong connectivity with stress-related genes.
Figures
(7)
Tables
(0)