-
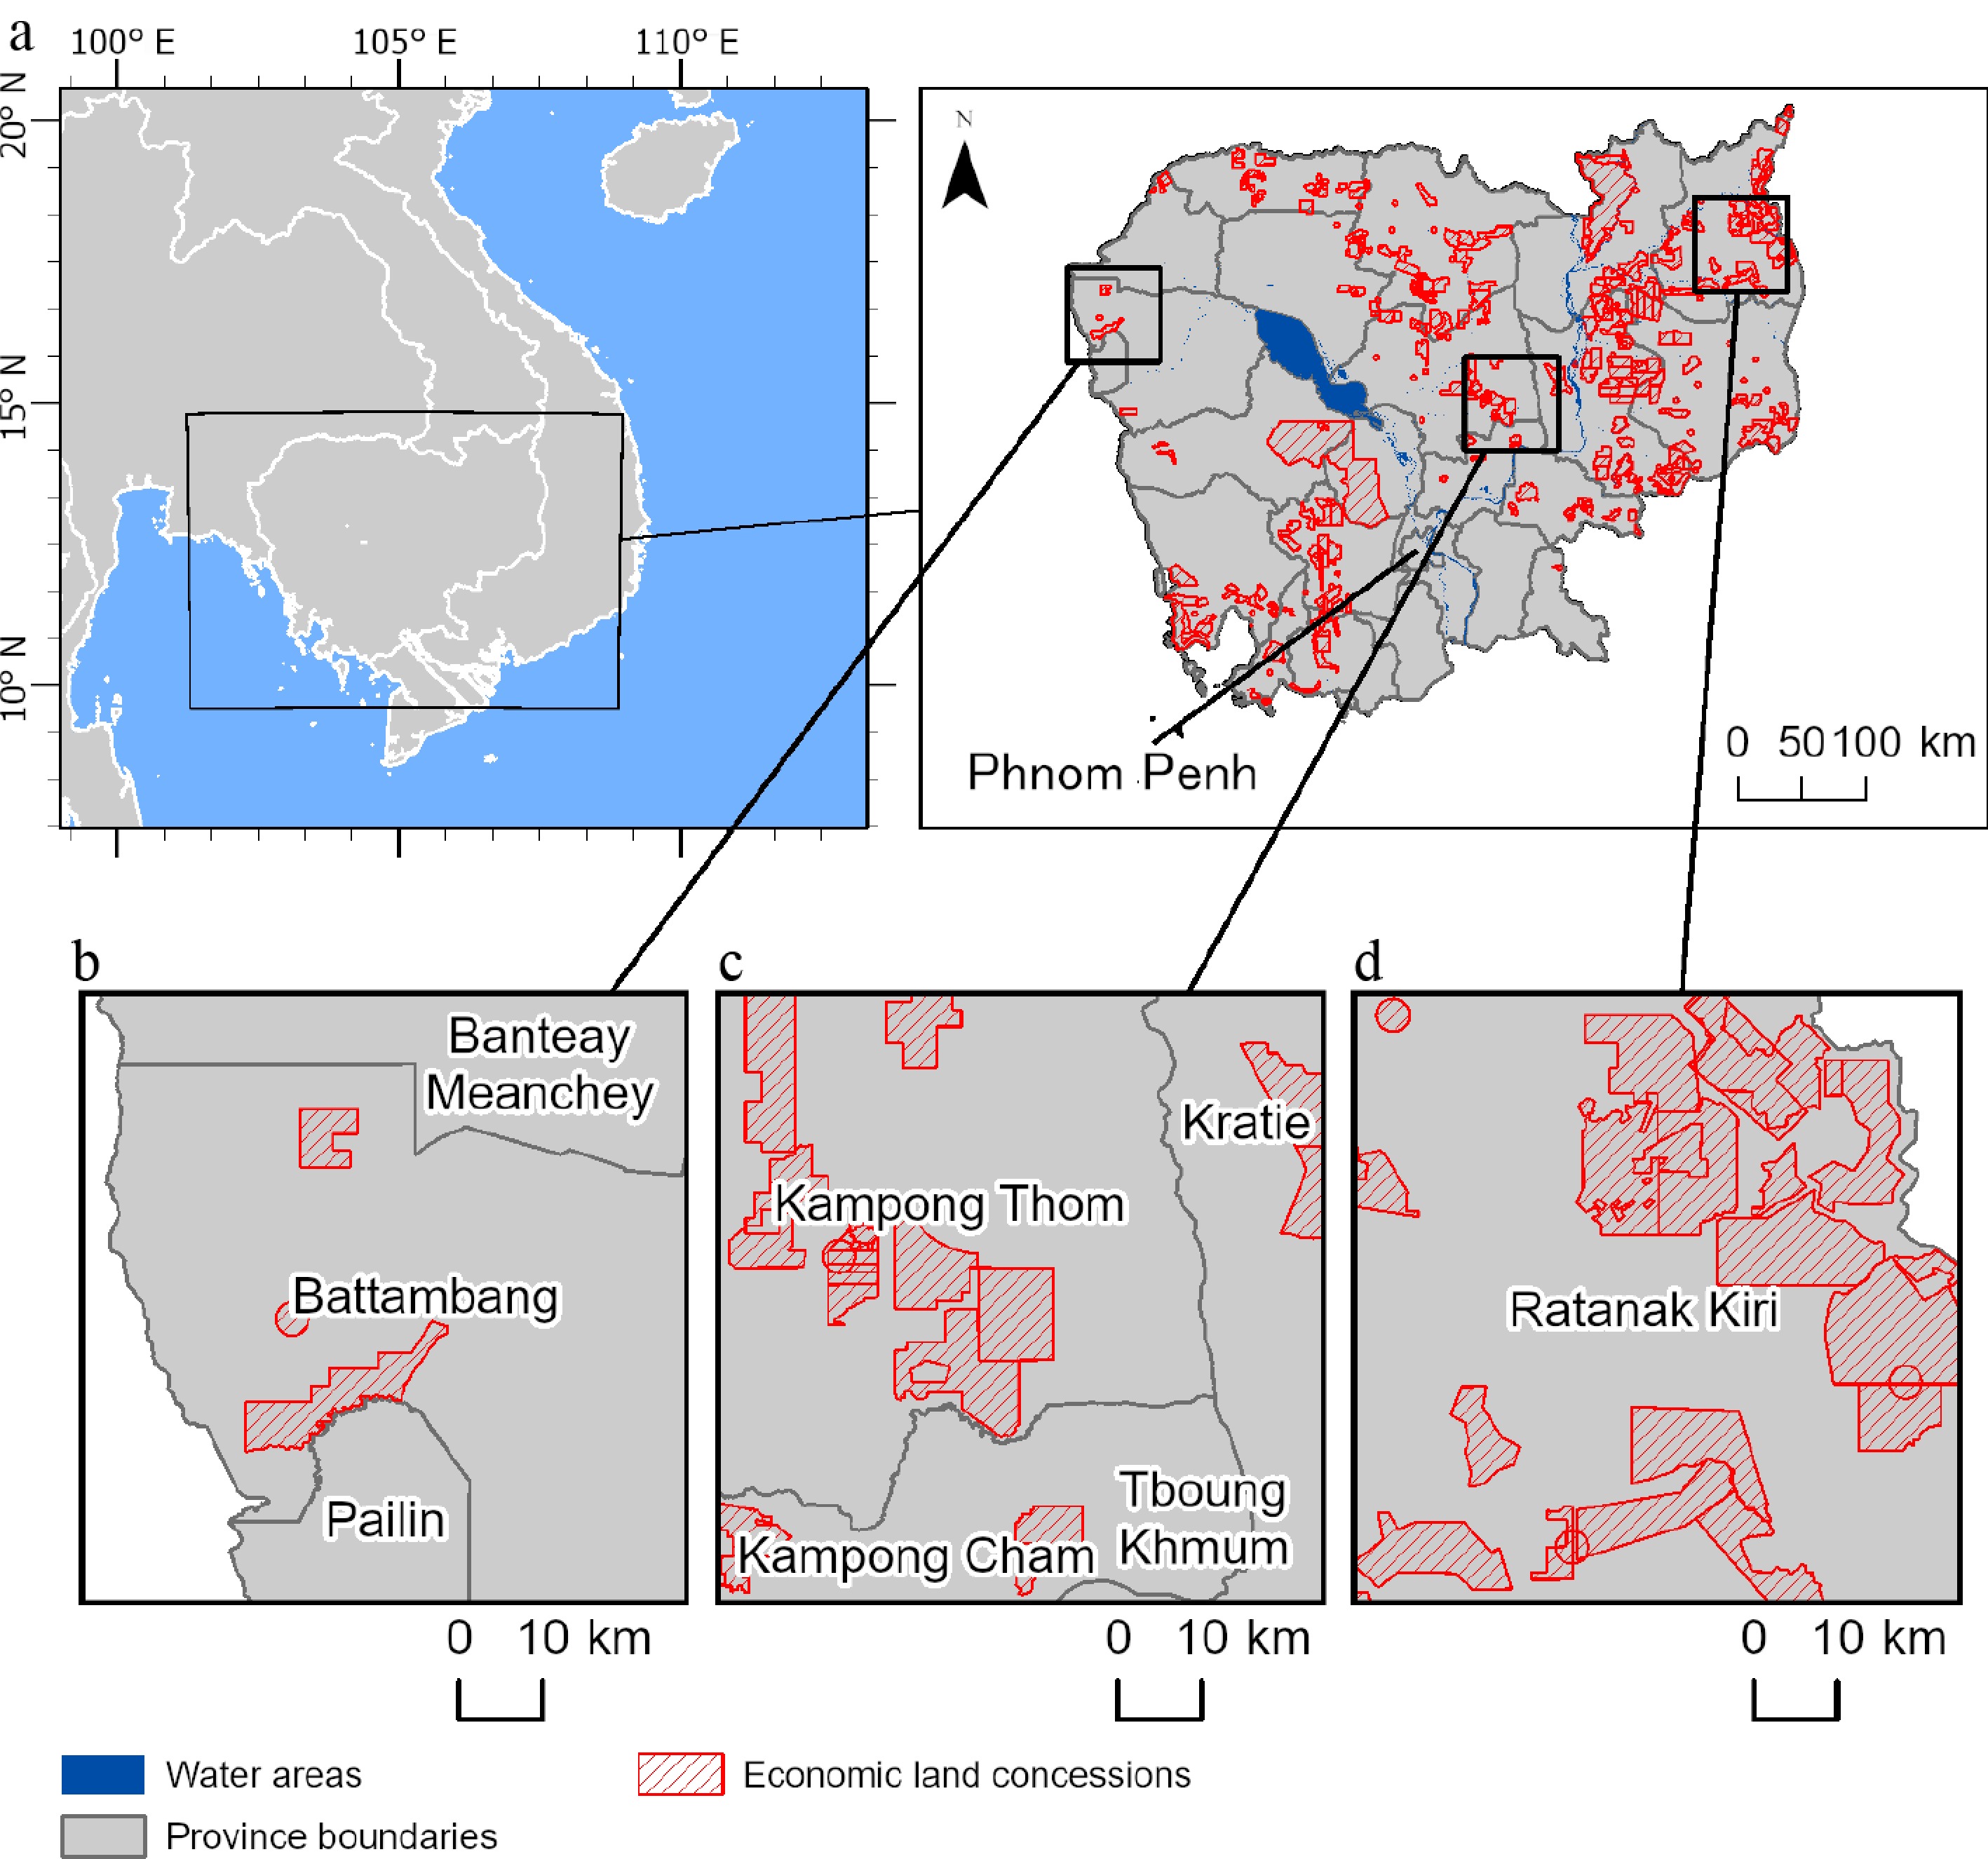
Figure 1.
Study area showing provincial boundaries, water areas, and distribution of Economic Land Concessions (ELCs).
-
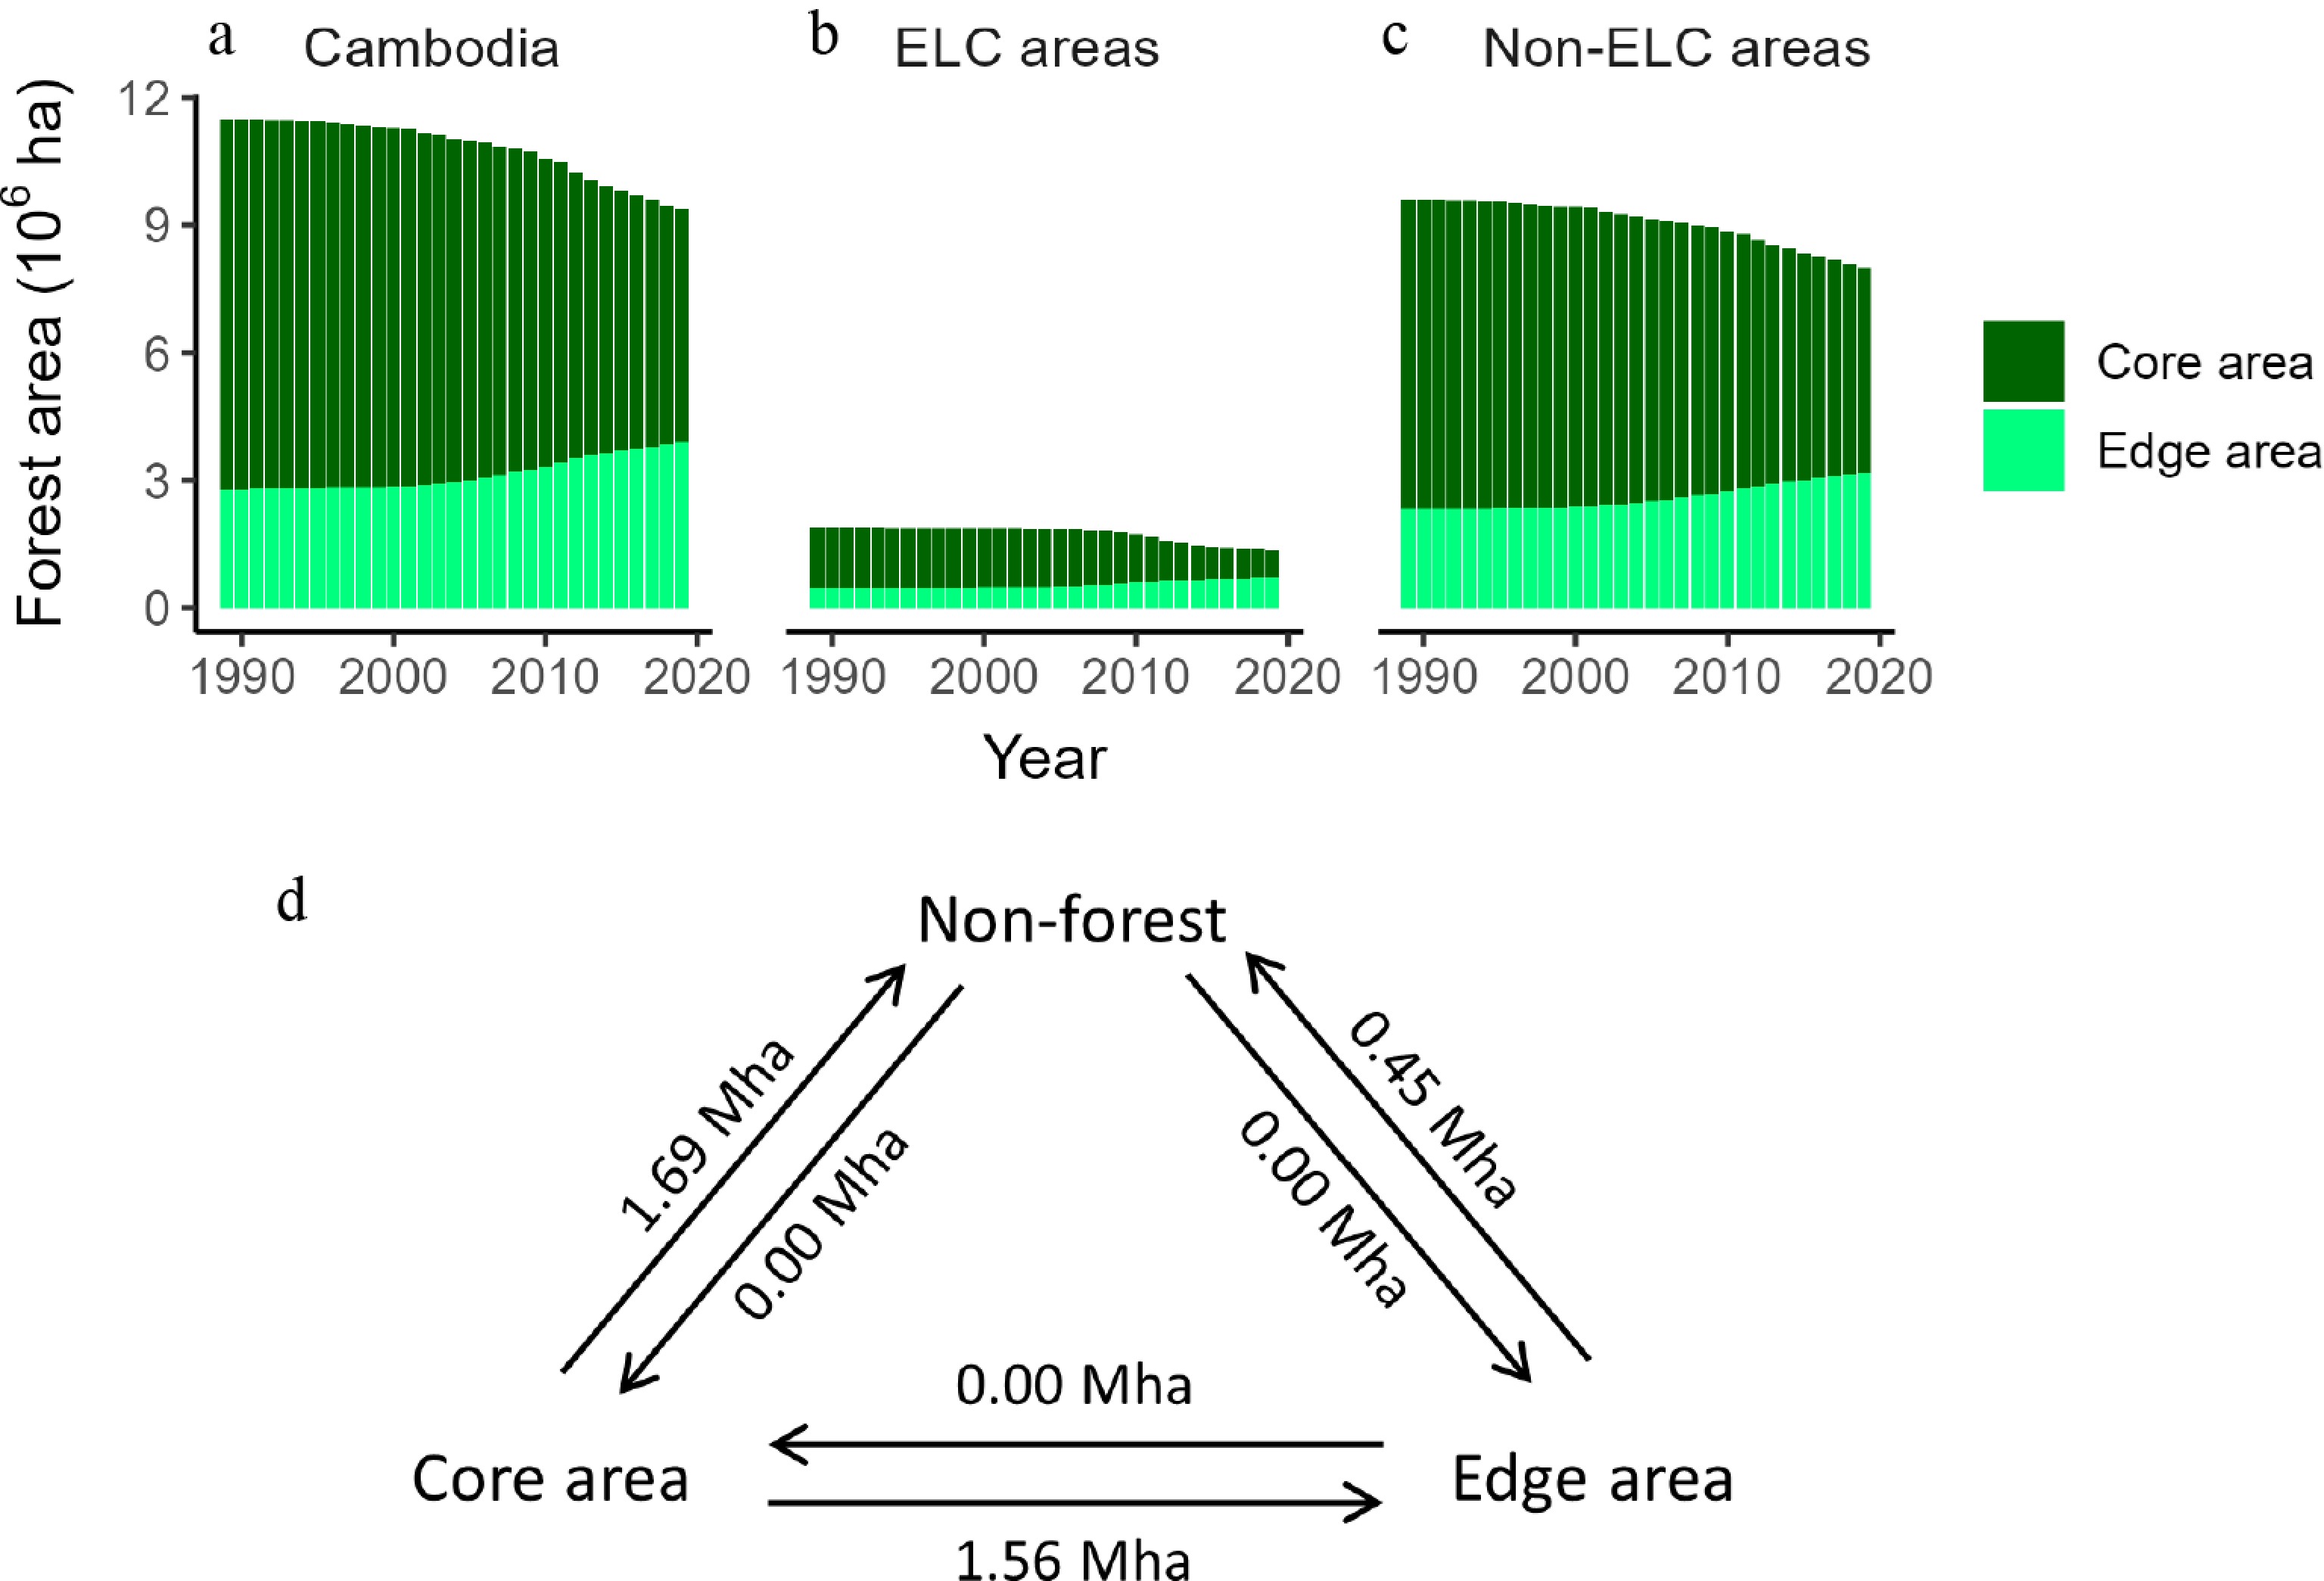
Figure 2.
Annual changes in forest cover and transitions from 1989 to 2019. (a) Forest cover trends for Cambodia; (b) forest cover trends inside ELC areas; (c) forest cover trends outside ELC areas; (d) area transitions among core forest, edge forest, and non-forest for Cambodia as a whole.
-
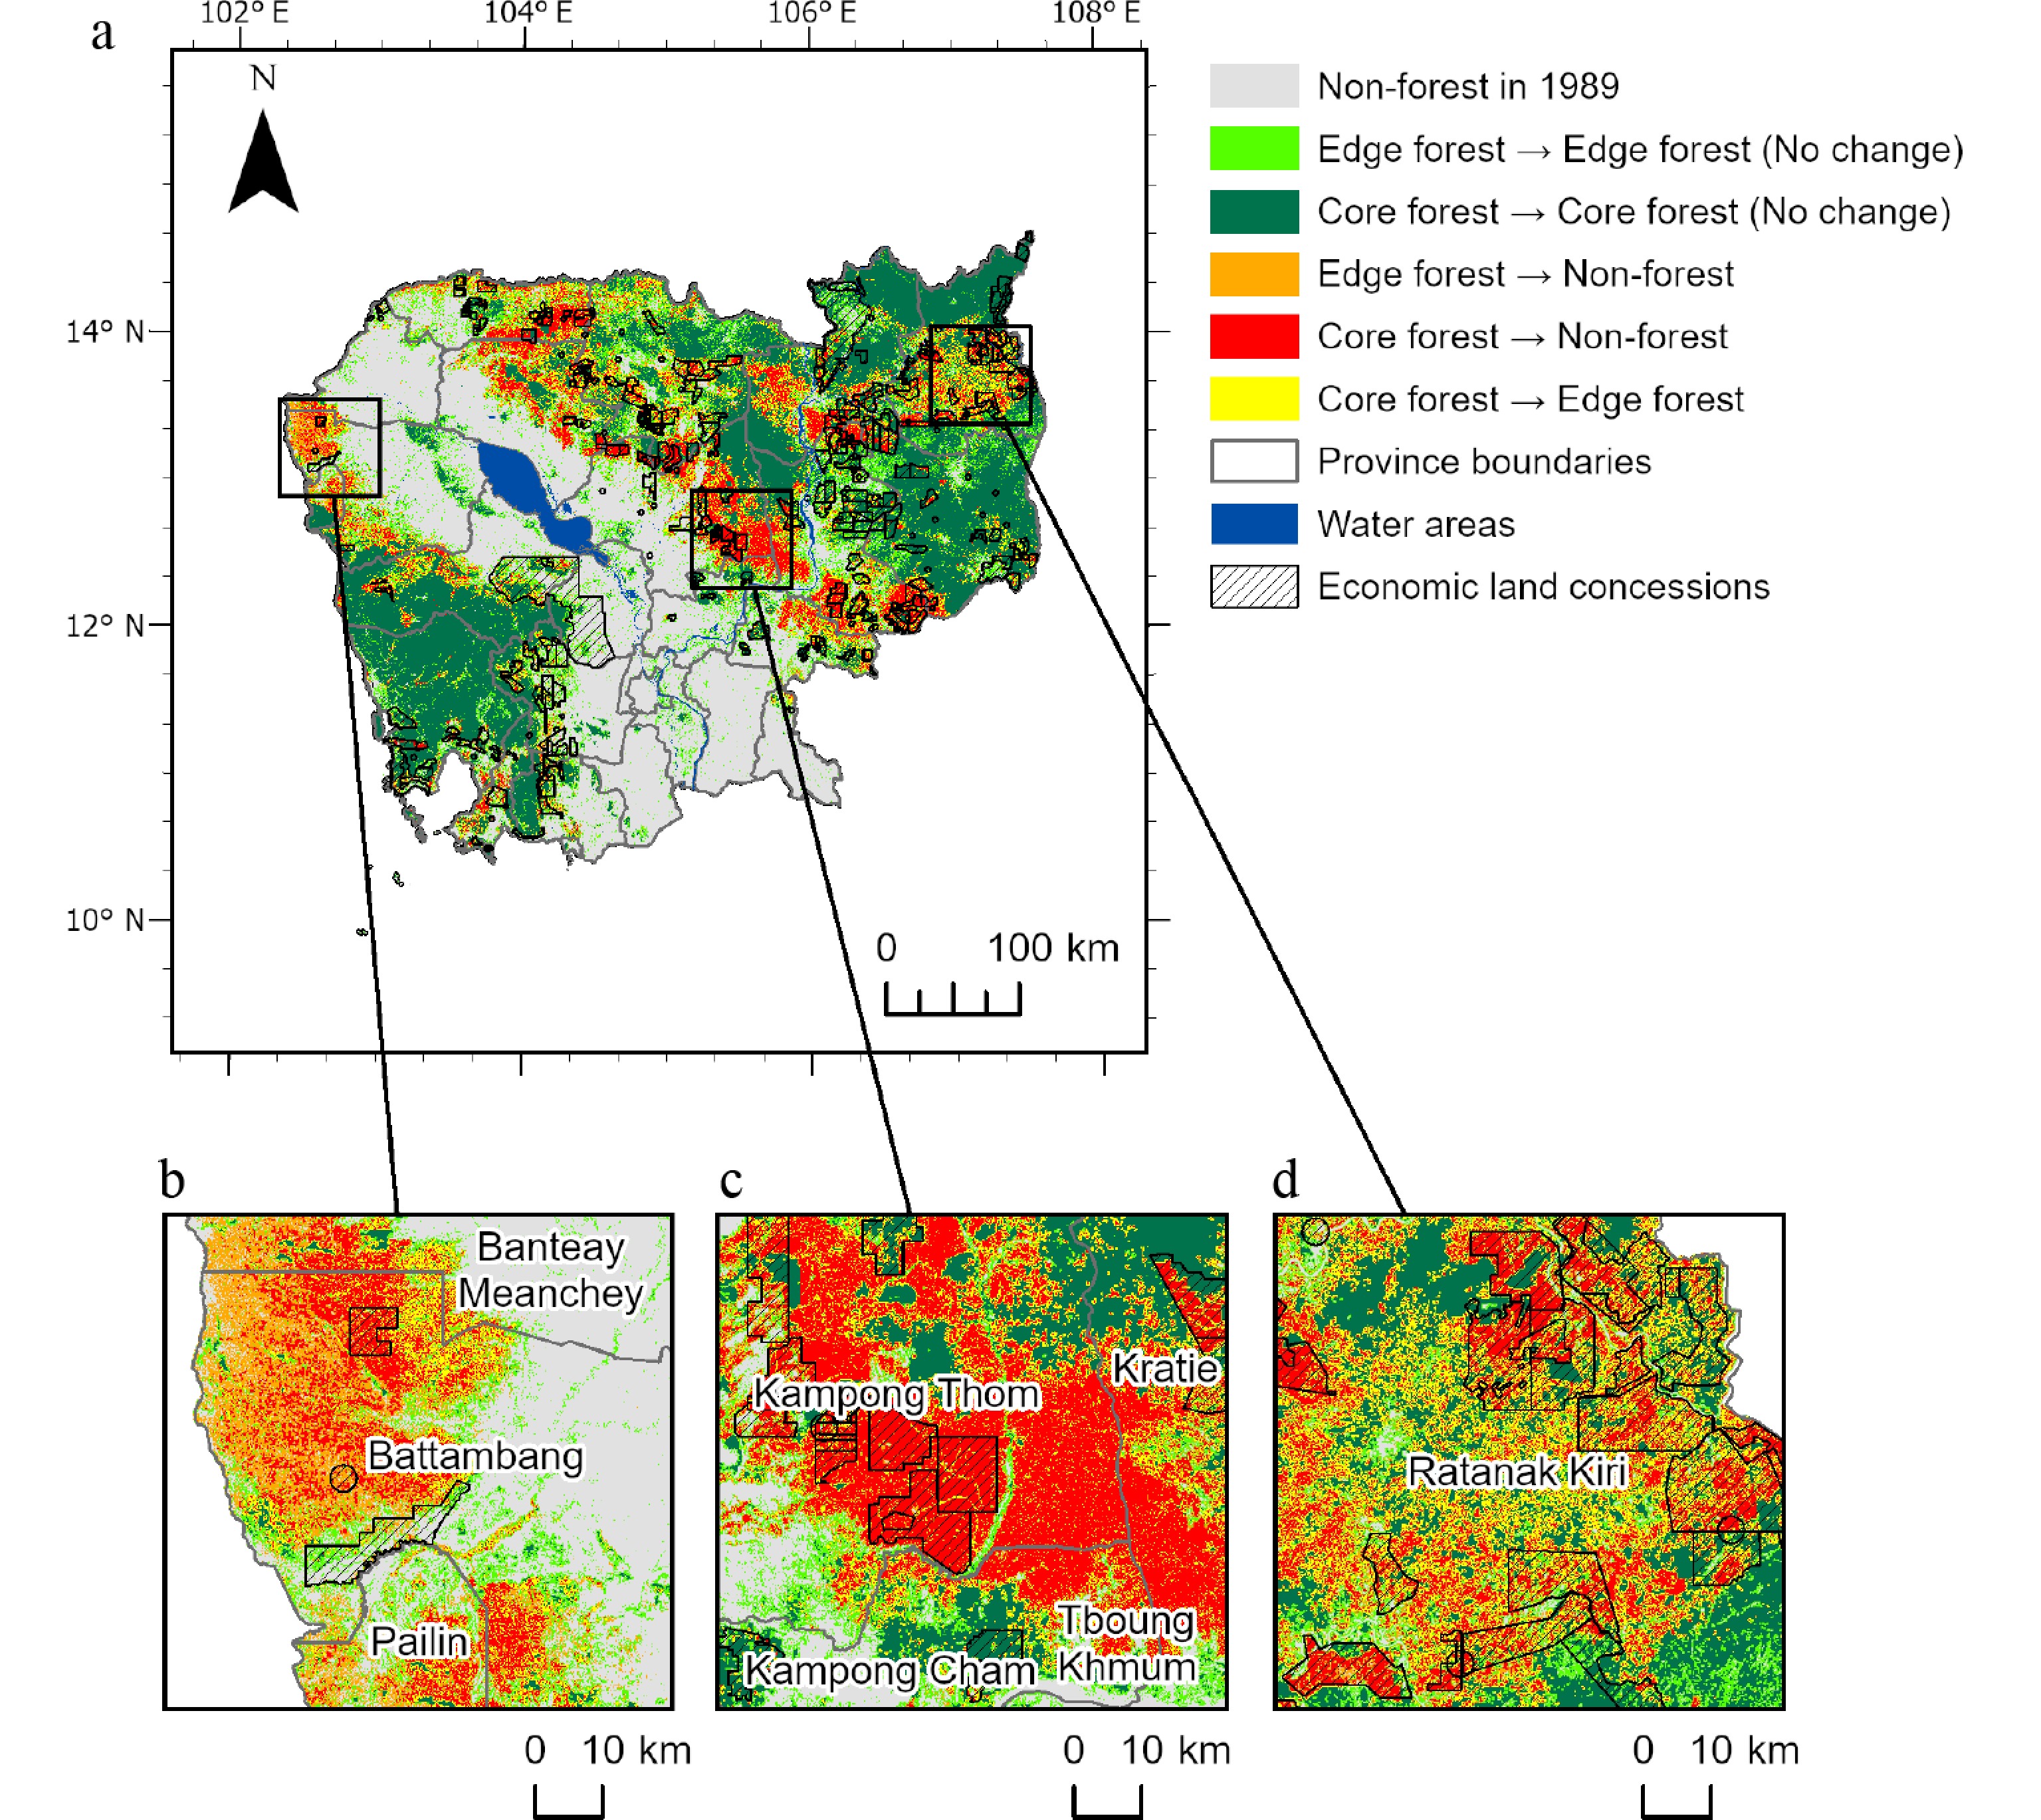
Figure 3.
Spatial patterns of forest status transitions (1989–2019) across Cambodia. (a) Forest cover changes across the entire country. (b) Changes in forest cover in the western region of Cambodia, near the Thai border in Battambang and Pailin Provinces. (c) Changes in forest cover in the central region of Cambodia, around Kampong Thom Province. (d) Changes in forest cover in the northeastern region of Cambodia, around Ratanakiri Province.
-
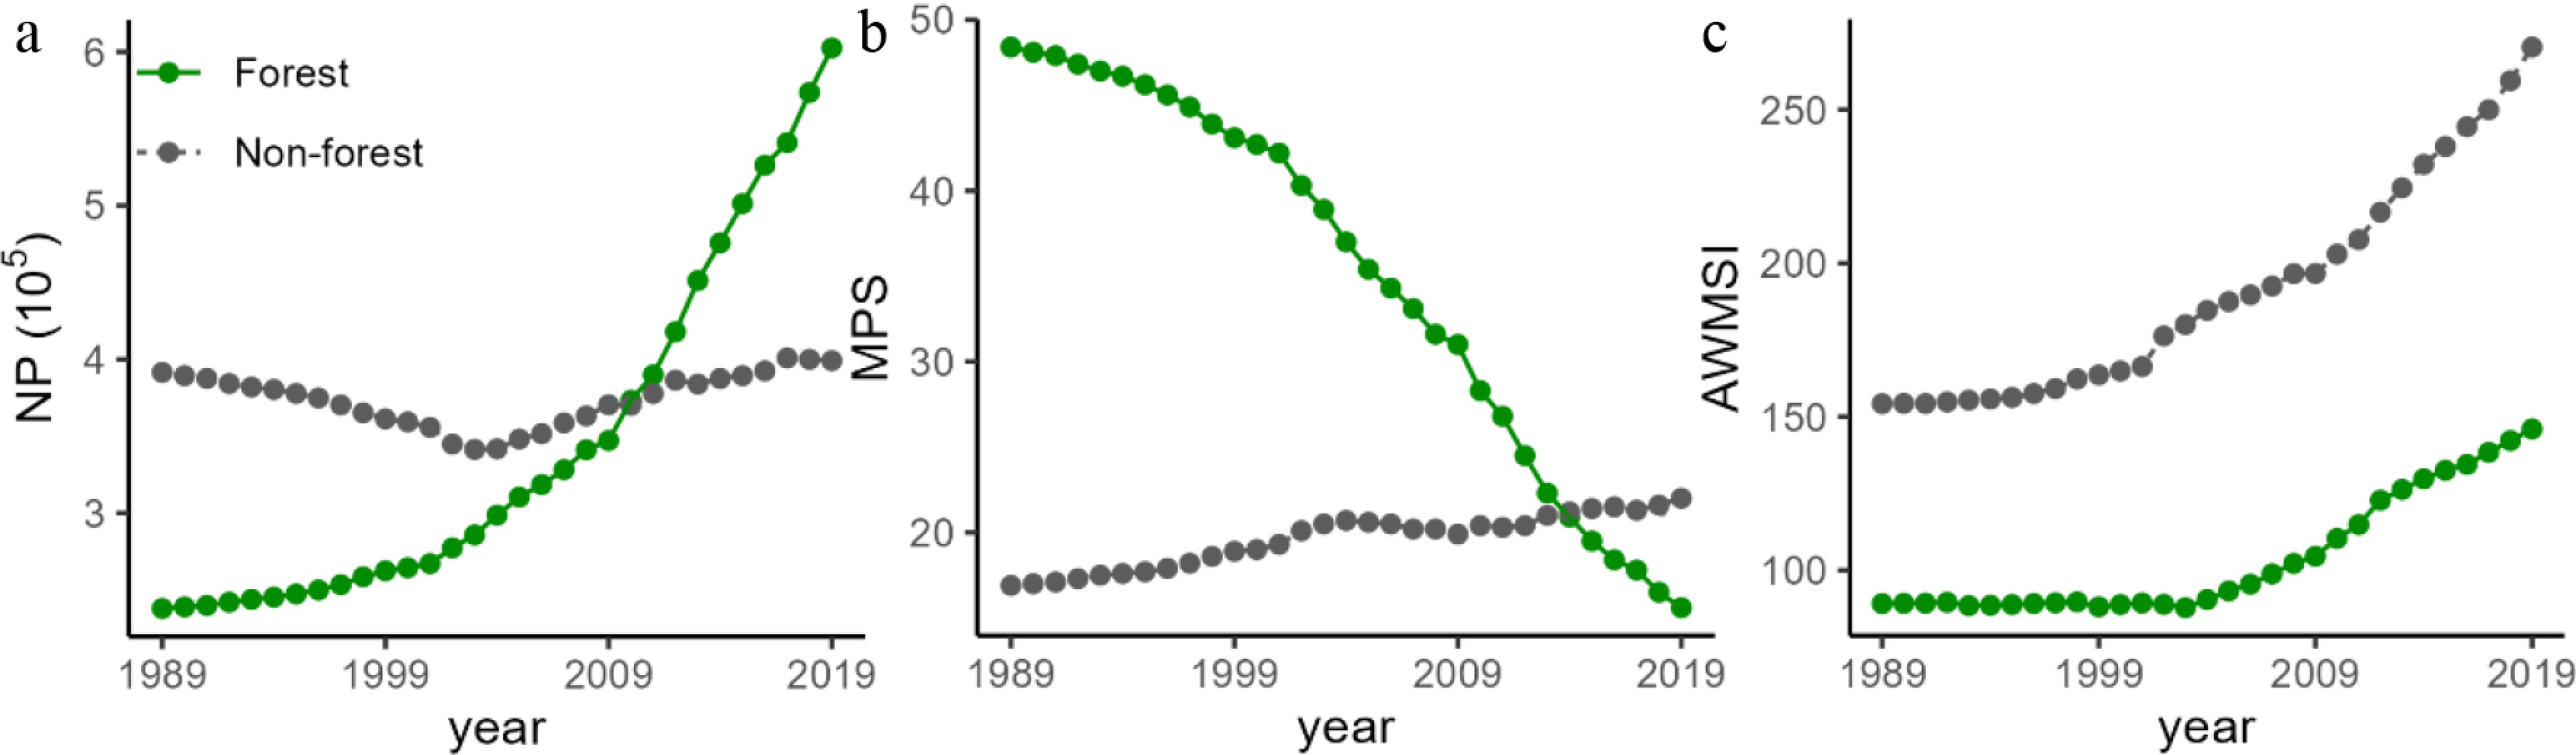
Figure 4.
Temporal trends in forest landscape metrics from 1989 to 2019. (a) Number of patches (NP), (b) mean patch size (MPS), (c) area-weighted mean shape index (AWMSI).
-
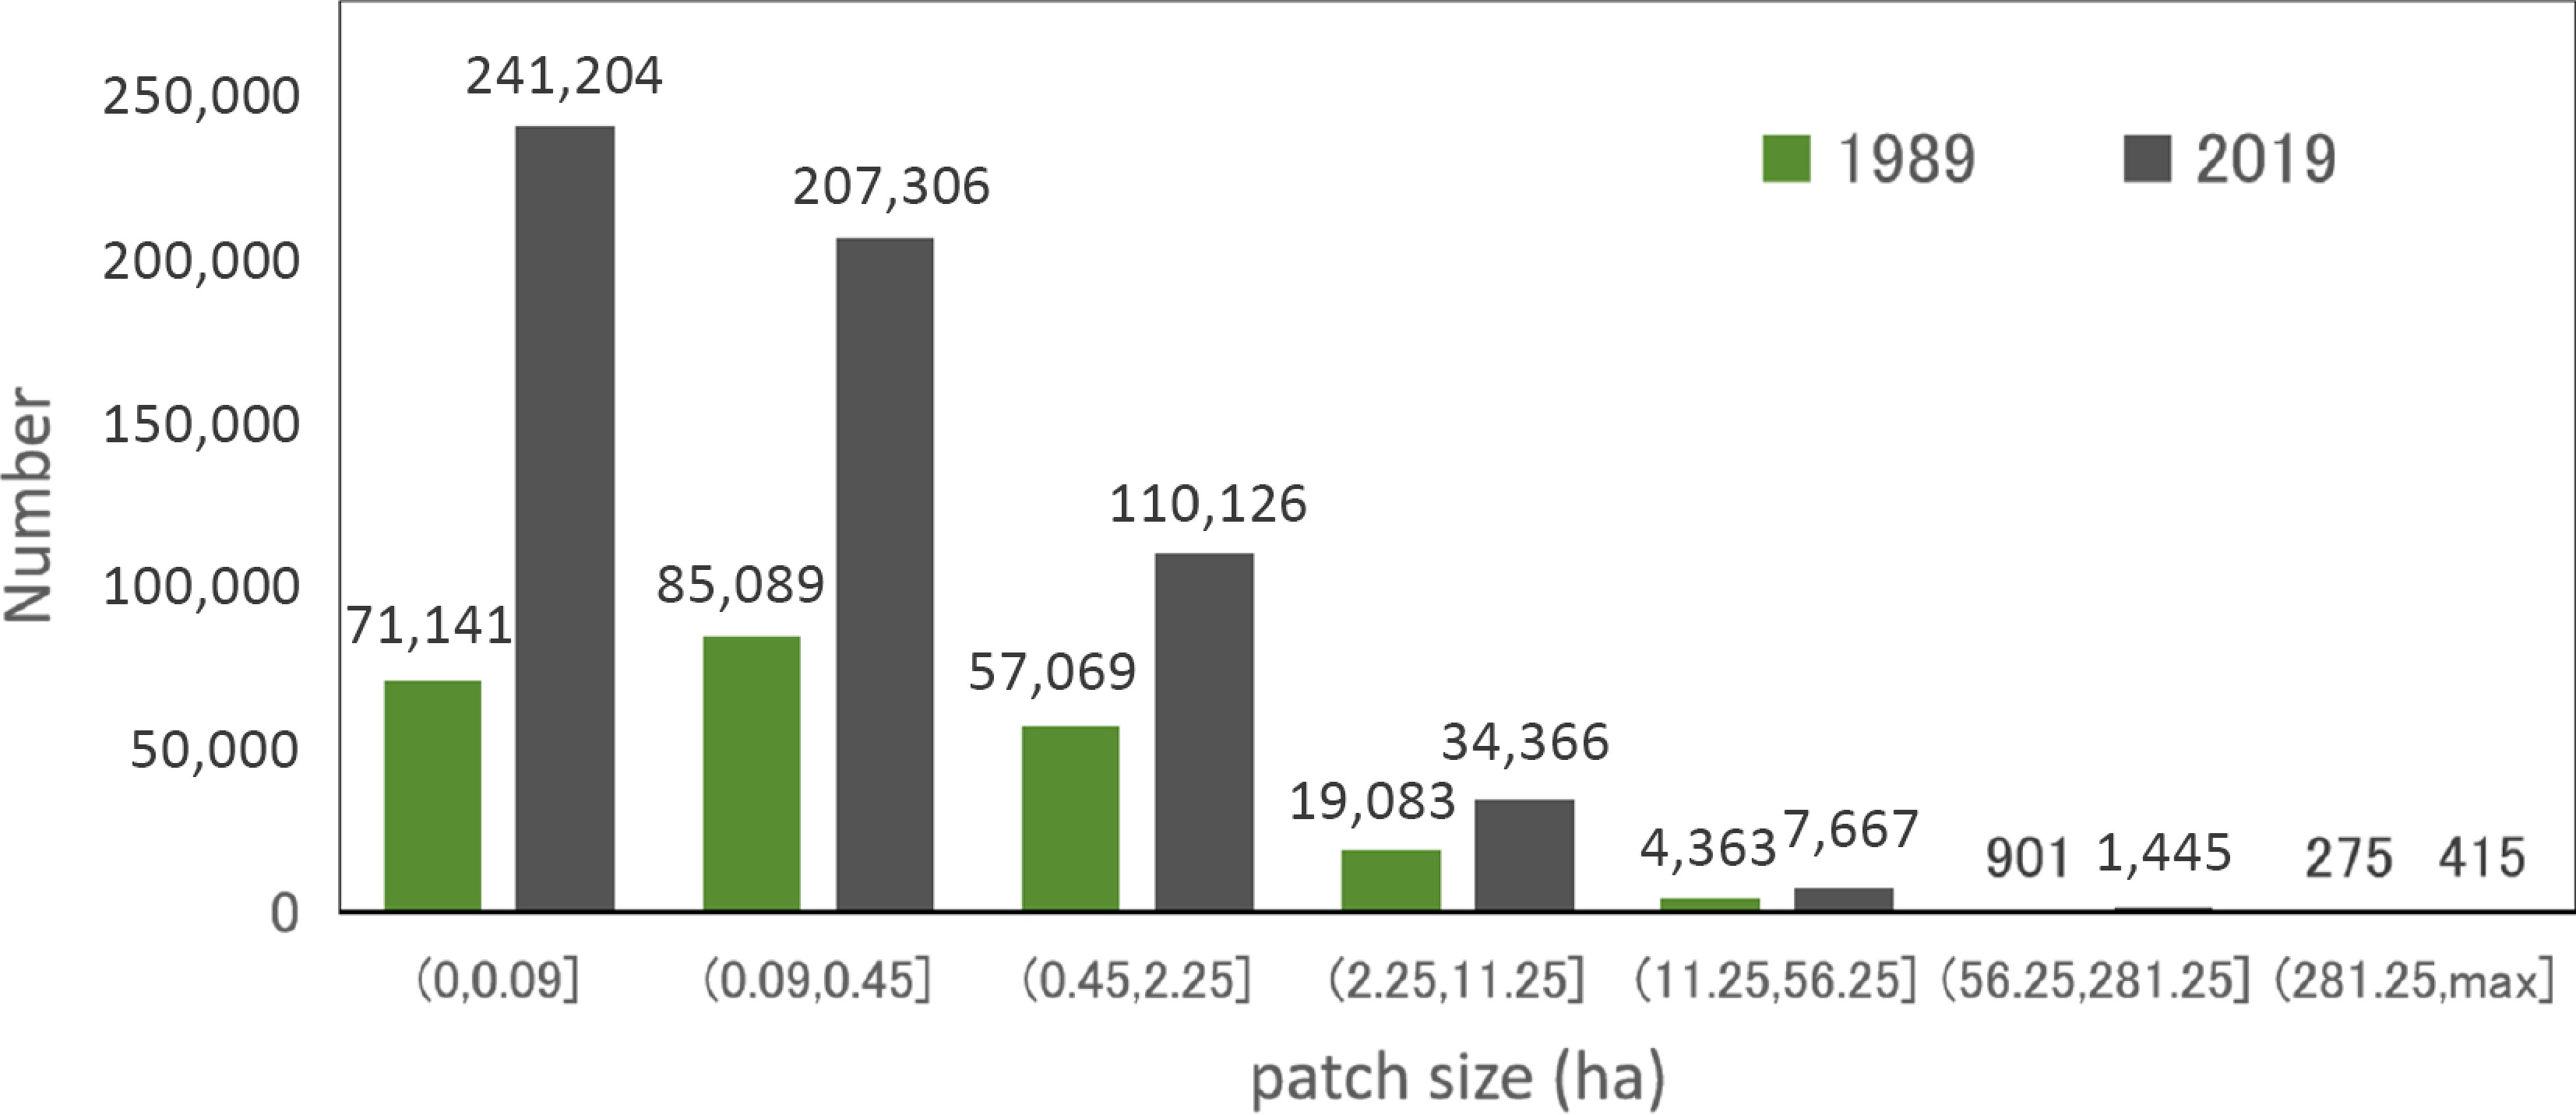
Figure 5.
Distribution of patch numbers across size intervals in 1989 and 2019.
-
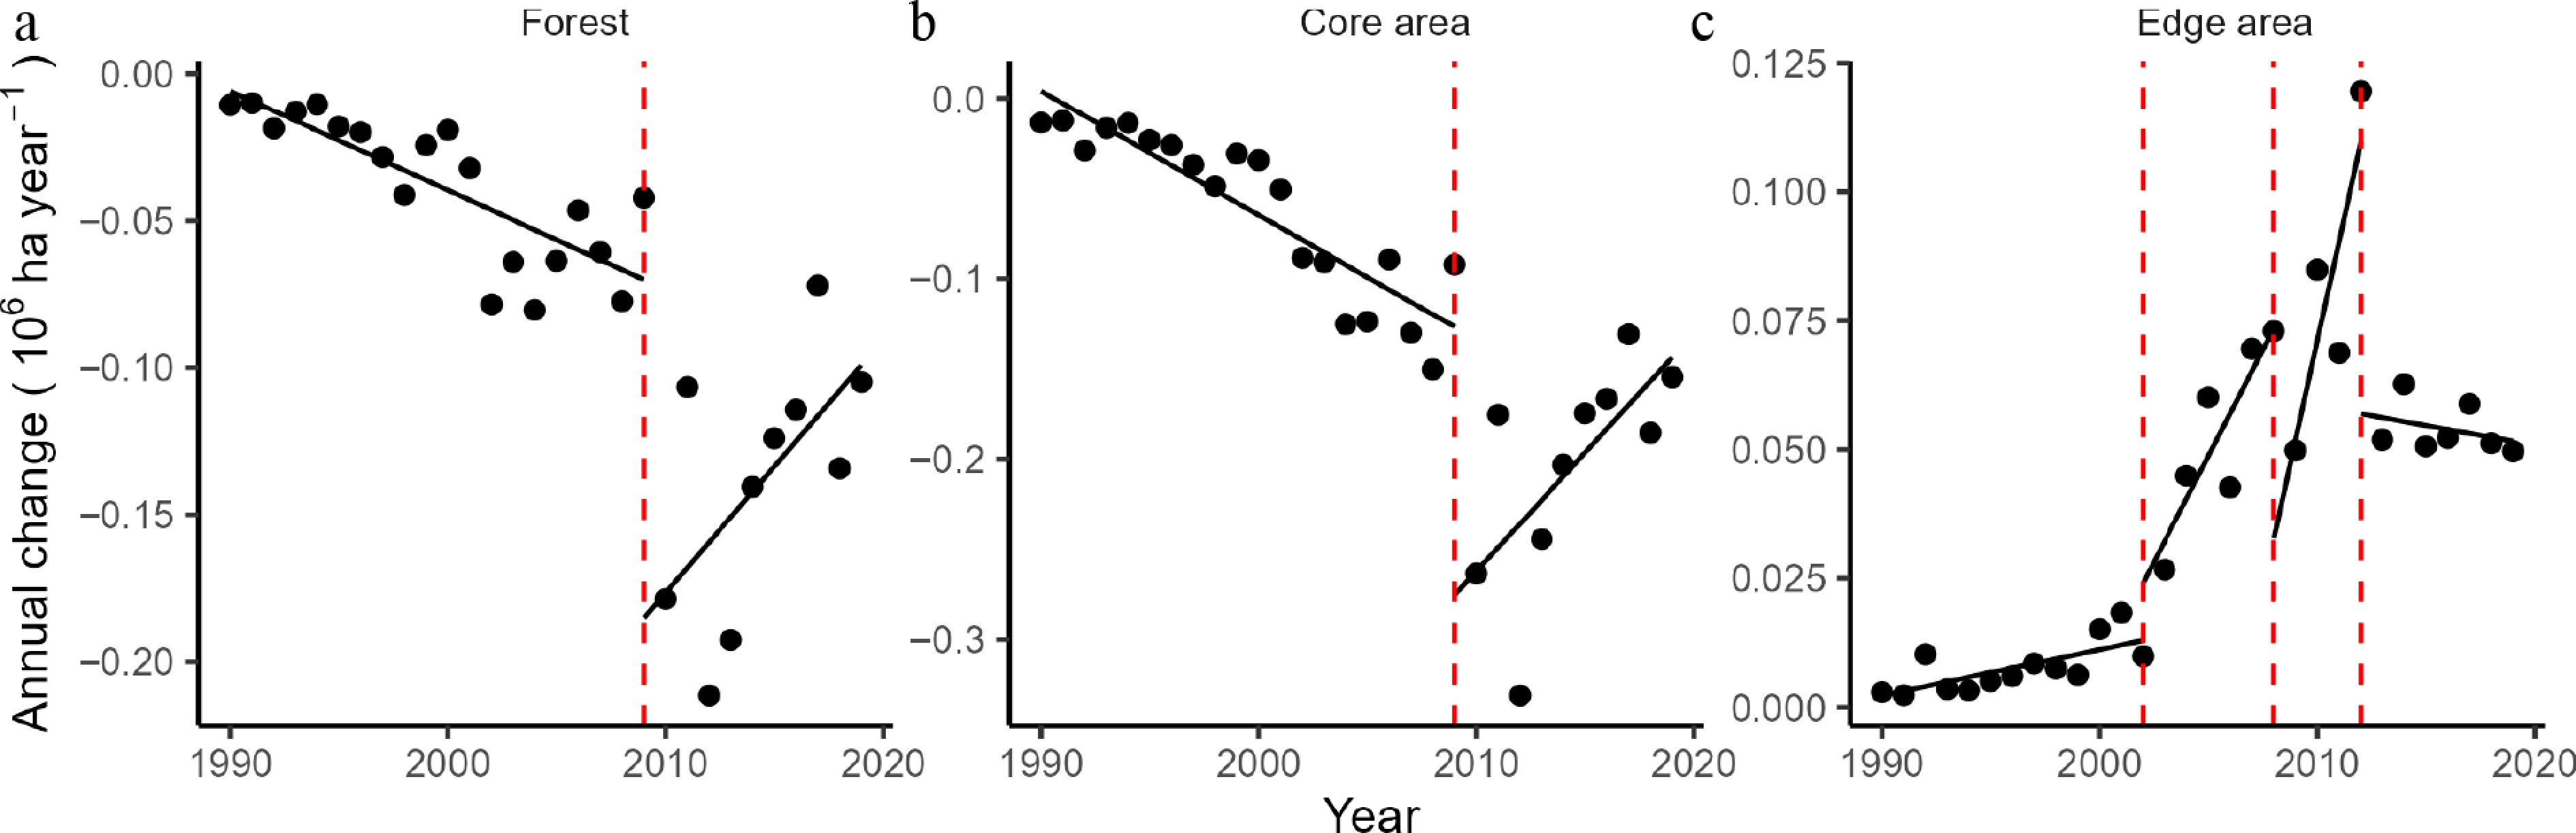
Figure 6.
Annual forest cover changes from 1989 to 2019. (a) Forest area, (b) forest core area, (c) forest edge area. Vertical dashed red lines indicate the detected break years: 2009 for forest area and core forest area, and 2002, 2008, and 2012 for edge forest area.
-
Abbr. Landscape metric Units Formula Description NP Number of patches None NP = n n: number of forest patches MPS Mean patch size ha $ MPS=\dfrac{\sum {A}_{i}}{n}\left(\dfrac{1}{10,000}\right) $ Ai: area of patch i; MPS equals the mean area of each forest patch (m2), divided by 10,000 (to convert to ha) AWMSI Area-weighted mean shape index None $ AWMSI=\dfrac{\sum {{{A}_{i}}S}_{i}}{\sum {A}_{i}} $ $ {S}_{i}=\dfrac{{p}_{i}}{2\sqrt{\pi {A}_{i}}} $ Ai: area of patch i; Si: shape index of patch i; p: perimeter of patch i; AWMSI is the area-weighted mean of shape indices, where each Si is calculated as the ratio of the patch perimeter to the circumference of a circle with the same area. Table 1.
The calculation formulas and descriptions of landscape metrics used.
-
Index Segment Start year End year Parameter Estimates Standard error p value R2 Forest area 1 1989 2009 Intercept 6.70 × 100 1.16 × 100 1.83 × 10⁻⁵ 0.65 Slope −3.37 × 10⁻³ 5.82 × 10⁻⁴ 1.71 × 10⁻⁵ 2 2010 2019 Intercept −1.75 × 101 8.27 × 100 6.77 × 10⁻² 0.35 Slope 8.60 × 10⁻³ 4.11 × 10⁻³ 6.94 × 10⁻² Core area 1 1989 2009 Intercept 1.37 × 101 1.61 × 100 9.91 × 10⁻⁸ 0.80 Slope −6.88 × 10⁻³ 8.04 × 10⁻⁴ 9.28 × 10⁻⁸ 2 2010 2019 Intercept −2.67 × 101 1.06 × 101 3.54 × 10⁻² 0.44 Slope 1.32 × 10⁻² 5.25 × 10⁻³ 3.65 × 10⁻² Edge area 1 1989 2002 Intercept −1.76 × 100 5.22 × 10⁻¹ 6.24 × 10⁻³ 0.51 Slope 8.85 × 10⁻⁴ 2.61 × 10⁻⁴ 6.08 × 10⁻³ 2 2003 2008 Intercept −1.64 × 101 4.81 × 100 2.70 × 10⁻² 0.75 Slope 8.22 × 10⁻³ 2.40 × 10⁻³ 2.67 × 10⁻² 3 2008 2012 Intercept −3.87 × 101 1.75 × 101 1.58 × 10⁻¹ 0.71 Slope 1.93 × 10⁻² 8.72 × 10⁻³ 1.57 × 10⁻¹ 4 2013 2019 Intercept 1.59 × 100 1.92 × 100 4.45 × 10⁻¹ 0.11 Slope −7.64 × 10⁻⁴ 9.53 × 10⁻⁴ 4.59 × 10⁻¹ Table 2.
Linear fitting functions for each segment of annual change in forest, core forest, and edge forest areas.
Figures
(6)
Tables
(2)