-
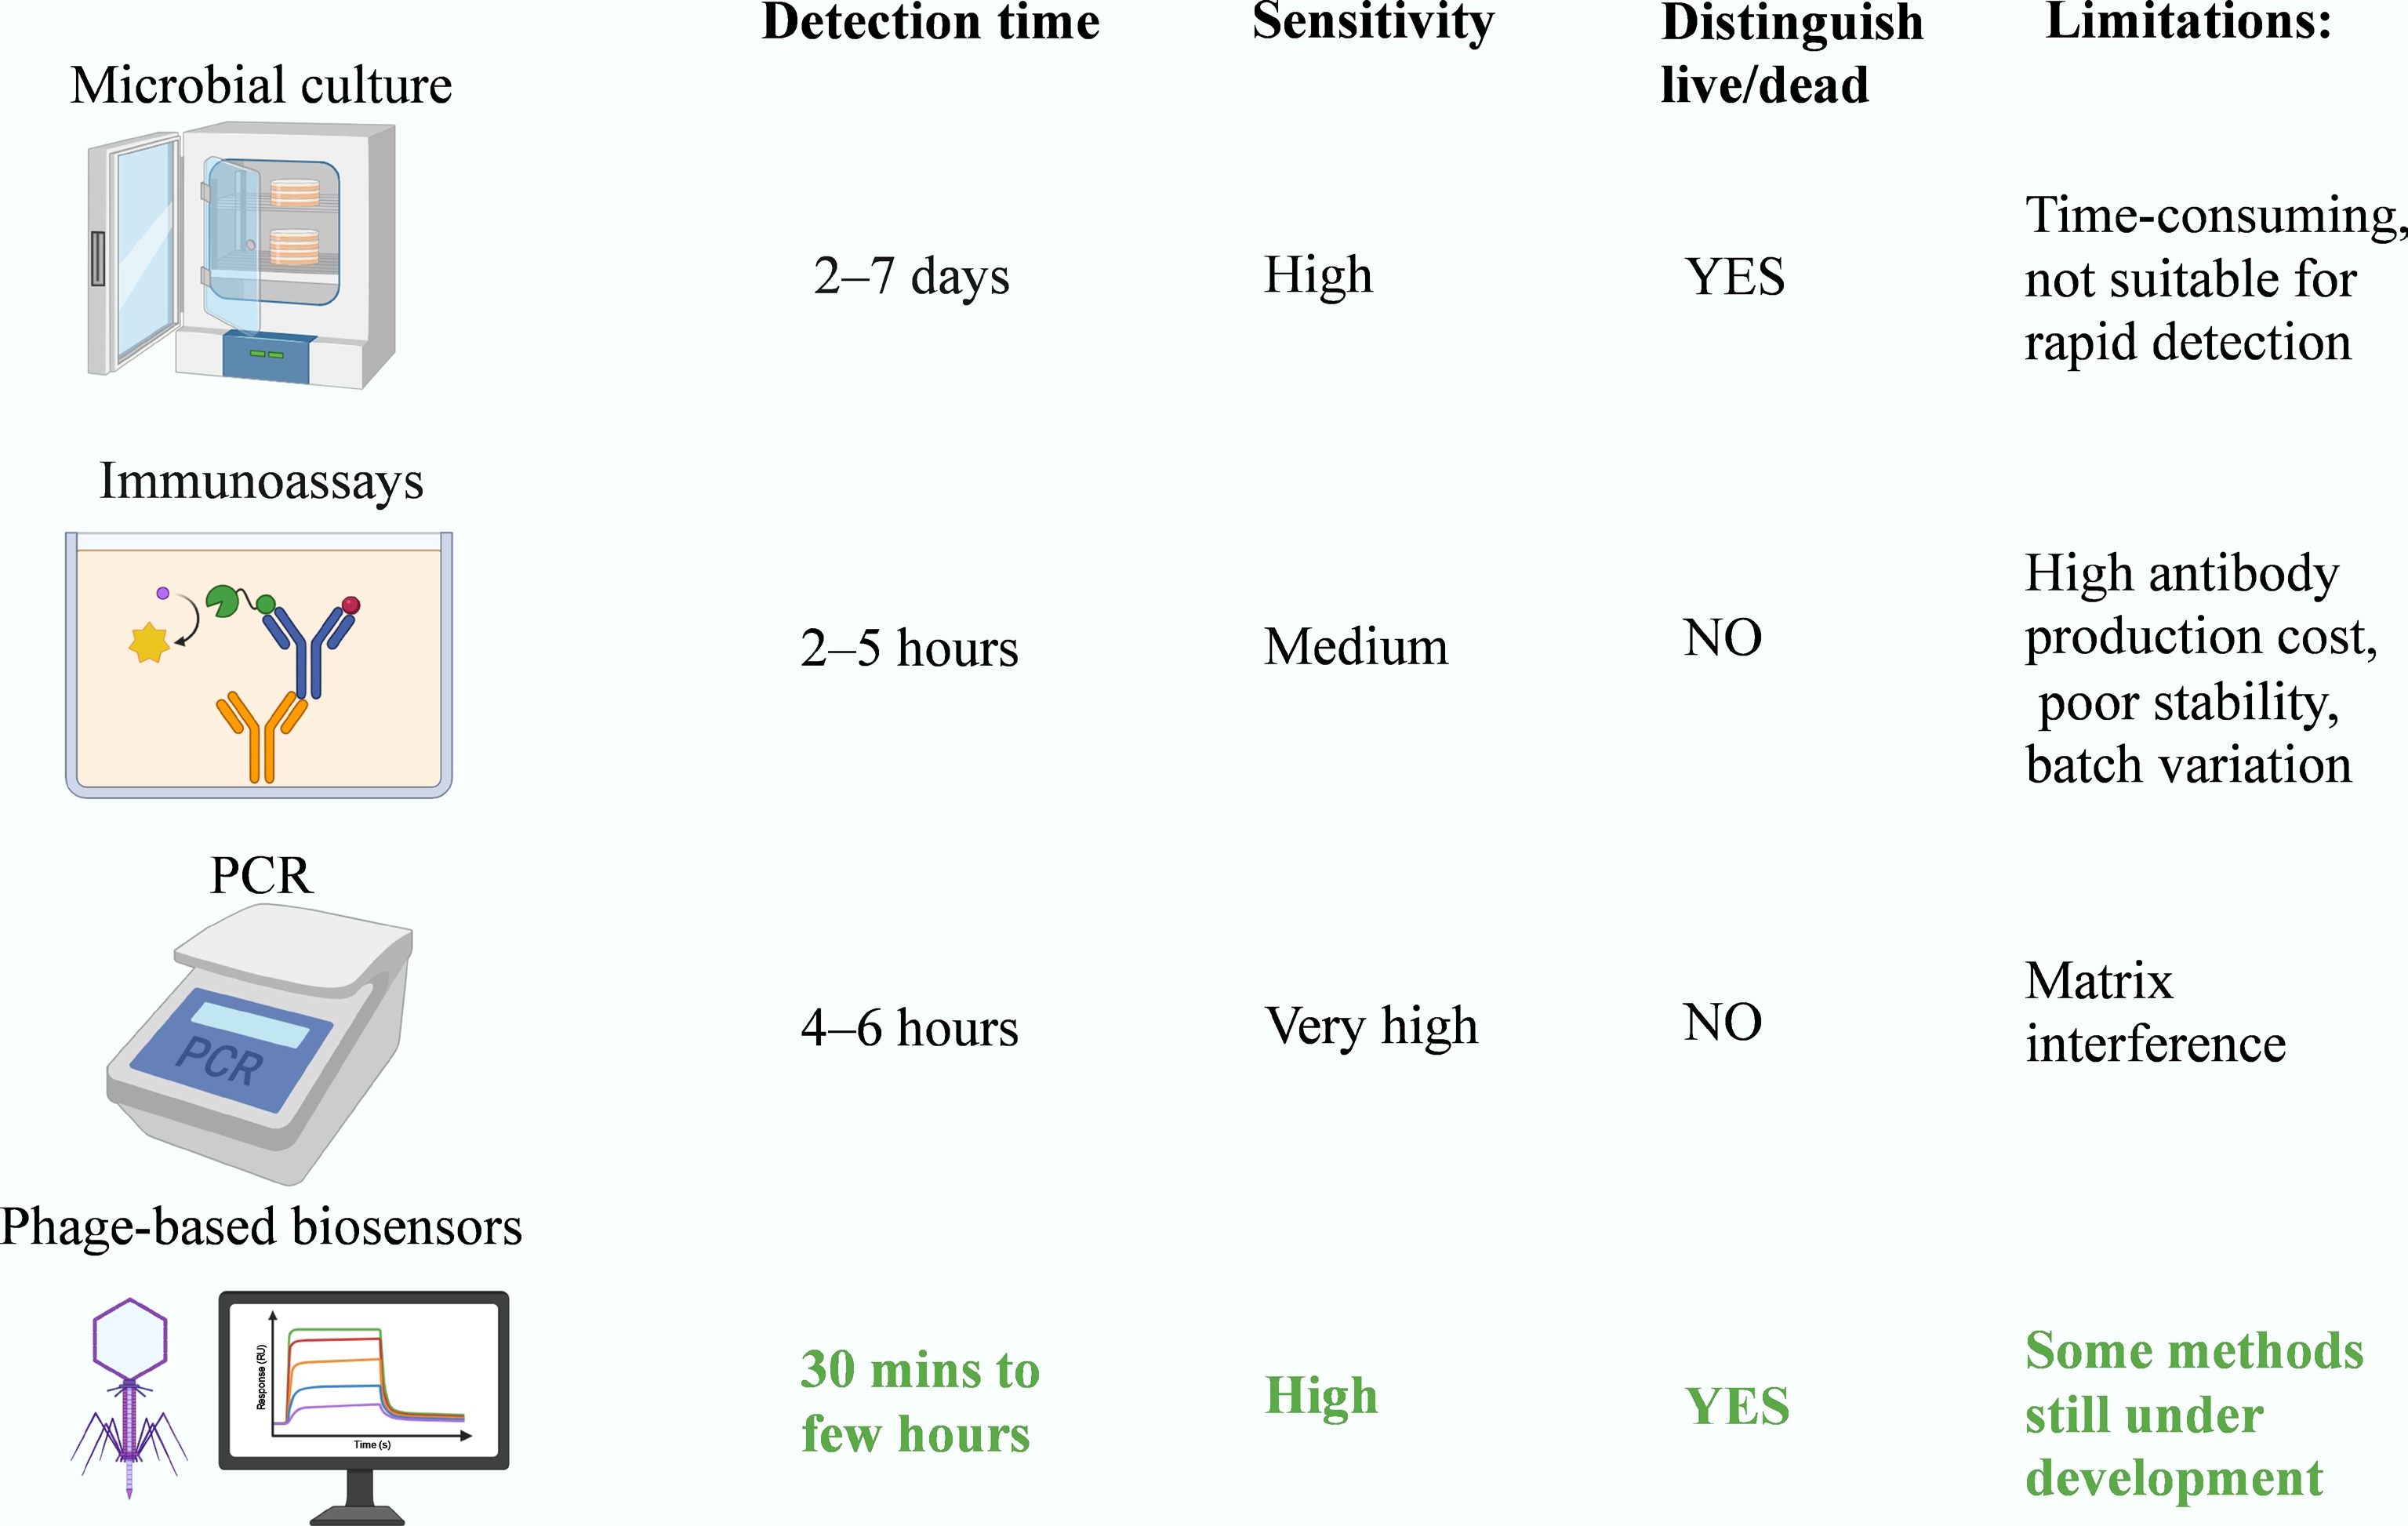
Figure 1.
Comparative performance of pathogen detection methods. The chart contrasts traditional microbial culture, immunoassays (e.g., ELISA), and PCR with emerging phage-based biosensors. While microbial culture remains the gold standard for detecting viable cells, it is time consuming (2–7 d). Rapid molecular methods (PCR) and immunoassays cannot distinguish live from dead cells, and face challenges due to matrix interference or reagent instability. Phage-based biosensors uniquely combine rapidity (30 min to a few hours) with specific detection of viable bacteria.
-
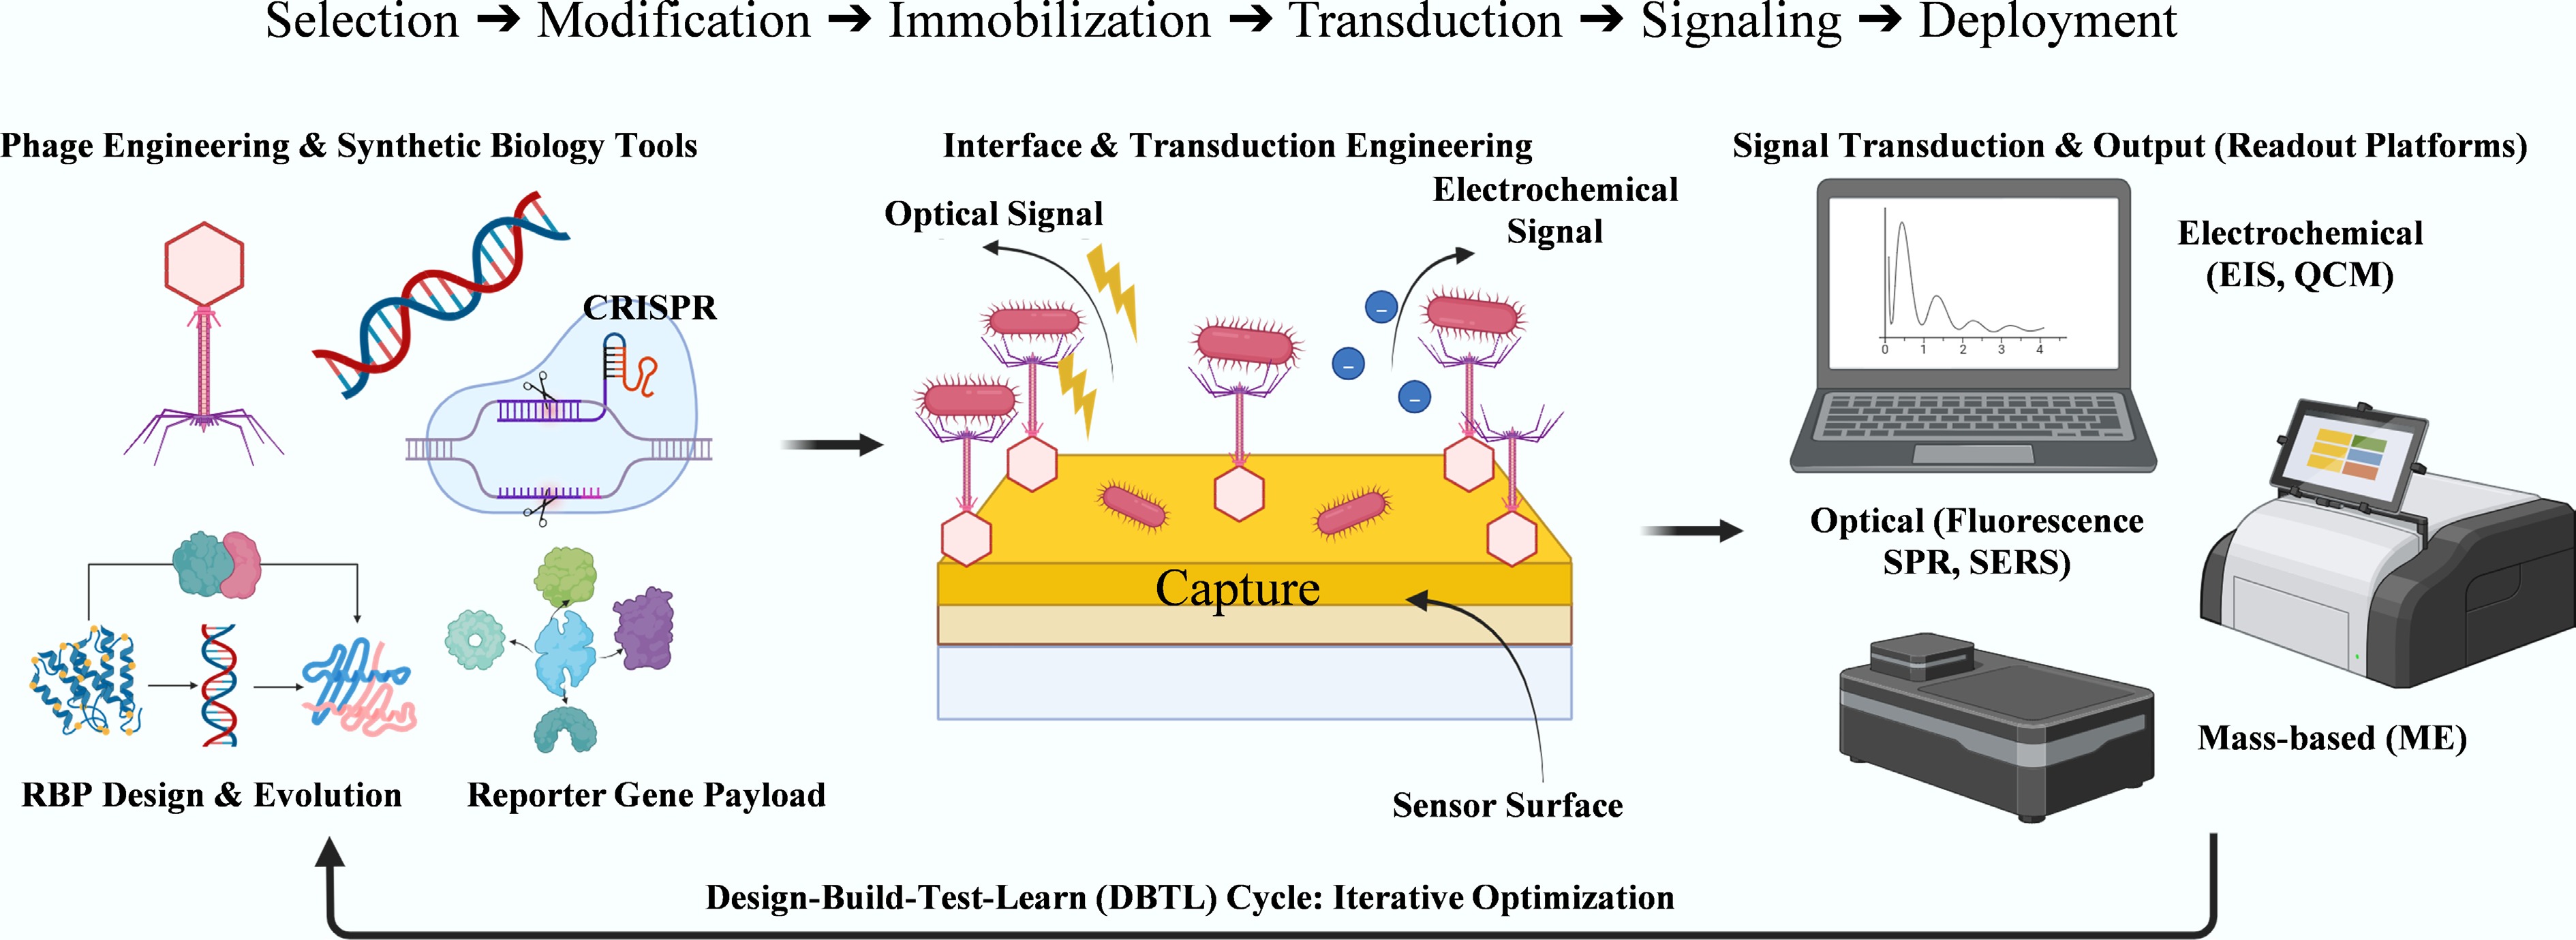
Figure 2.
Modular engineering workflow for phage-based biosensor design. The process comprises three steps: (1) Phage Engineering & Synthetic Biology Tools (e.g., CRISPR, RBP evolution, and reporter gene payload); (2) Interface & Transduction Engineering, including surface functionalization and signal generation; and (3) Signal Transduction & Output, which involves electrochemical, optical, or mass-based readout platforms. This process is embedded within an iterative Design–Build–Test–Learn (DBTL) cycle to optimize performance.
-
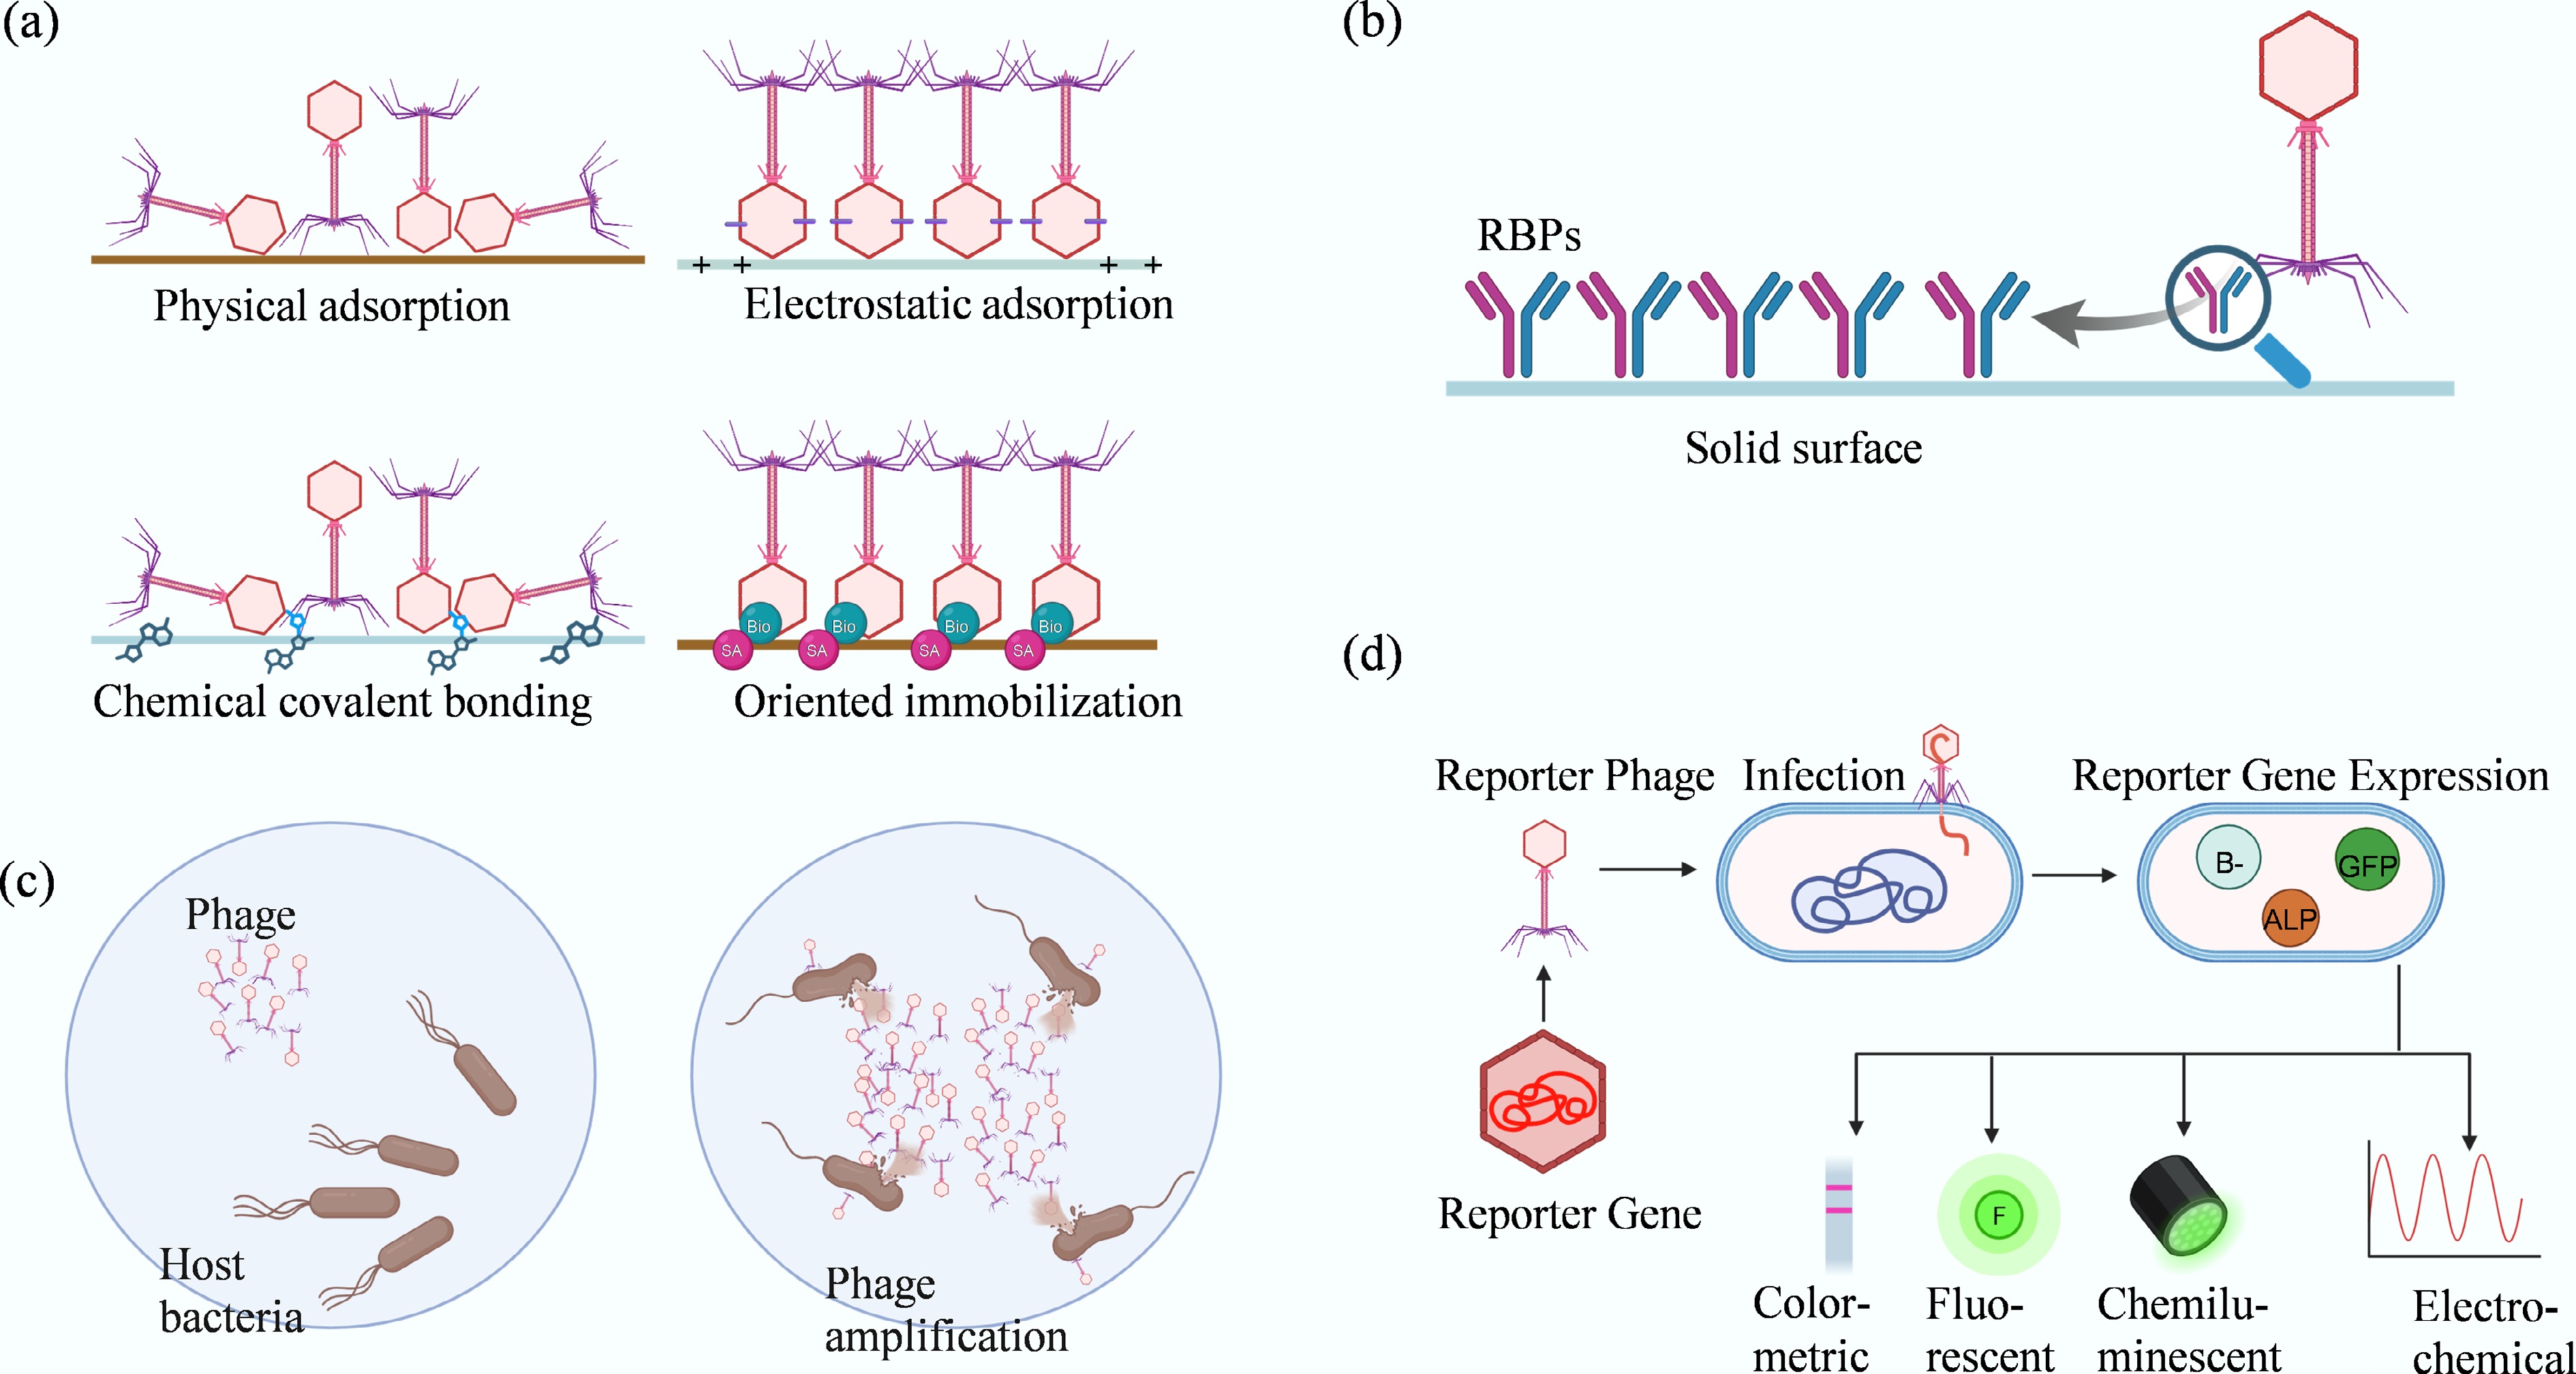
Figure 3.
Major phage-based recognition strategies for pathogen detection. This figure illustrates the primary mechanisms utilized in phage biosensing. (a) Phage immobilization strategies on sensor surfaces: physical adsorption, relying on hydrophobic and van der Waals forces, often results in random orientation; electrostatic adsorption, utilizing head–tail charge differences for alignment; covalent bonding, providing strong attachment but limited orientation control; and affinity or bioorthogonal chemistry, achieving high-precision, site-specific, and oriented immobilization. (b) Comparison of whole phages vs recombinant receptor-binding proteins (RBPs). (c) Detection based on phage amplification in viable hosts. (d) Reporter phage detection, illustrating how engineered phages drive the expression of signal-generating genes (e.g., GFP, ALP) upon infection, to produce colorimetric, fluorescent, chemiluminescent, or electrochemical signals.
-
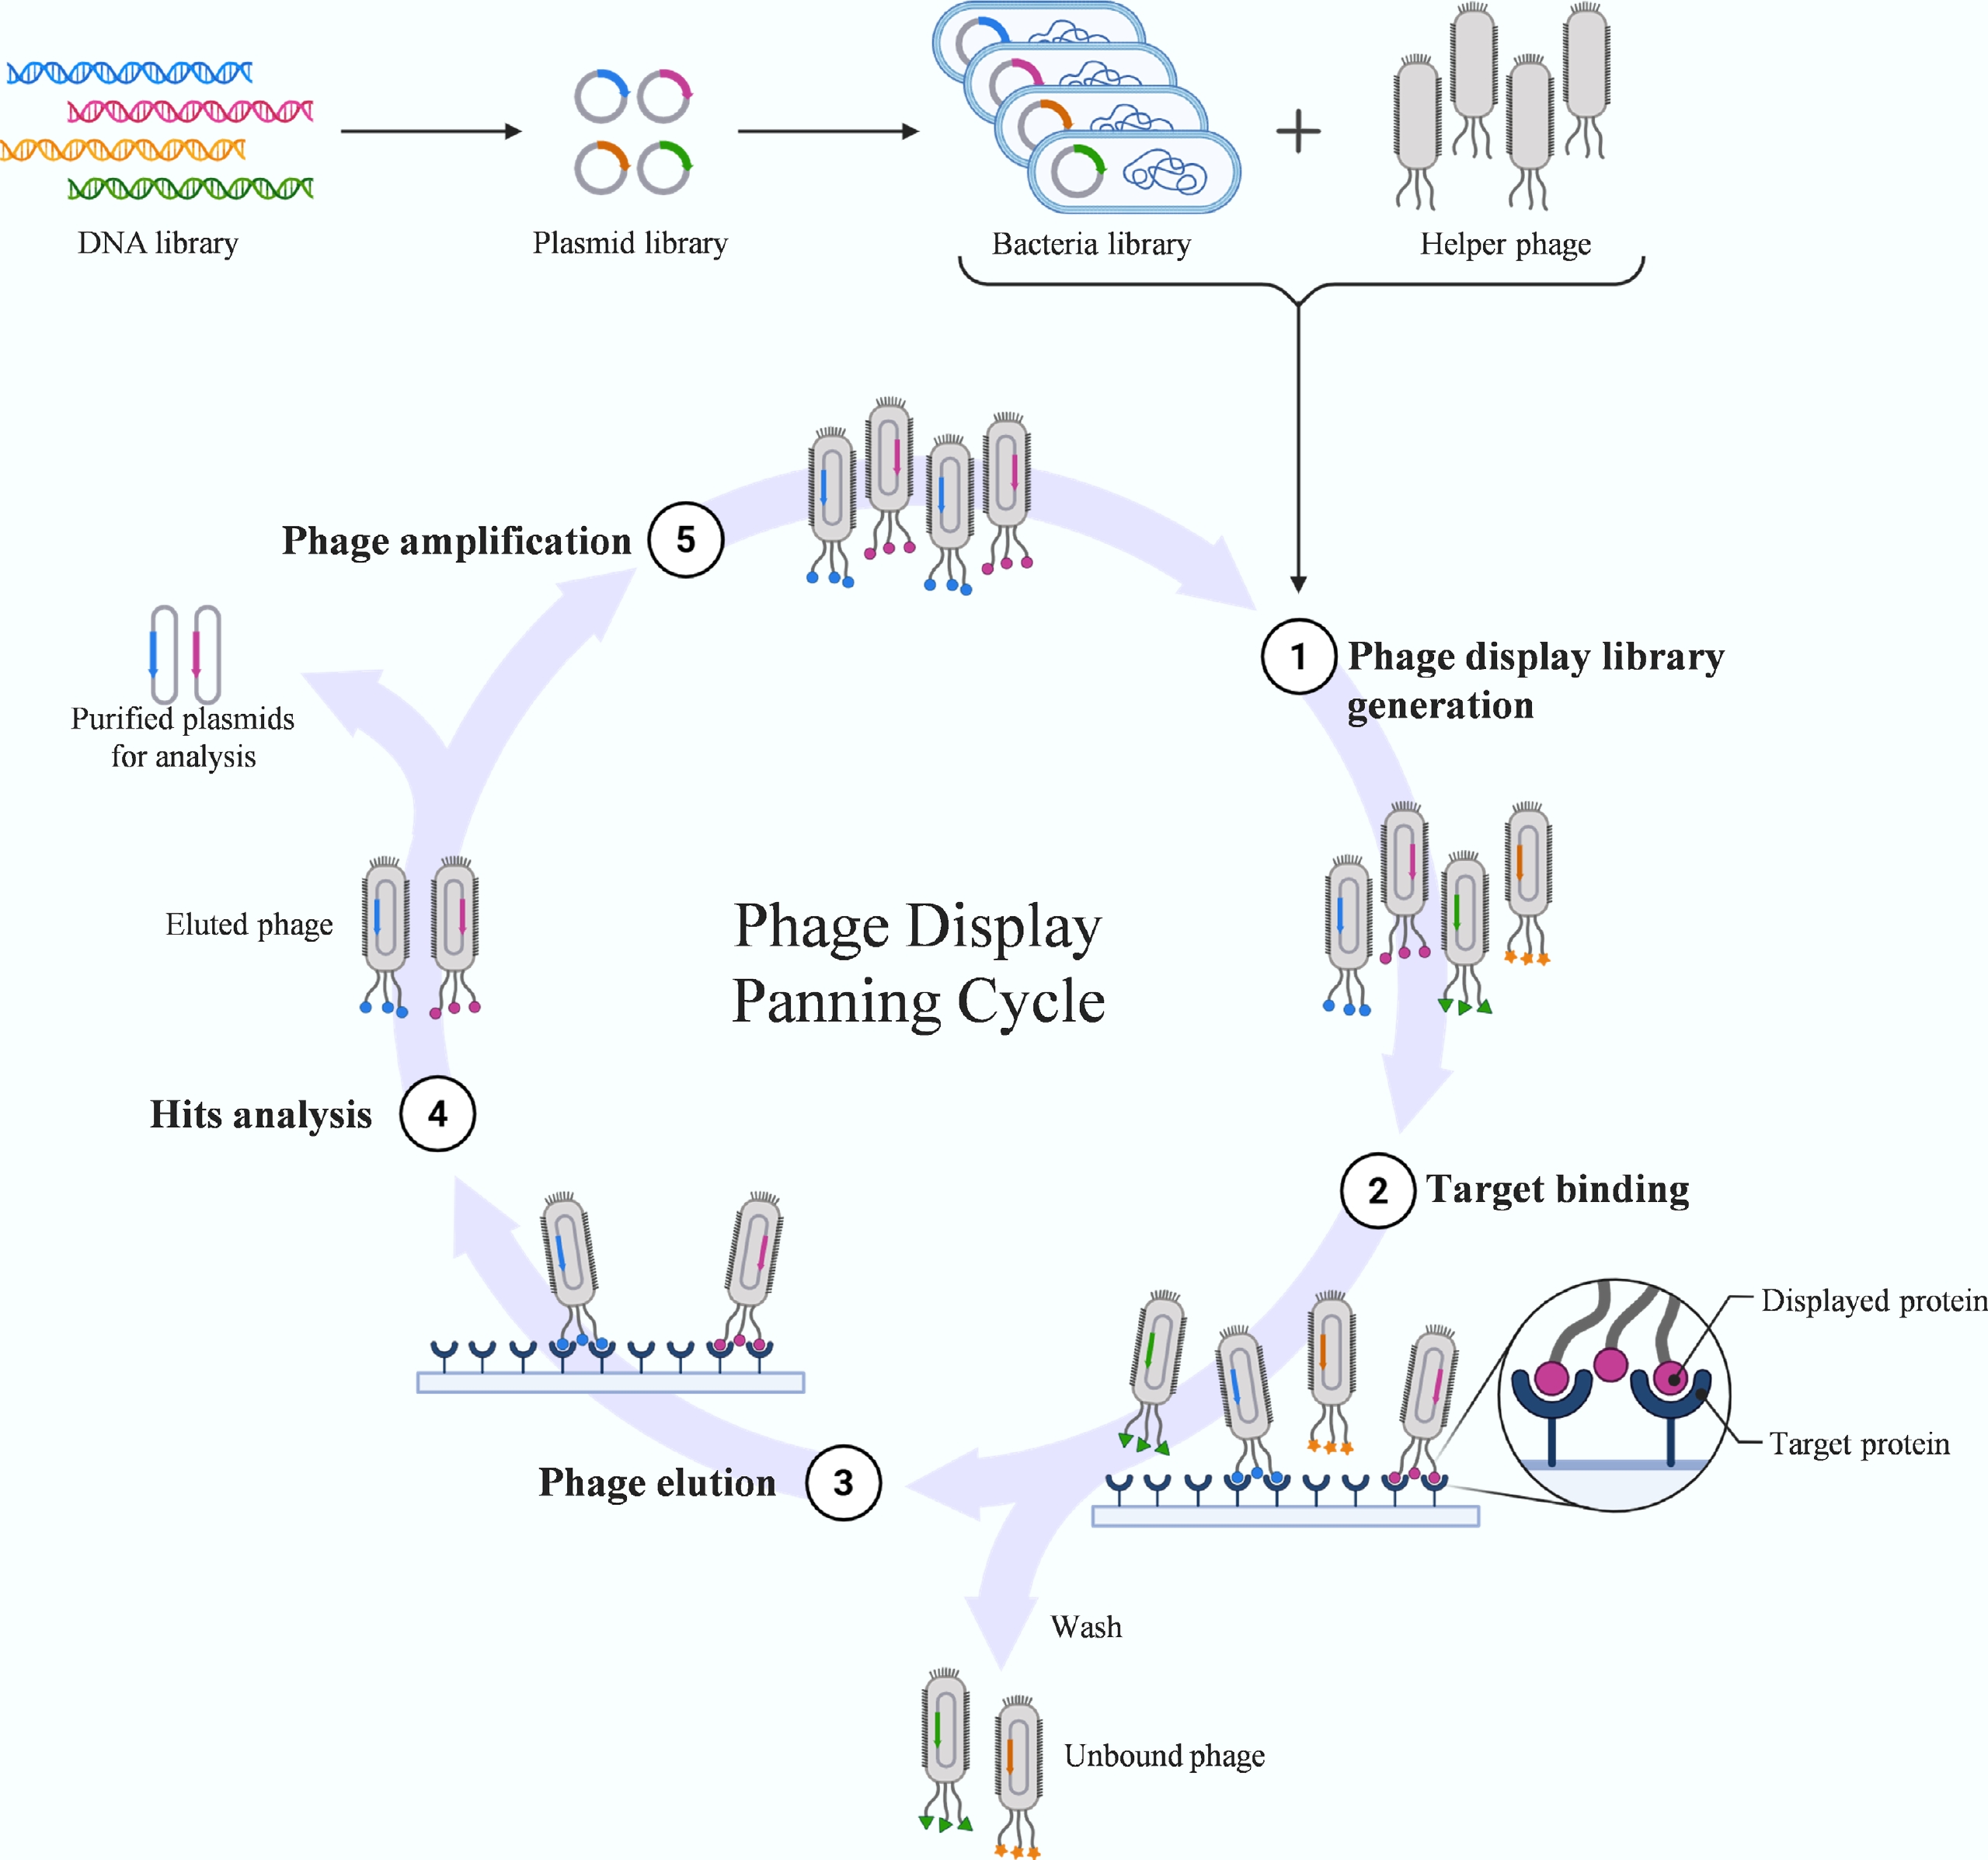
Figure 4.
Biopanning workflow in phage display. This diagram illustrates the iterative affinity selection cycle used to isolate high-affinity peptides. Phage display links genotype to phenotype by fusing foreign peptides to capsid proteins. The panning process involves: (1) binding the phage library to an immobilized target protein; (2) washing to remove unbound phages; (3) elution of specifically bound phages; and (4) amplification of the eluted pool in host bacteria for the next round of selection. Through multiple iterations, peptides with high specificity and affinity are enriched.
-
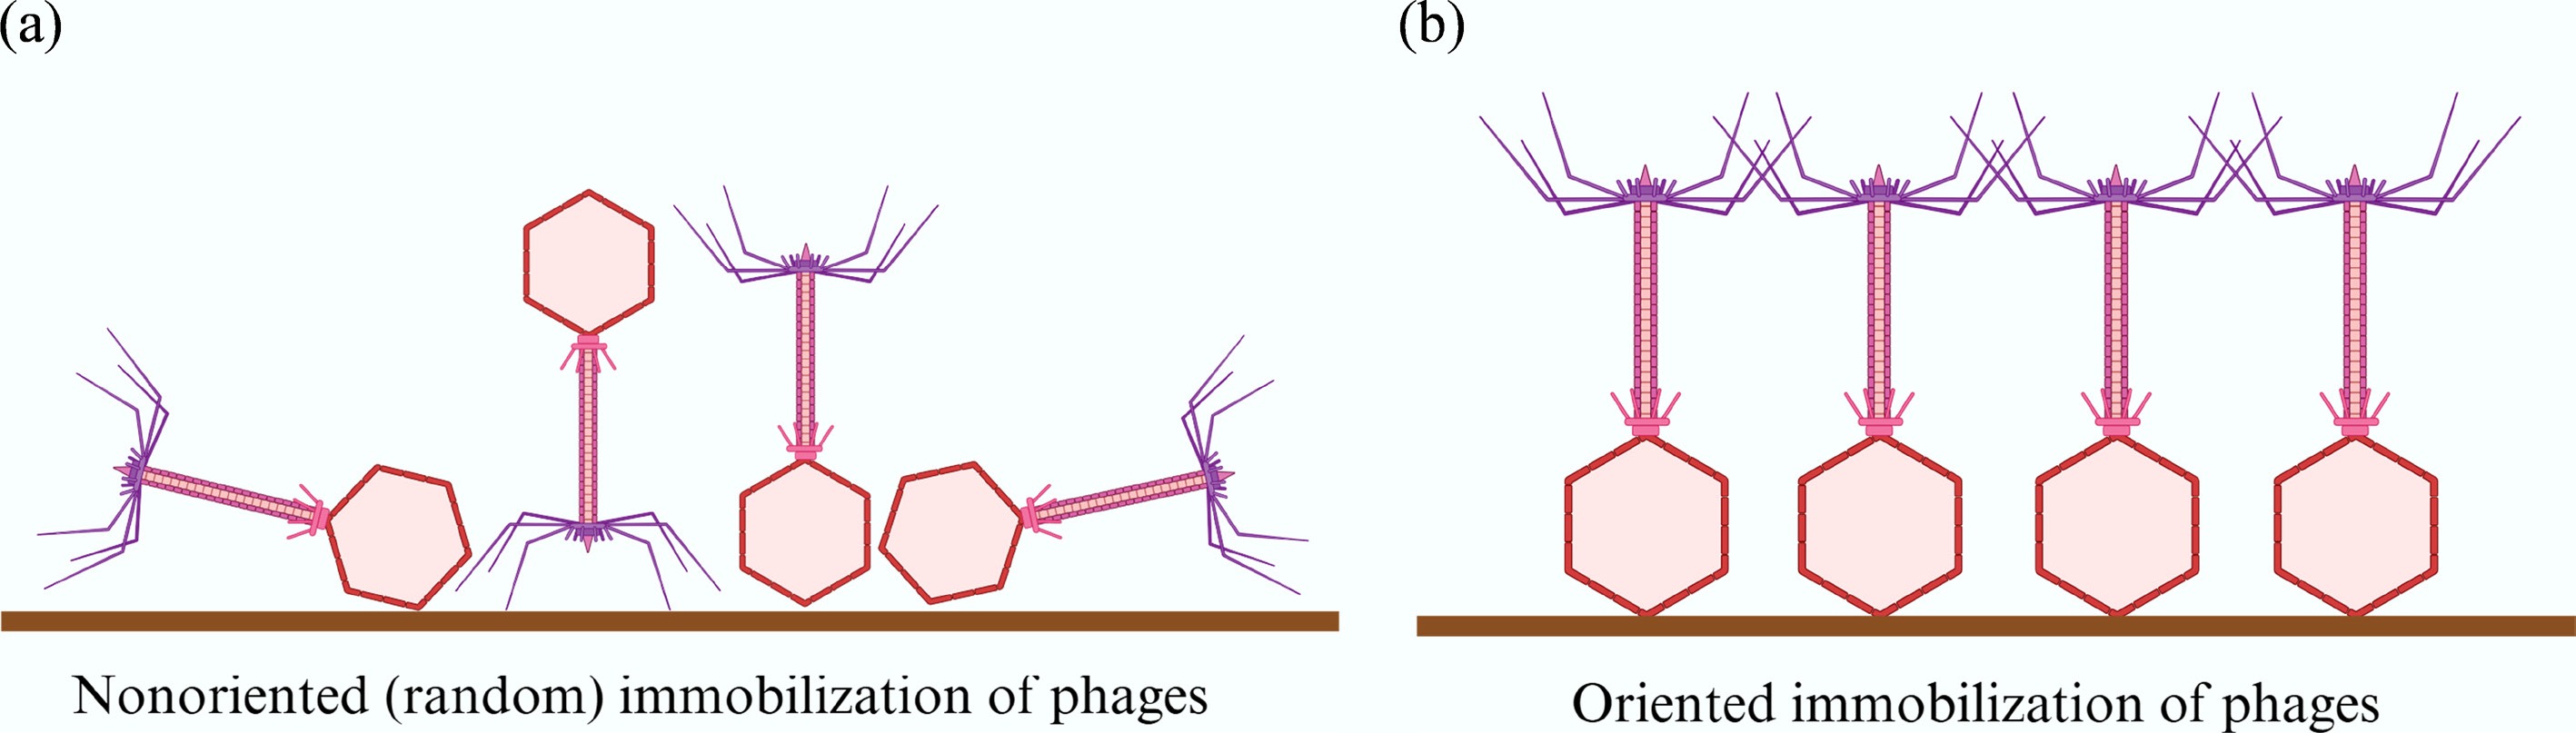
Figure 5.
Schematic comparison of random vs oriented phage immobilization strategies. (a) Non-oriented (random) immobilization often results in disordered alignment, which can occlude receptor-binding tail fibers and reduce bacterial capture efficiency. (b) Oriented immobilization aligns phages vertically on the sensor surface, preserving the functional exposure of tail fibers and thereby enhancing bacterial binding capacity.
-
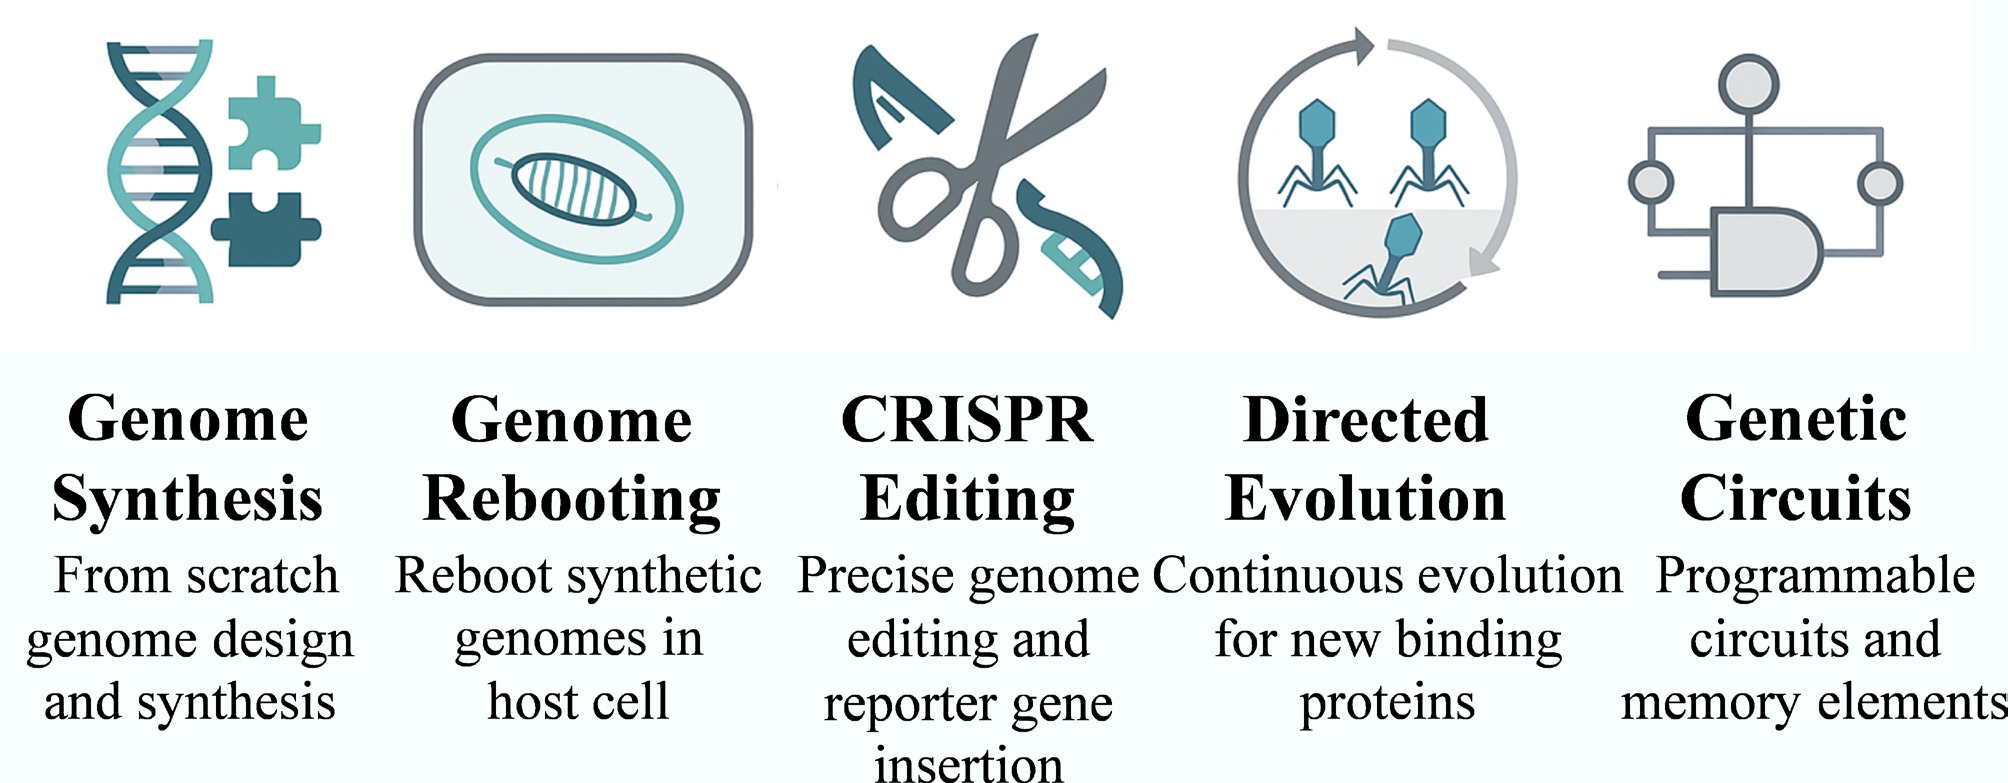
Figure 6.
Synthetic biology toolkit for engineering bacteriophages. The schematic illustrates core technologies for phage design, including genome synthesis and rebooting, CRISPR-based genome editing, directed evolution, and genetic circuit construction. These technologies collectively allow precise control over phage structure and function for pathogen-oriented biosensing applications.
-
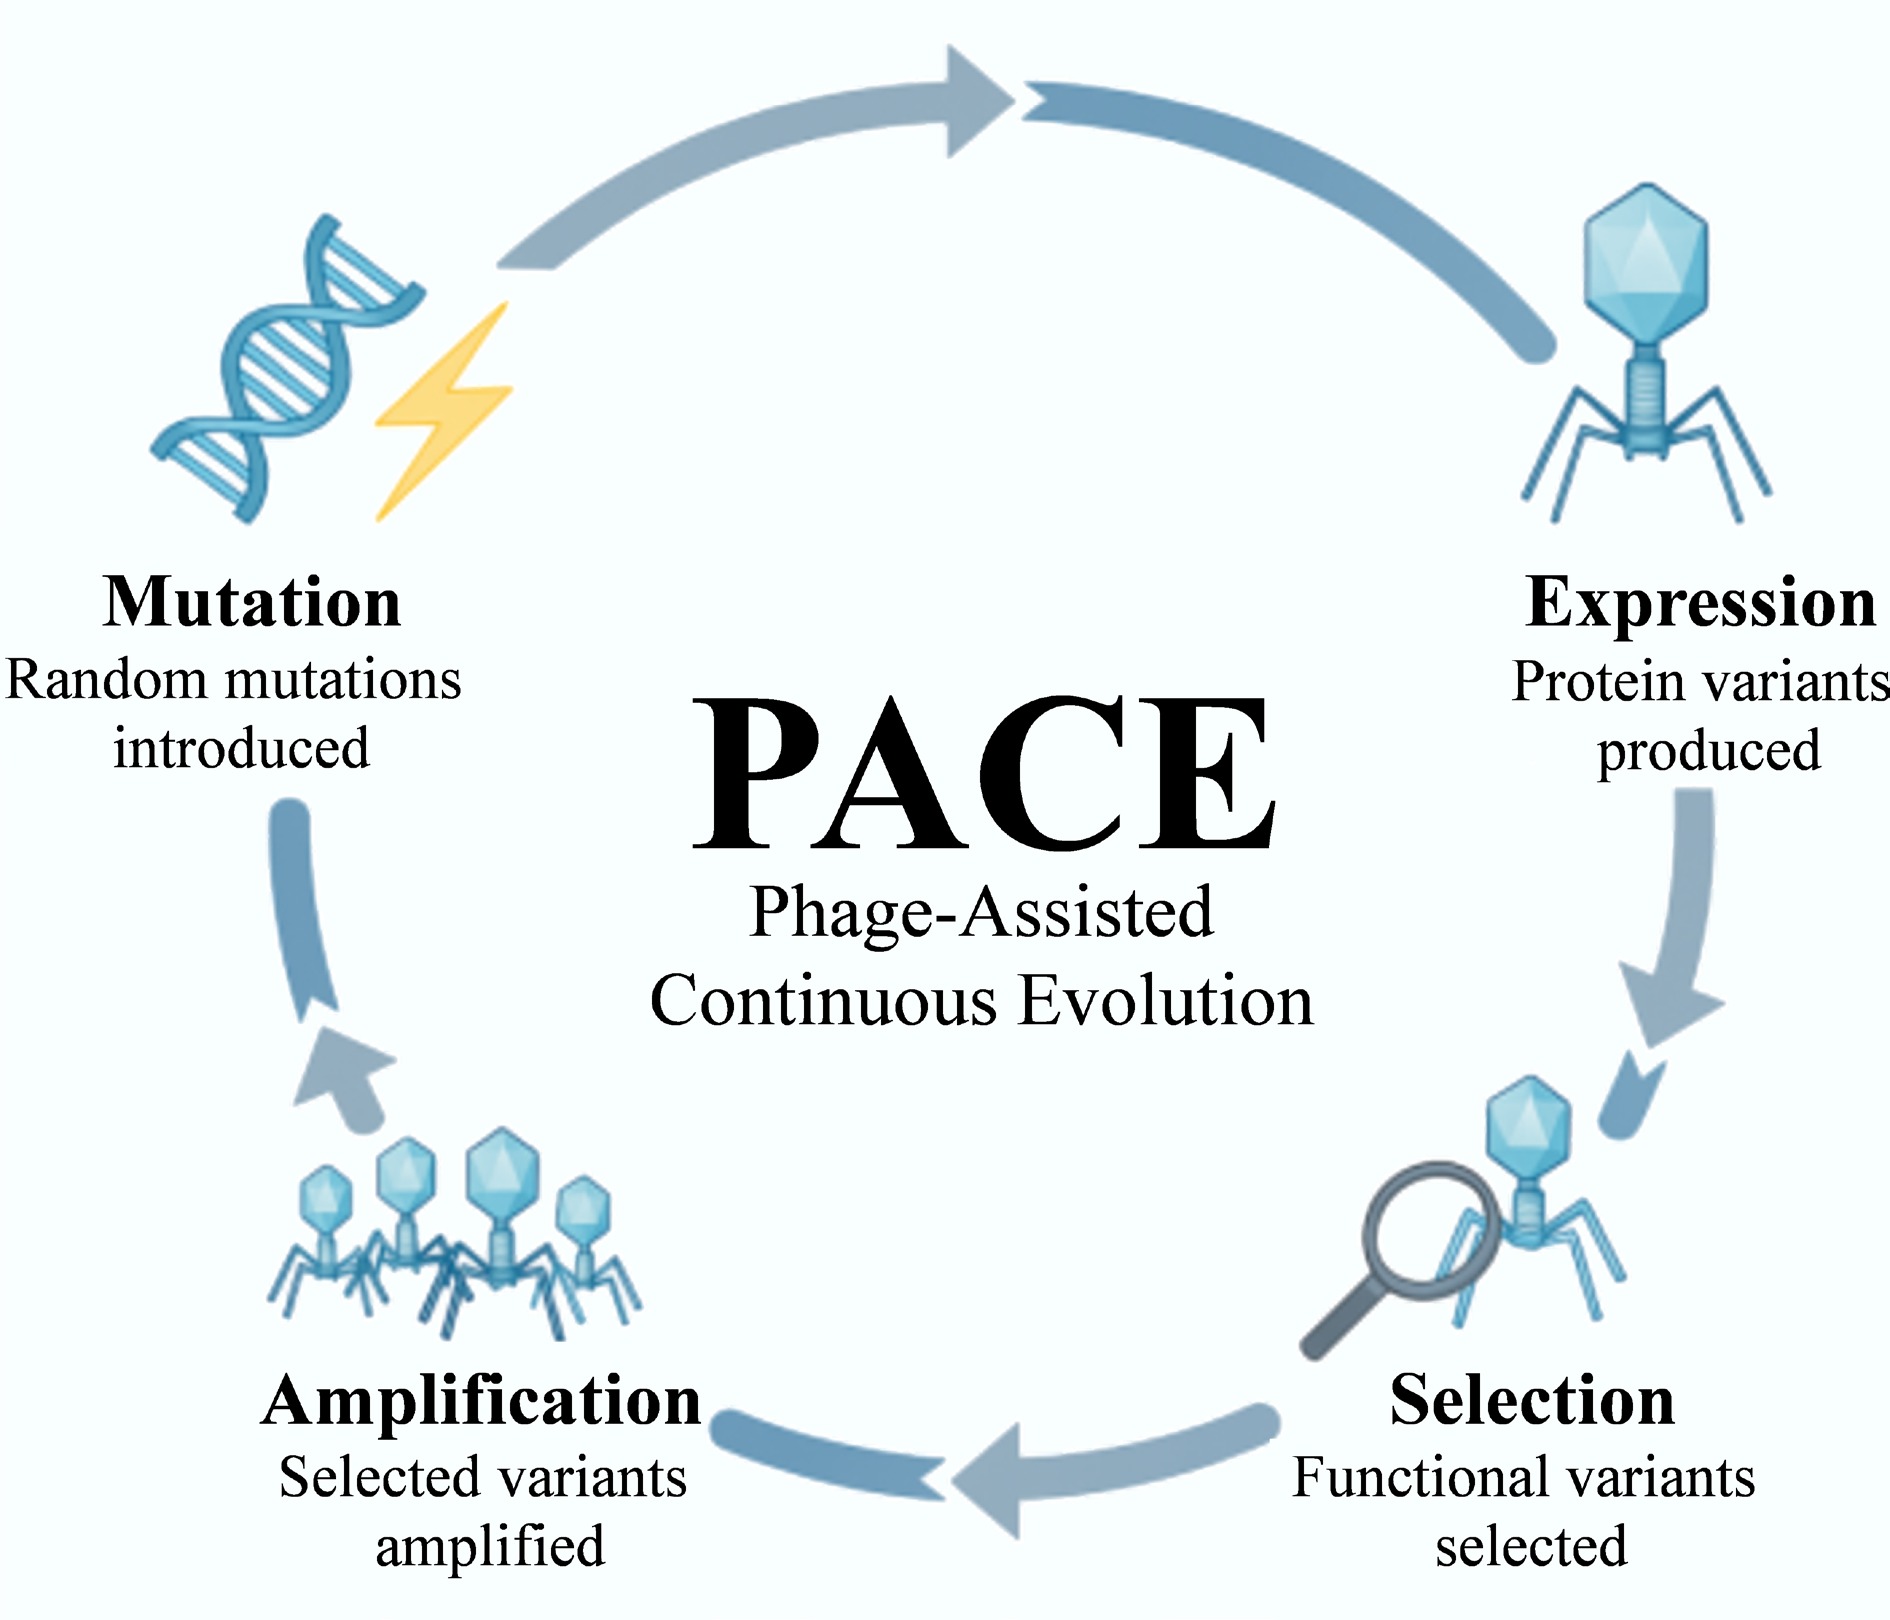
Figure 7.
Principle of phage-assisted continuous evolution (PACE). The diagram illustrates the continuous cycle of mutation, expression, selection, and amplification within an M13 phage system. This integrated bioreactor approach enables the rapid evolution of functional proteins or receptor-binding domains (RBPs) for biosensing applications, achieving hundreds of evolutionary generations in just a few days.
-
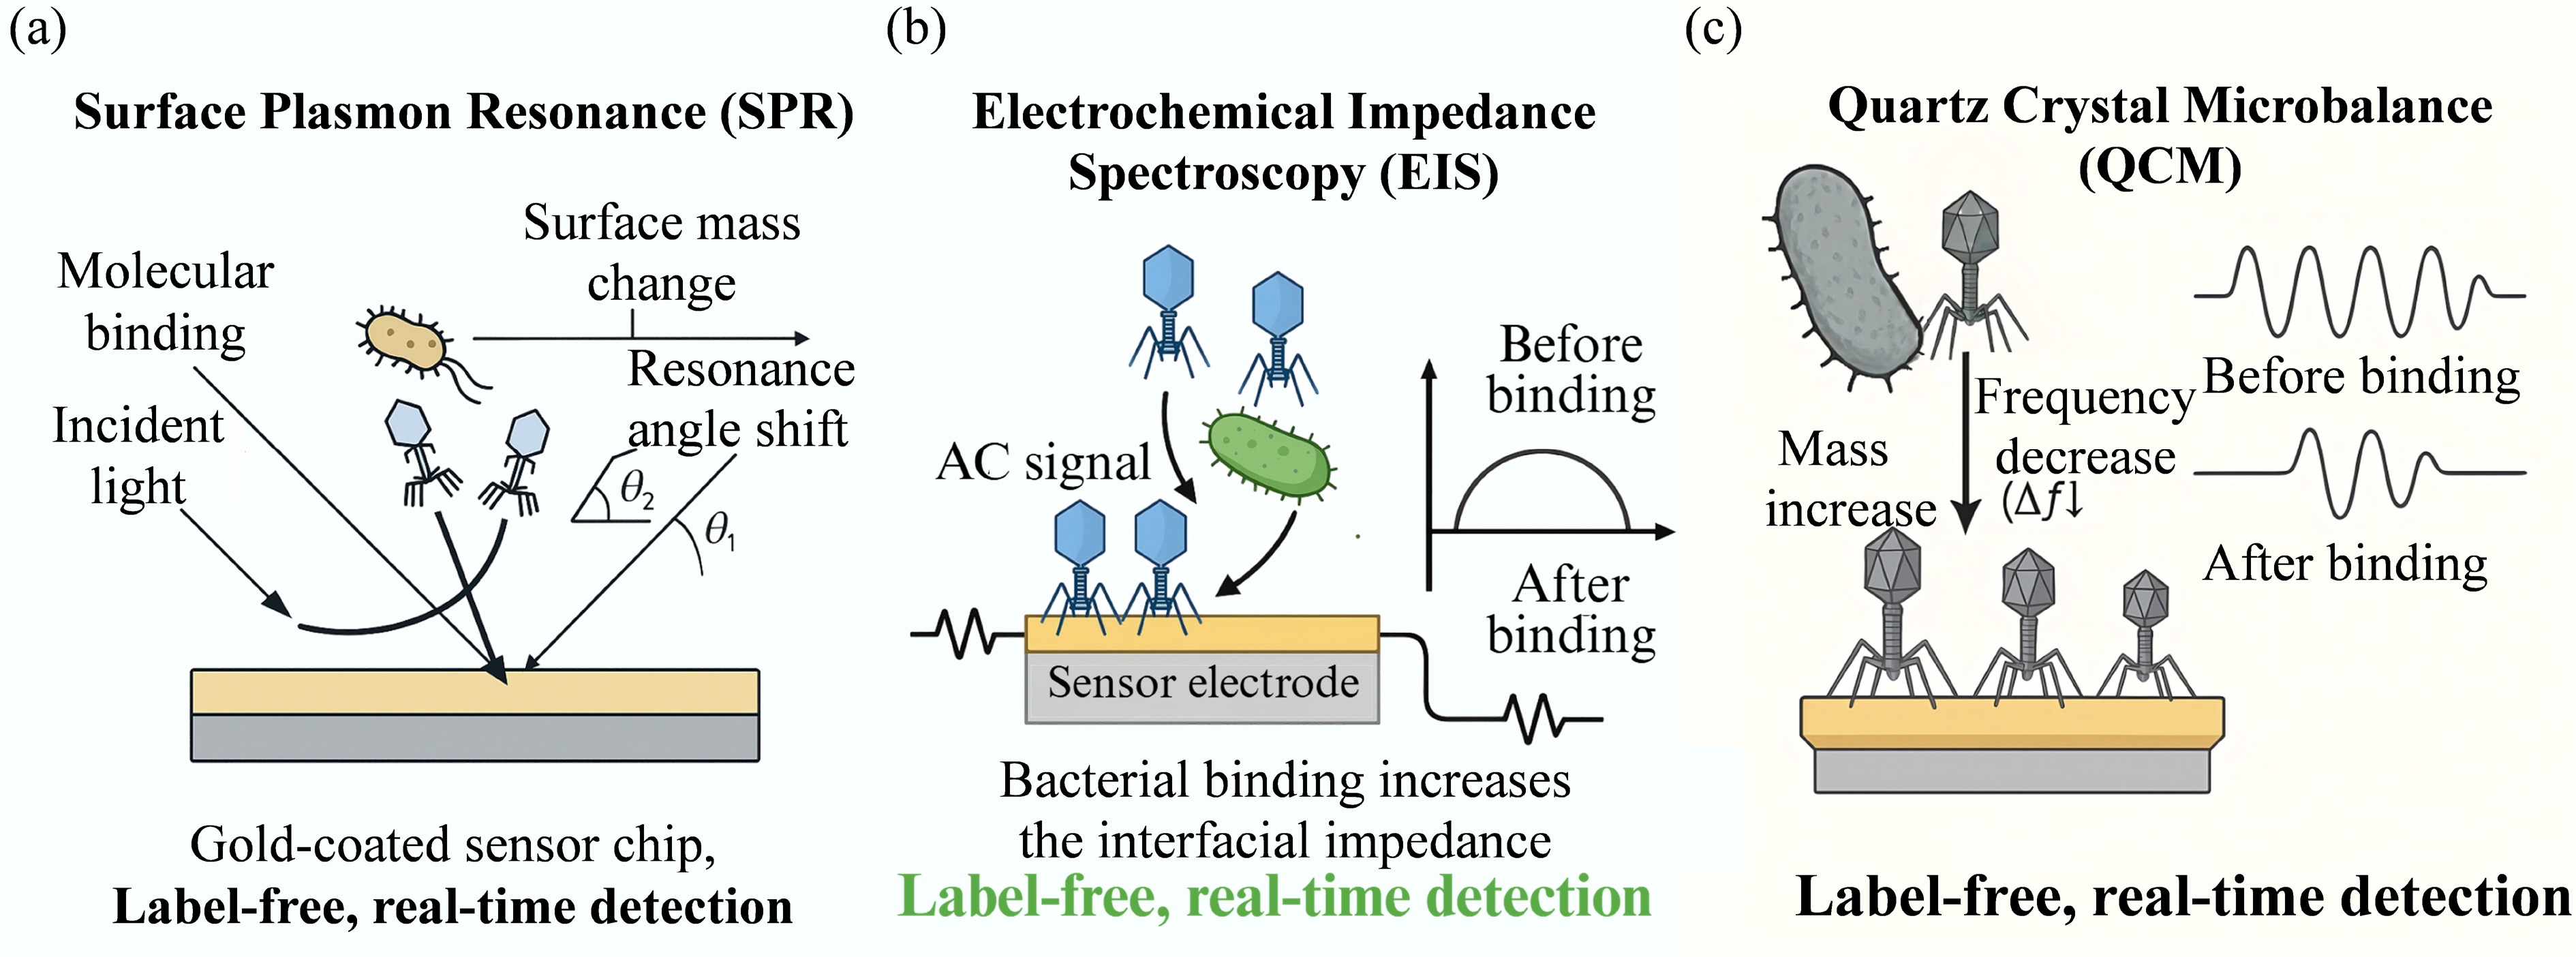
Figure 8.
Schematic illustration of representative label-free, real-time signal transduction mechanisms in phage-based biosensors. (a) Surface Plasmon Resonance (SPR) detects bacterial binding events by monitoring refractive index changes near a gold-coated sensor surface. The interaction between phage-coated surfaces and bacterial targets induces a measurable resonance angle shift (Δθ). (b) Electrochemical Impedance Spectroscopy (EIS) measures changes in interfacial impedance at a phage-functionalized electrode. When bacteria bind to immobilized phages, electron transfer is hindered, resulting in an increase in the impedance signal. (c) Quartz Crystal Microbalance (QCM) detects bacterial capture by monitoring frequency shifts (Δf). The increase in mass on the sensor surface causes a corresponding decrease in resonance frequency, allowing for direct mass quantification.
-
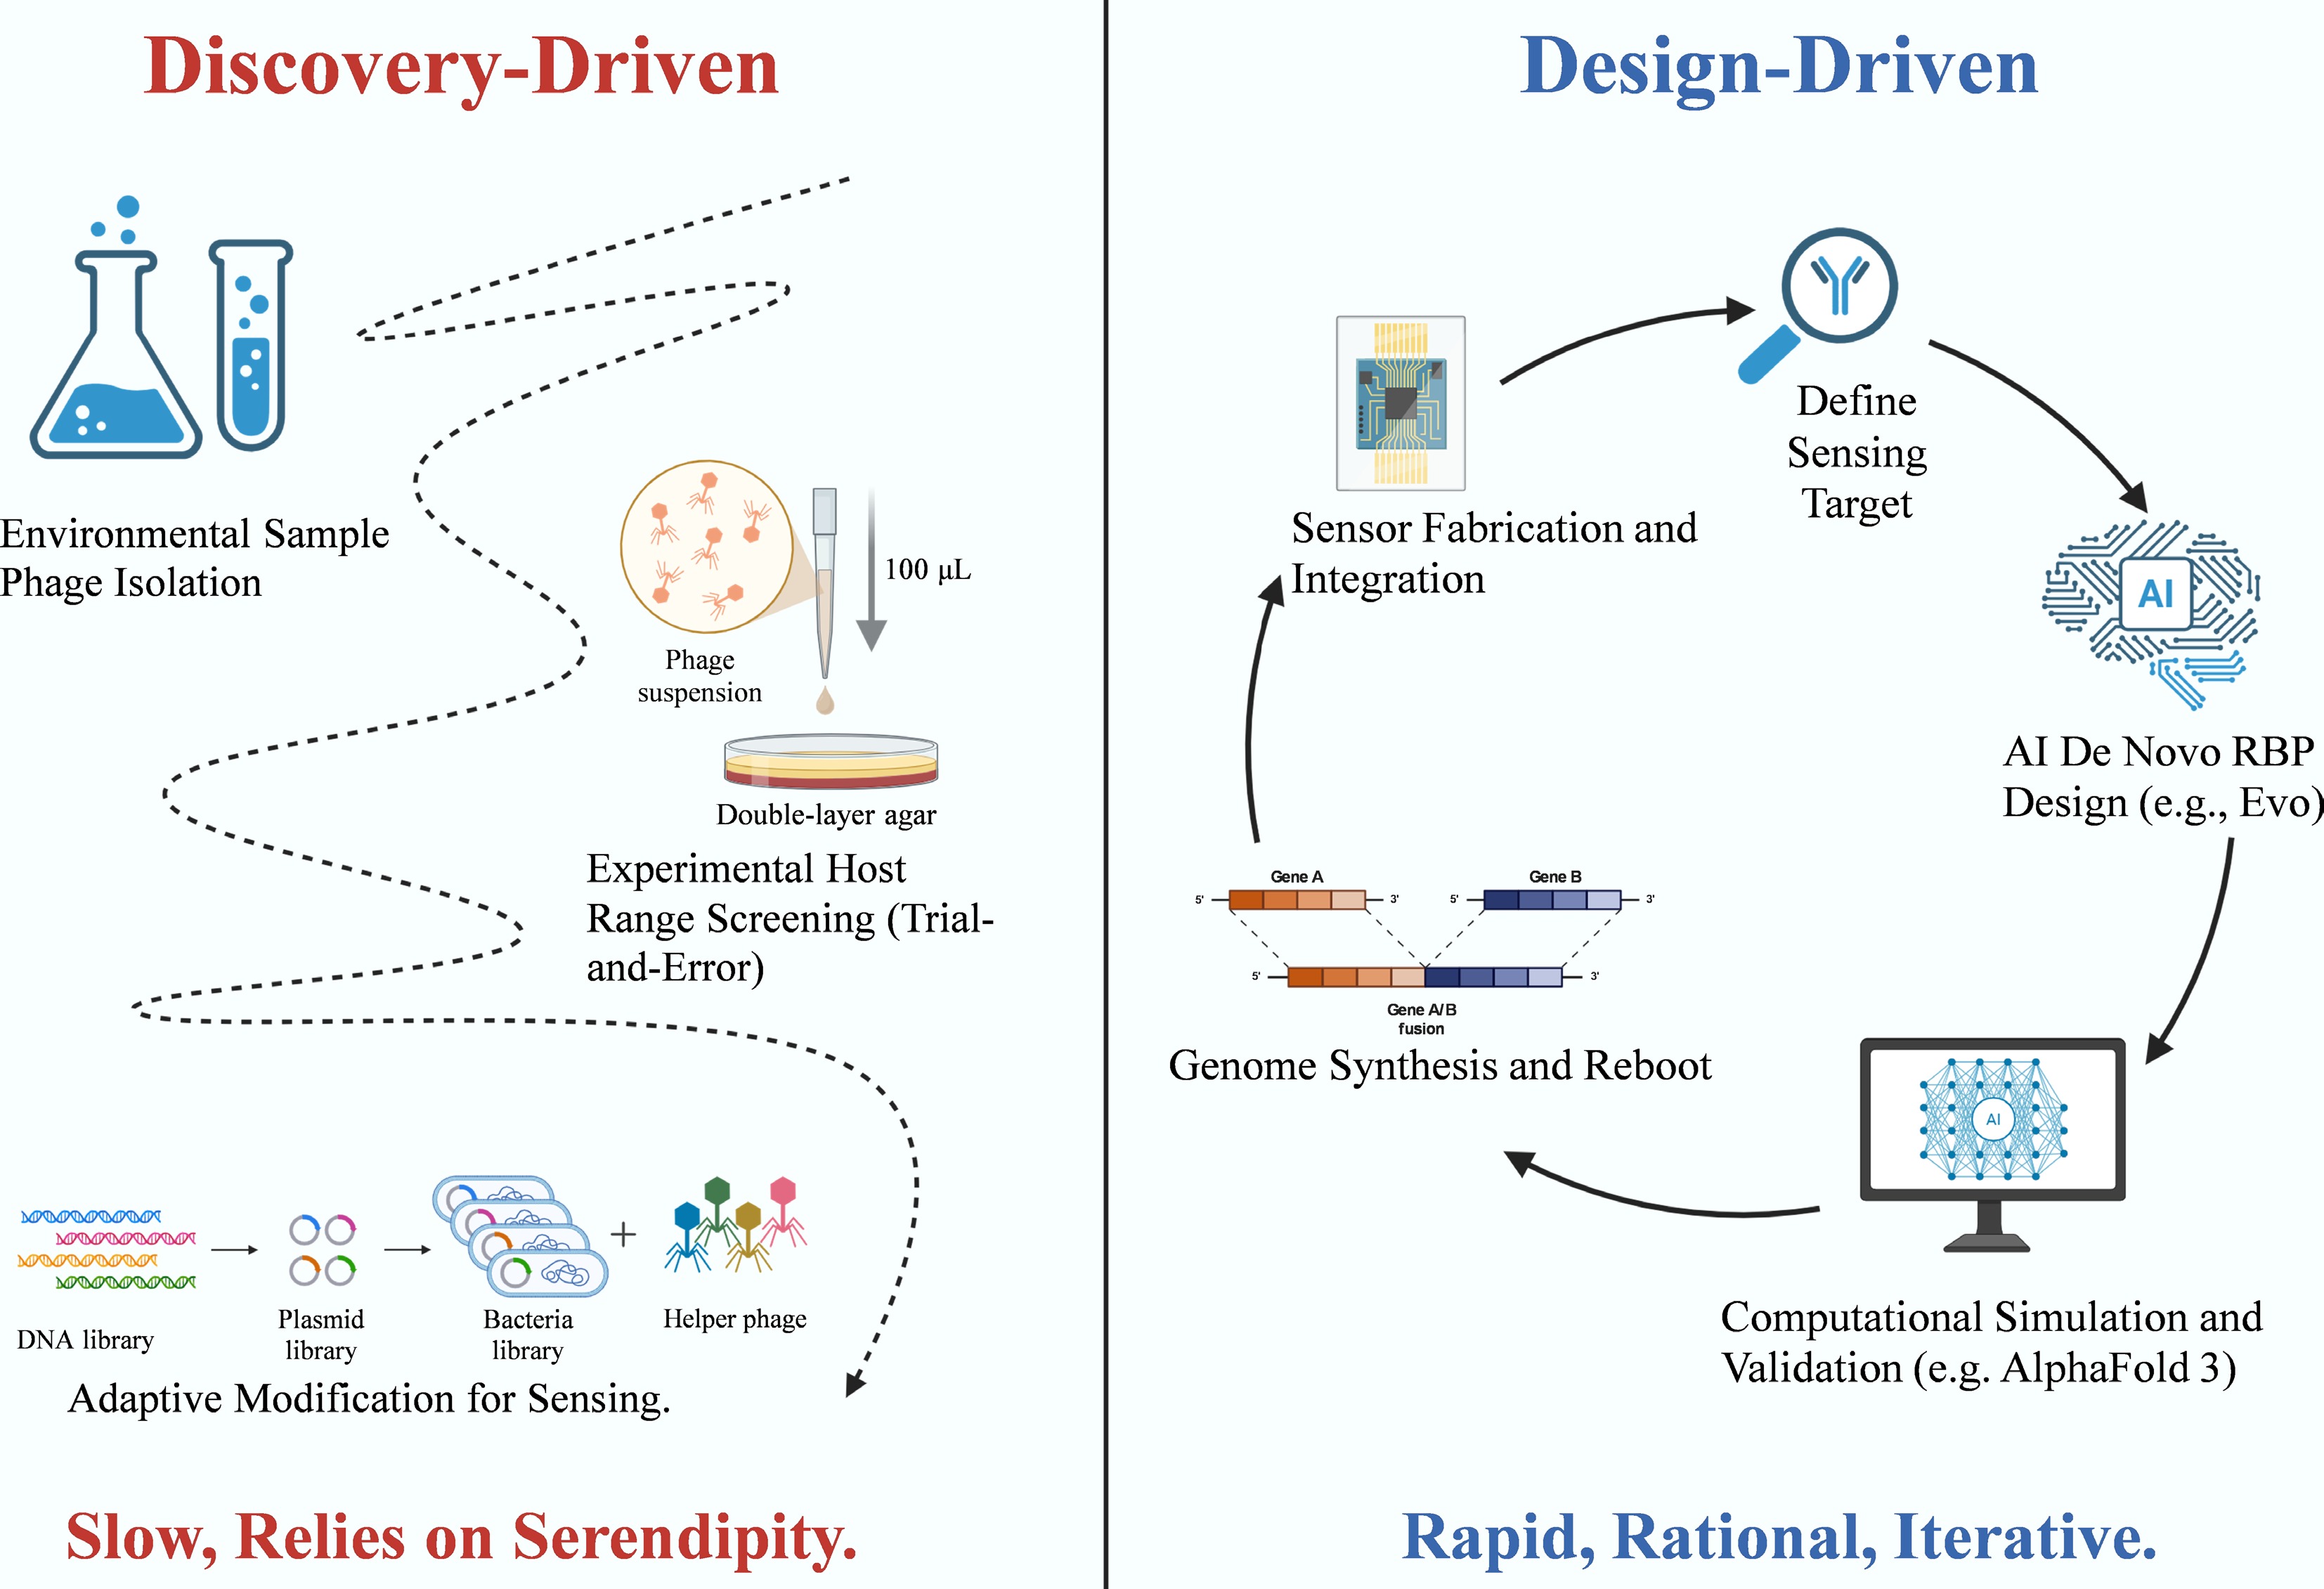
Figure 9.
Paradigm shift in phage sensor development: from discovery-driven to design-driven. The diagram illustrates the transition from empirical isolation to rational, AI-assisted design workflows. The Discovery-Driven approach (left) relies on environmental sampling and trial-and-error host range screening, a process often limited by serendipity. In contrast, the Design-Driven approach (right) employs a rapid, iterative cycle utilizing AI for de novo receptor-binding protein (RBP) design and computational simulation (e.g., AlphaFold 3), followed by genome synthesis, rebooting, and integration with sensor platforms.
-
Strategy Advantages Limitations/trade-offs Time to result Suitable applications Immobilization Rapid detection; real-time compatible Orientation effects; non-specific binding; surface fouling 30 min−1 h Real-time sensors (SPR, QCM) Phage amplification High sensitivity; biological signal amplification Longer time-to-result; viability-dependent; less robust 2−4 h Low-cost lateral flow strips Reporter phages High specificity; detects viable cells only Requires genetic engineering; regulatory concerns 4−9 h (typical) Clinical diagnostics; water testing Table 1.
Comparative evaluation of phage-based recognition strategies
-
Sensing method Transduction Target pathogen LOD Time Matrix Key innovation Ref. Reporter phages Fluorescence (NanoLuc) E. coli O157:H7 < 10 CFU 9 h Ground beef Integration of ultrabright NanoLuc luciferase for extreme sensitivity [31] Phage amplification Colorimetric (LFA) Bacillus anthracis 2.5 × 10⁴ CFU/mL 2 h Buffer Coupling biological amplification with portable lateral flow immunochromatography [26] Immobilization-based capture Mass-sensitive (QCM-D) MRSA Not specified Real-time Buffer Dual-step recognition (phage capture + antibody binding) enabling strain differentiation [46] Reporter phages Amperometry (ALP) E. coli 1 CFU/100 mL 8 h Drinking water Magnetic bead pre-enrichment combined with self-immobilizing fusion enzymes (ALP–GBPs) [80] Table 2.
Performance comparison of representative phage-based biosensor architectures
Figures
(9)
Tables
(2)