-
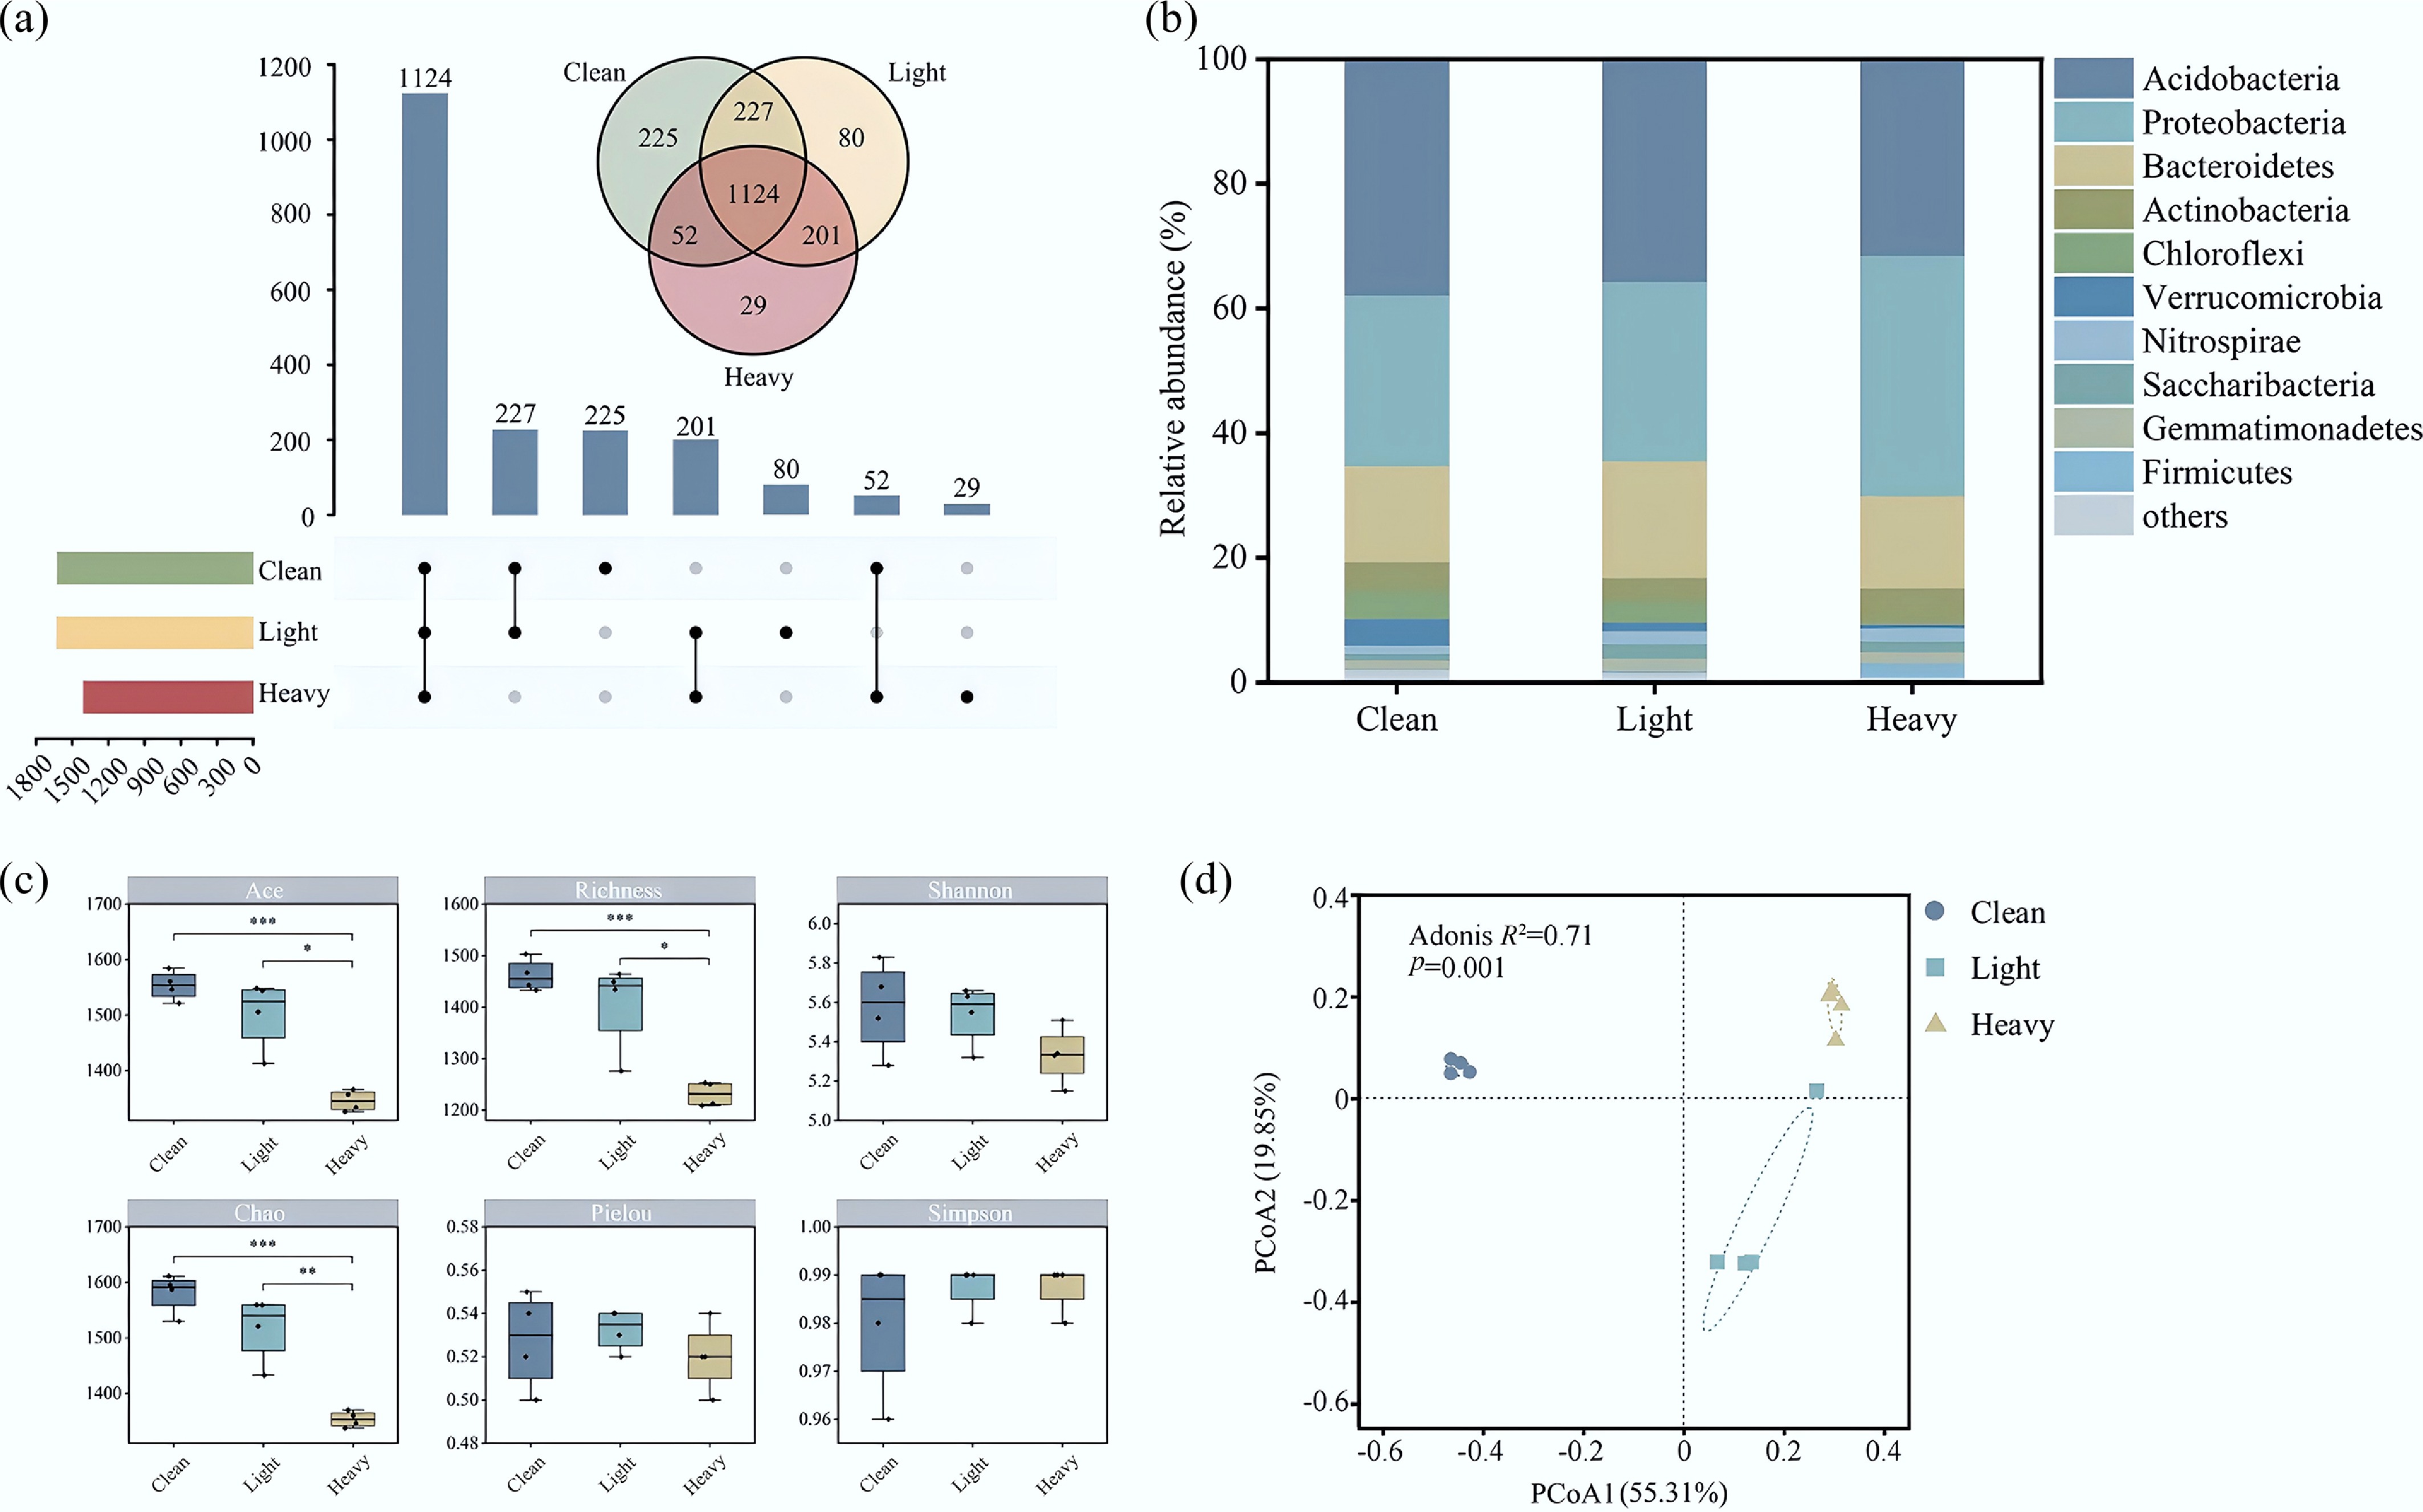
Figure 1.
Composition of the bacterial communities in contaminated soils obtained from a shut-down brick kiln. (a) Differences in the OTU quantity among different sites; (b) relative abundances of the top 10 bacteria at the phylum level at different sites; (c) α diversity of the bacterial communities; (d) β diversity of the bacterial communities.
-
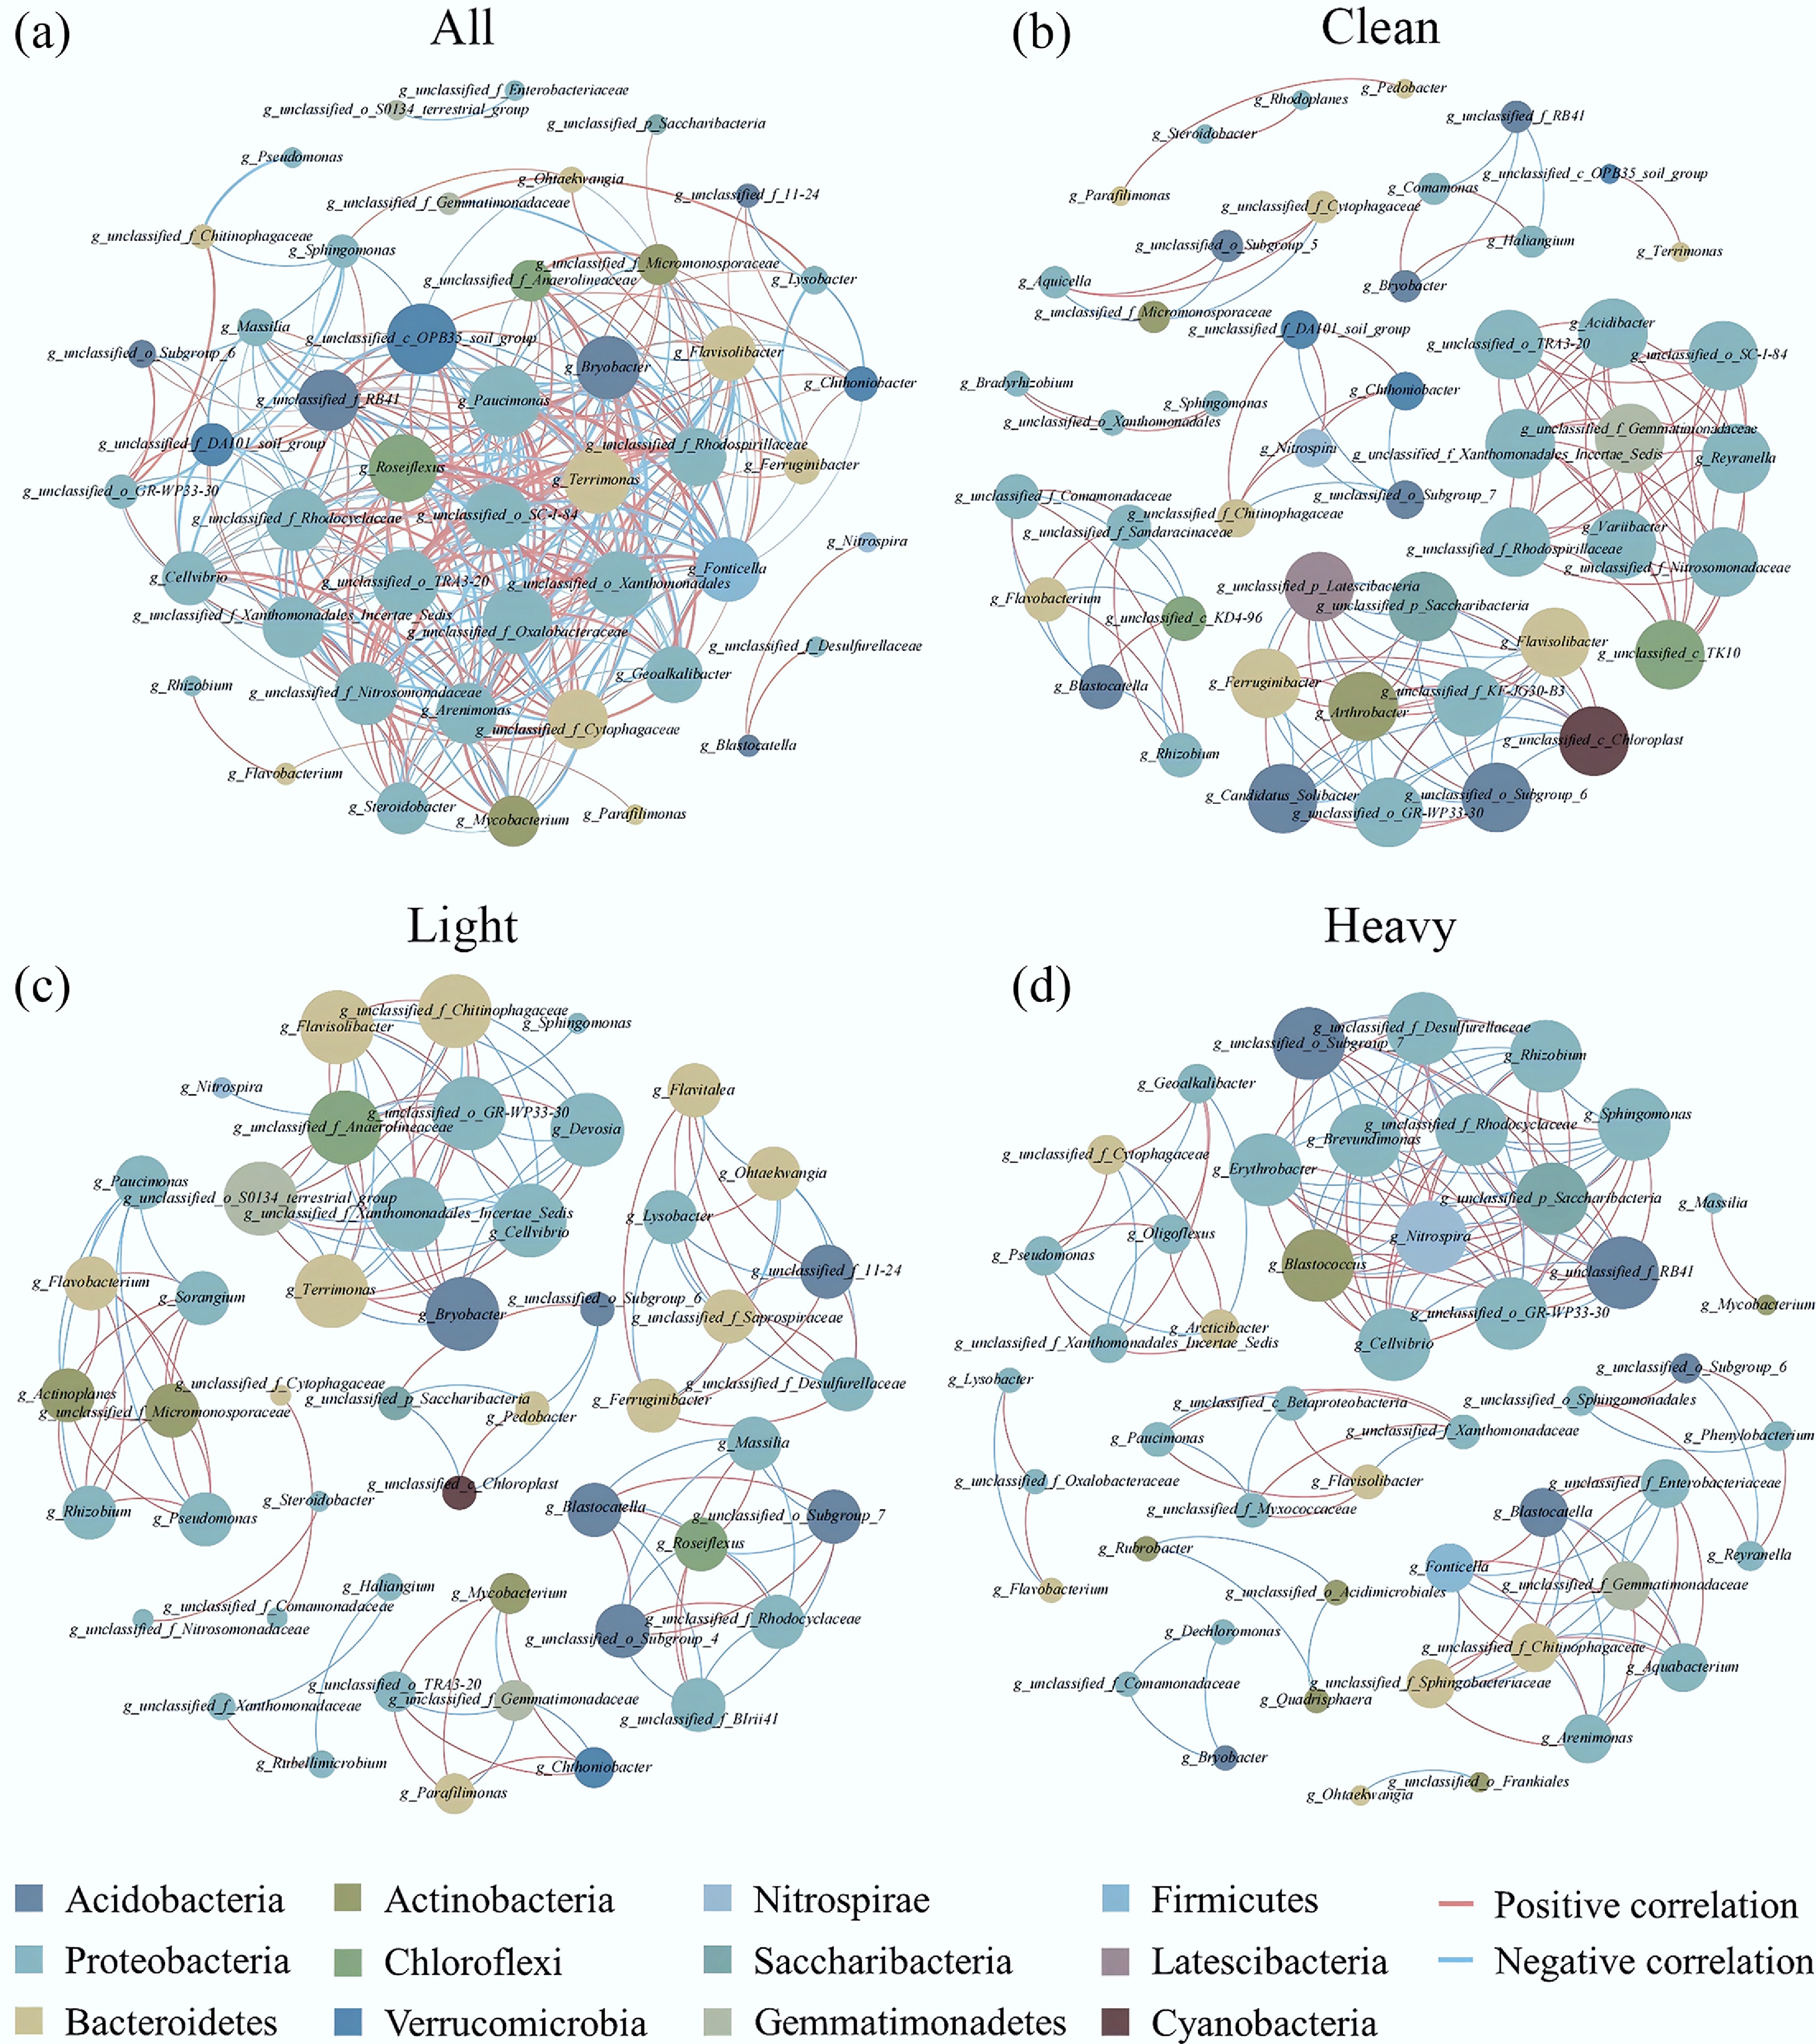
Figure 2.
Co-occurrence network of the top 50 bacteria in terms of their relative abundance at the genus level (Spearman correlation coefficient: r > 0.8, p < 0.01). (a) All samples (Clean, Light, and Heavy); (b) Clean, (c) Light, (d) Heavy. Red indicates a positive correlation and blue indicates a negative correlation. Please refer to the web version of this paper for more detail about the interpretation of the colors.
-
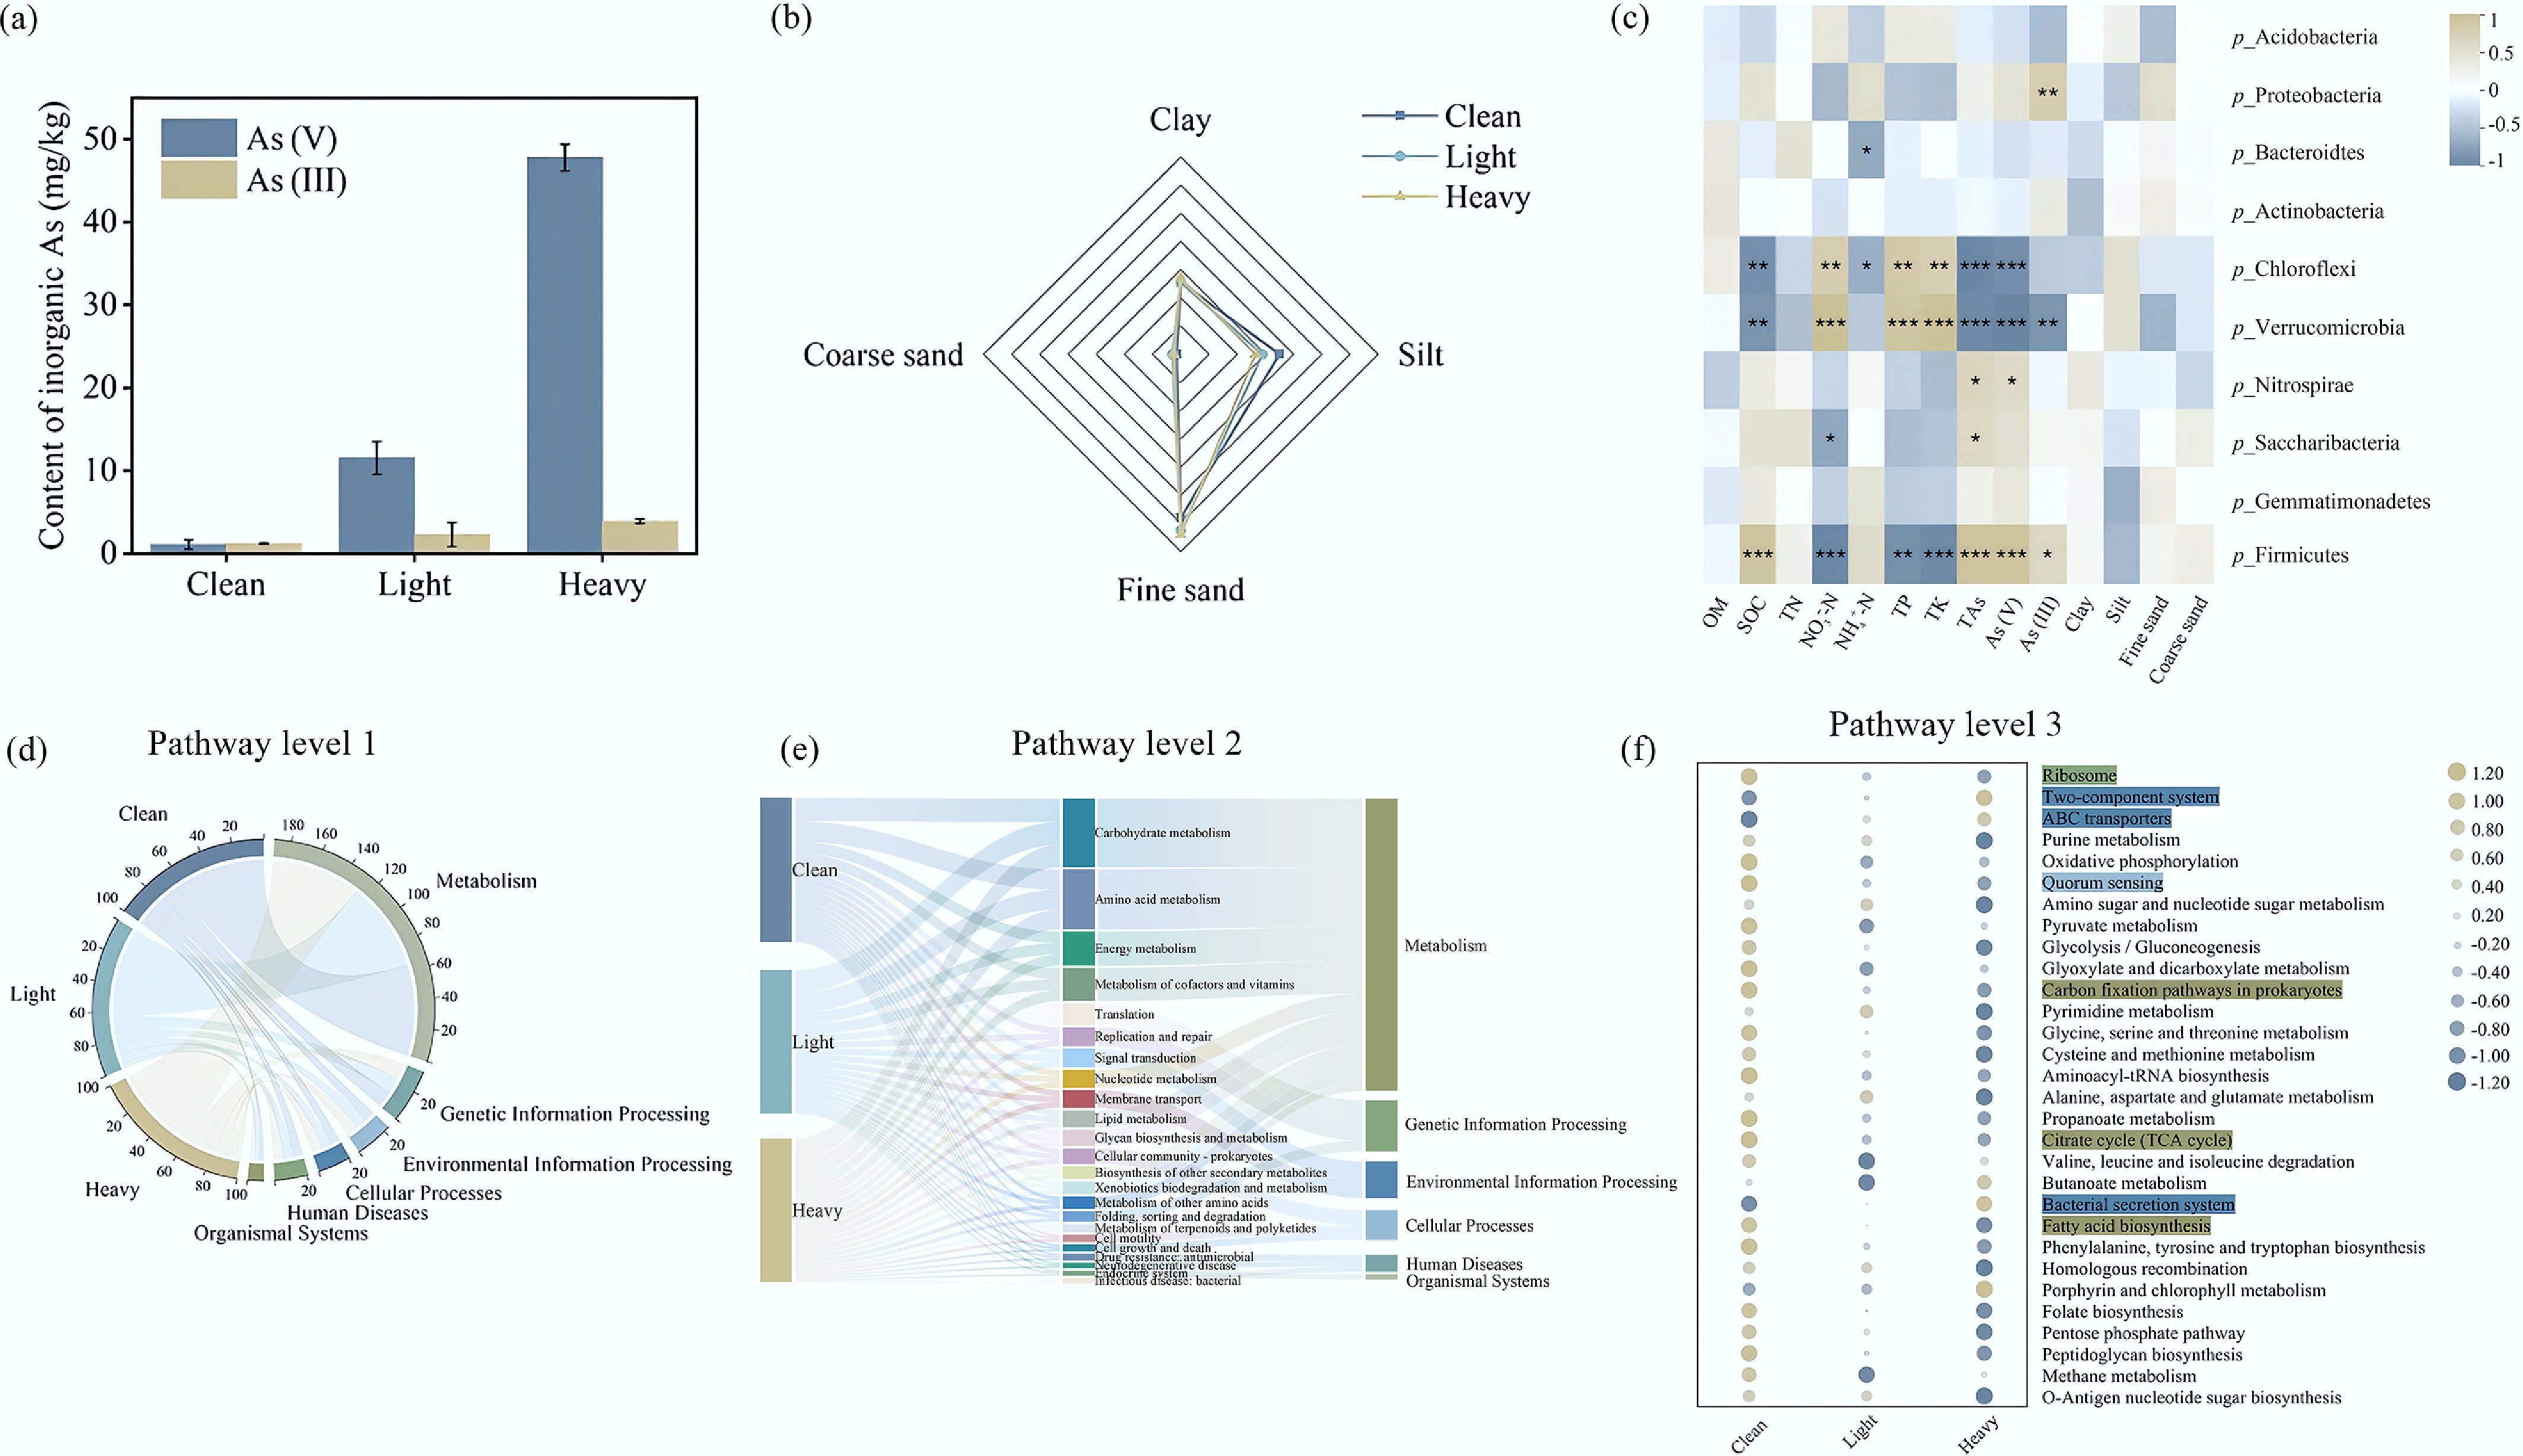
Figure 3.
(a) Inorganic As content; (b) mechanical composition of soils; (c) heat maps of the correlations between the bacterial community (phylum level), the soil physicochemical properties, and heavy metals contamination. OM: organic matter; SOC: soil organic carbon; TN: total nitrogen; TP: total phosphorus; TK: total potassium; TAs: total arsenic; (d) Circos diagram illustrating the inter-group distribution of KEGG Level 1 pathways; (e) Sankey diagram showing the hierarchical mapping and contribution of Level 1 categories to the 23 most abundant Level 2 metabolic pathways; (f) the bubble diagram is composed of the top 30 level-three metabolic pathways in terms of relative abundance.
-
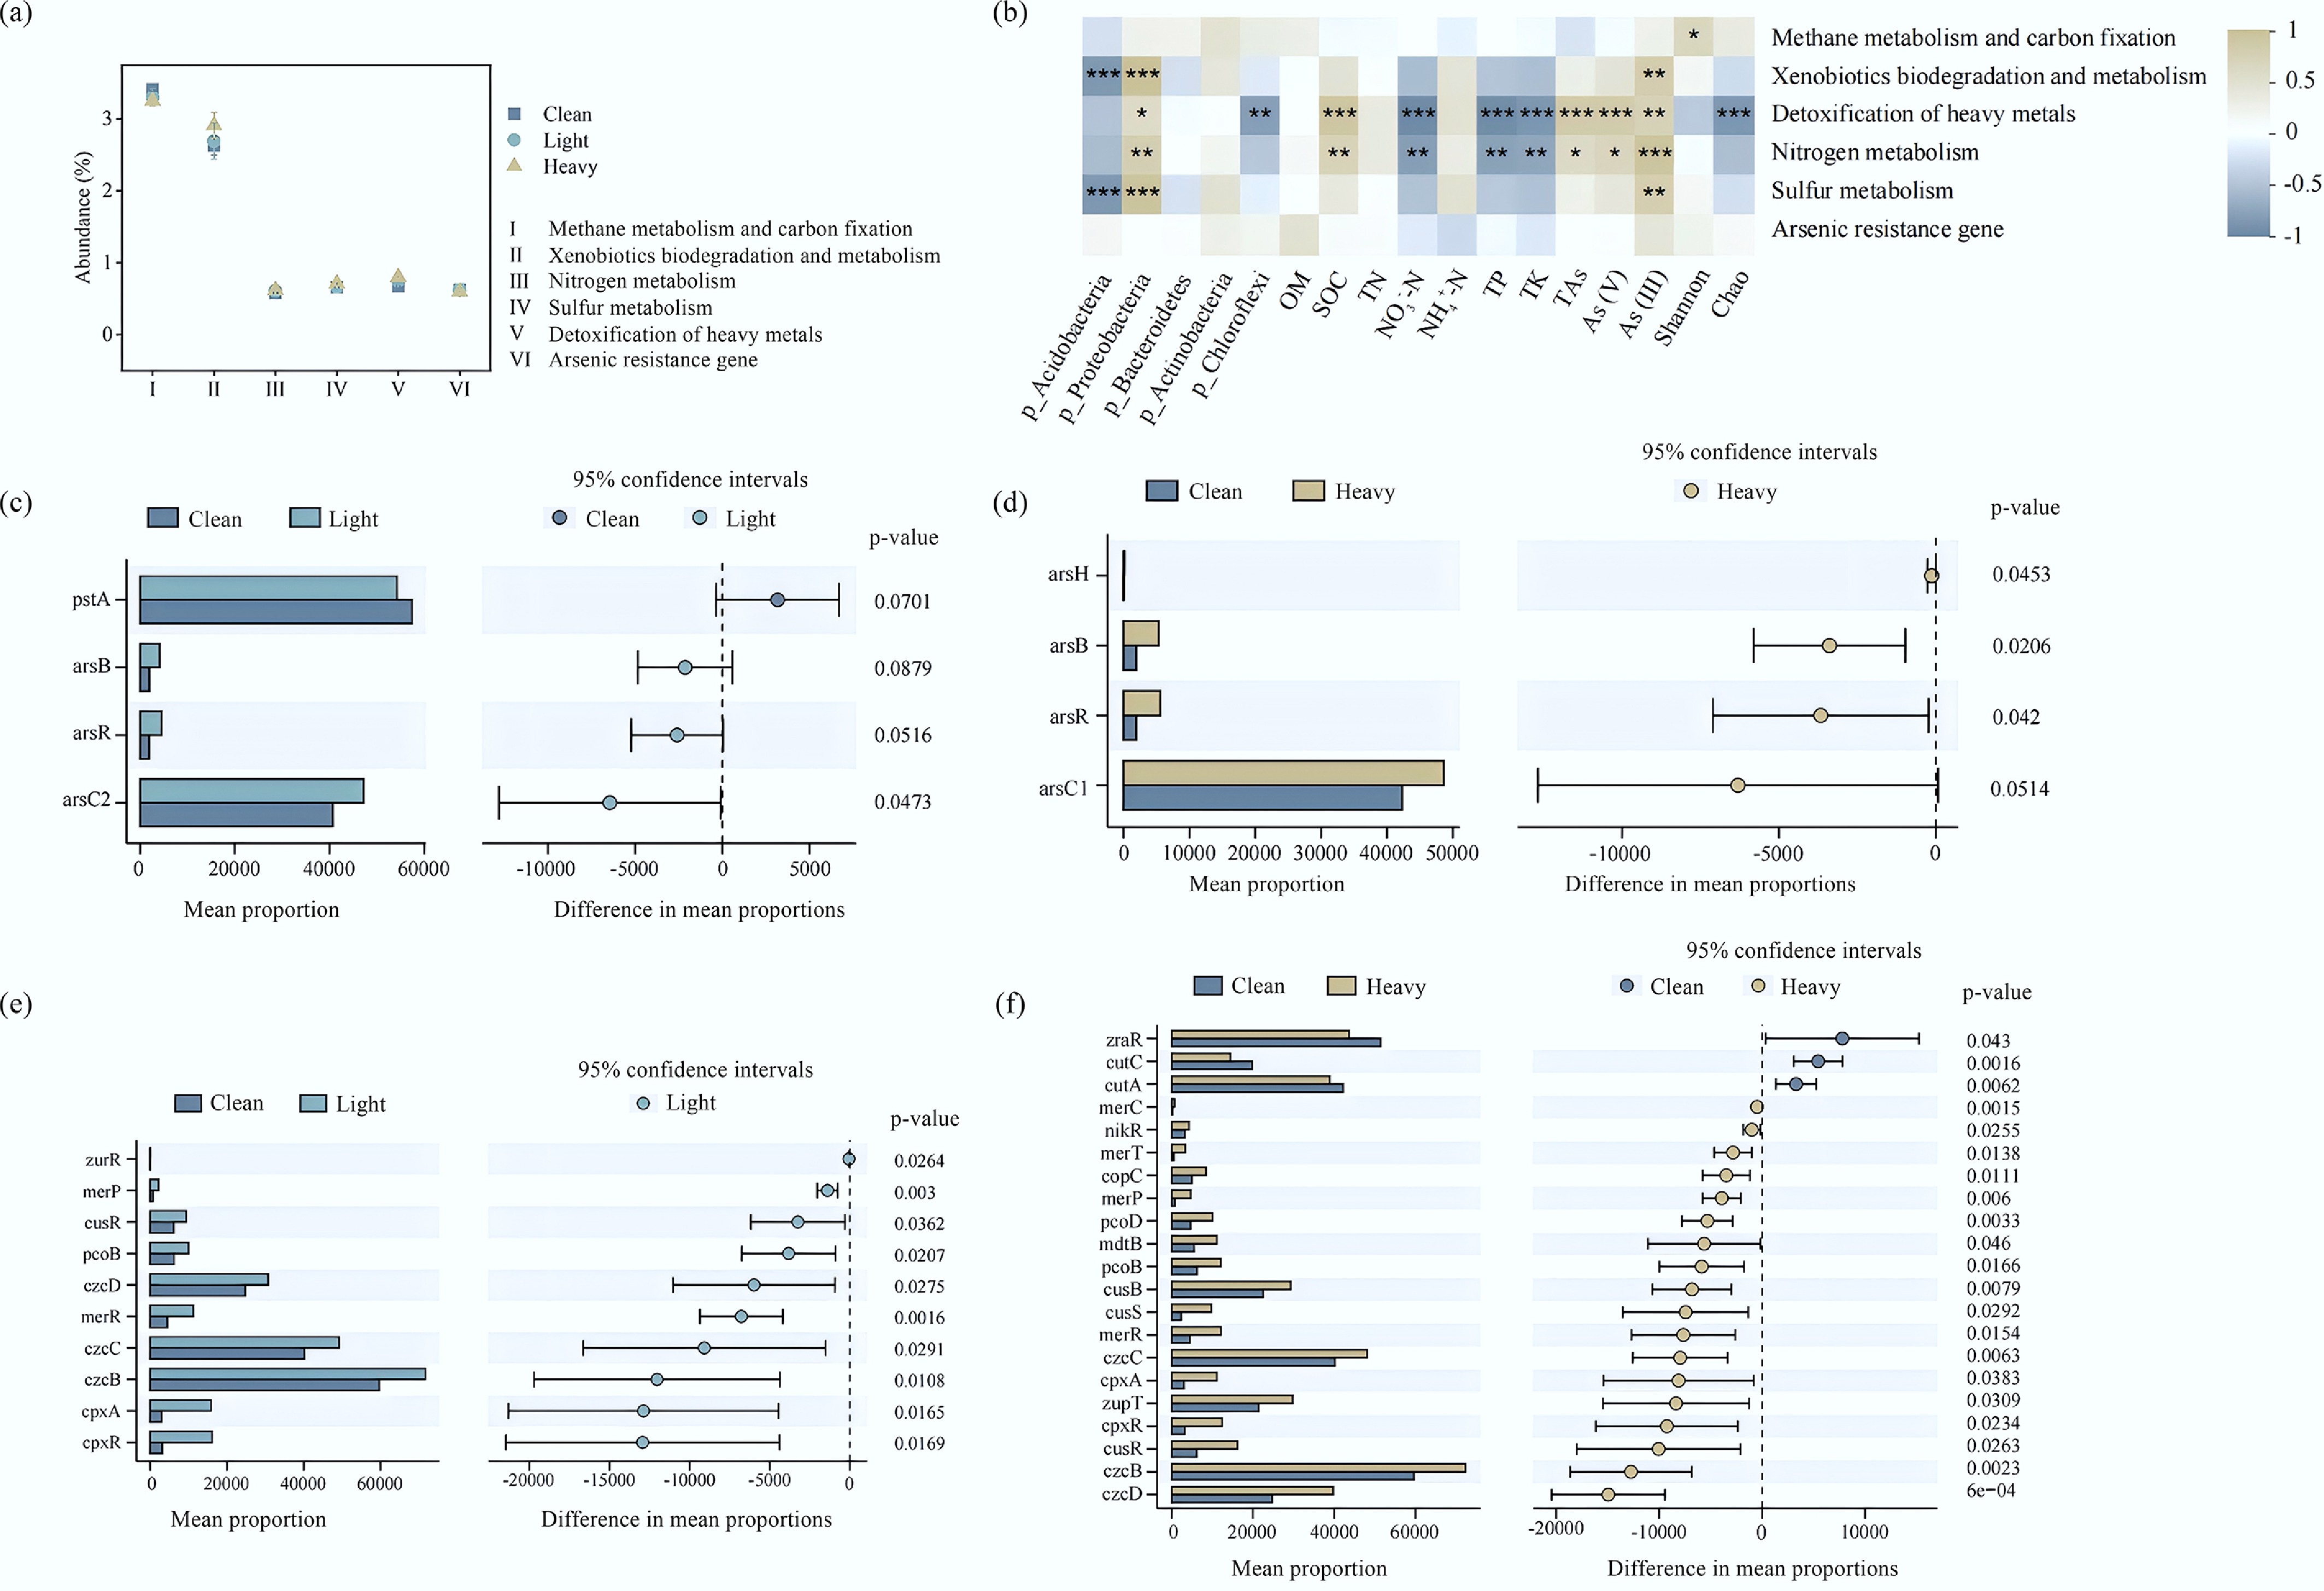
Figure 4.
(a) Changes in the relative abundances of carbon metabolism, nitrogen metabolism, sulfur metabolism, xenobiotics biodegradation and metabolism, and HMRGs of bacterial communities. (b) Correlations between functional gene clusters (carbon metabolism, nitrogen metabolism, sulfur metabolism, xenobiotics biodegradation and metabolism, HMRGs and As detoxification), and environmental factors of bacterial communities. (c) Stamp analysis of As resistance genes (Clean and Light). (d) Stamp analysis of As resistance genes (Clean and Heavy). (e) Stamp analysis of HMRGs (Clean and Light). (f) Stamp analysis of HMRGs (Clean and Heavy).
Figures
(4)
Tables
(0)