-
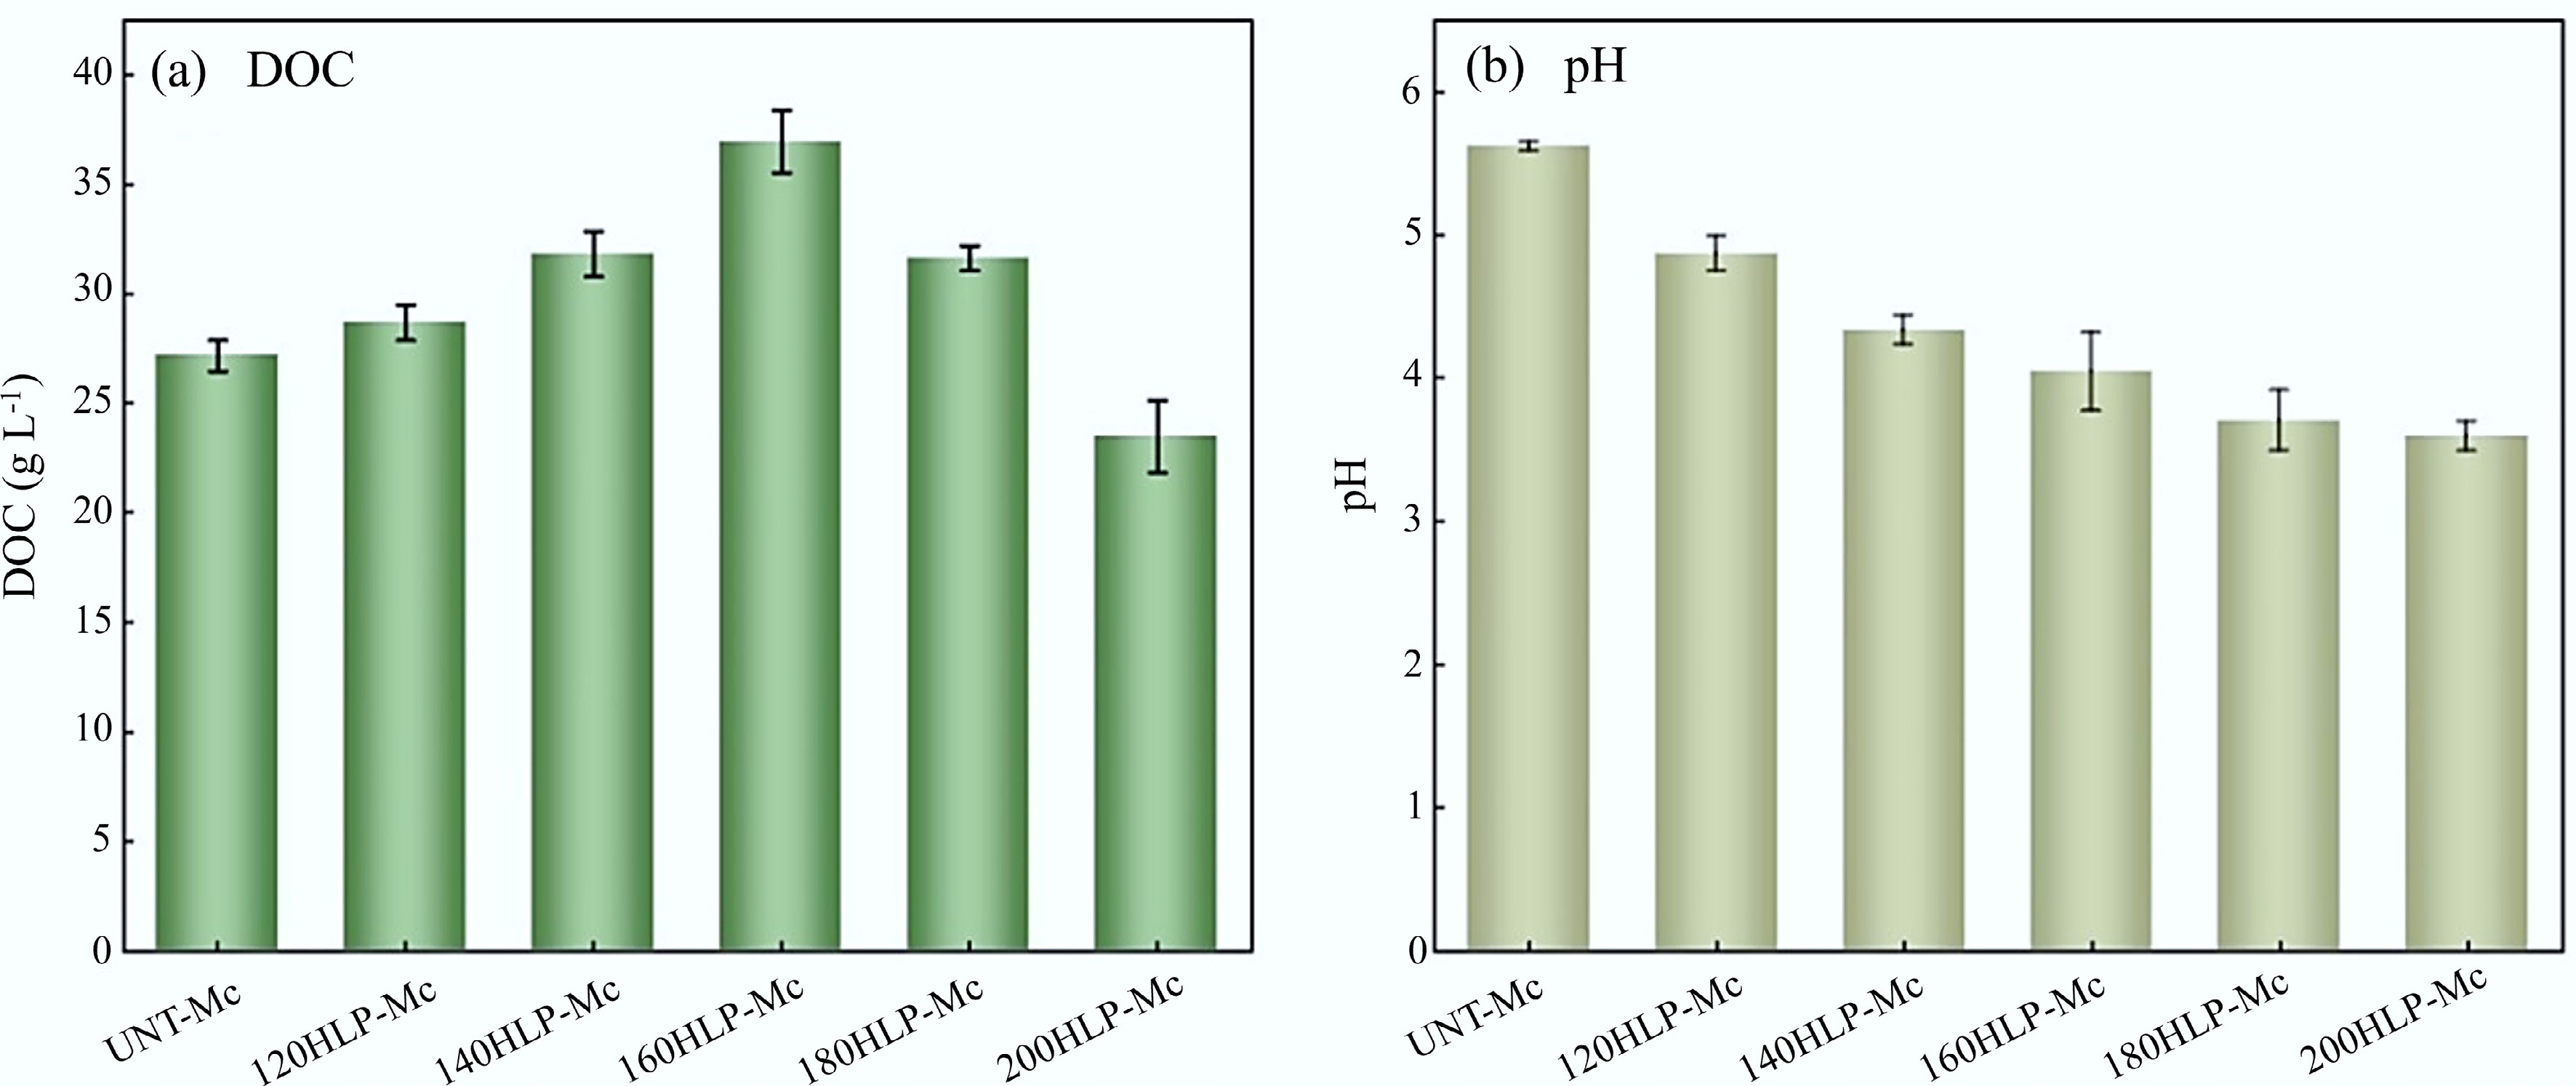
Figure 1.
Changes of DOC and pH in the HLP of FW.
-
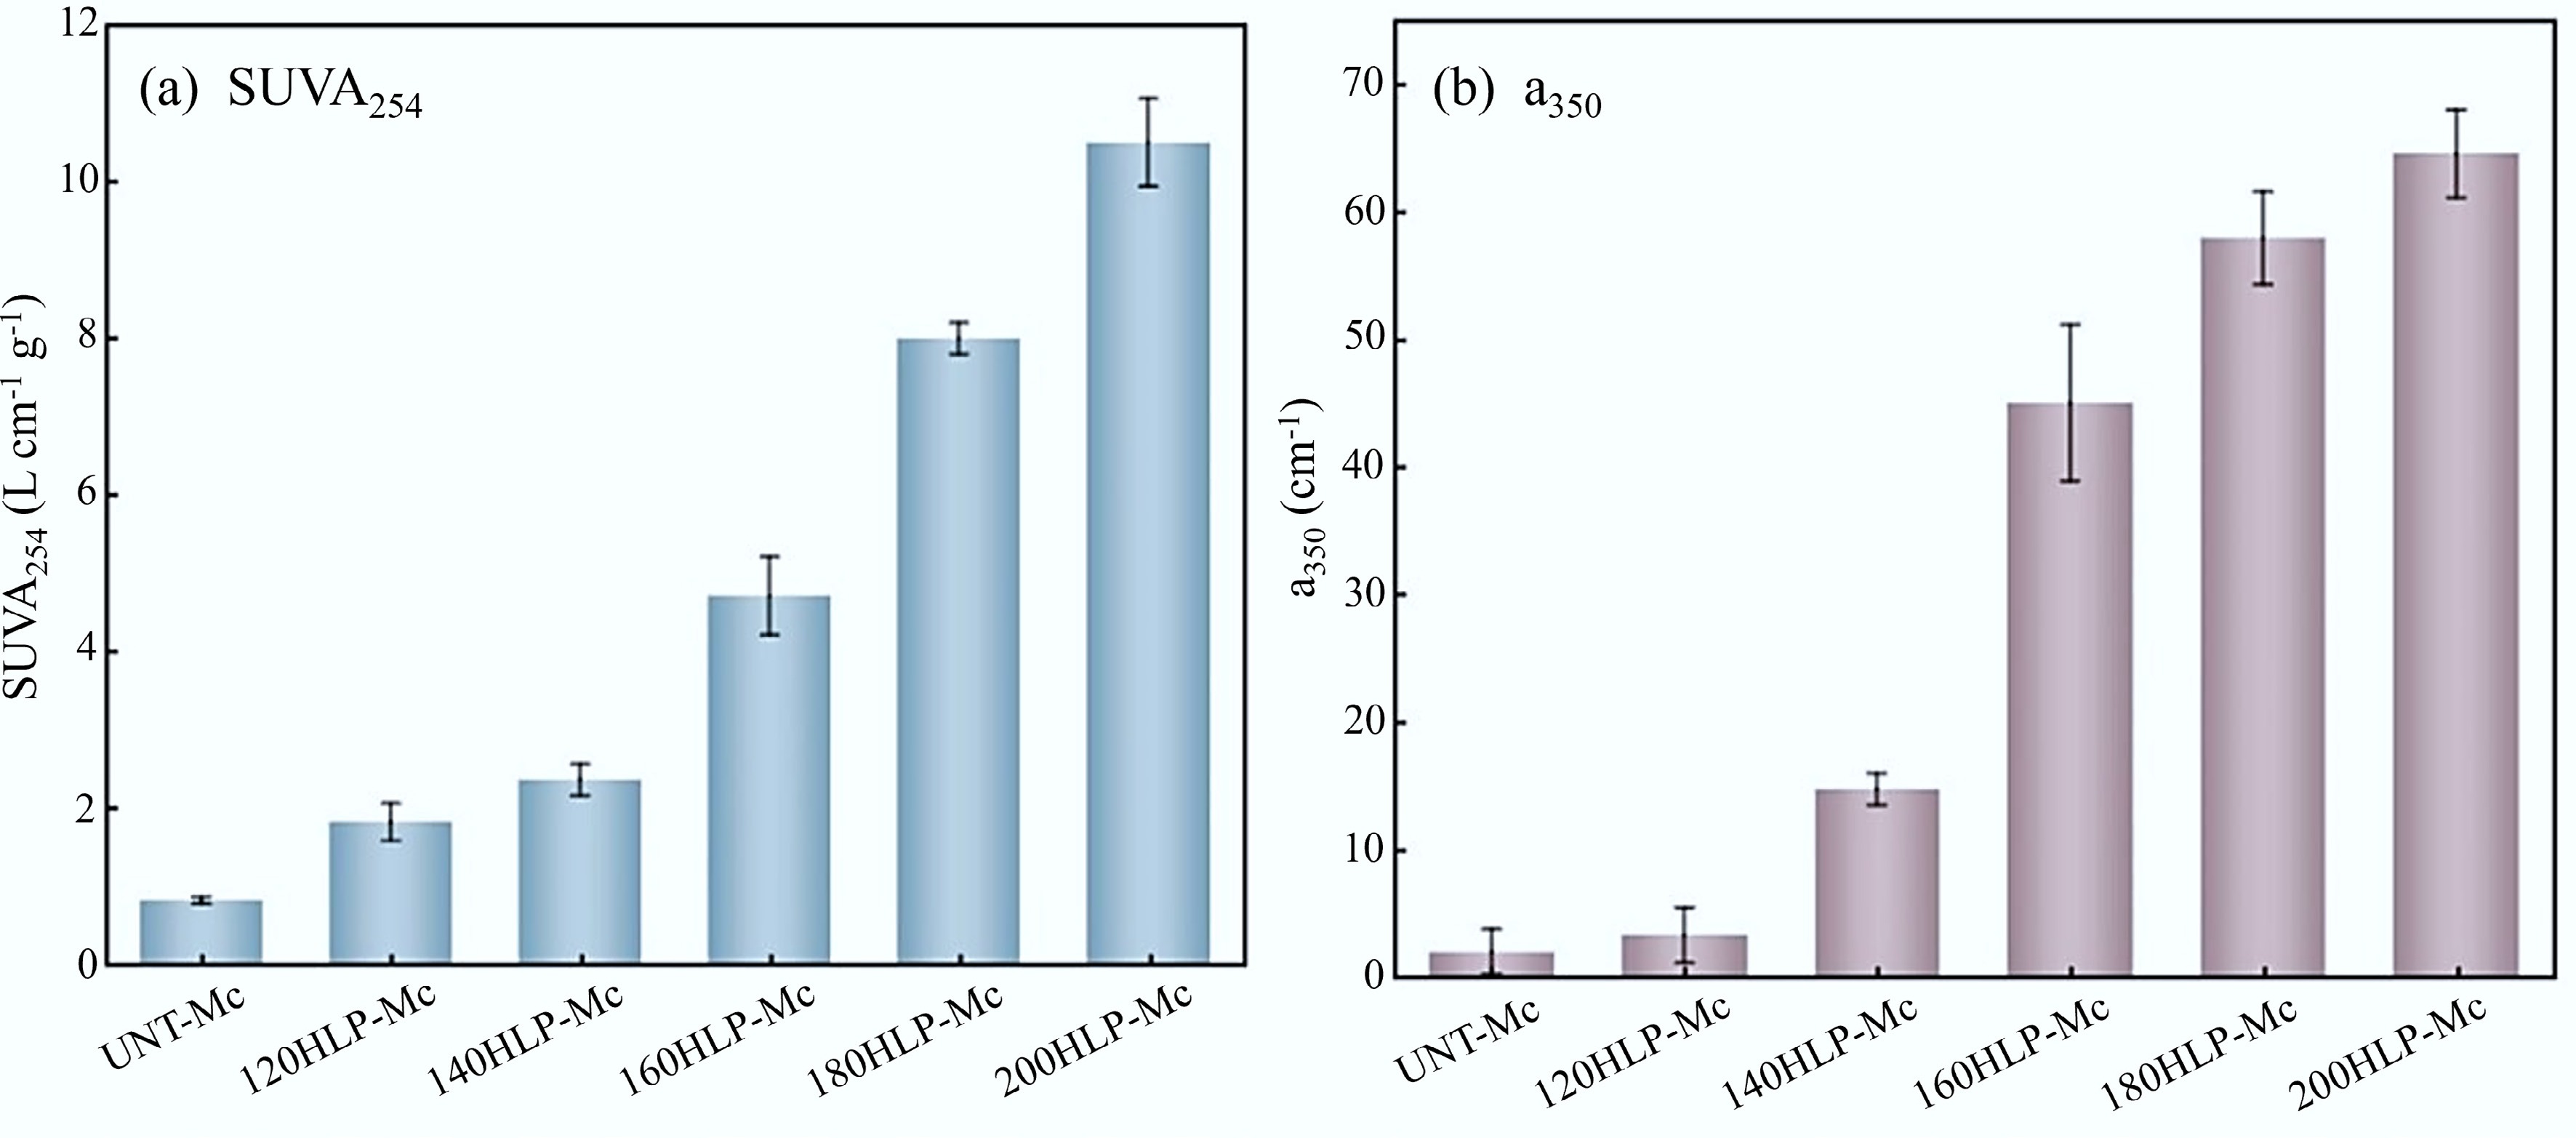
Figure 2.
Change of absorption parameters in HLP.
-
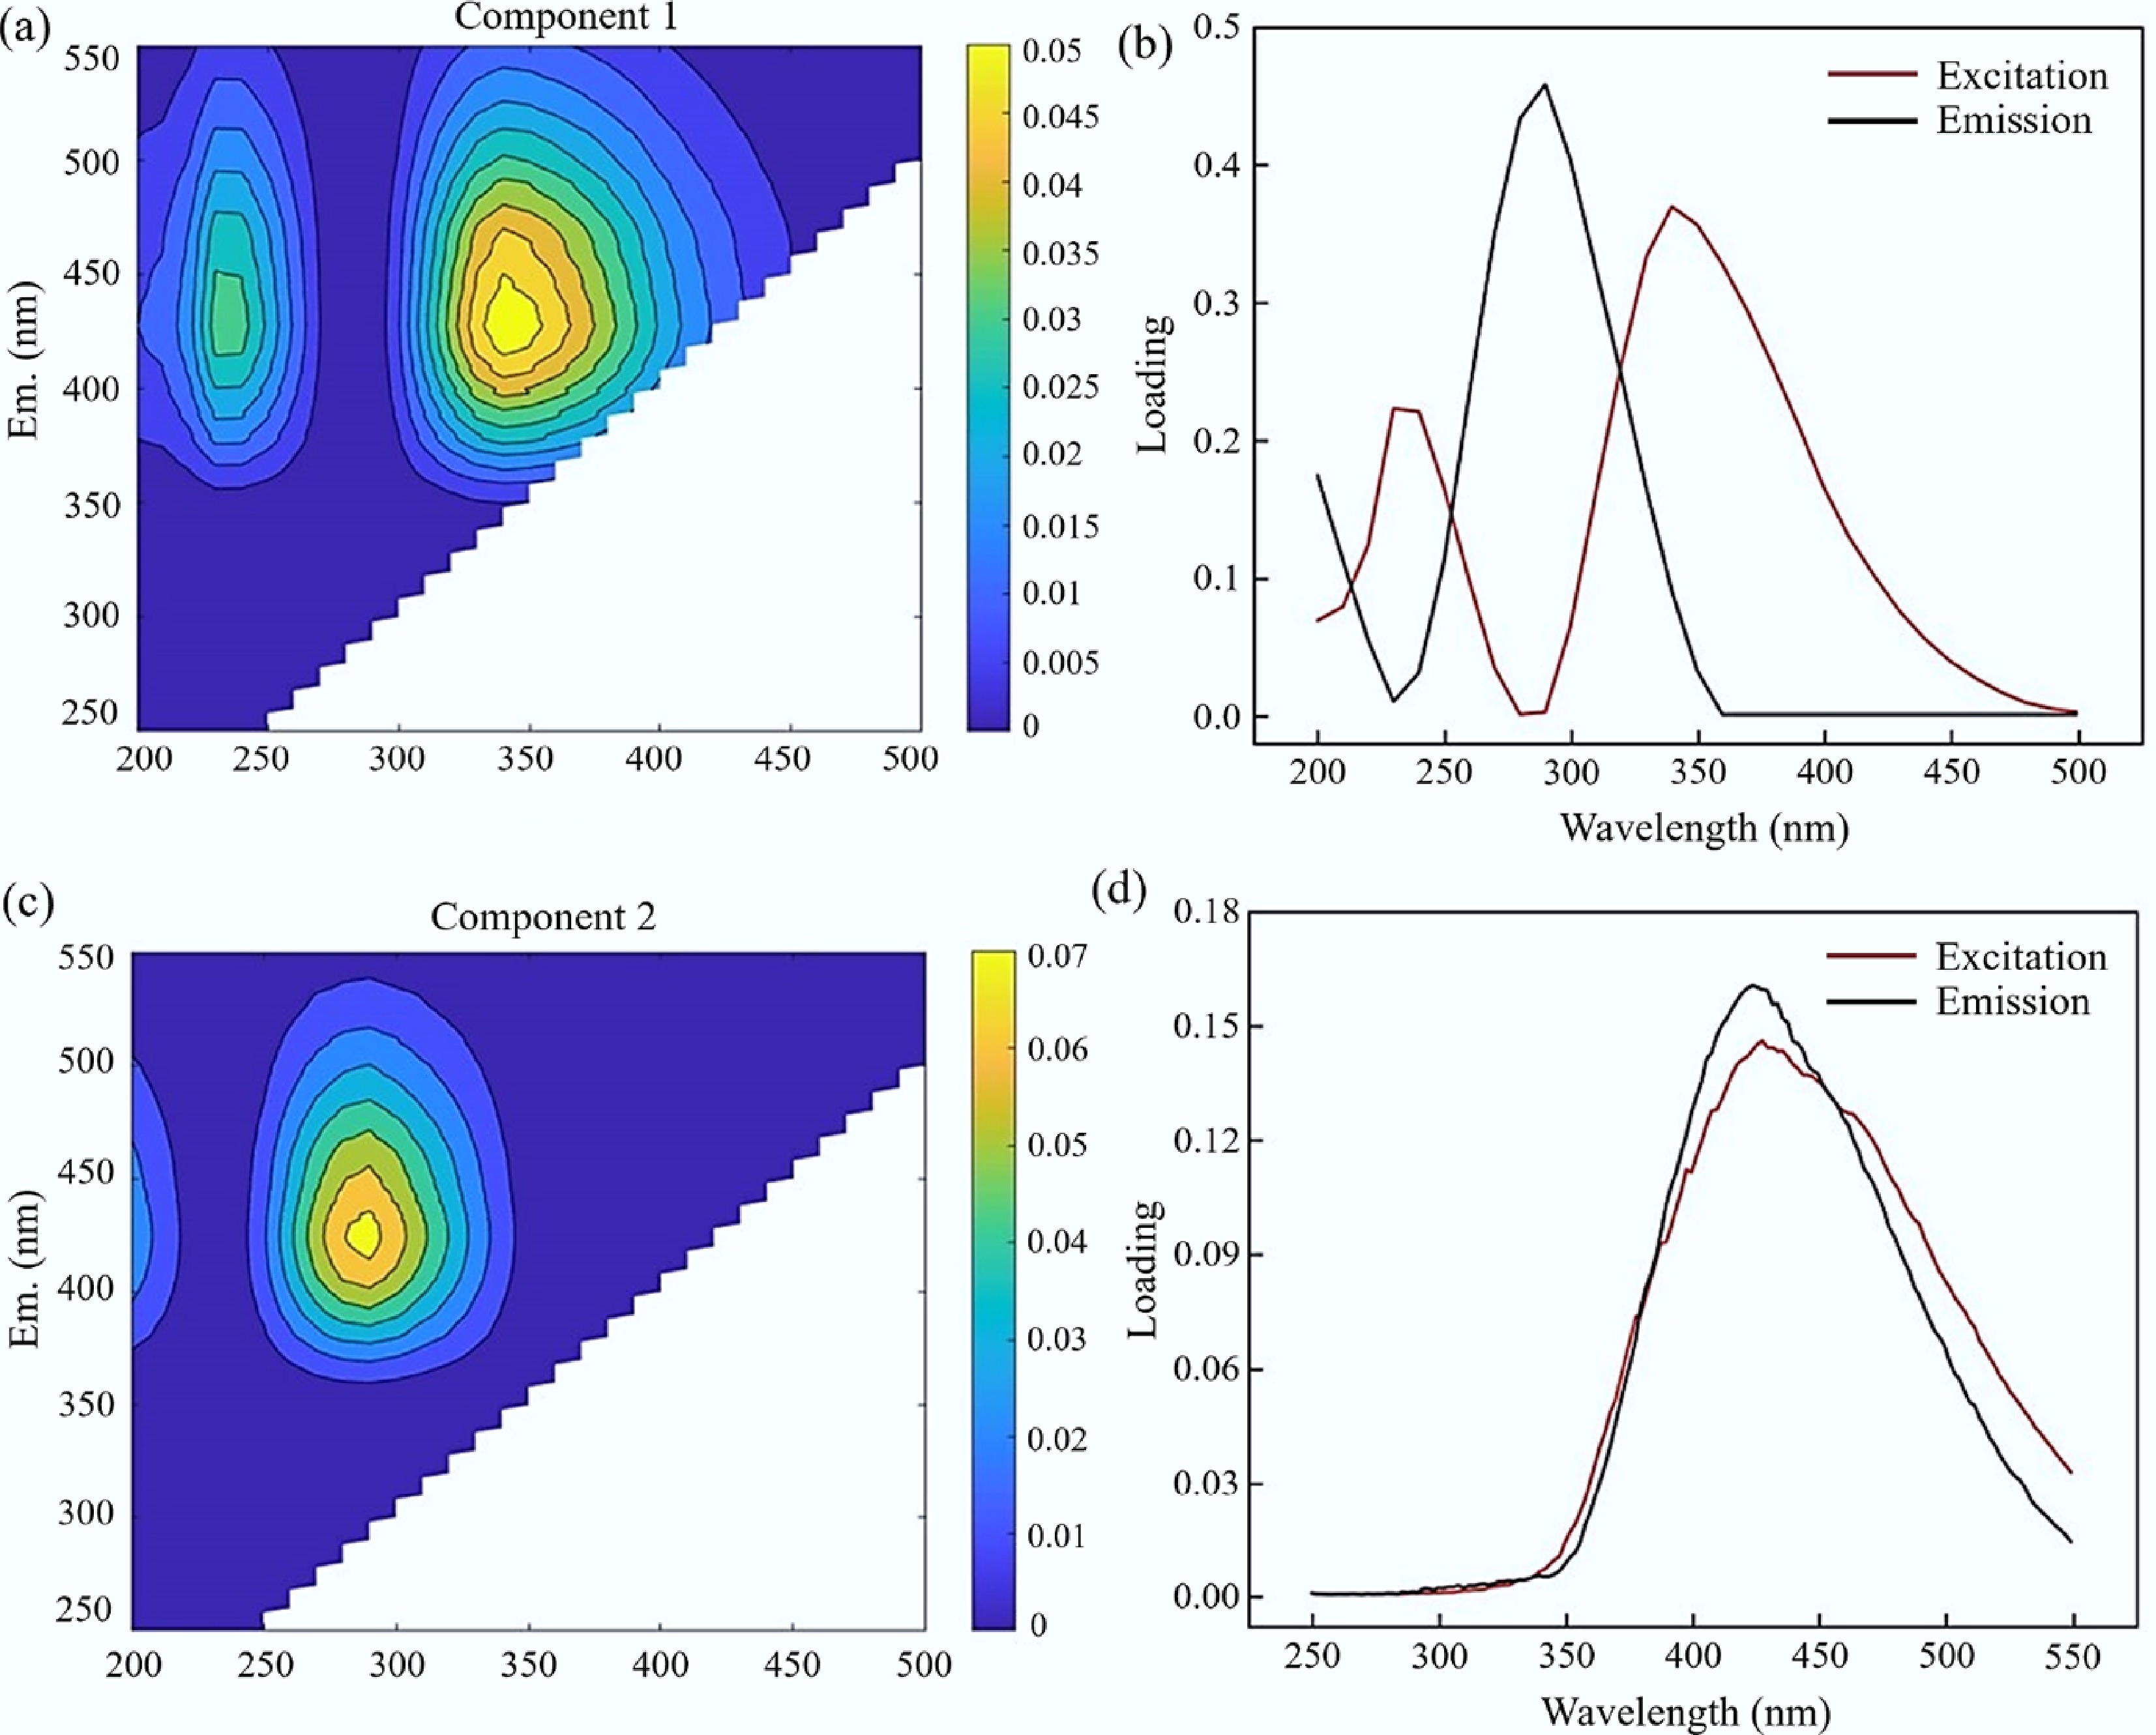
Figure 3.
Two-component PARAFAC model generated from FW HLP. (a), (b) Contour plots of the spectral shapes. (c), (d) Excitation and emission load diagrams.
-
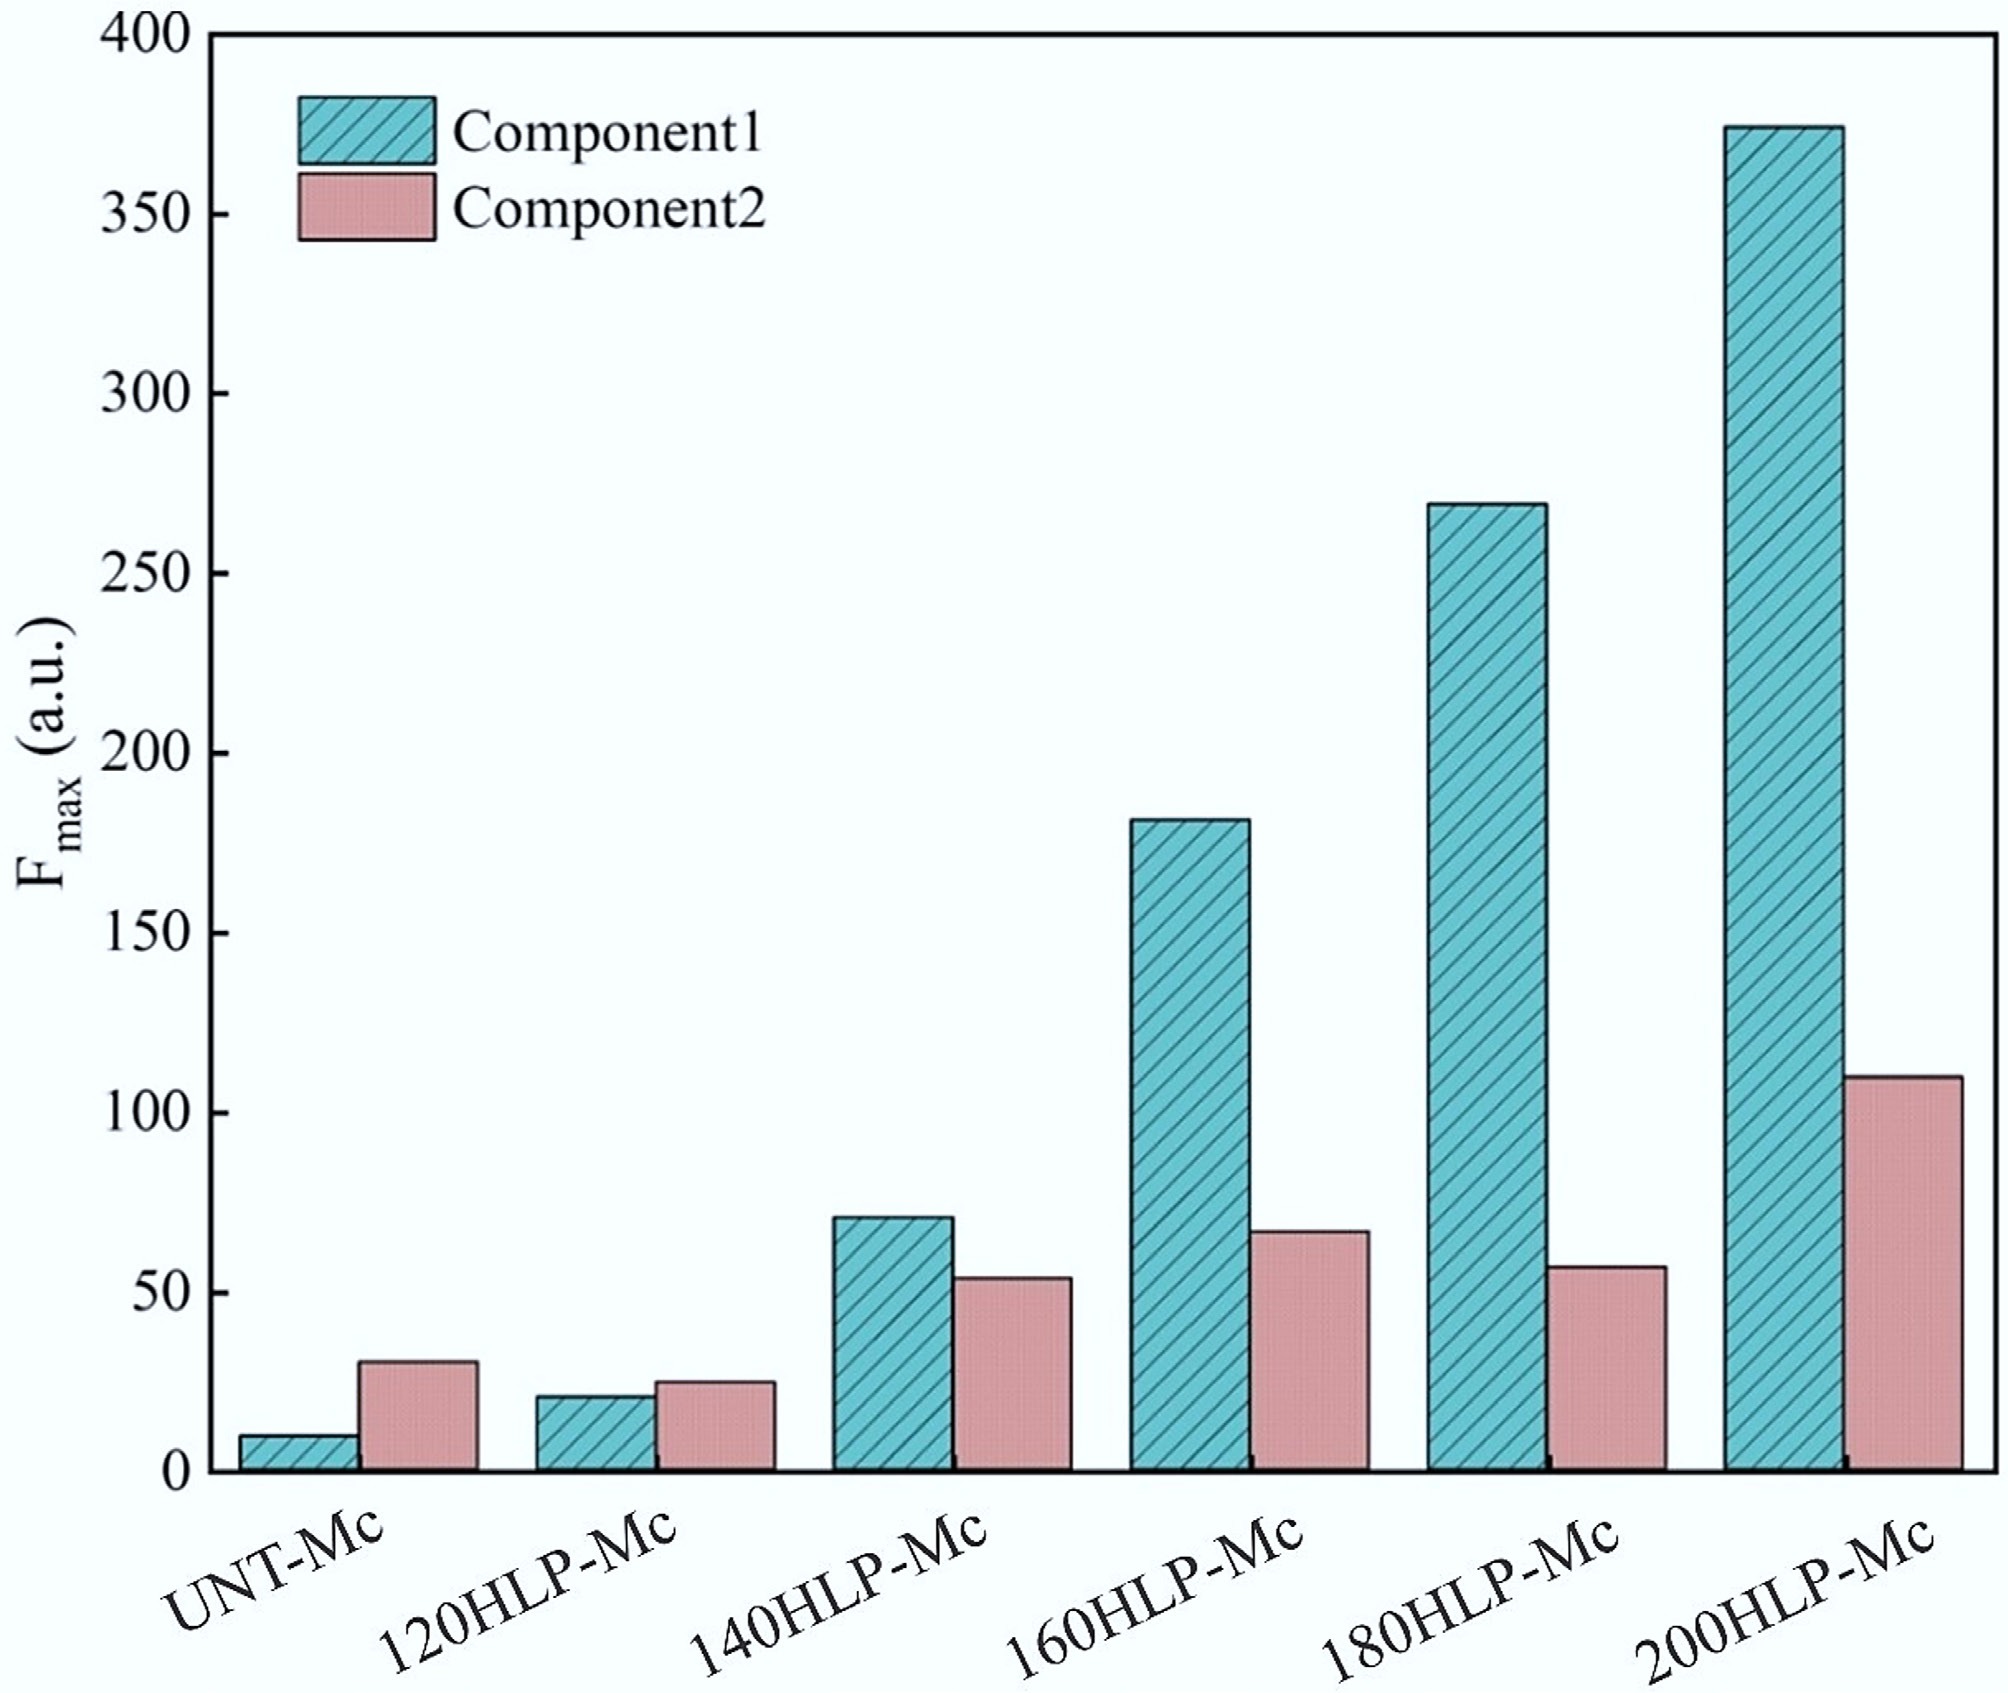
Figure 4.
The maximum fluorescence intensity of each component in the two-component model.
-
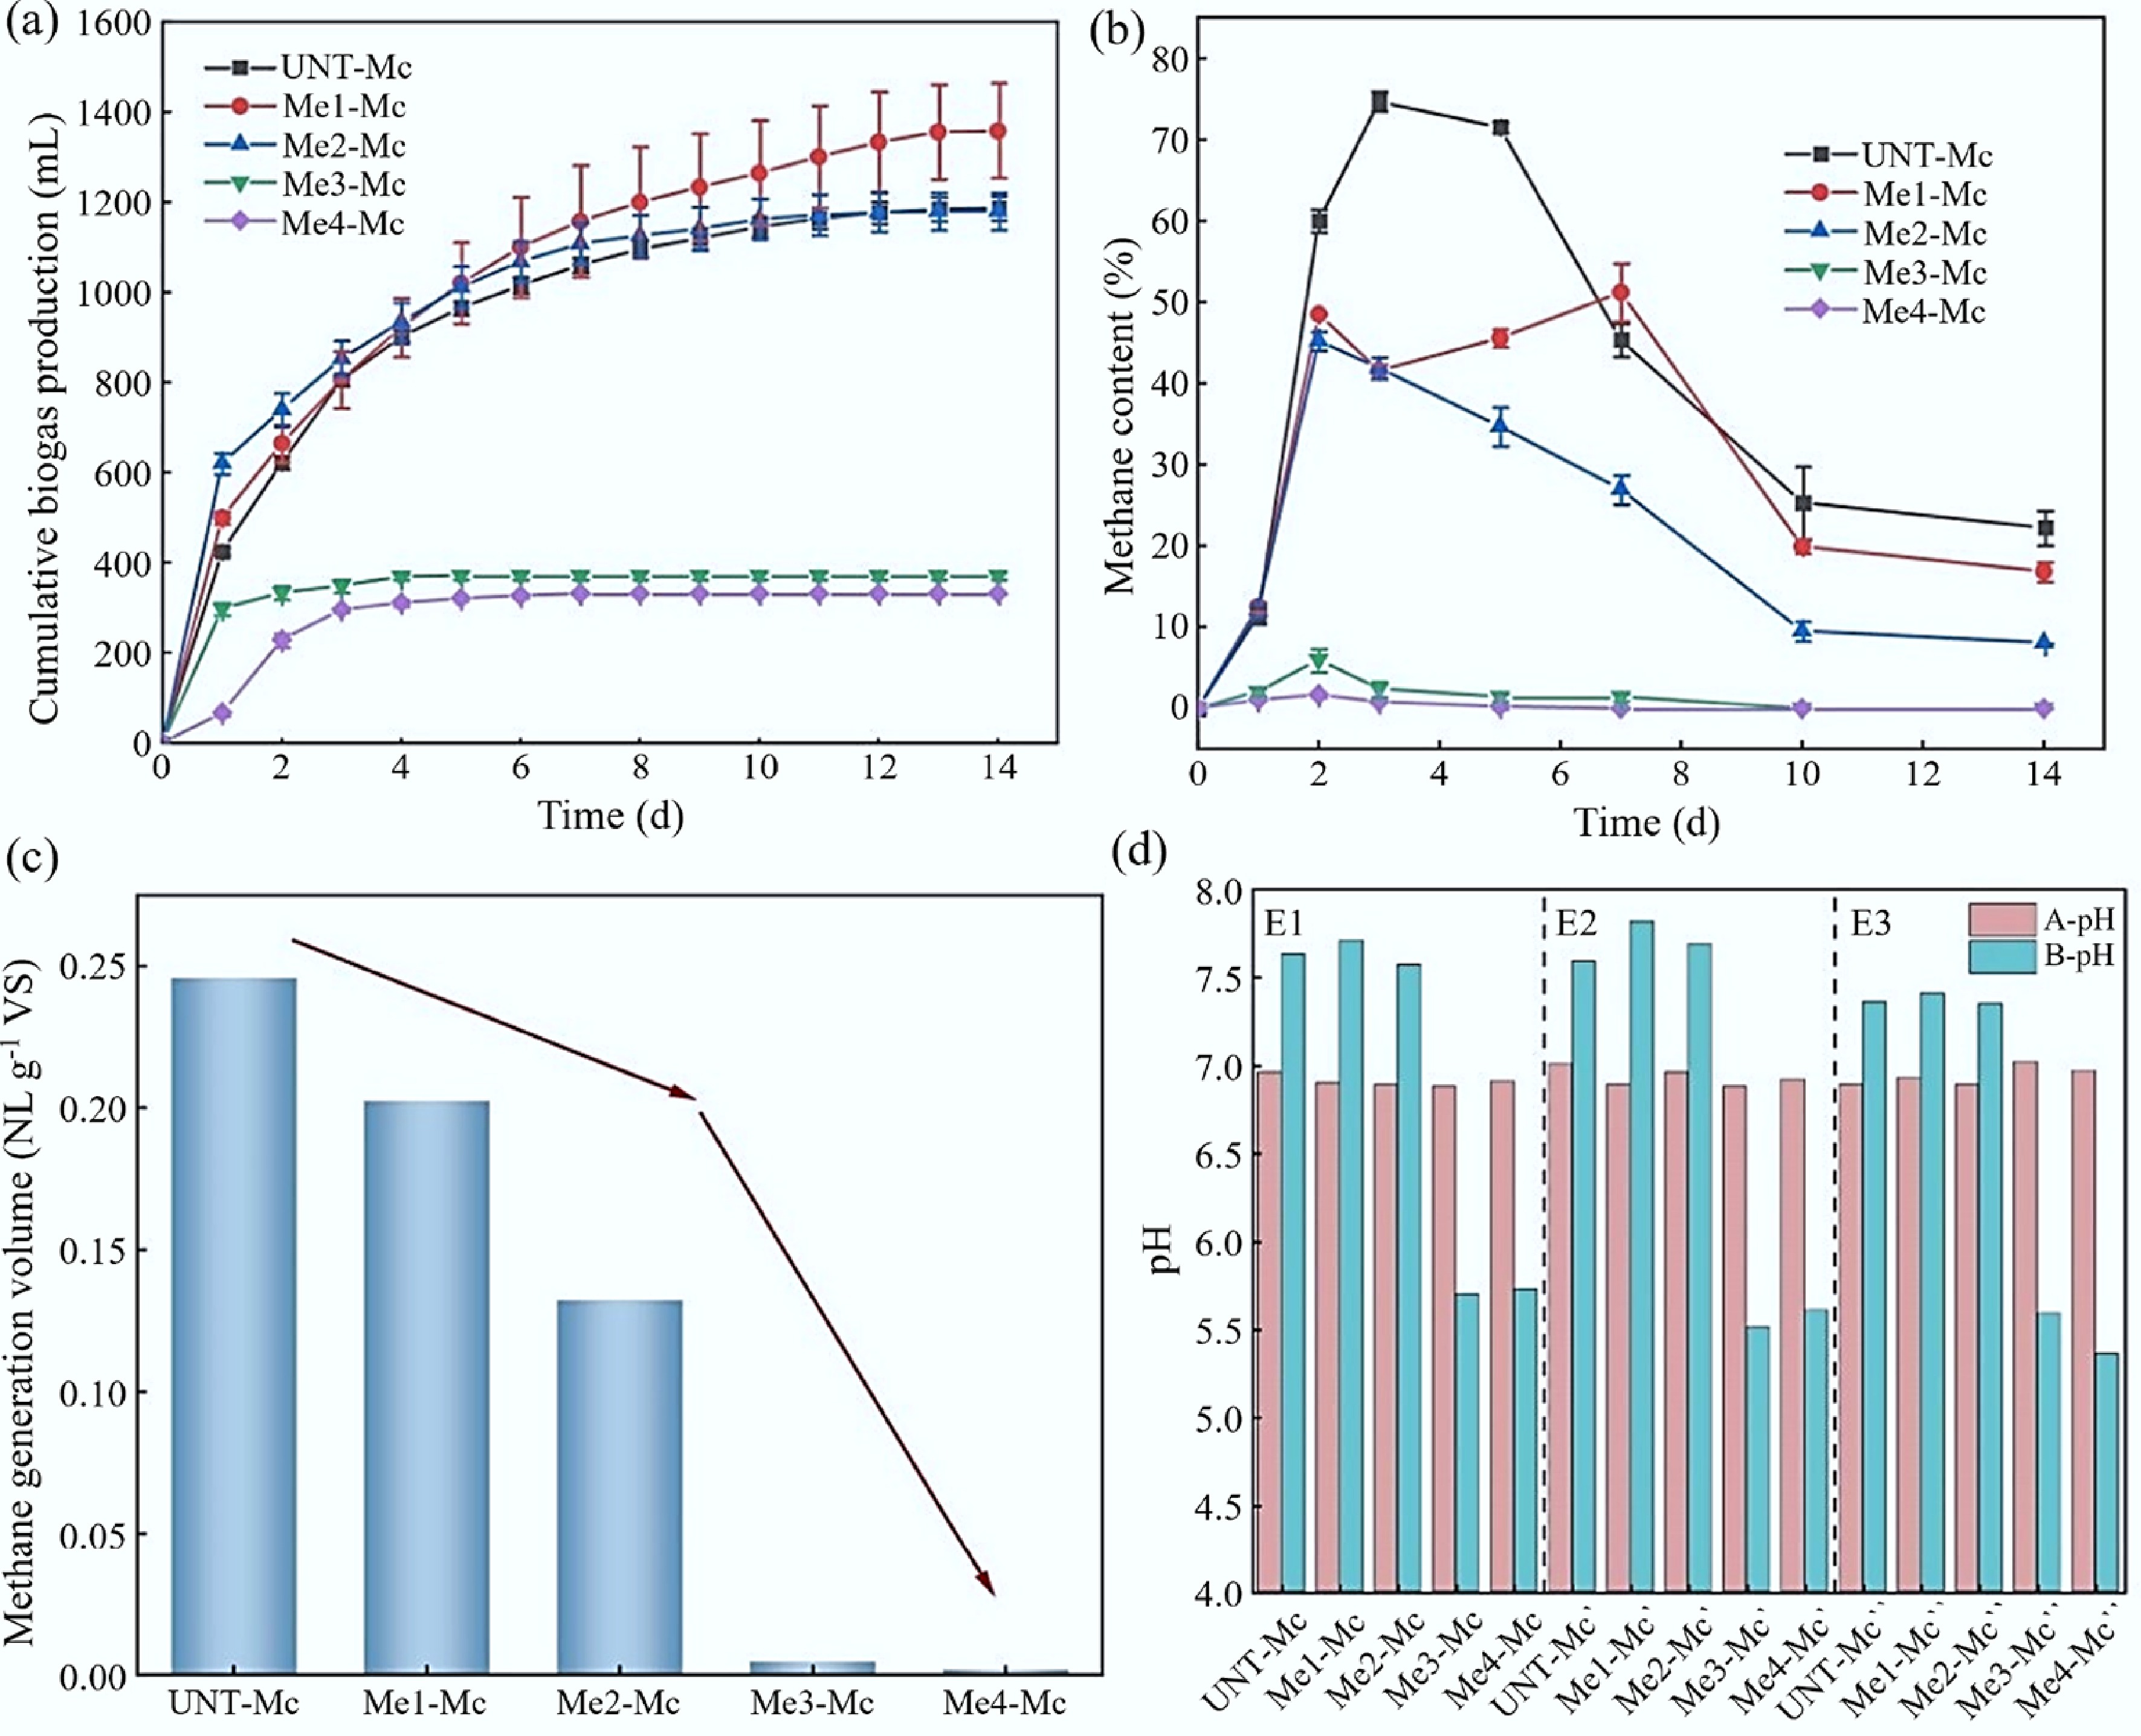
Figure 5.
AD results of FW after the addition of melanoidins. (a) Cumulative biogas production. (b) Methane content. (c) Methane production per unit VS. (d) pH values before and after AD (A: Before start-up; B: After start-up).
-
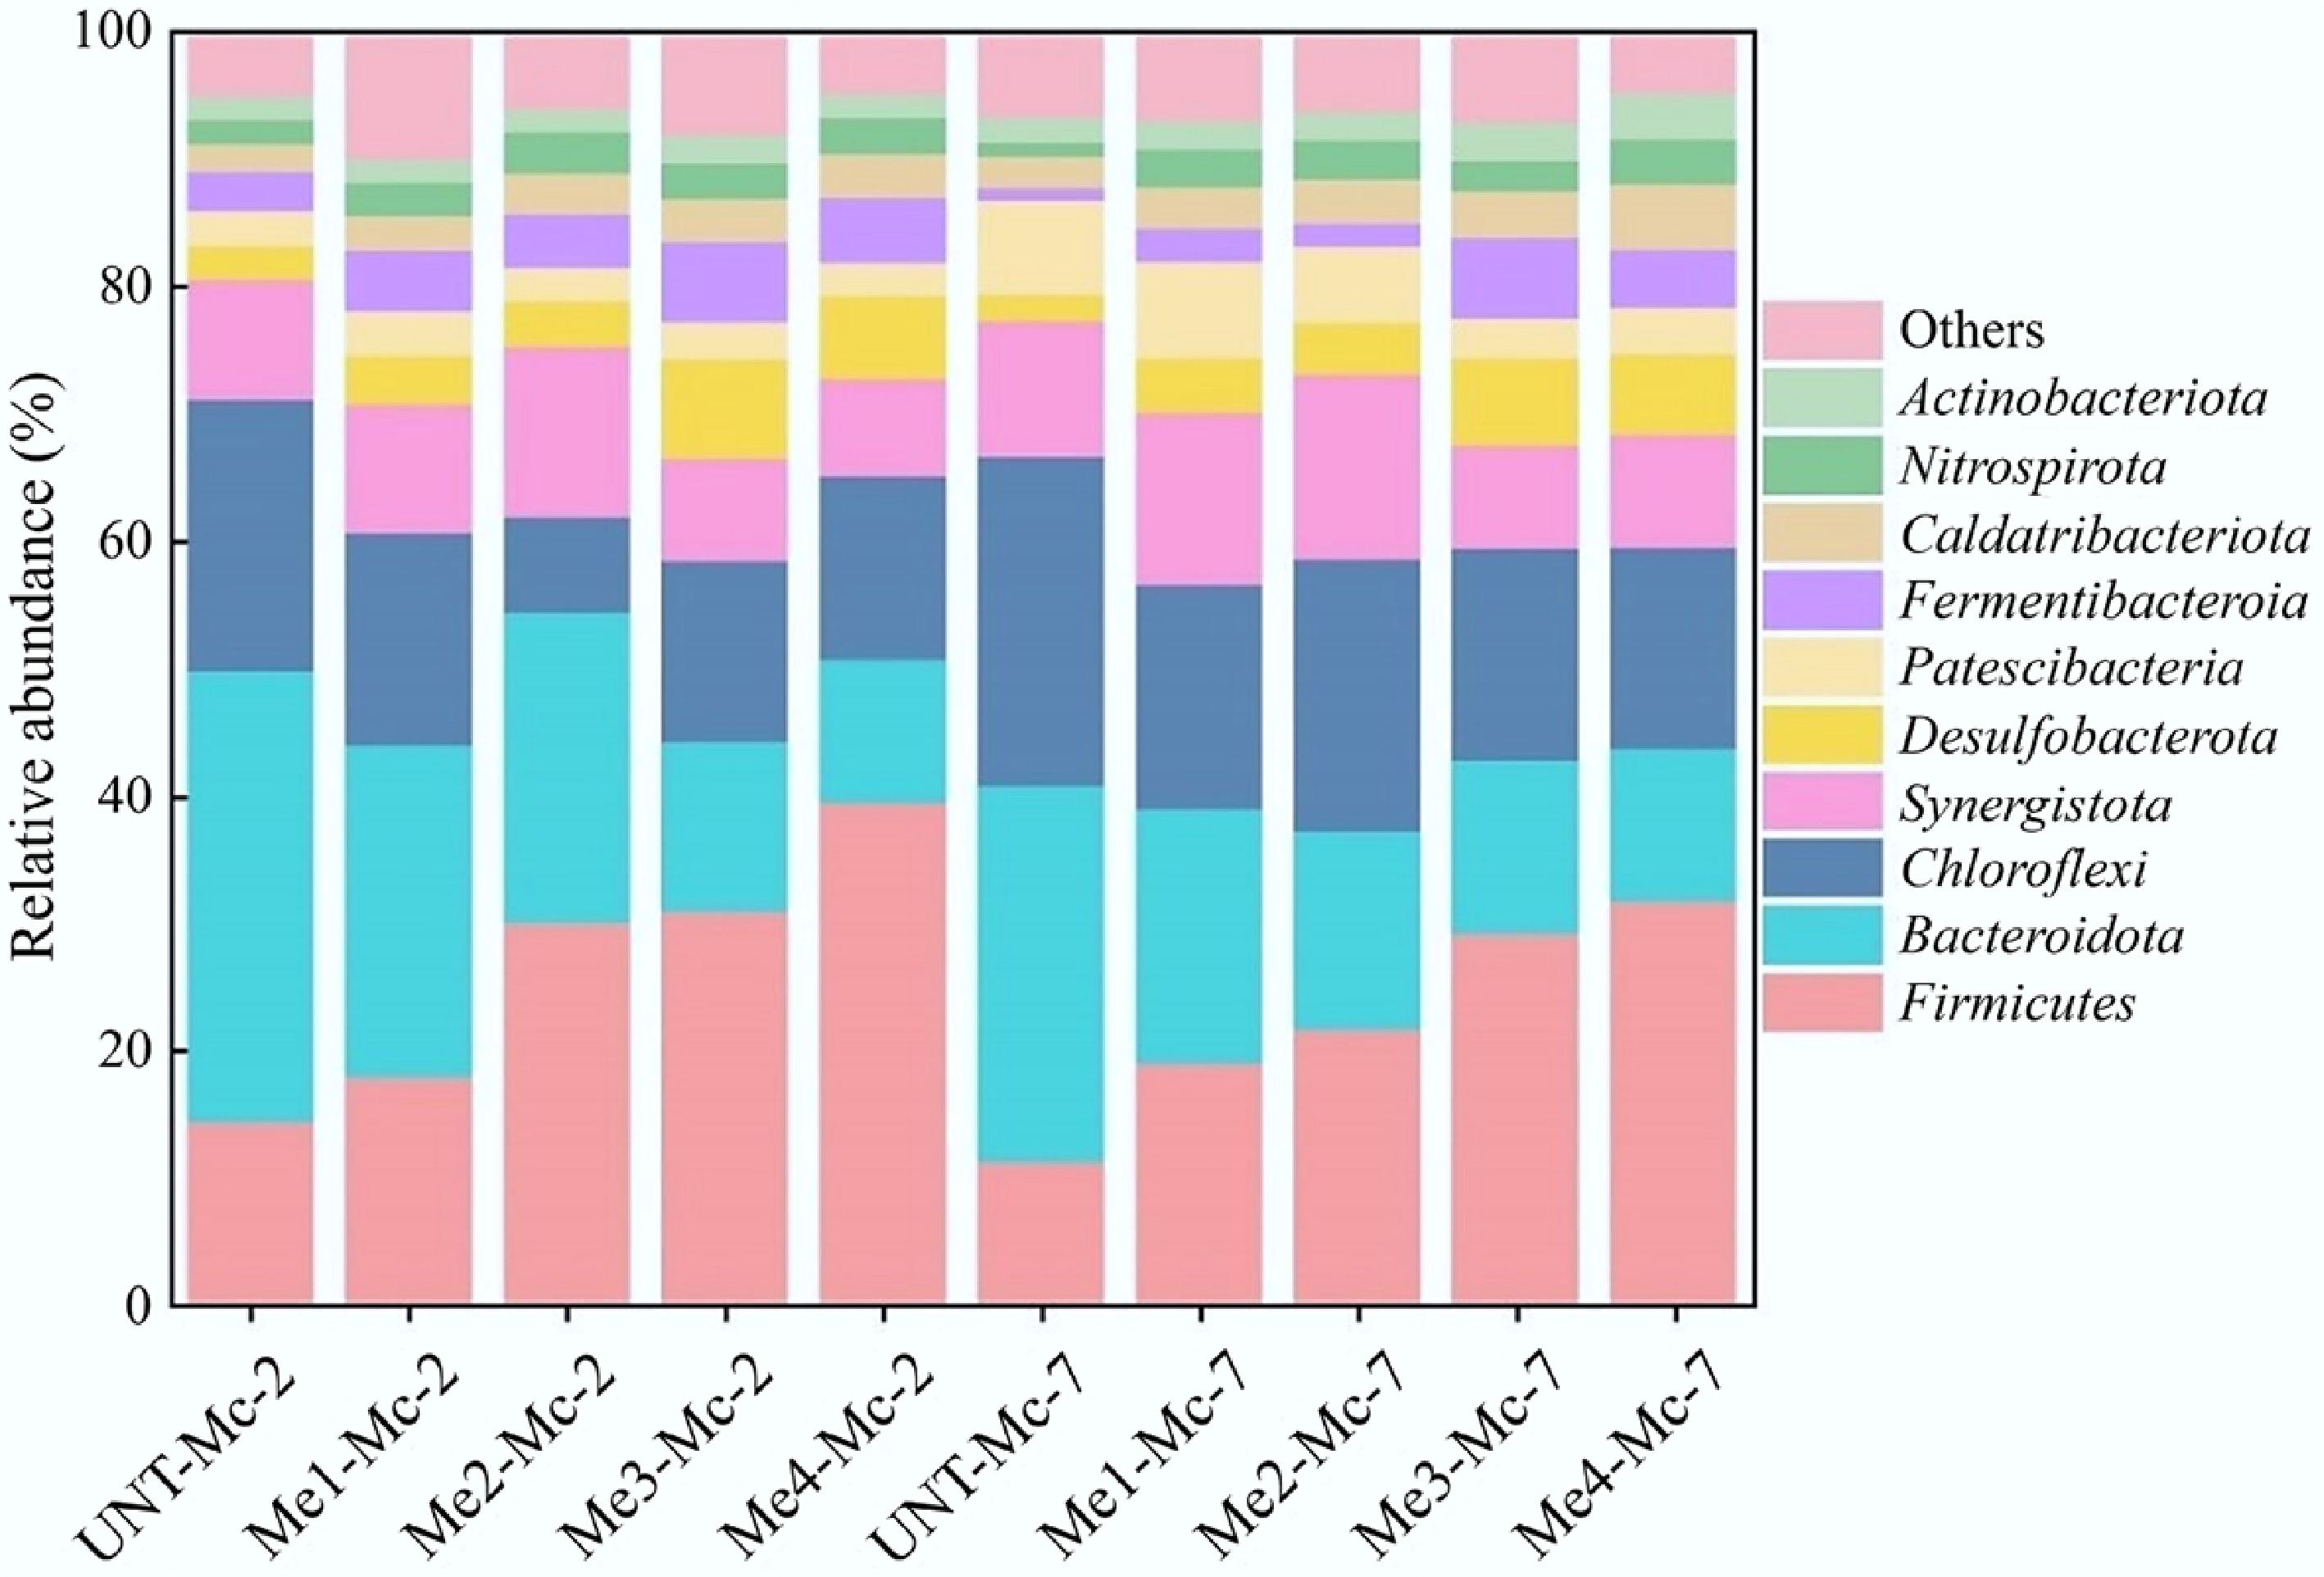
Figure 6.
Relative abundance of bacterial communities at the phylum level across different doses of melanoidins.
-
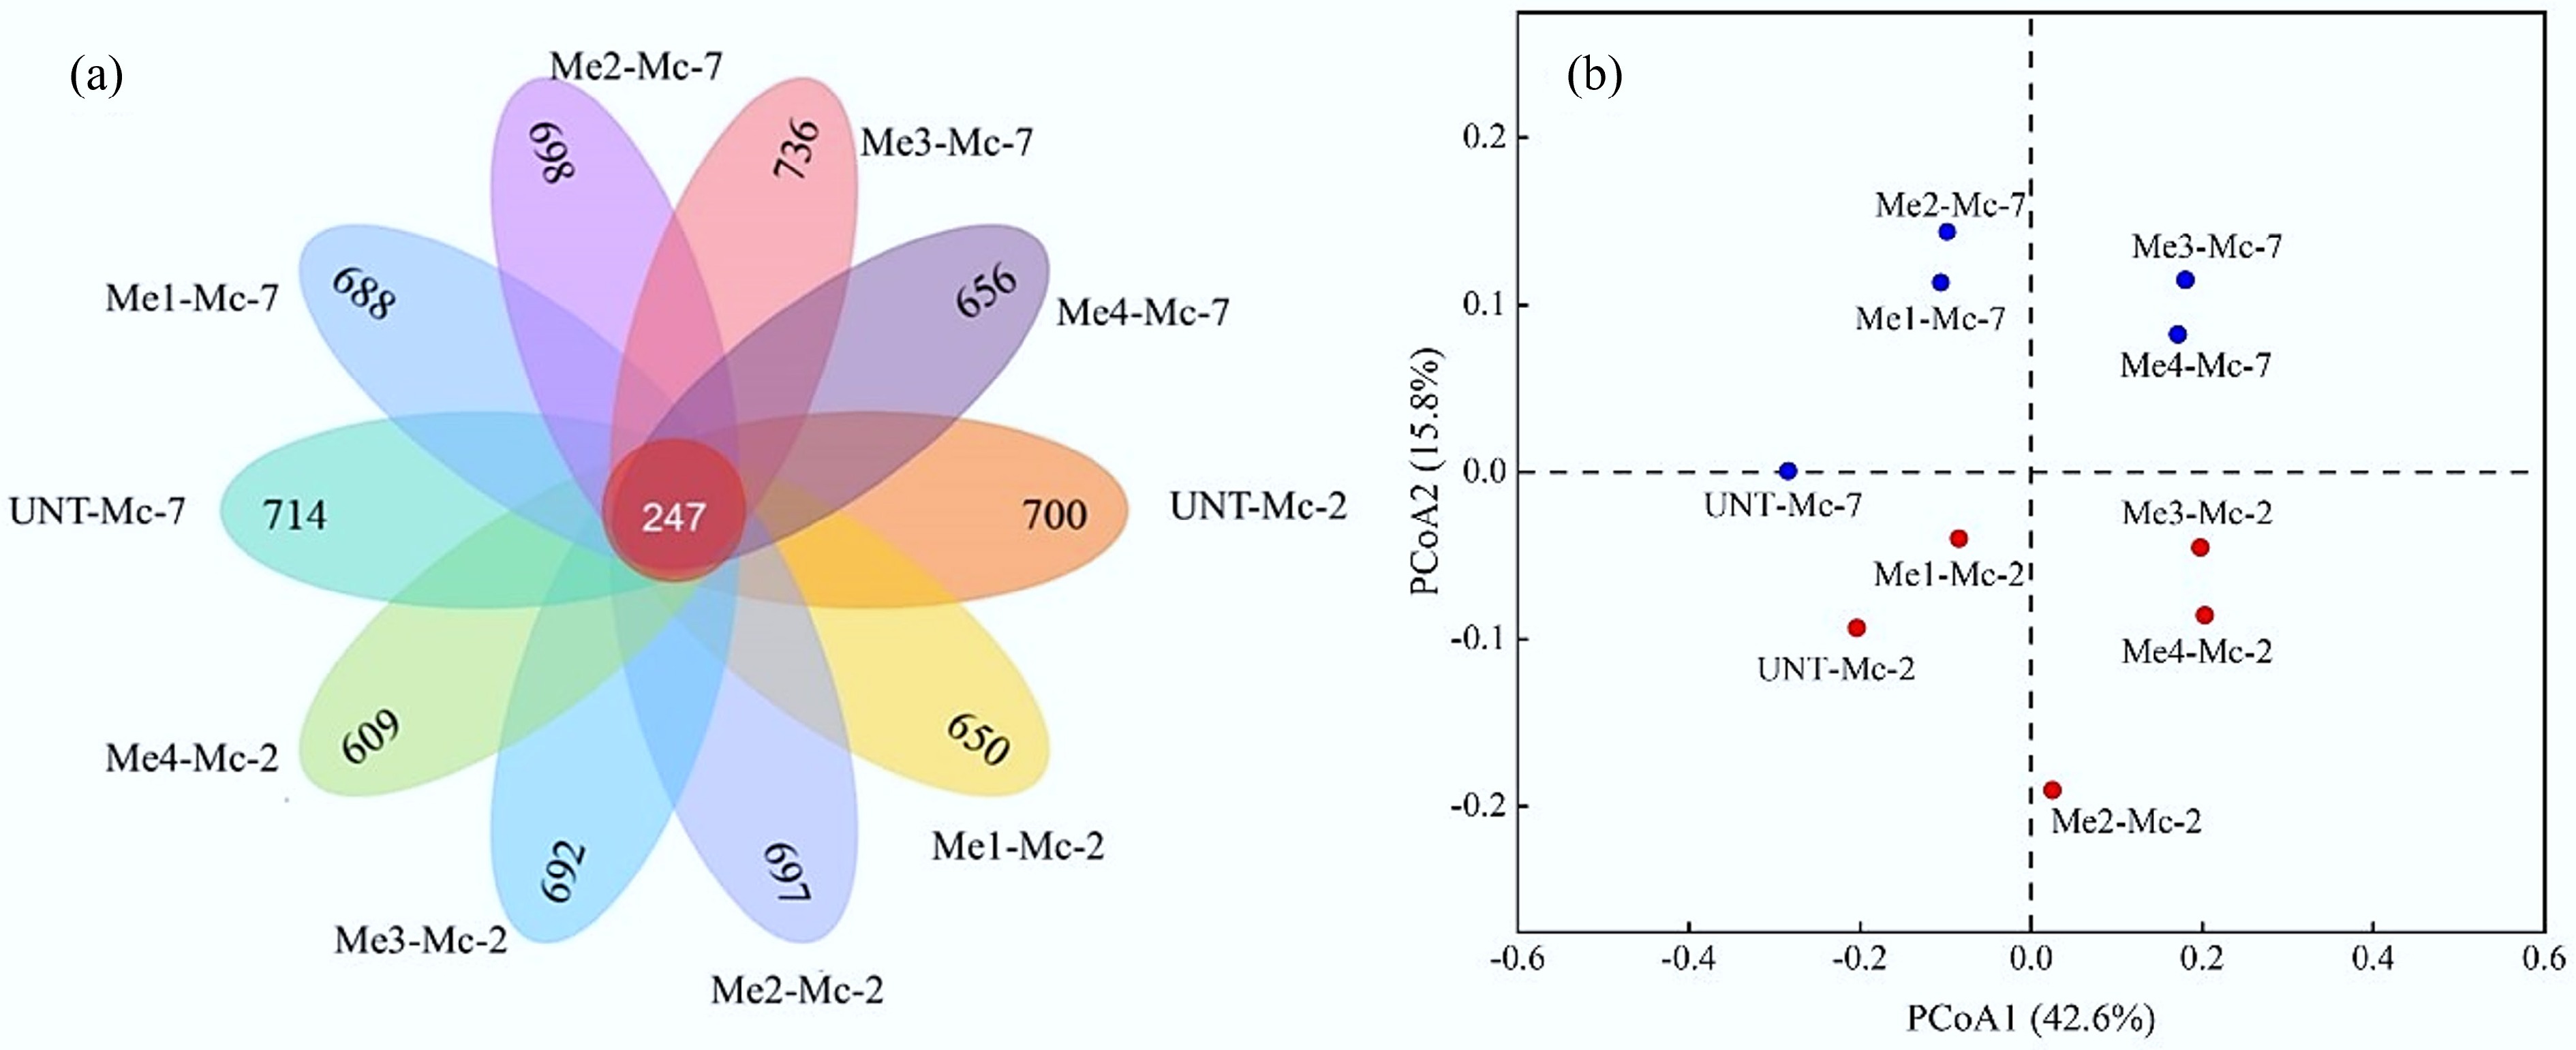
Figure 7.
Beta diversity analysis of bacterial communities. (a) Venn diagram of bacterial distribution based on ASV profiles. (b) PCoA analysis of bacterial communities under different melanoidins dosages.
-
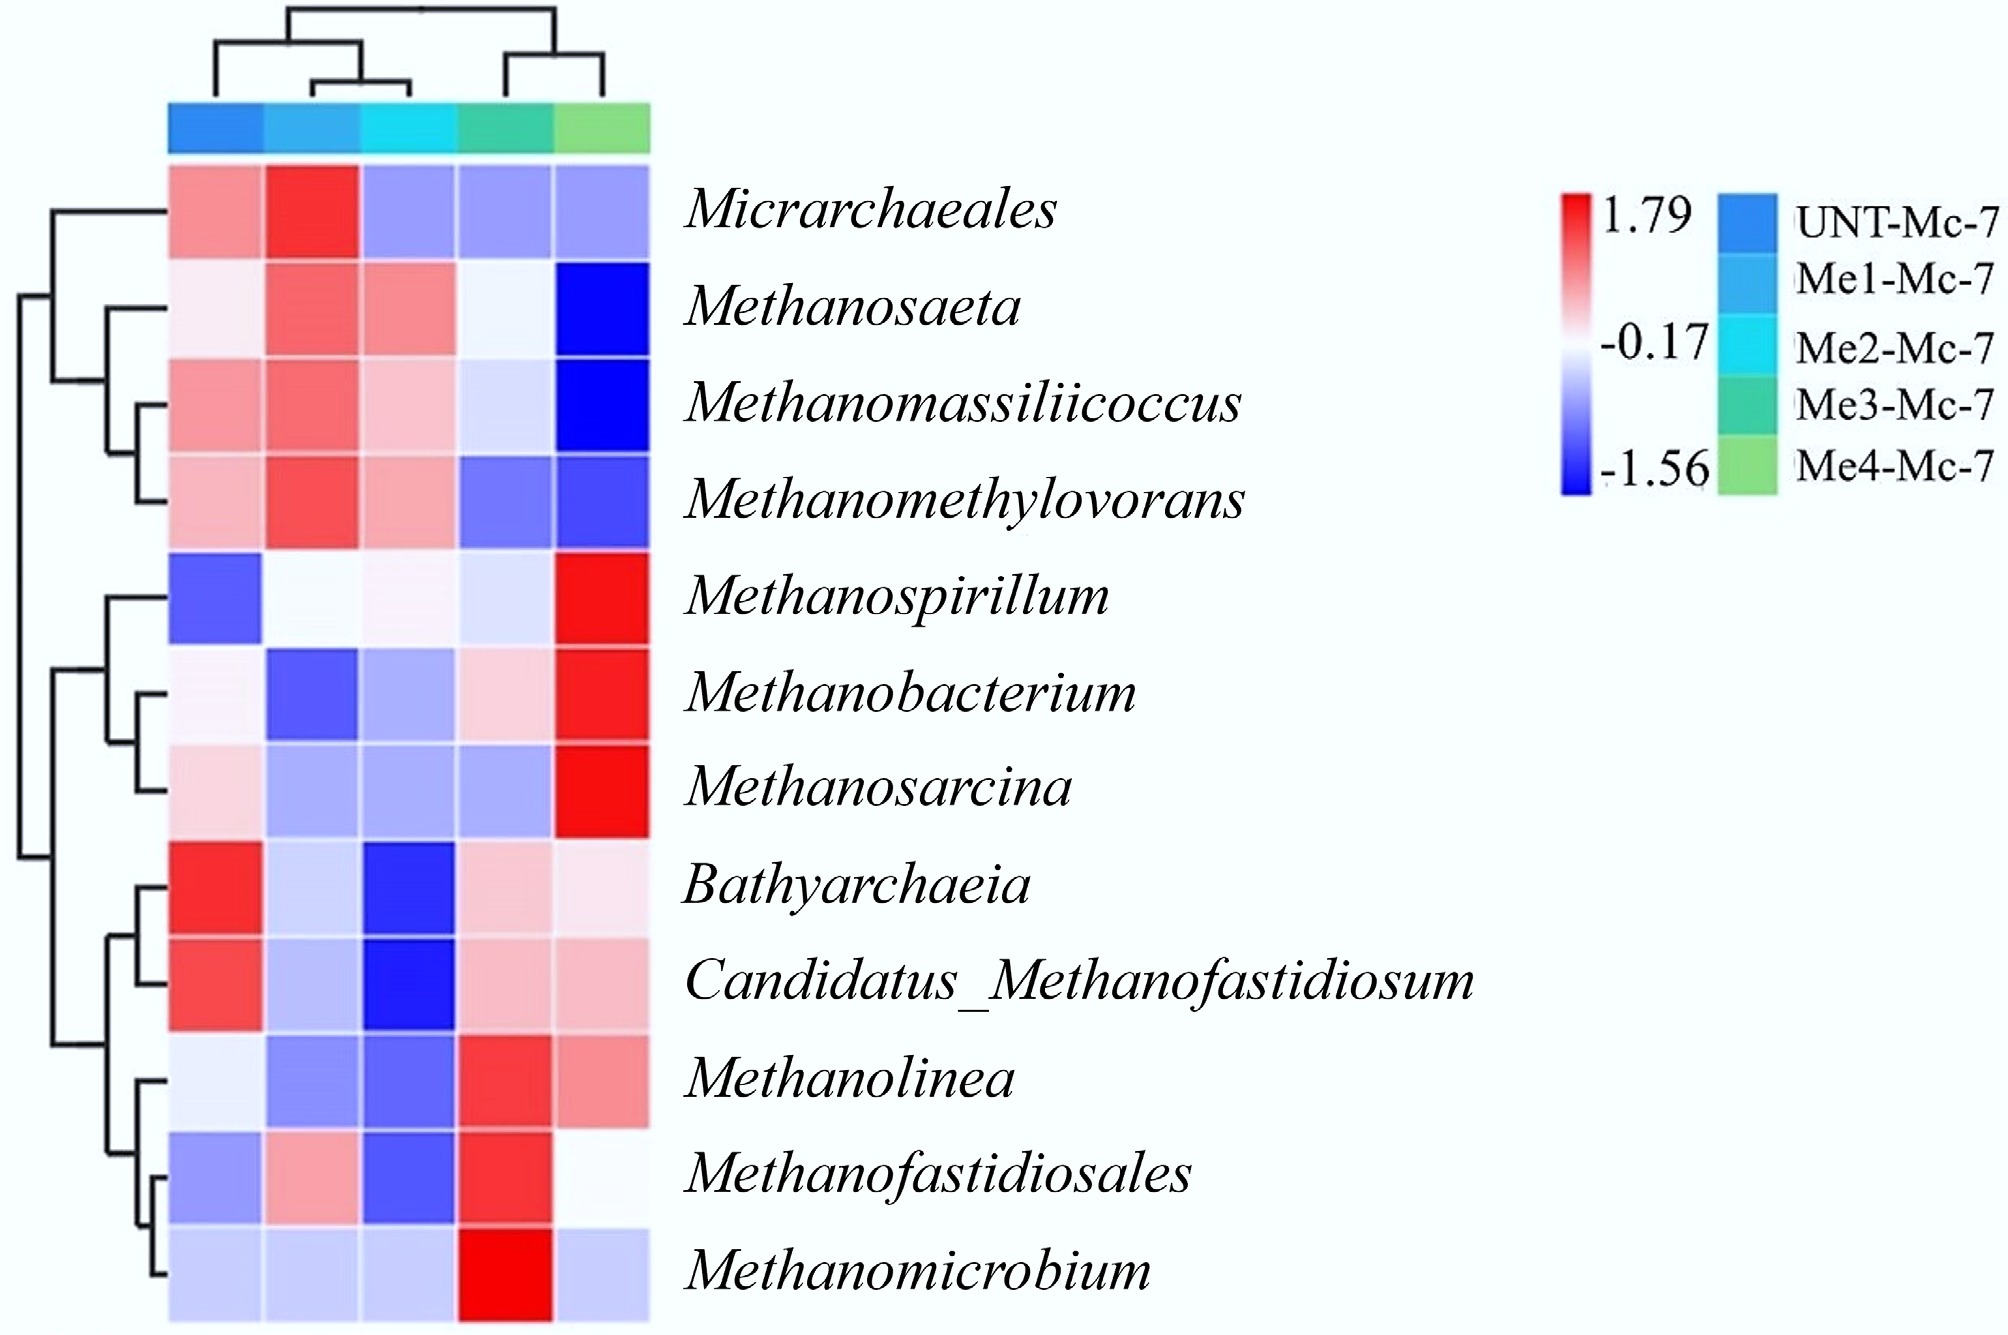
Figure 8.
Effect of melanoidins on the relative abundance of the archaeal communities at the genus level.
-
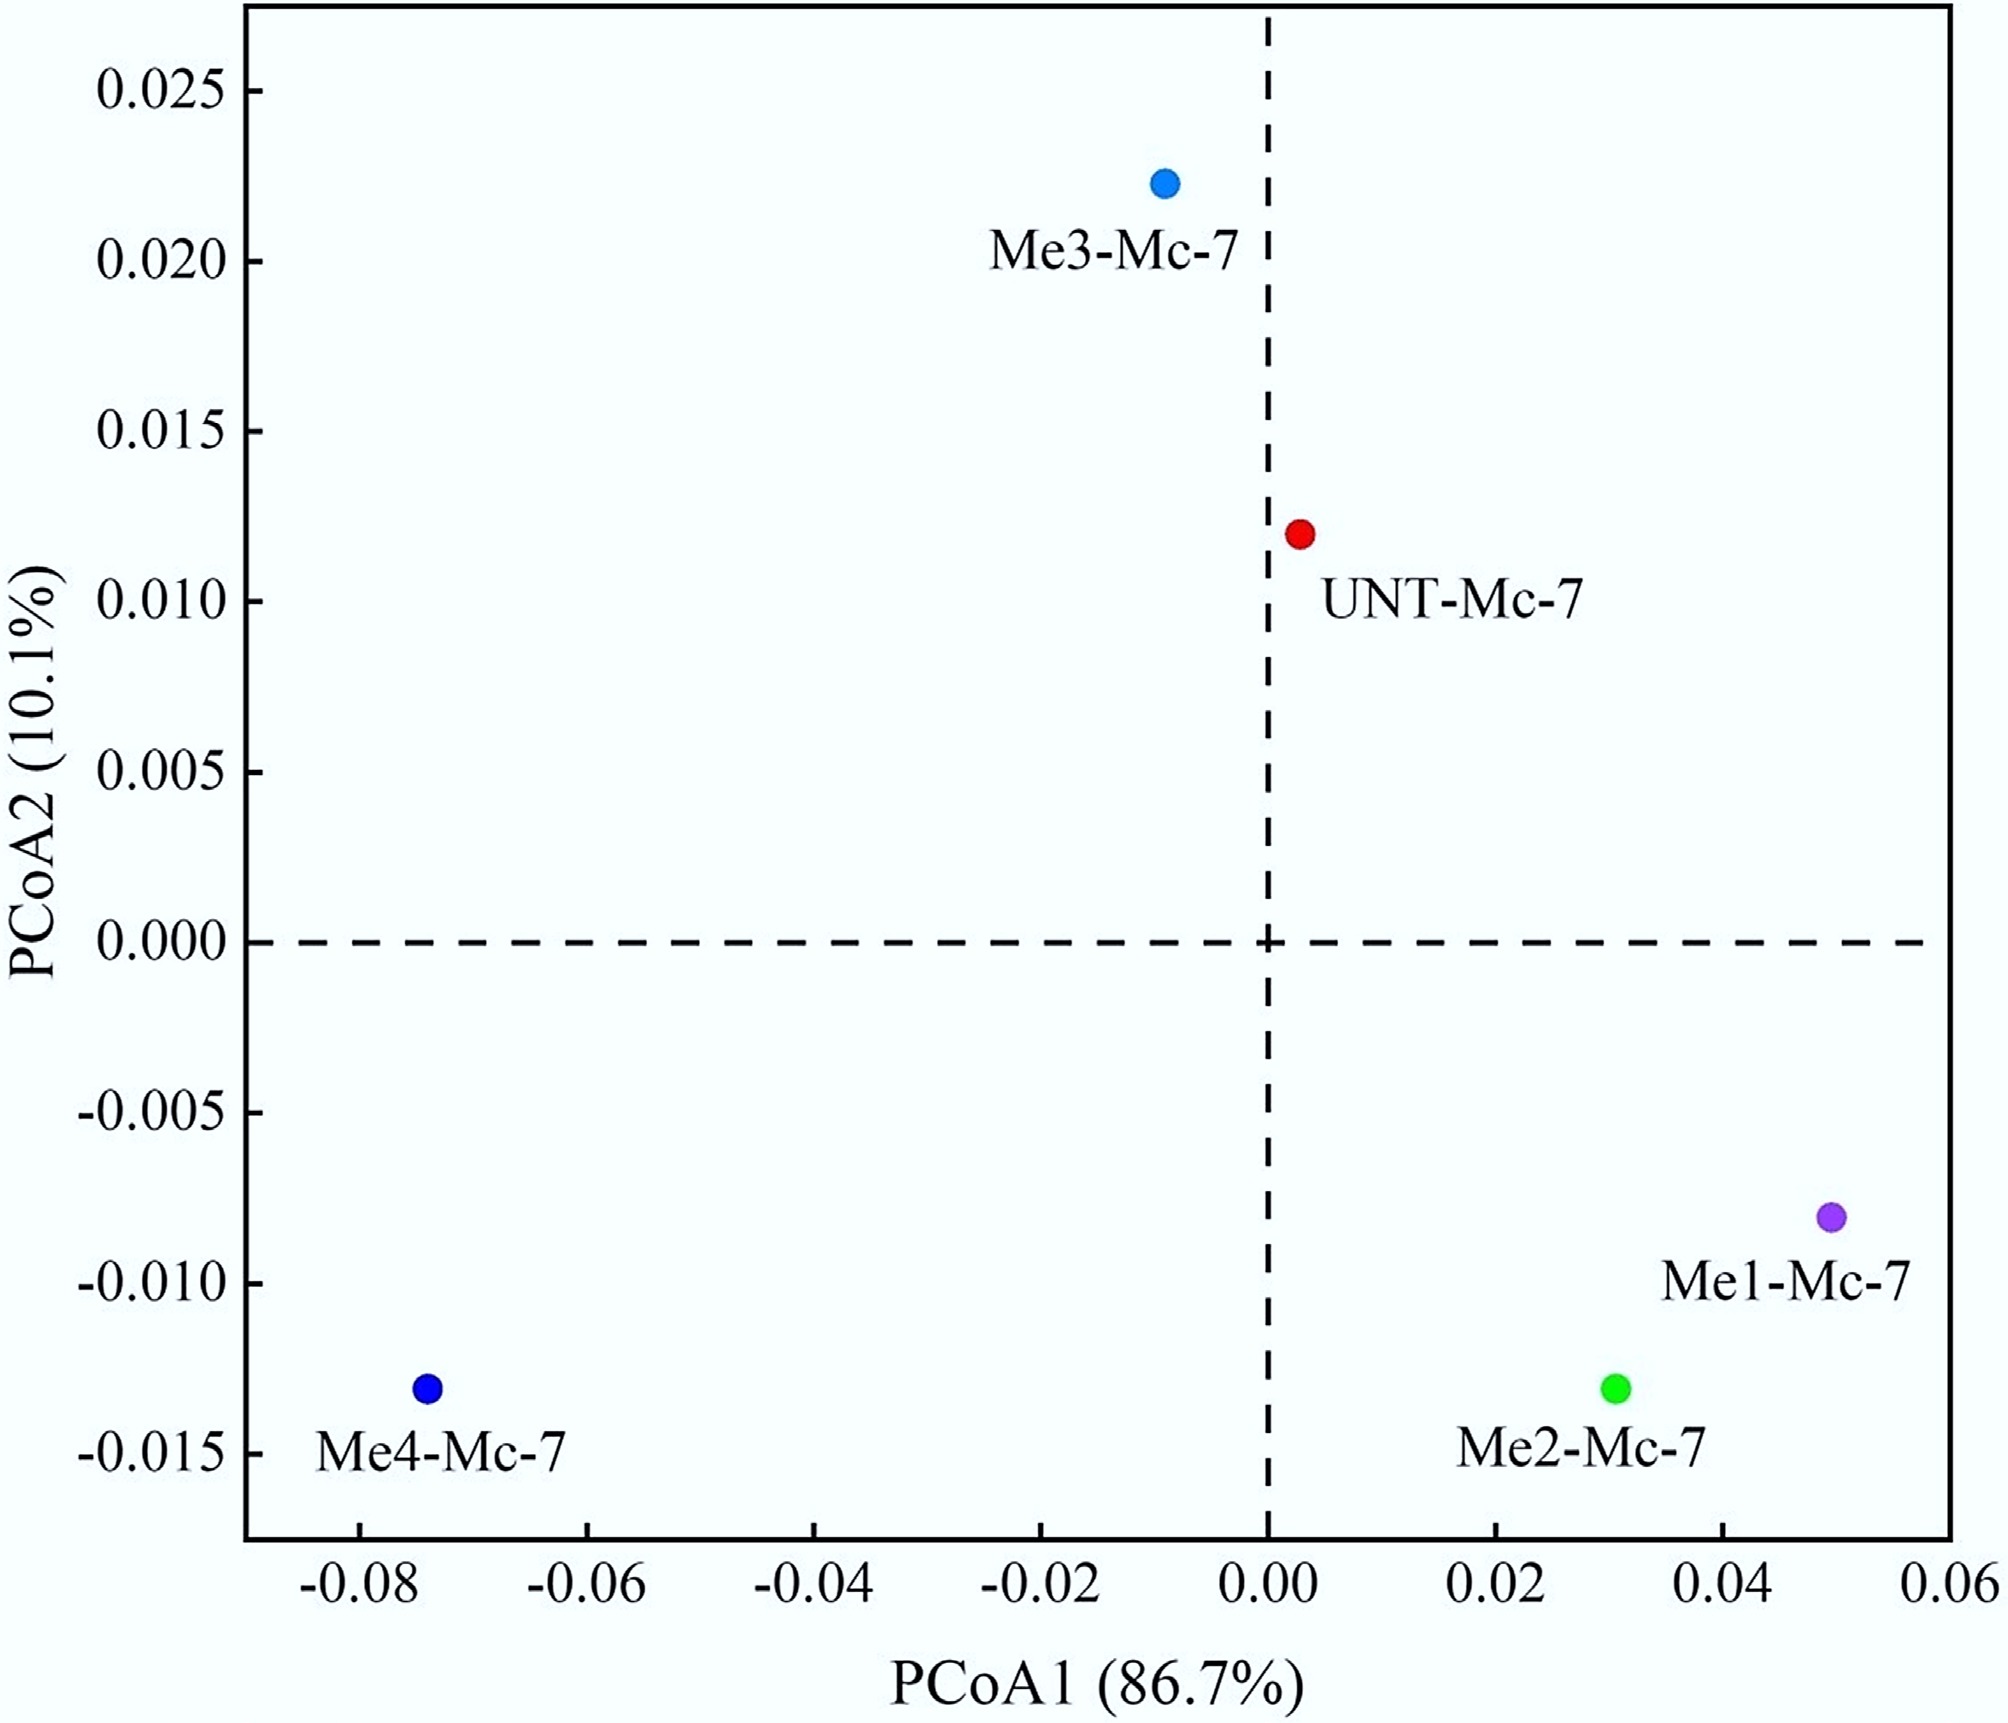
Figure 9.
PCoA analysis of archaea under different doses of melanoidins.
-
Category Indicator Data Total Starchy substances Cereals 120.60 134.40
(~35%)Tubers 2.80 Legumes 10.90 Protein substances Meat 39.80 80.40
(~20%)Poultry 12.40 Eggs 15.00 Dairy products 13.20 Cellulosic substances Vegetables and edible fungi 113.60 174.40
(~45%)Fruits 60.80 Table 1.
Nationwide per capita consumption of major foods (kg)
-
Sample Observed_species Chao1 Shannon UNT-Mc-2 1,357 1,369.44 7.42 Me1-Mc-2 1,332 1,371.99 7.31 Me2-Mc-2 1,367 1,385.99 7.15 Me3-Mc-2 1,369 1,402.32 7.11 Me4-Mc-2 1,227 1,242.25 7.11 UNT-Mc-7 1,402 1,448.60 7.23 Me1-Mc-7 1,435 1,475.43 7.54 Me2-Mc-7 1,389 1,407.86 7.53 Me3-Mc-7 1,392 1,414.44 7.45 Me4-Mc-7 1,280 1,290.23 7.42 Table 2.
Richness index and diversity index of melanoidins samples
-
Sample Observed_species Chao1 Shannon UNT-Mc-7 127 127.35 1.76 Me1-Mc-7 111 111.00 1.74 Me2-Mc-7 89 90.88 1.65 Me3-Mc-7 129 129.00 1.80 Me4-Mc-7 88 89.67 1.62 Table 3.
Richness index and diversity index of archaea in the melanoidins samples
Figures
(9)
Tables
(3)