-
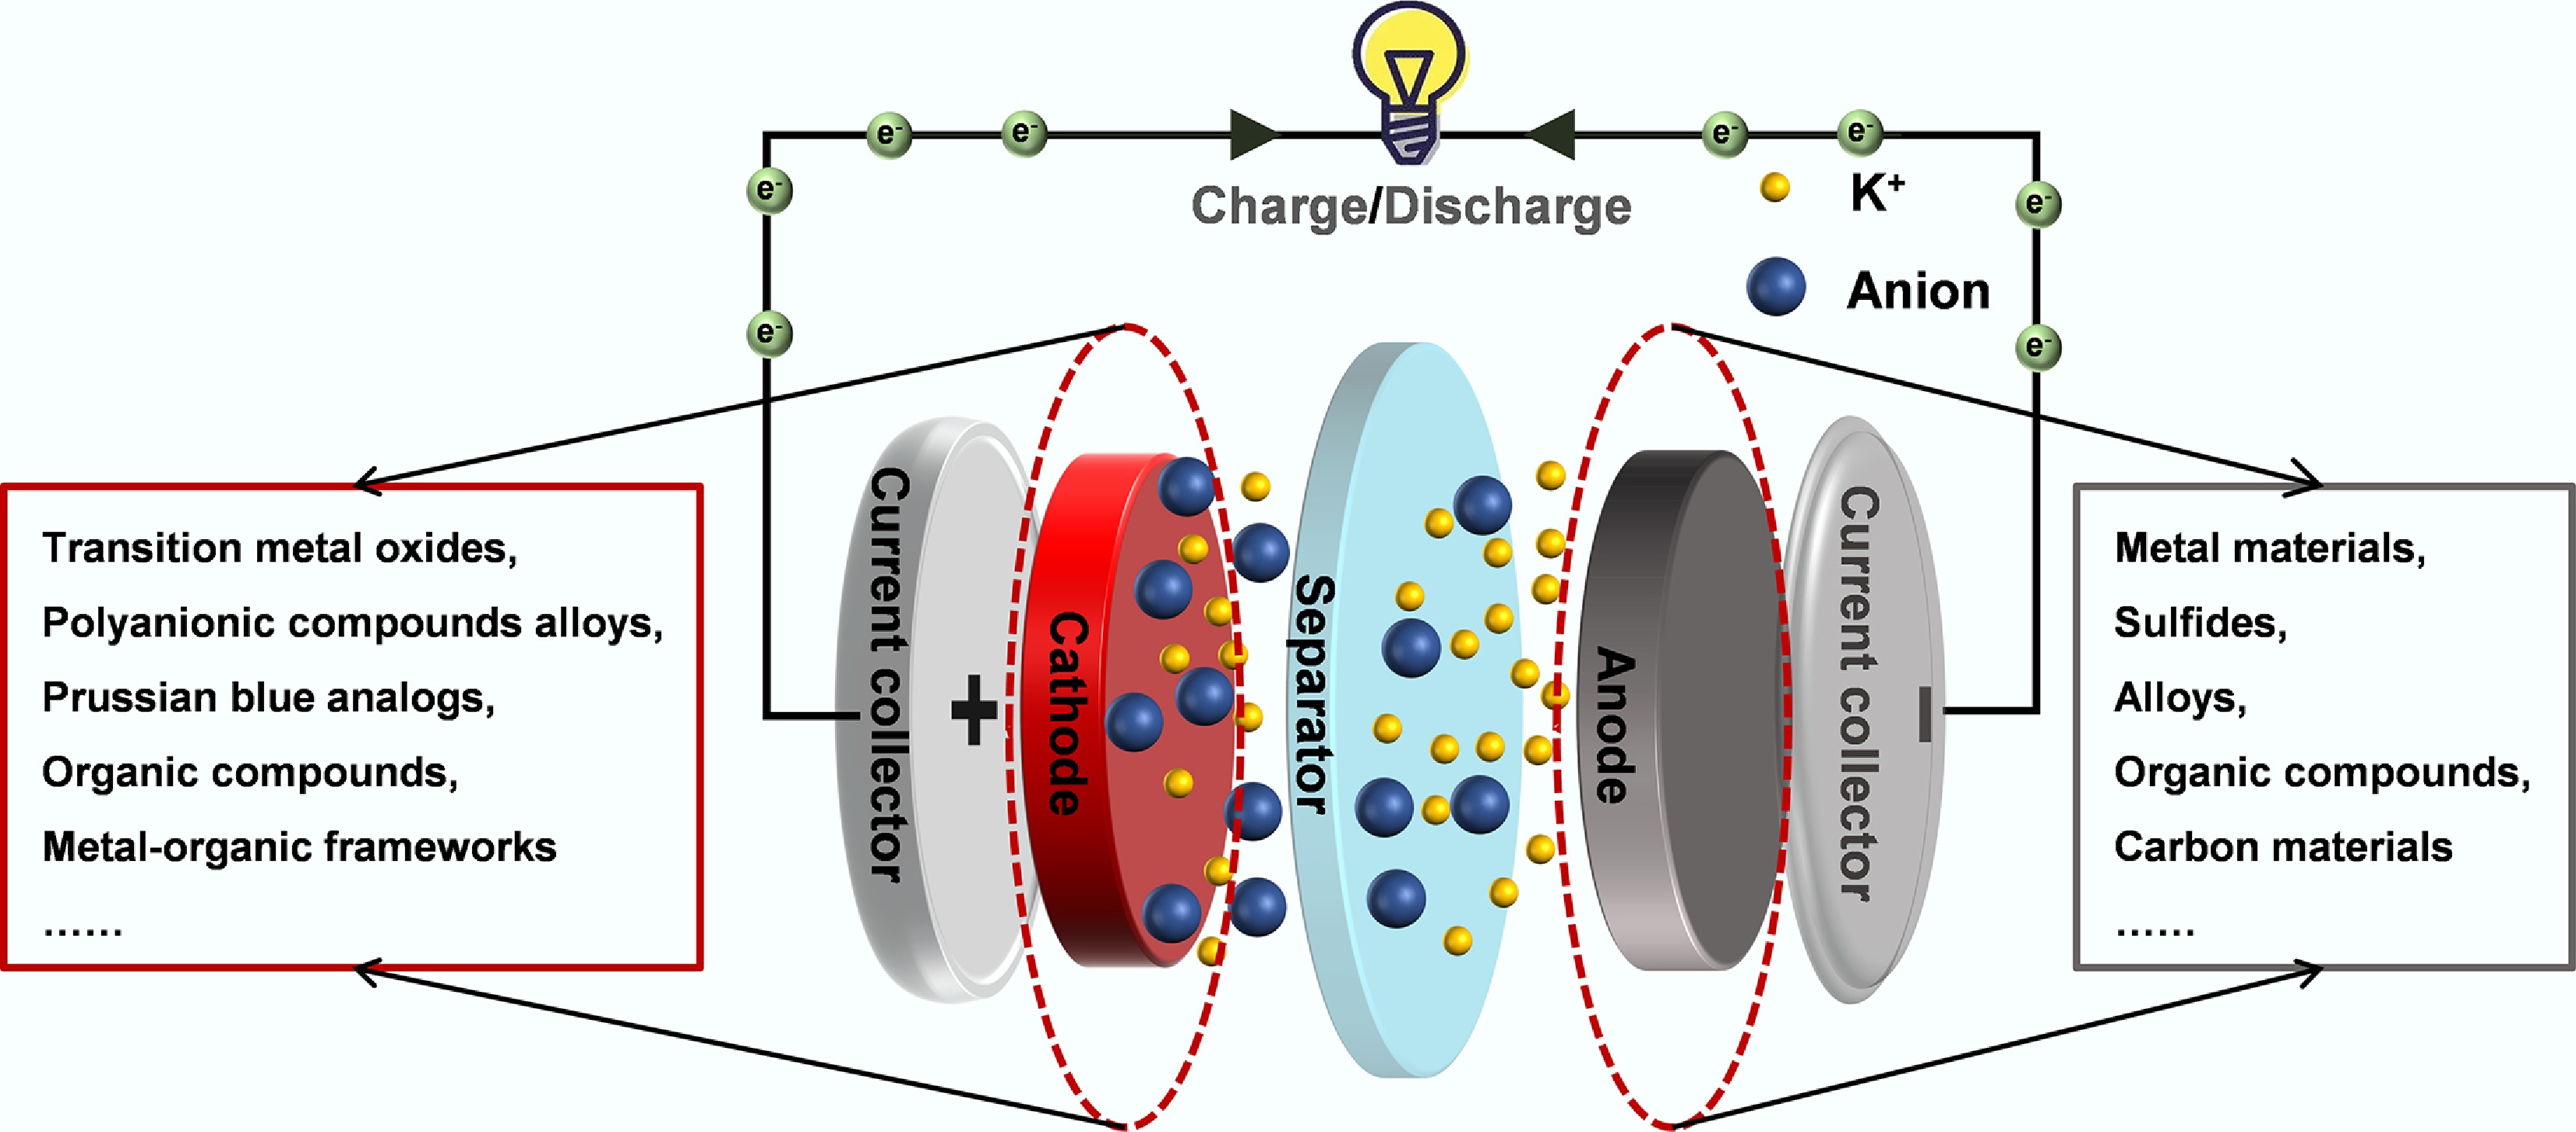
Figure 1.
Schematic illustration of the configuration and operational mechanism of a typical PIB.
-
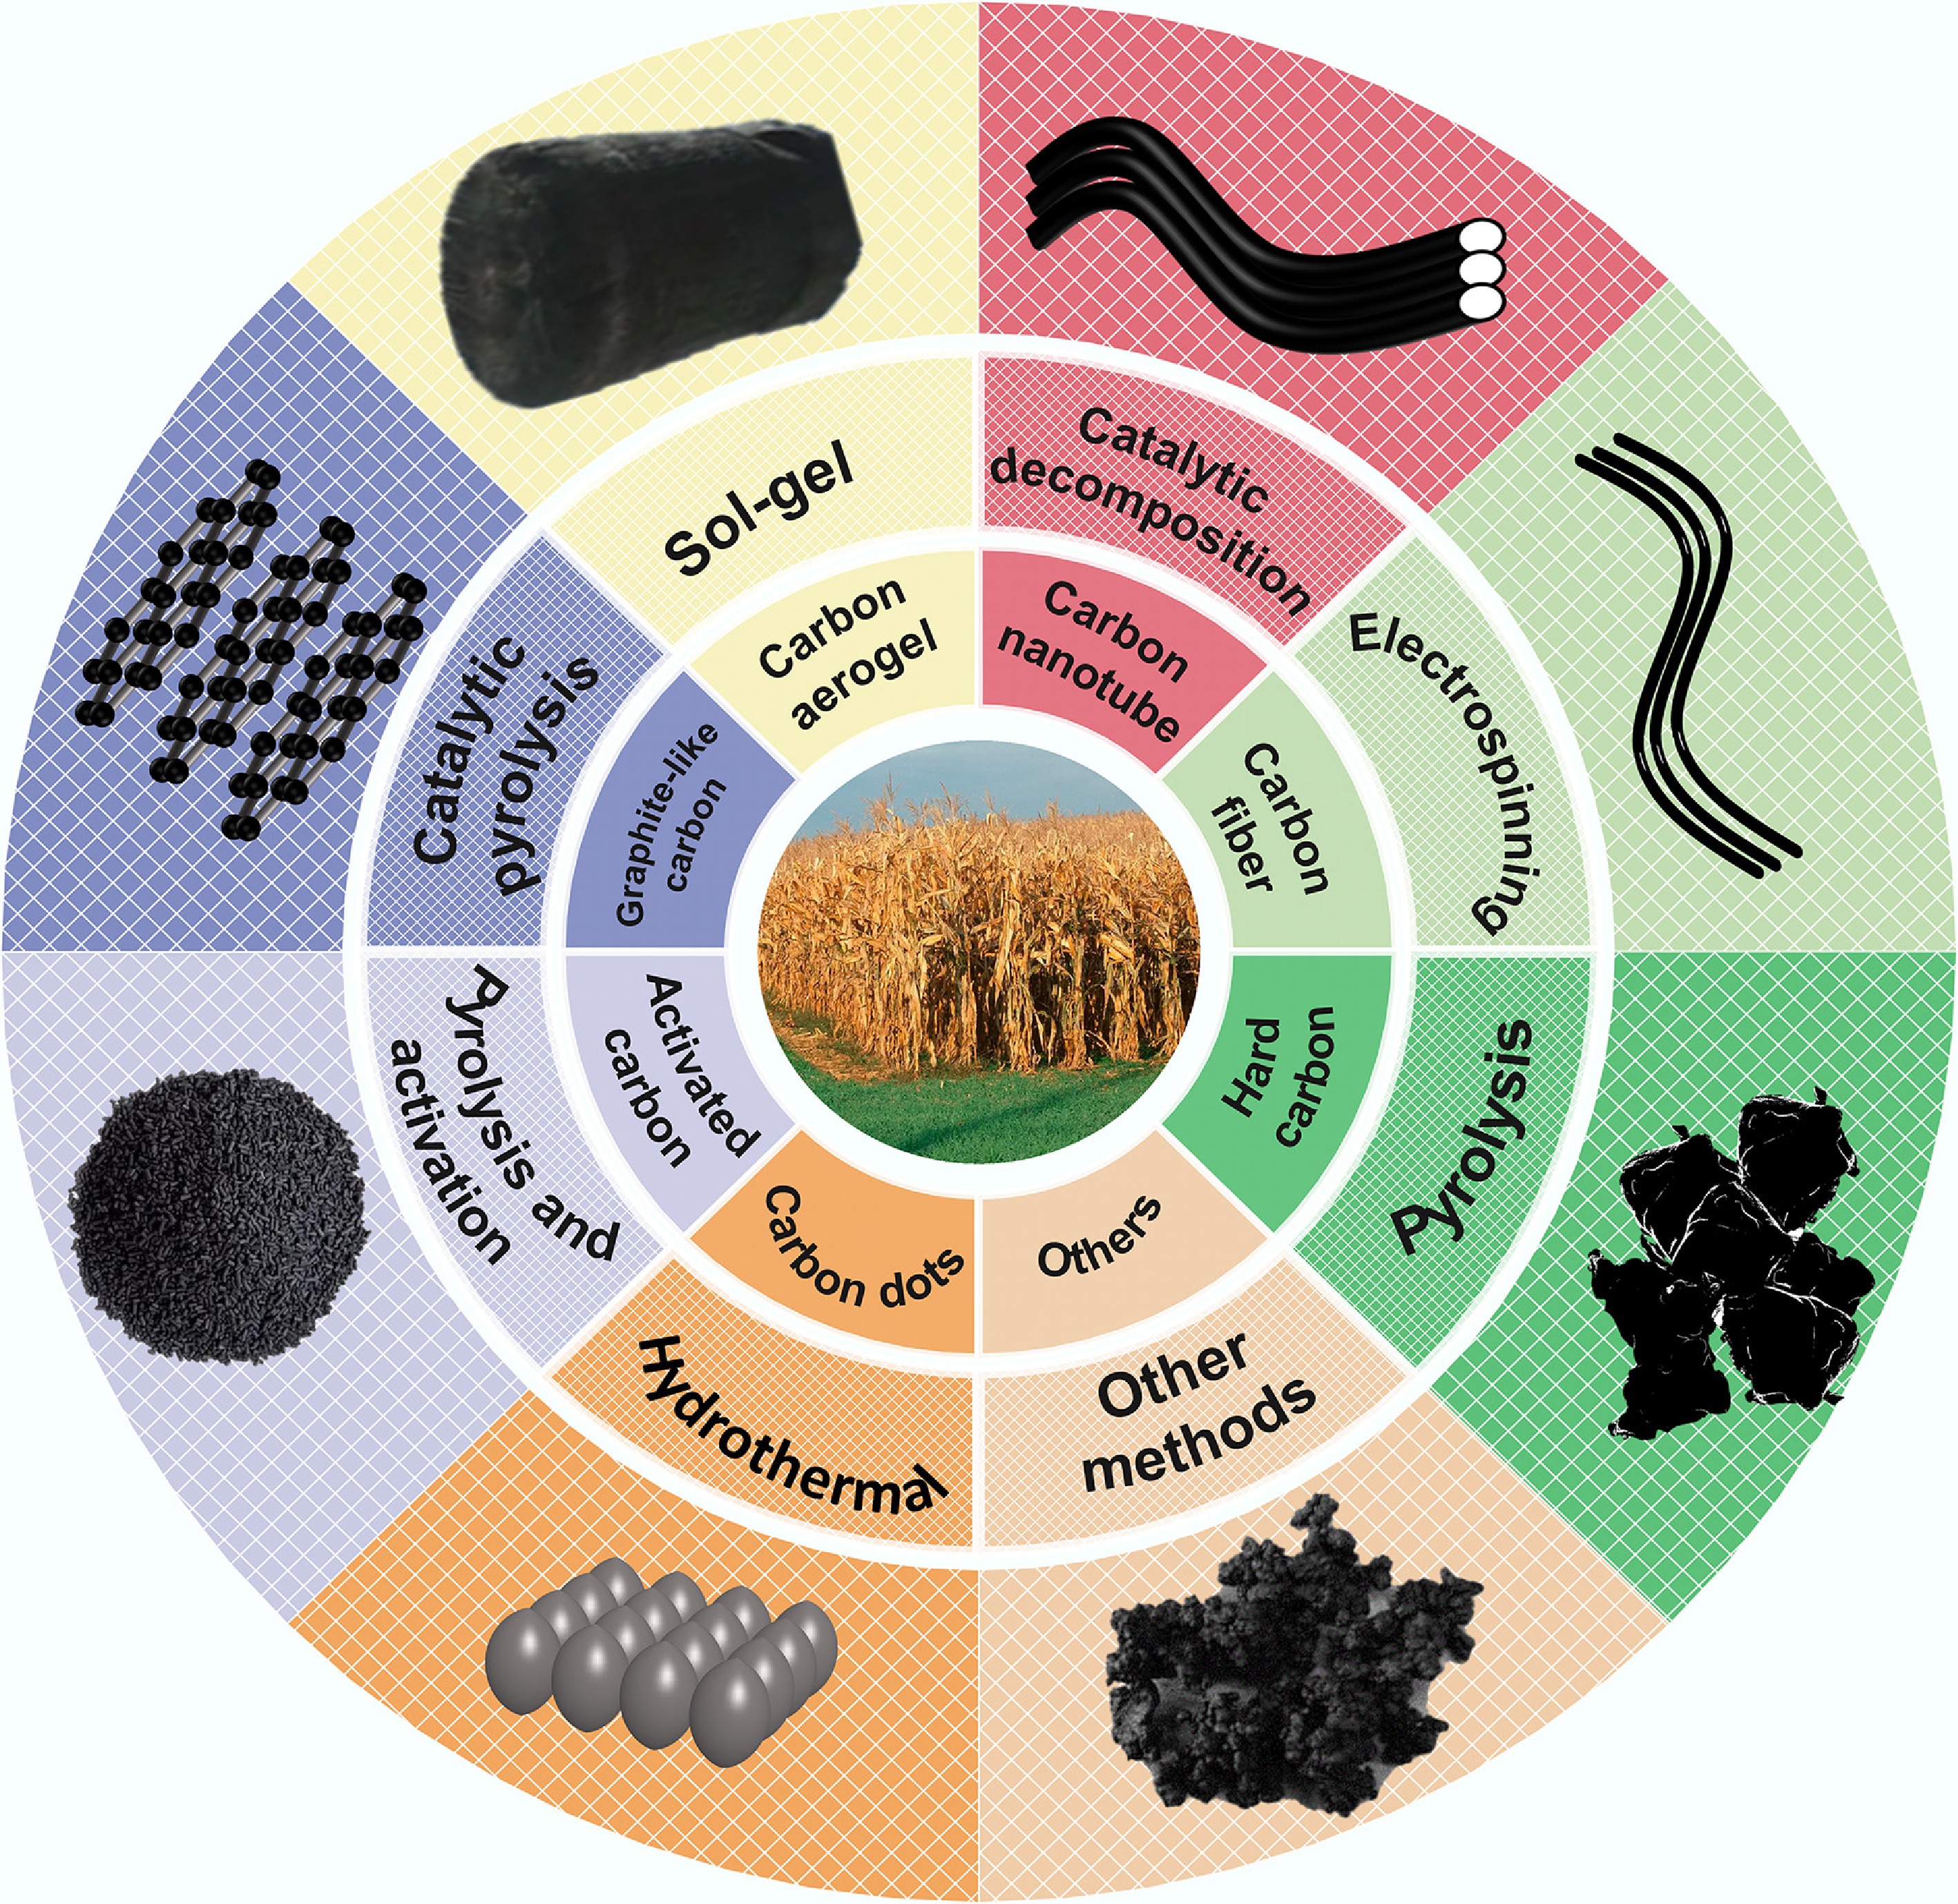
Figure 2.
Different BDCMs and one of their corresponding preparation methods.
-
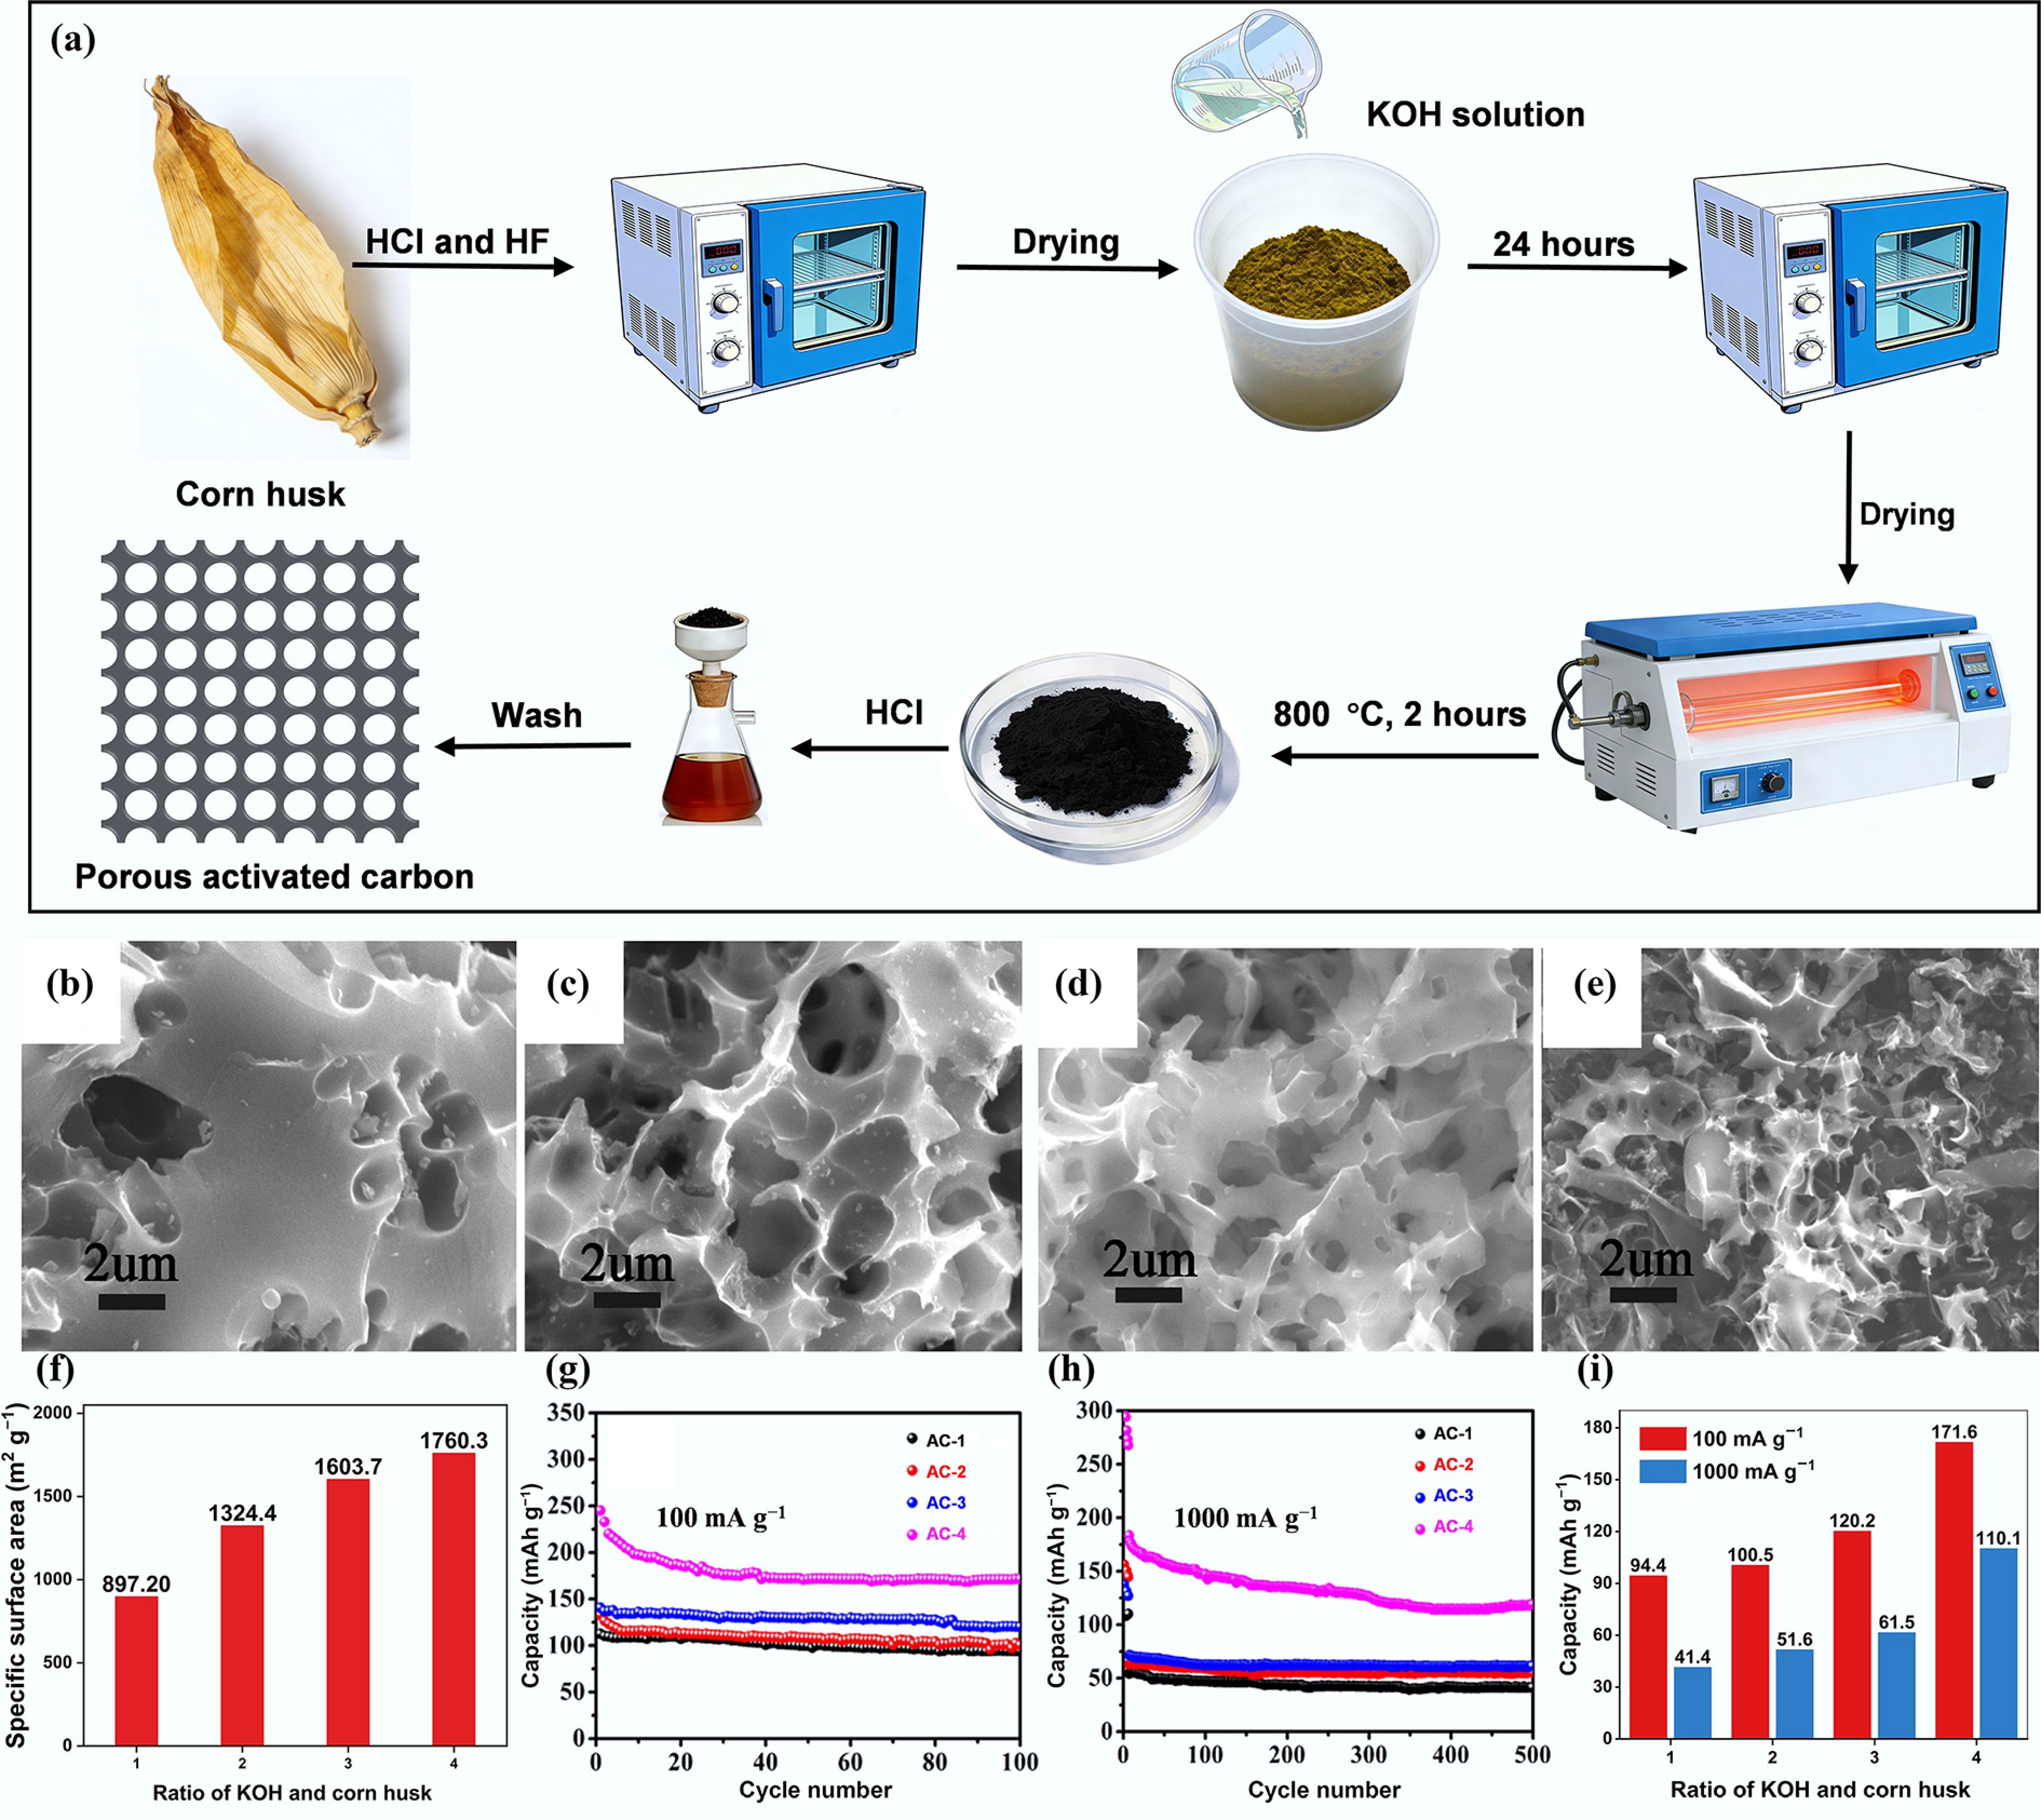
Figure 3.
(a) Schematic diagram of the preparation process of porous activated carbon from corn husk. SEM images of (b) AC-1, (c) AC-2, (d) AC-3, and (e) AC-4. (f) The effect of the ratio of KOH and corn husk on specific surface area; cycling performance of ACs at a current density of (g) 100 mA g−1 and (h) 1,000 mA g−1. (i) The effect of the ratio of KOH and corn husk on the remaining capacity. Reproduced with permission[40]. Copyright 2019, Elsevier.
-
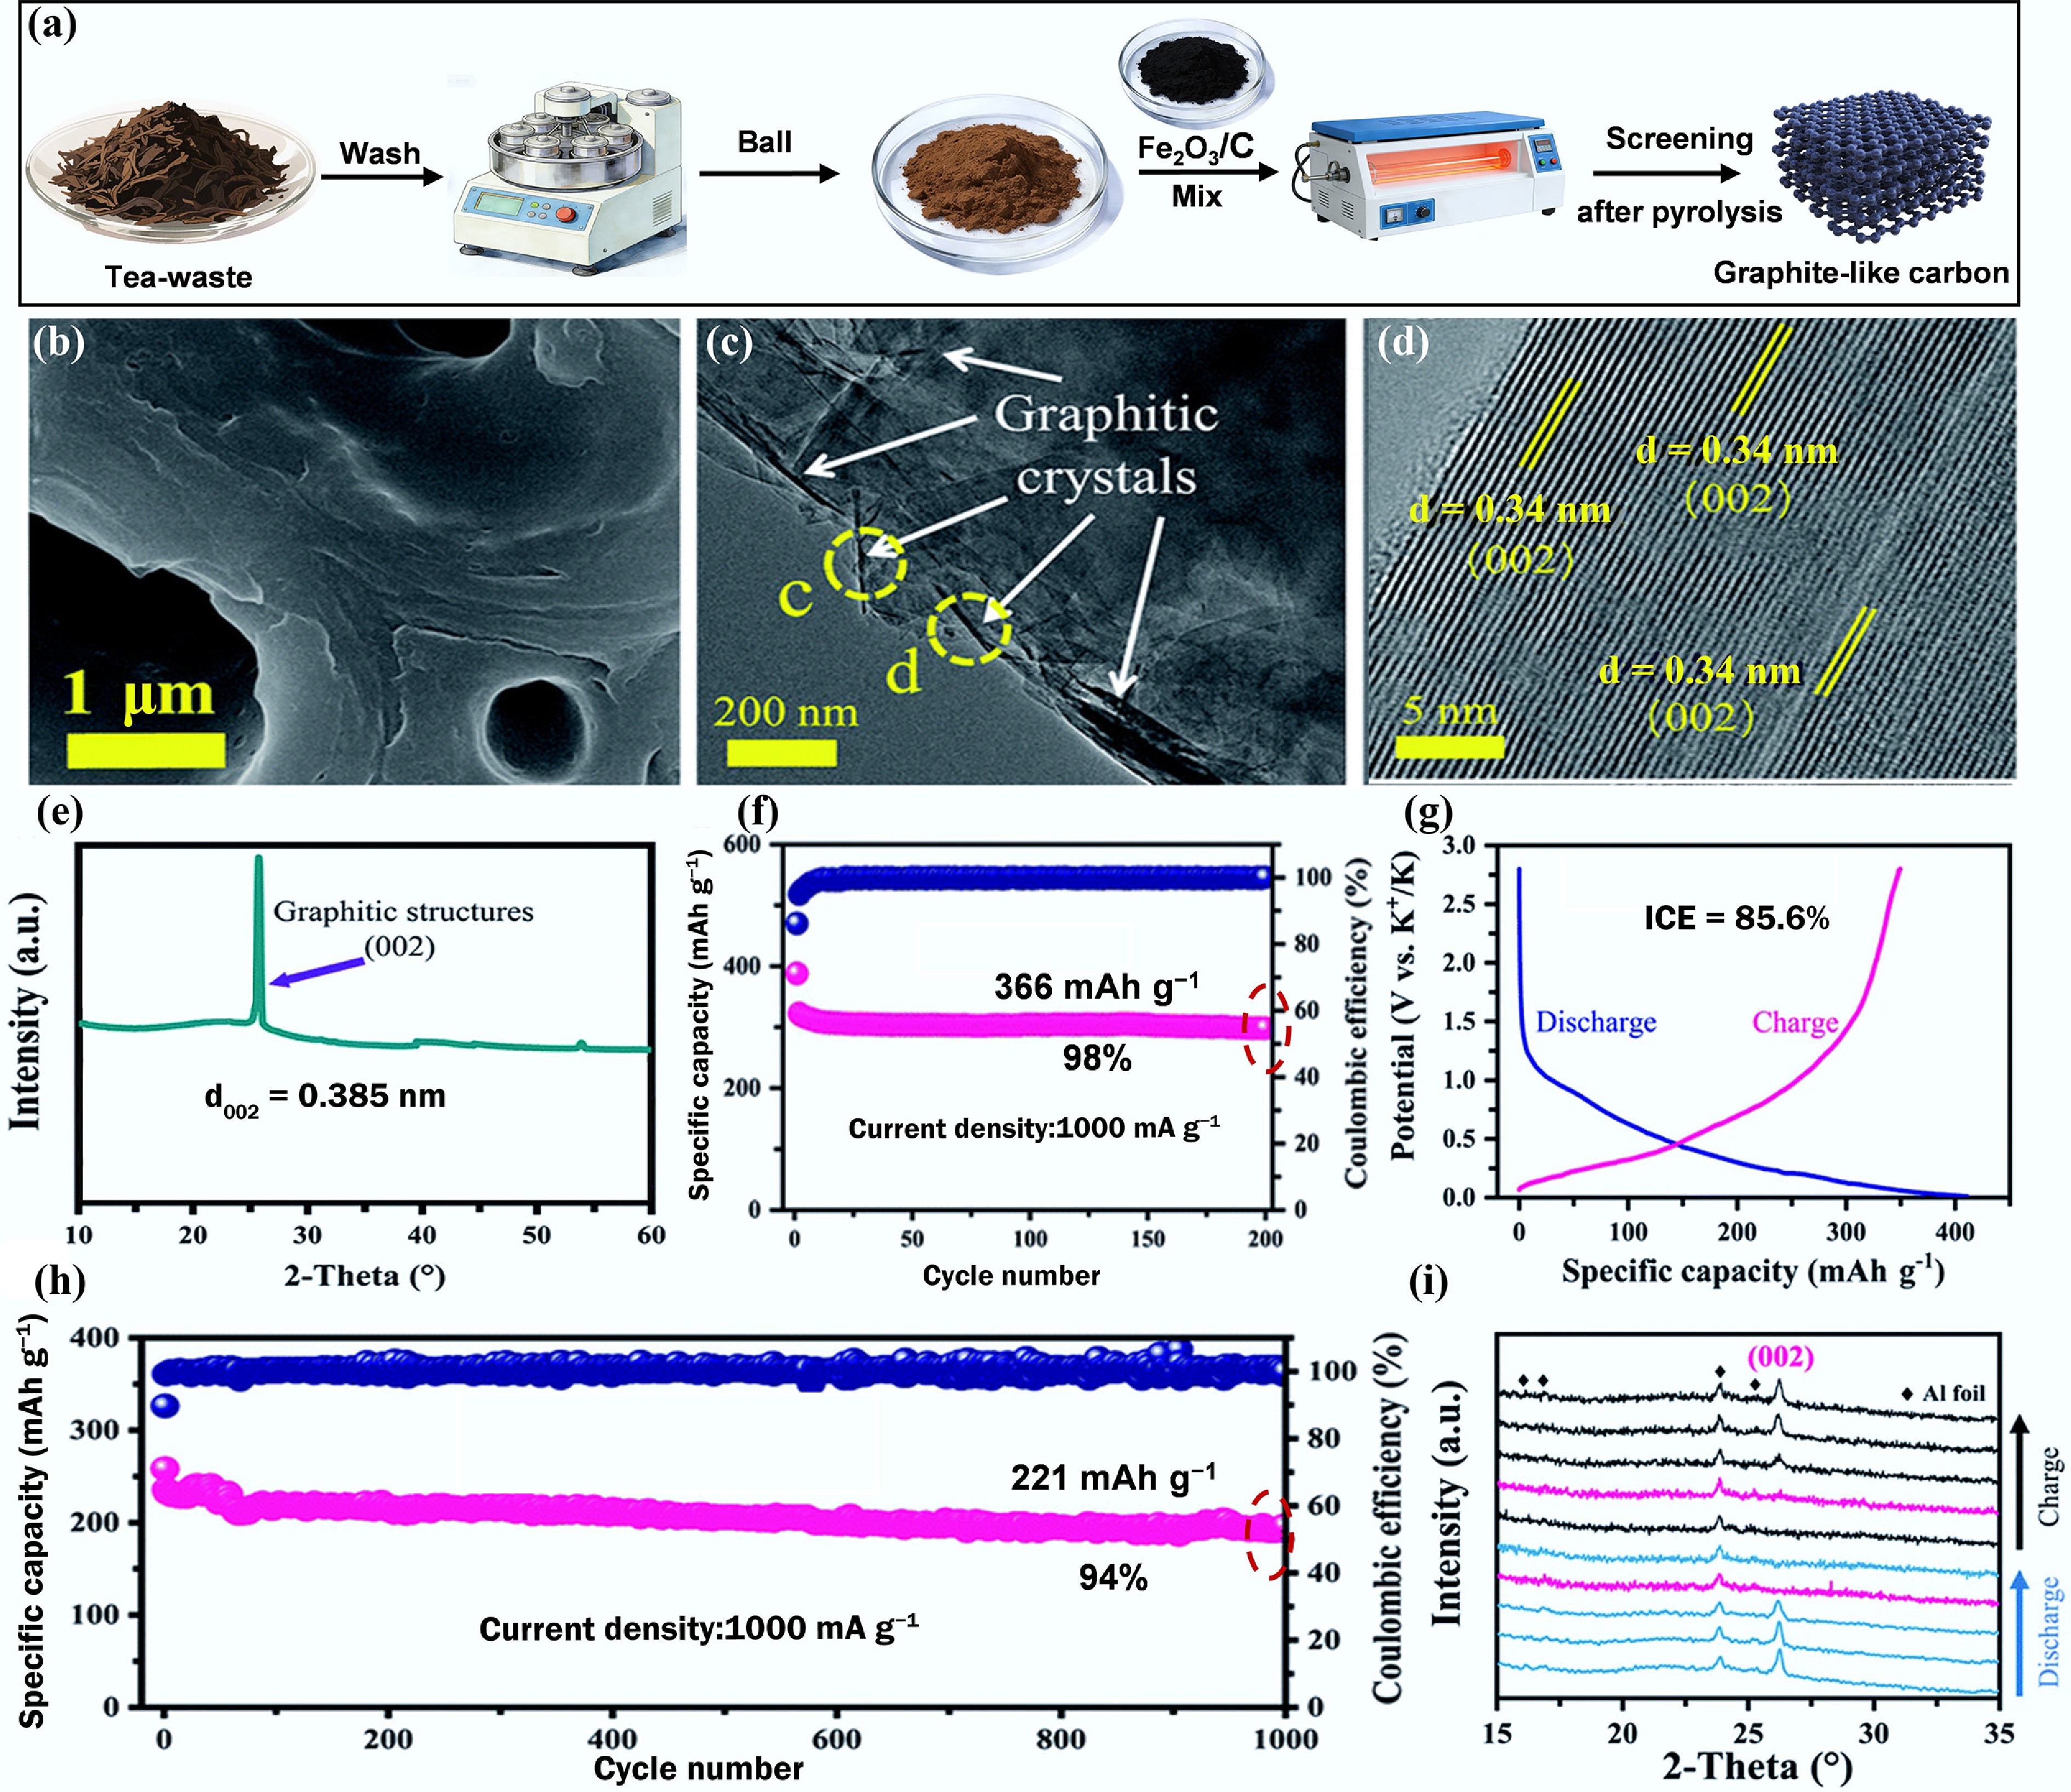
Figure 4.
(a) Schematic diagram of the catalytic synthesis of GLC from tea waste. (b) SEM. (c), (d) TEM images. (e) XRD curve. (f) Cycling performance. (g) Galvanostatic charge/discharge (GCD) curves at 100 mA g−1. (h) Long-term cycling performance at 1,000 mA g−1. (i) In situ XRD of GLC anode. Reproduced with permission[47]. Copyright 2021, Royal Society of Chemistry.
-
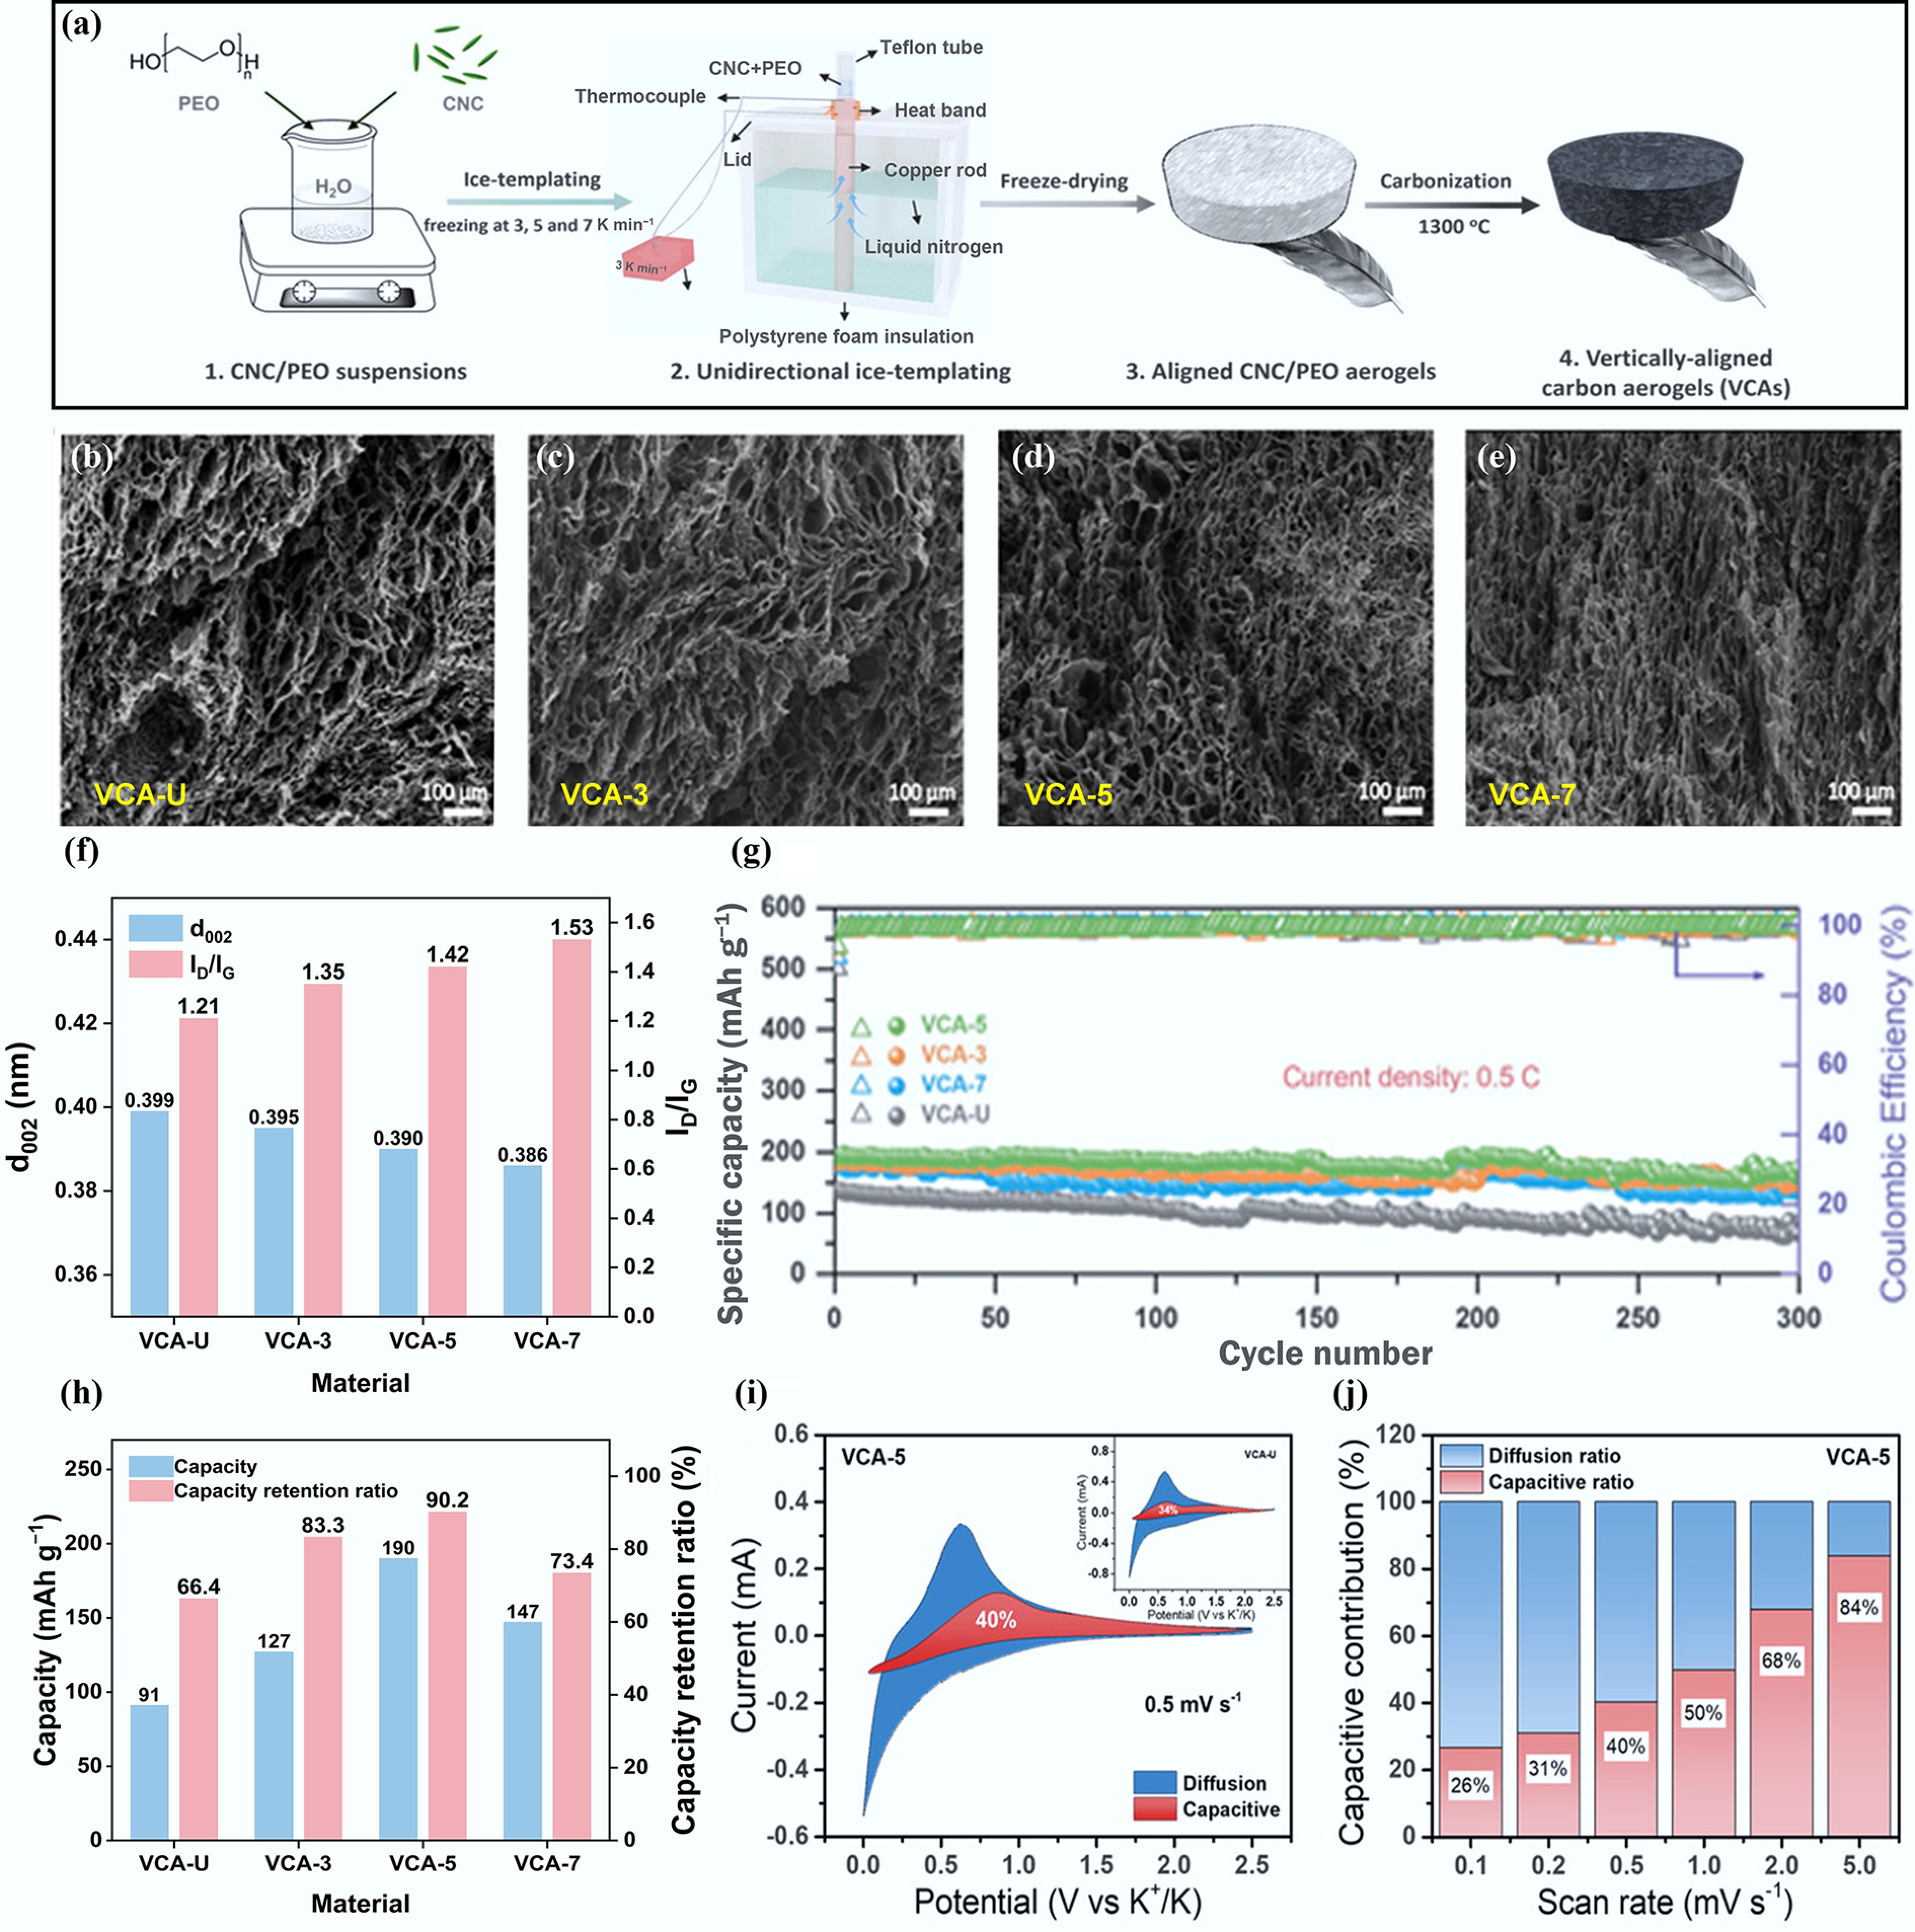
Figure 5.
(a) Synthesis process of CNC-derived CAs. (b)–(e) SEM images of CAs. (f) Structural properties. (g) Cycling performance at a current density of 0.5 C. (h) The capacity and capacity retention ratio of four anodes. (i) Separation of the capacitive and diffusion-controlled charges at 0.5 mV s−1. (j) Contribution ratios of the capacitive and diffusion-controlled charge at various scan rates. Reproduced with permission[54]. Copyright 2022, Wiley-VCH.
-
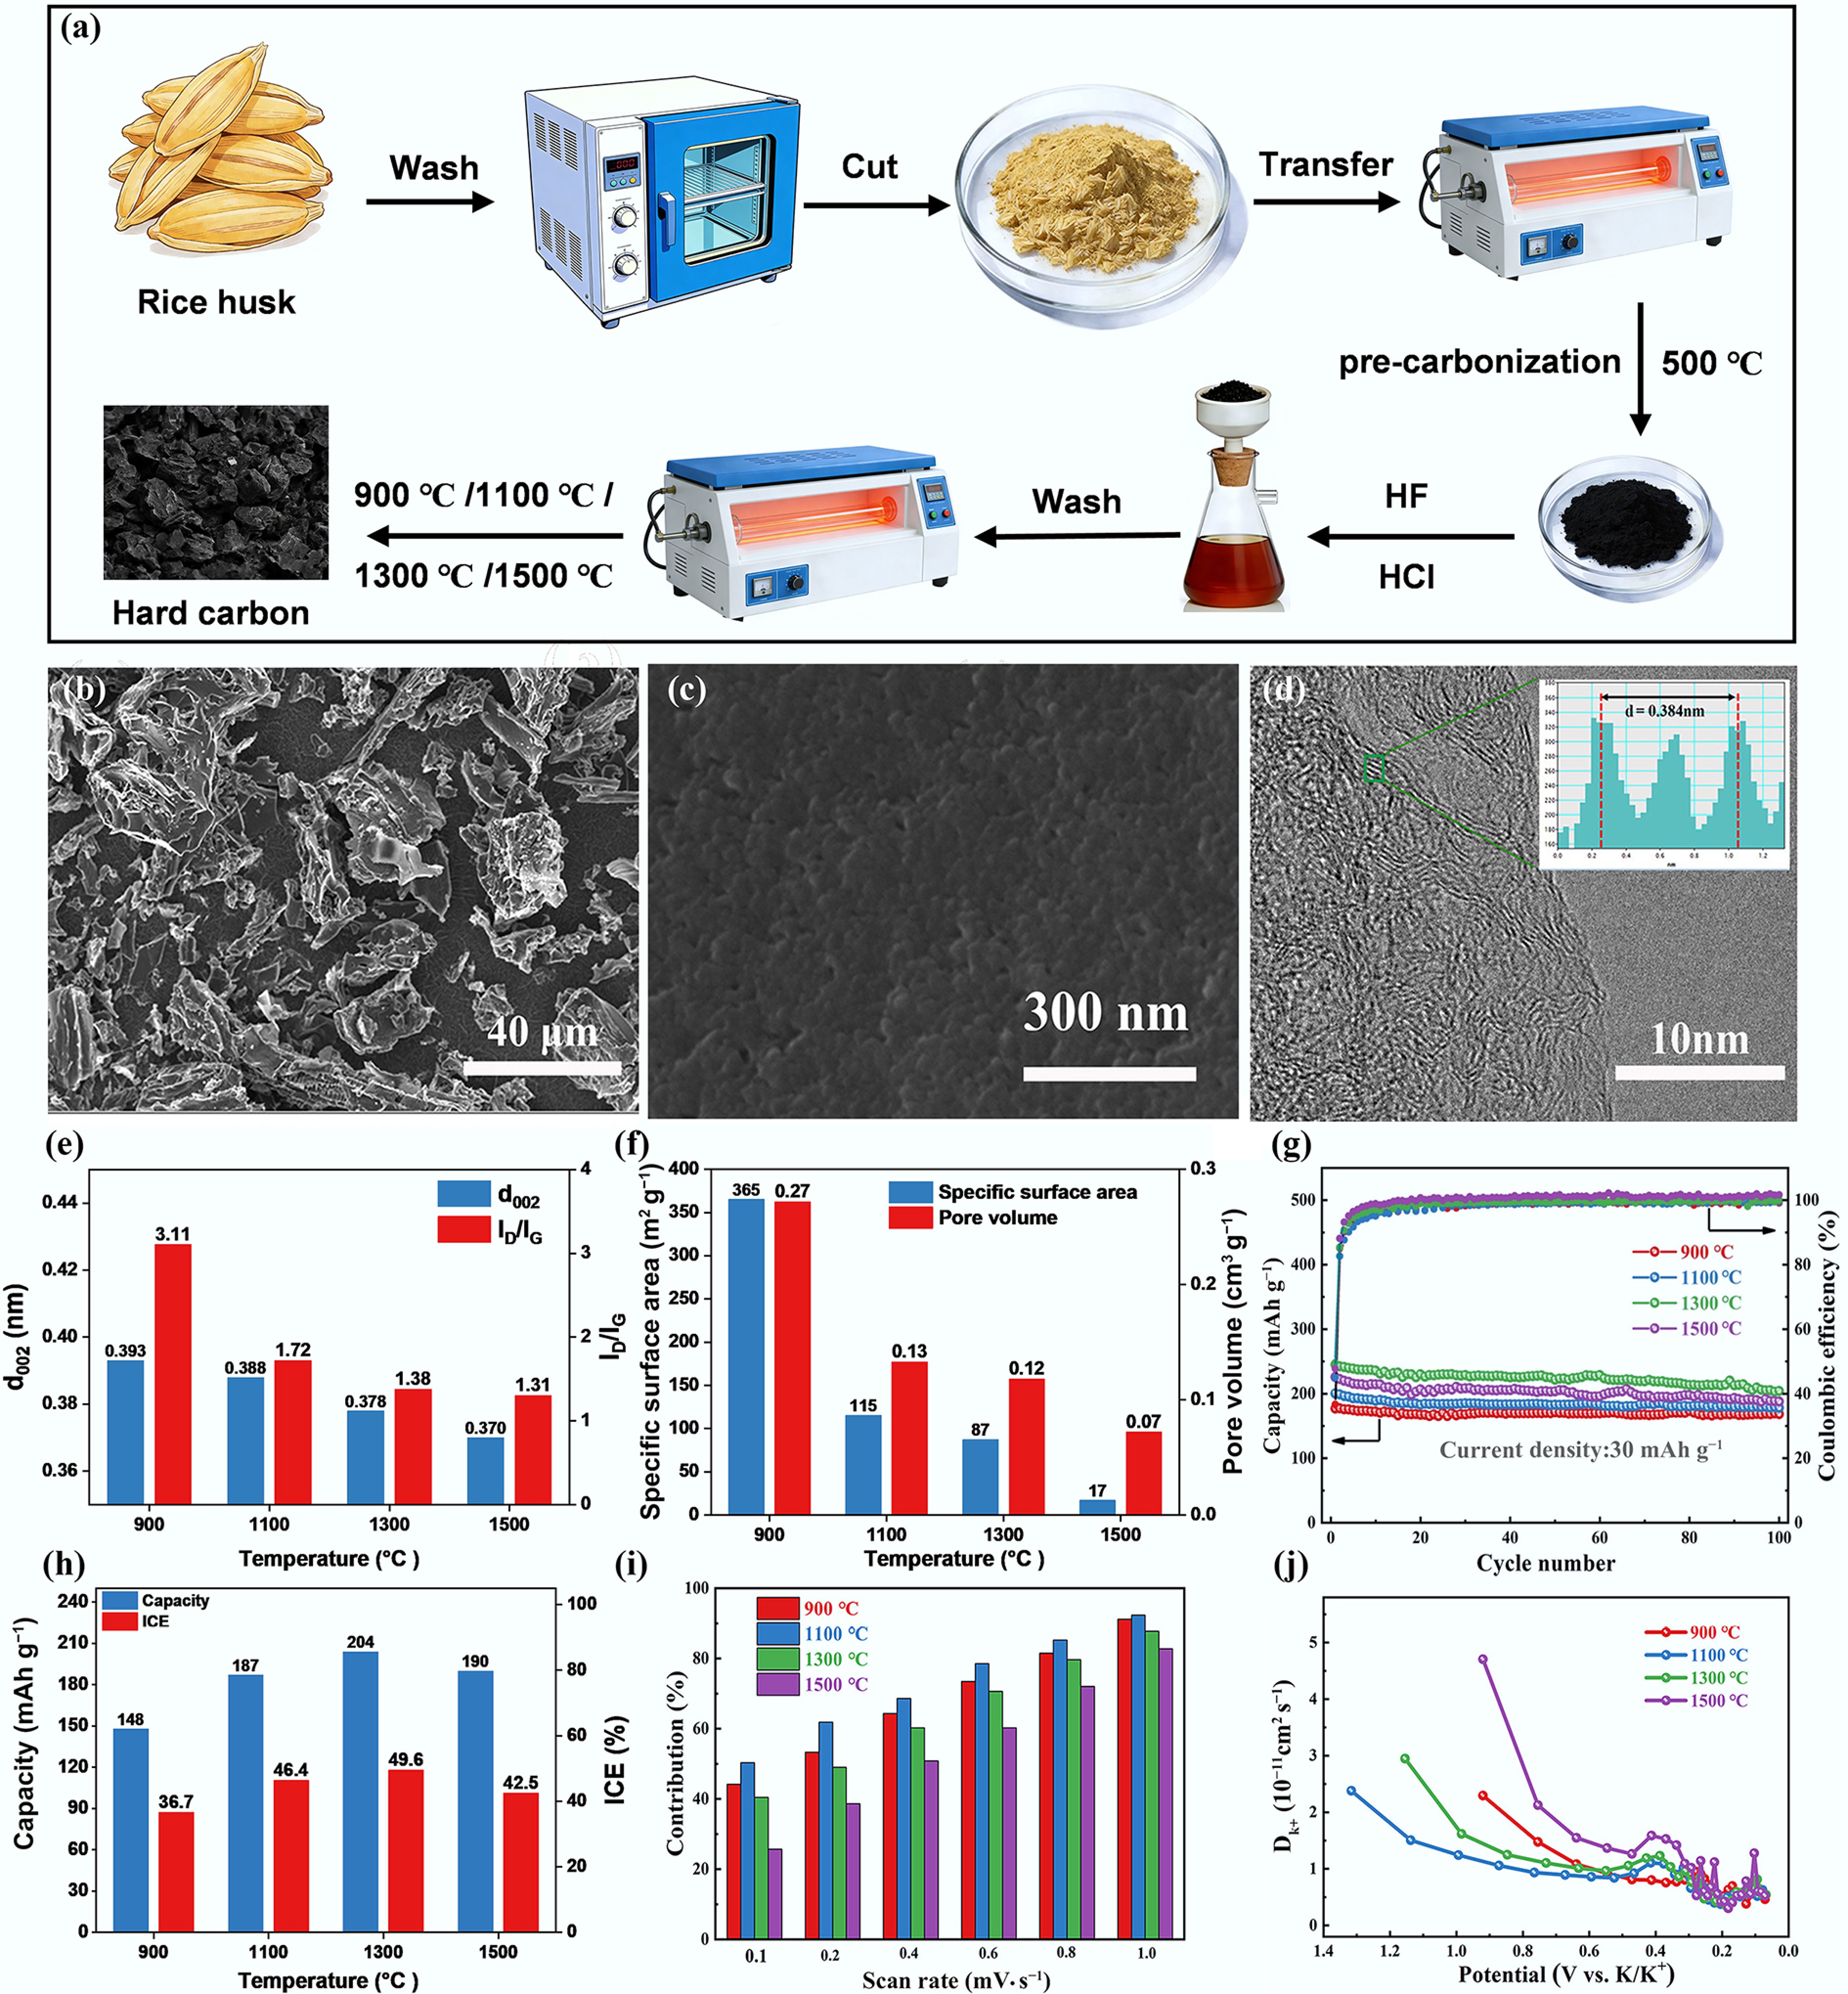
Figure 6.
(a) Preparation process of rice husk-based HCs. (b), (c) SEM. (d) TEM images of HC carbonized at 1,300 °C. (e) Structural properties of HCs. (f) Pore property. (g) Cycling performance of HCs at a current density of 30 mA g−1. (h) The effect of pyrolysis temperature on the capacity and ICE. (i) The contribution of the capacitance at different scan rates. (j) Diffusion coefficients of the discharge process. Reproduced with permission[58]. Copyright 2020, Elsevier.
-
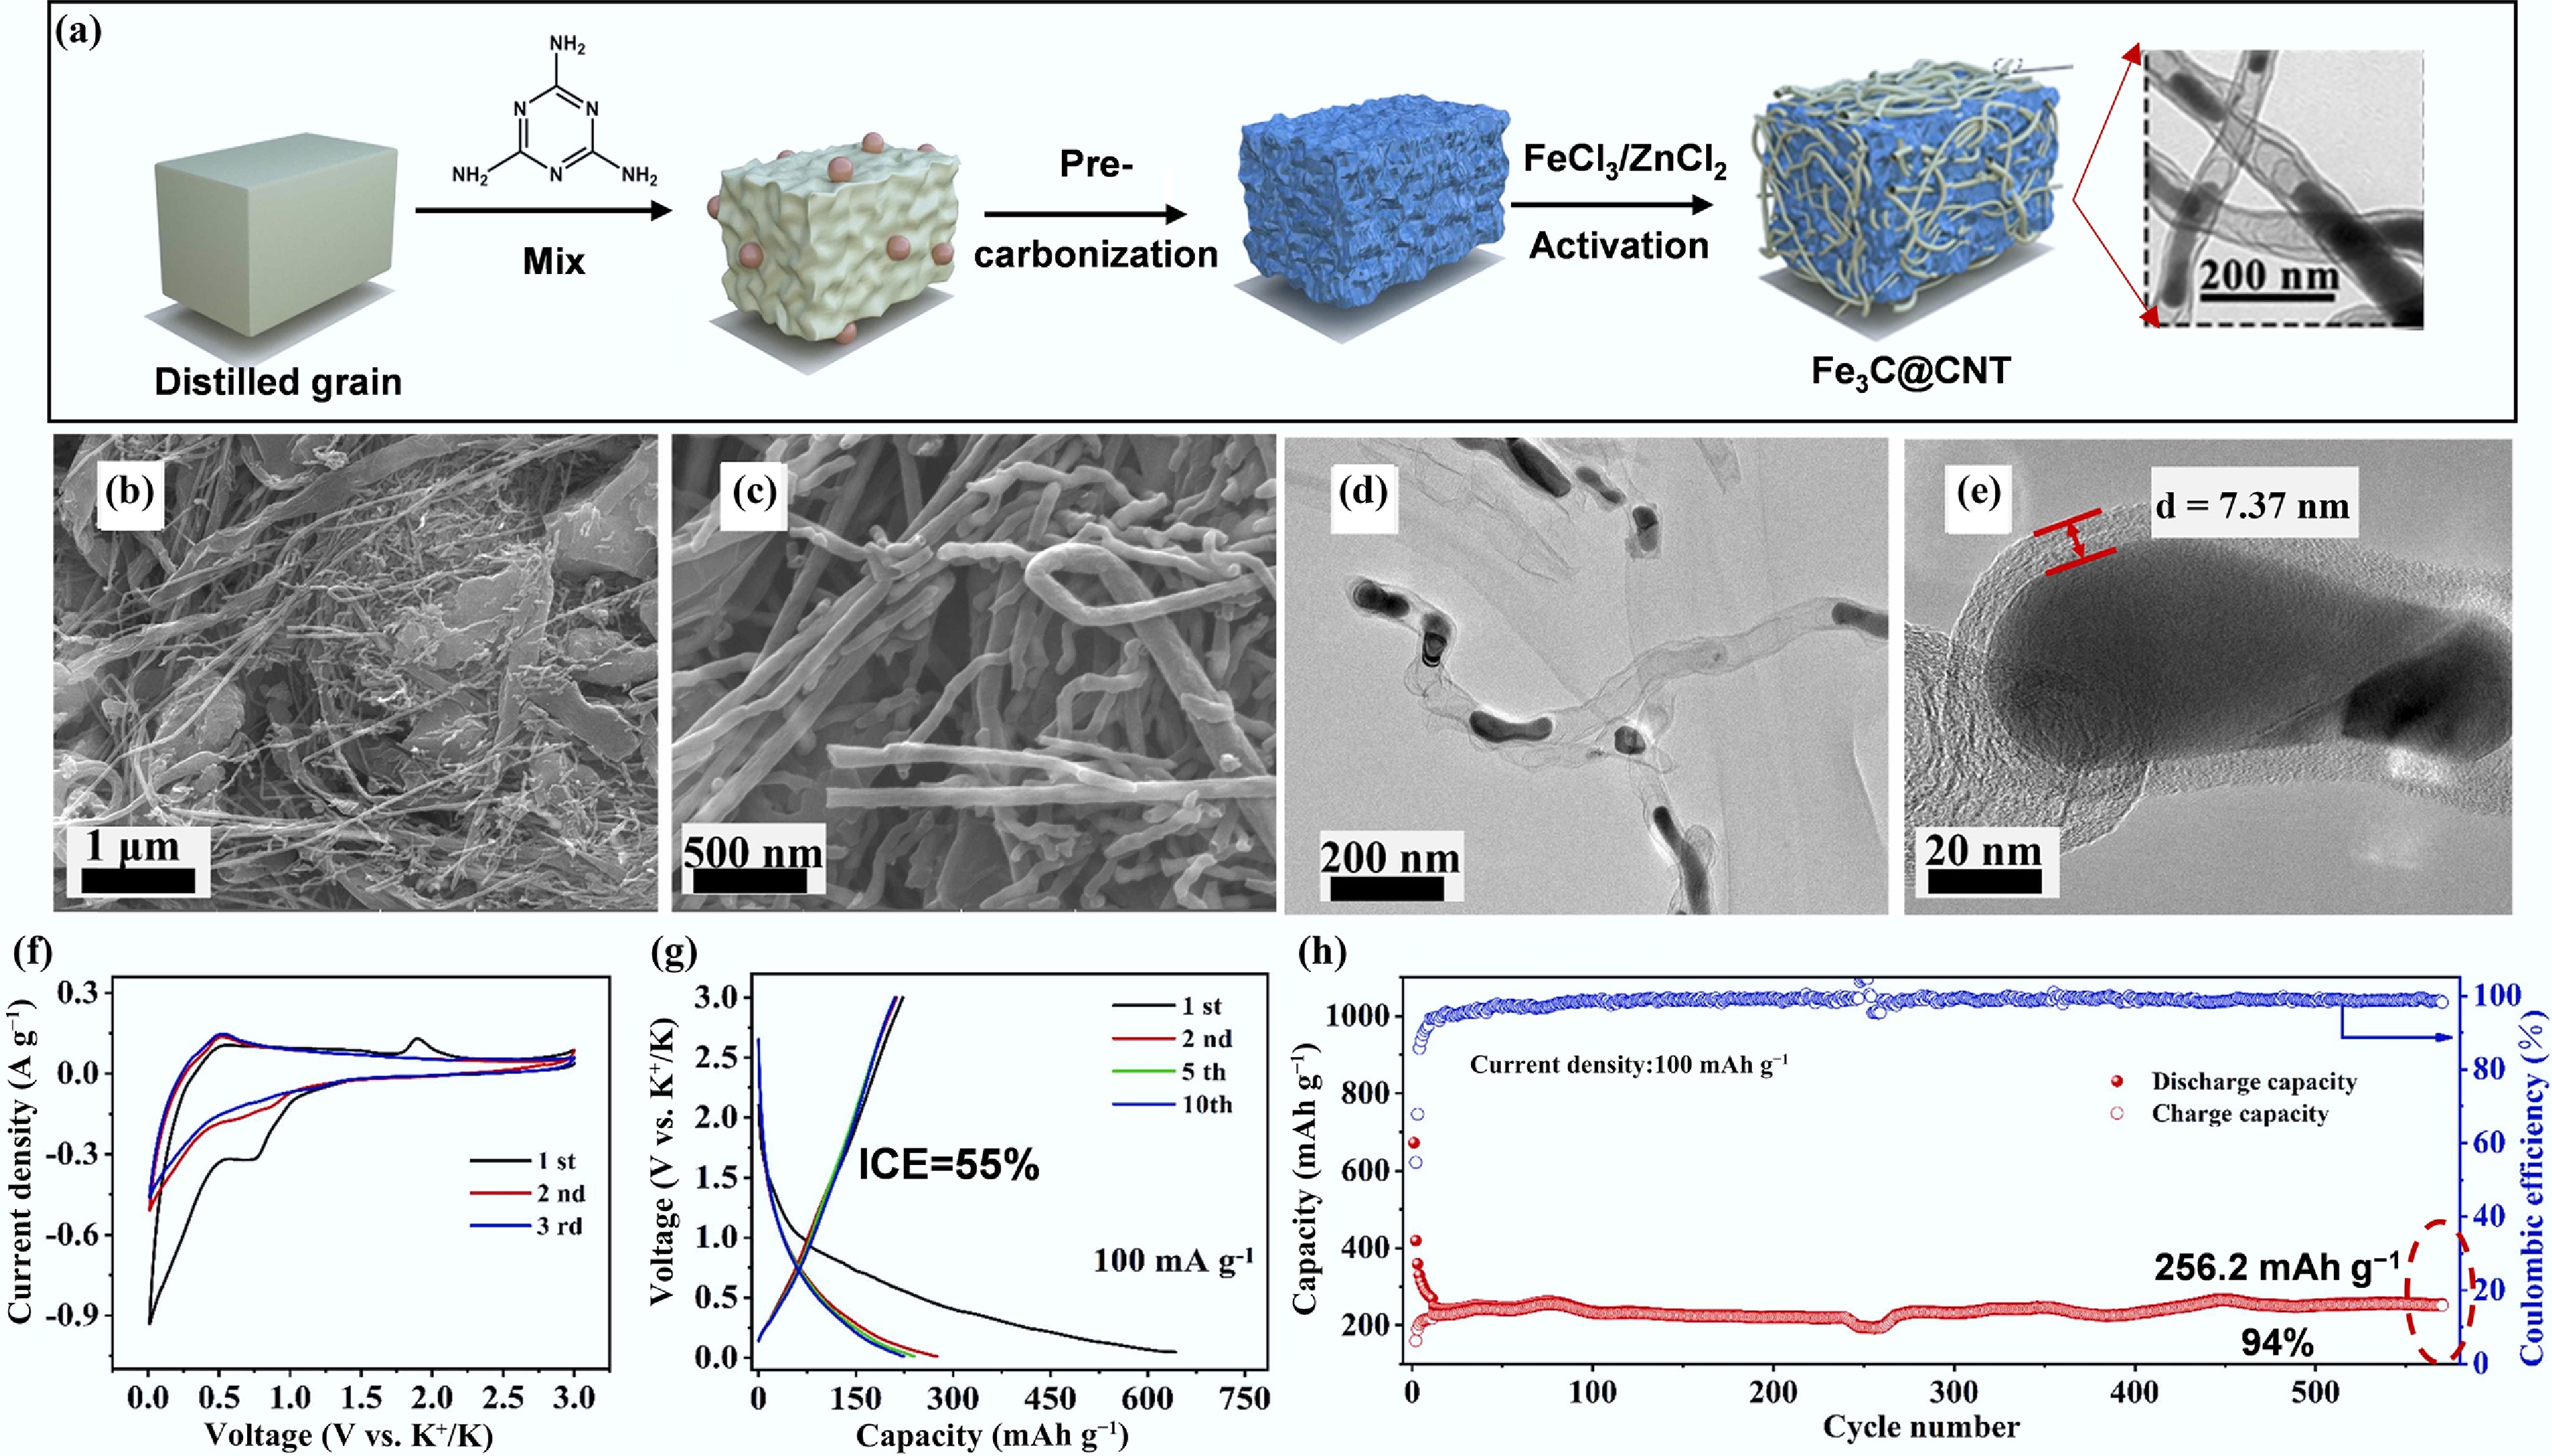
Figure 7.
(a) Schematic of Fe3C@CNT synthetic process. (b), (c) SEM images. (d), (e) TEM images. (f) CV profiles at a scan rate of 0.2 mV s−1. (g) GCD curves. (h) Cycling performance in PIBs at a current density of 100 mA g−1. Reproduced with permission[66]. Copyright 2022, Elsevier.
-
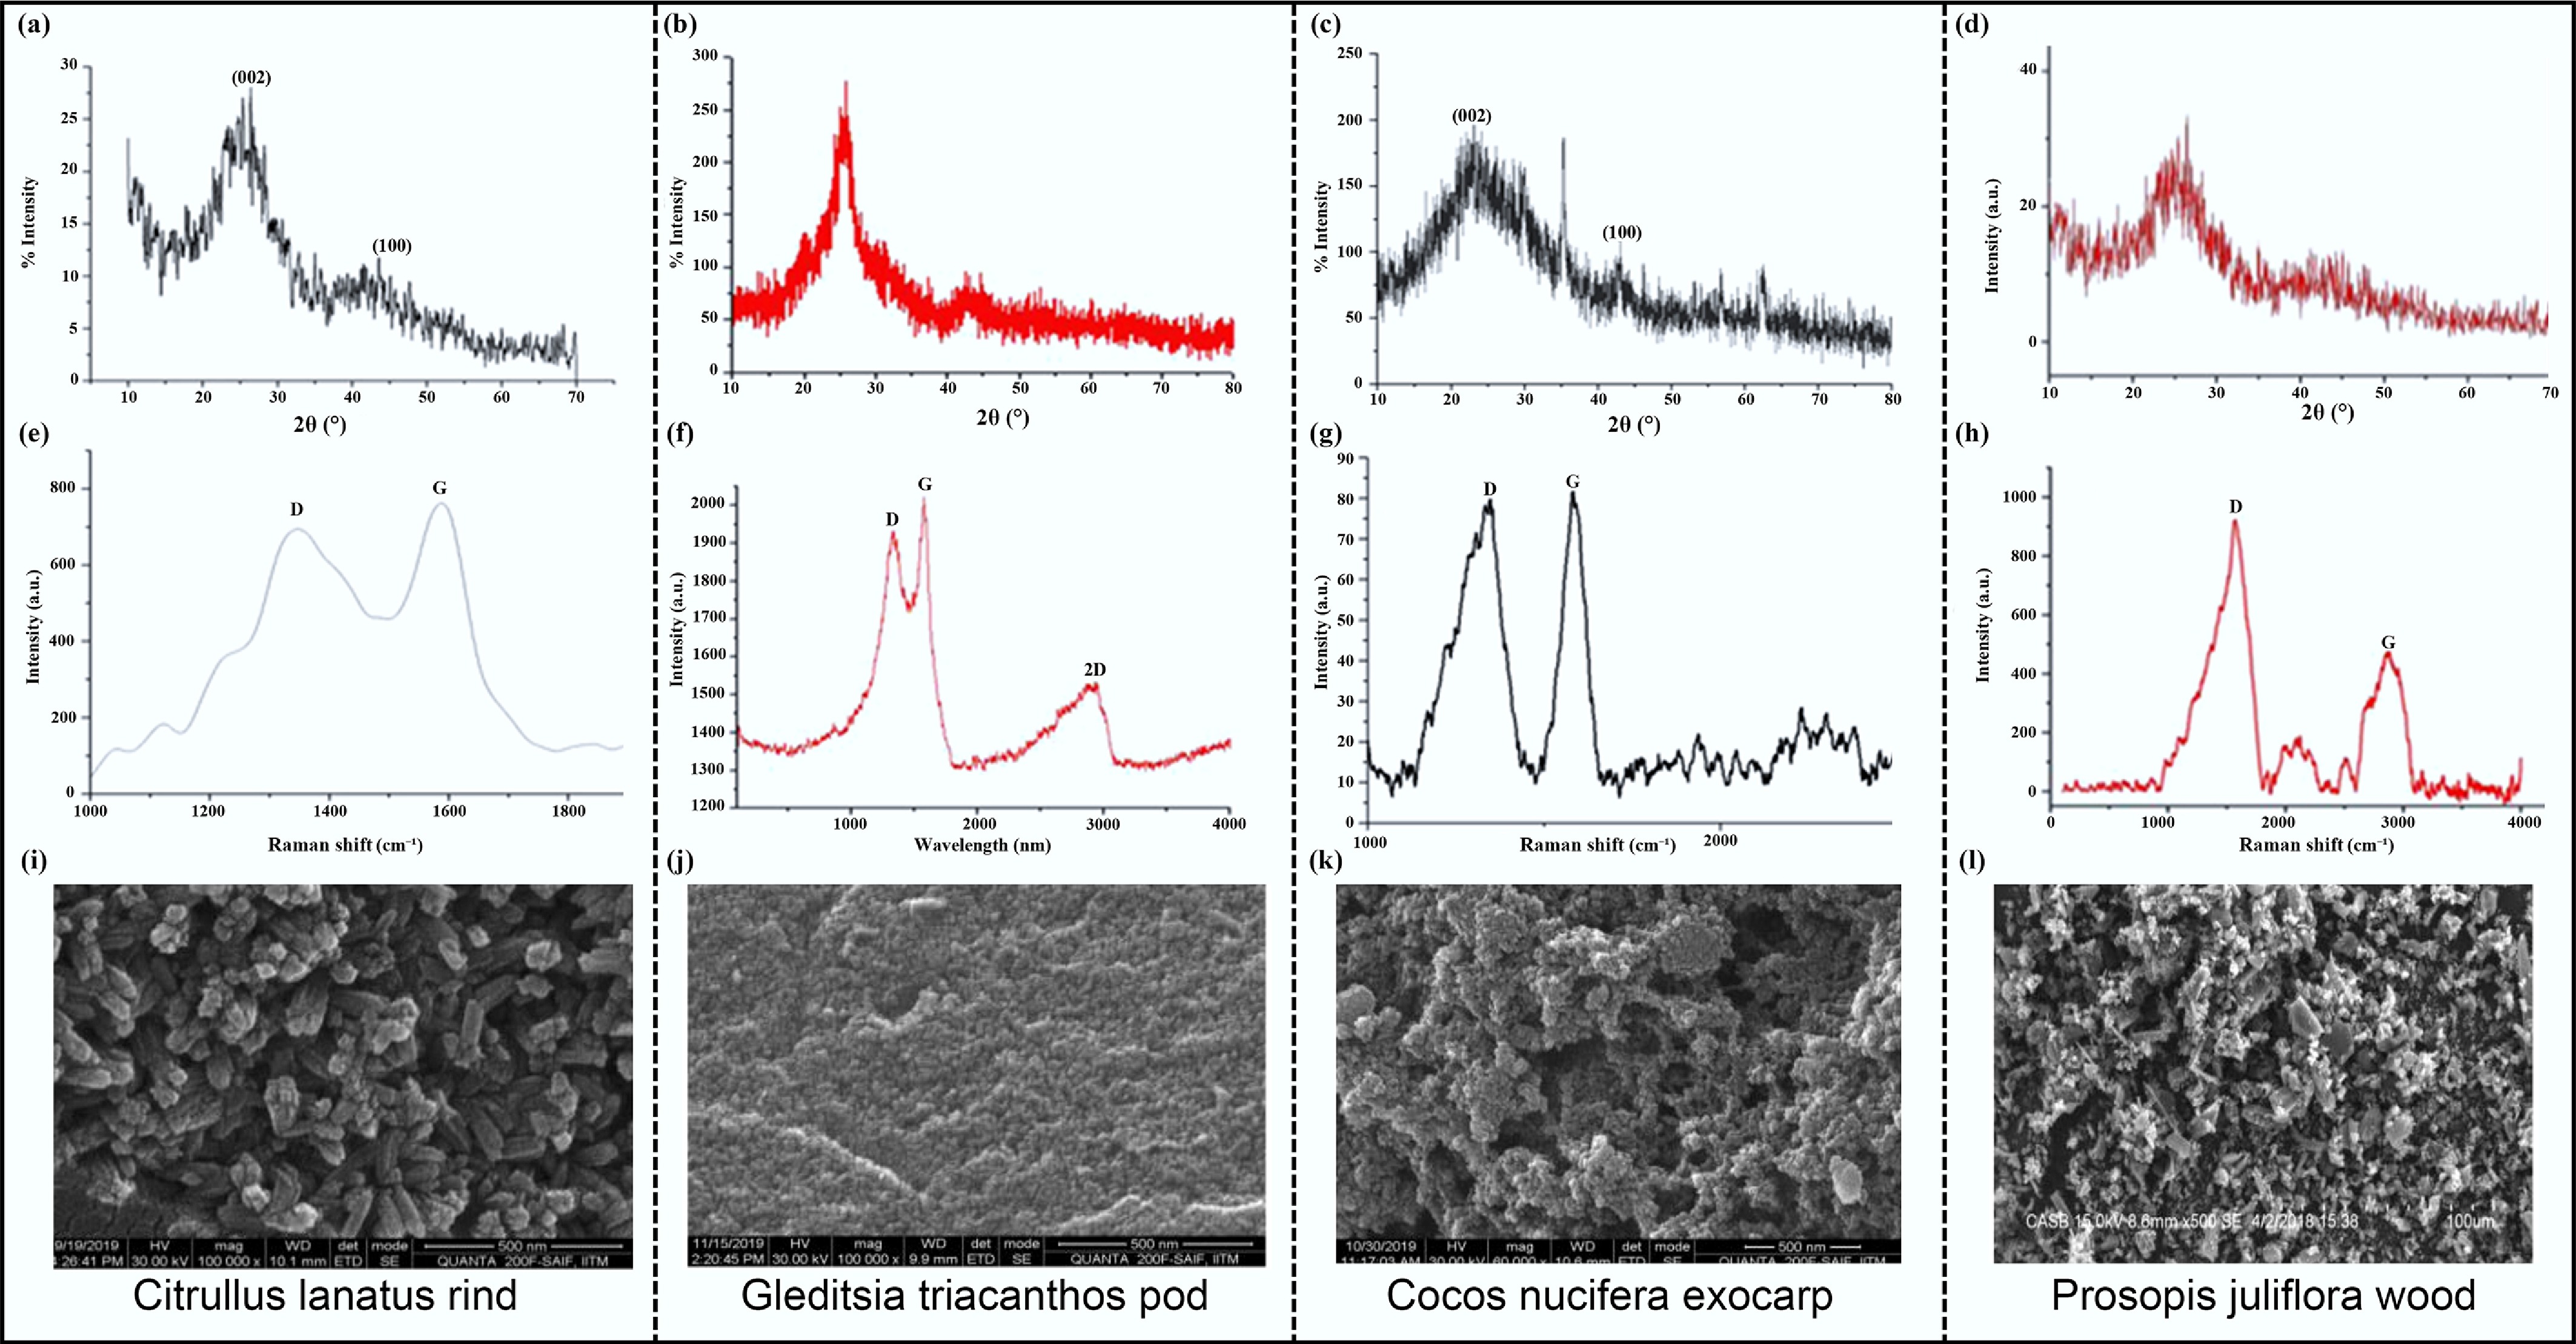
Figure 8.
(a)–(d) XRD curves. (e)–(h) Raman spectra. (i)–(l) SEM images of CNTs derived from Citrullus lanatus rind, Gleditsia triacanthos pod, Cocos nucifera exocarp, and Prosopis juliflora wood[68]. Copyright 2020, Taylor & Francis.
-
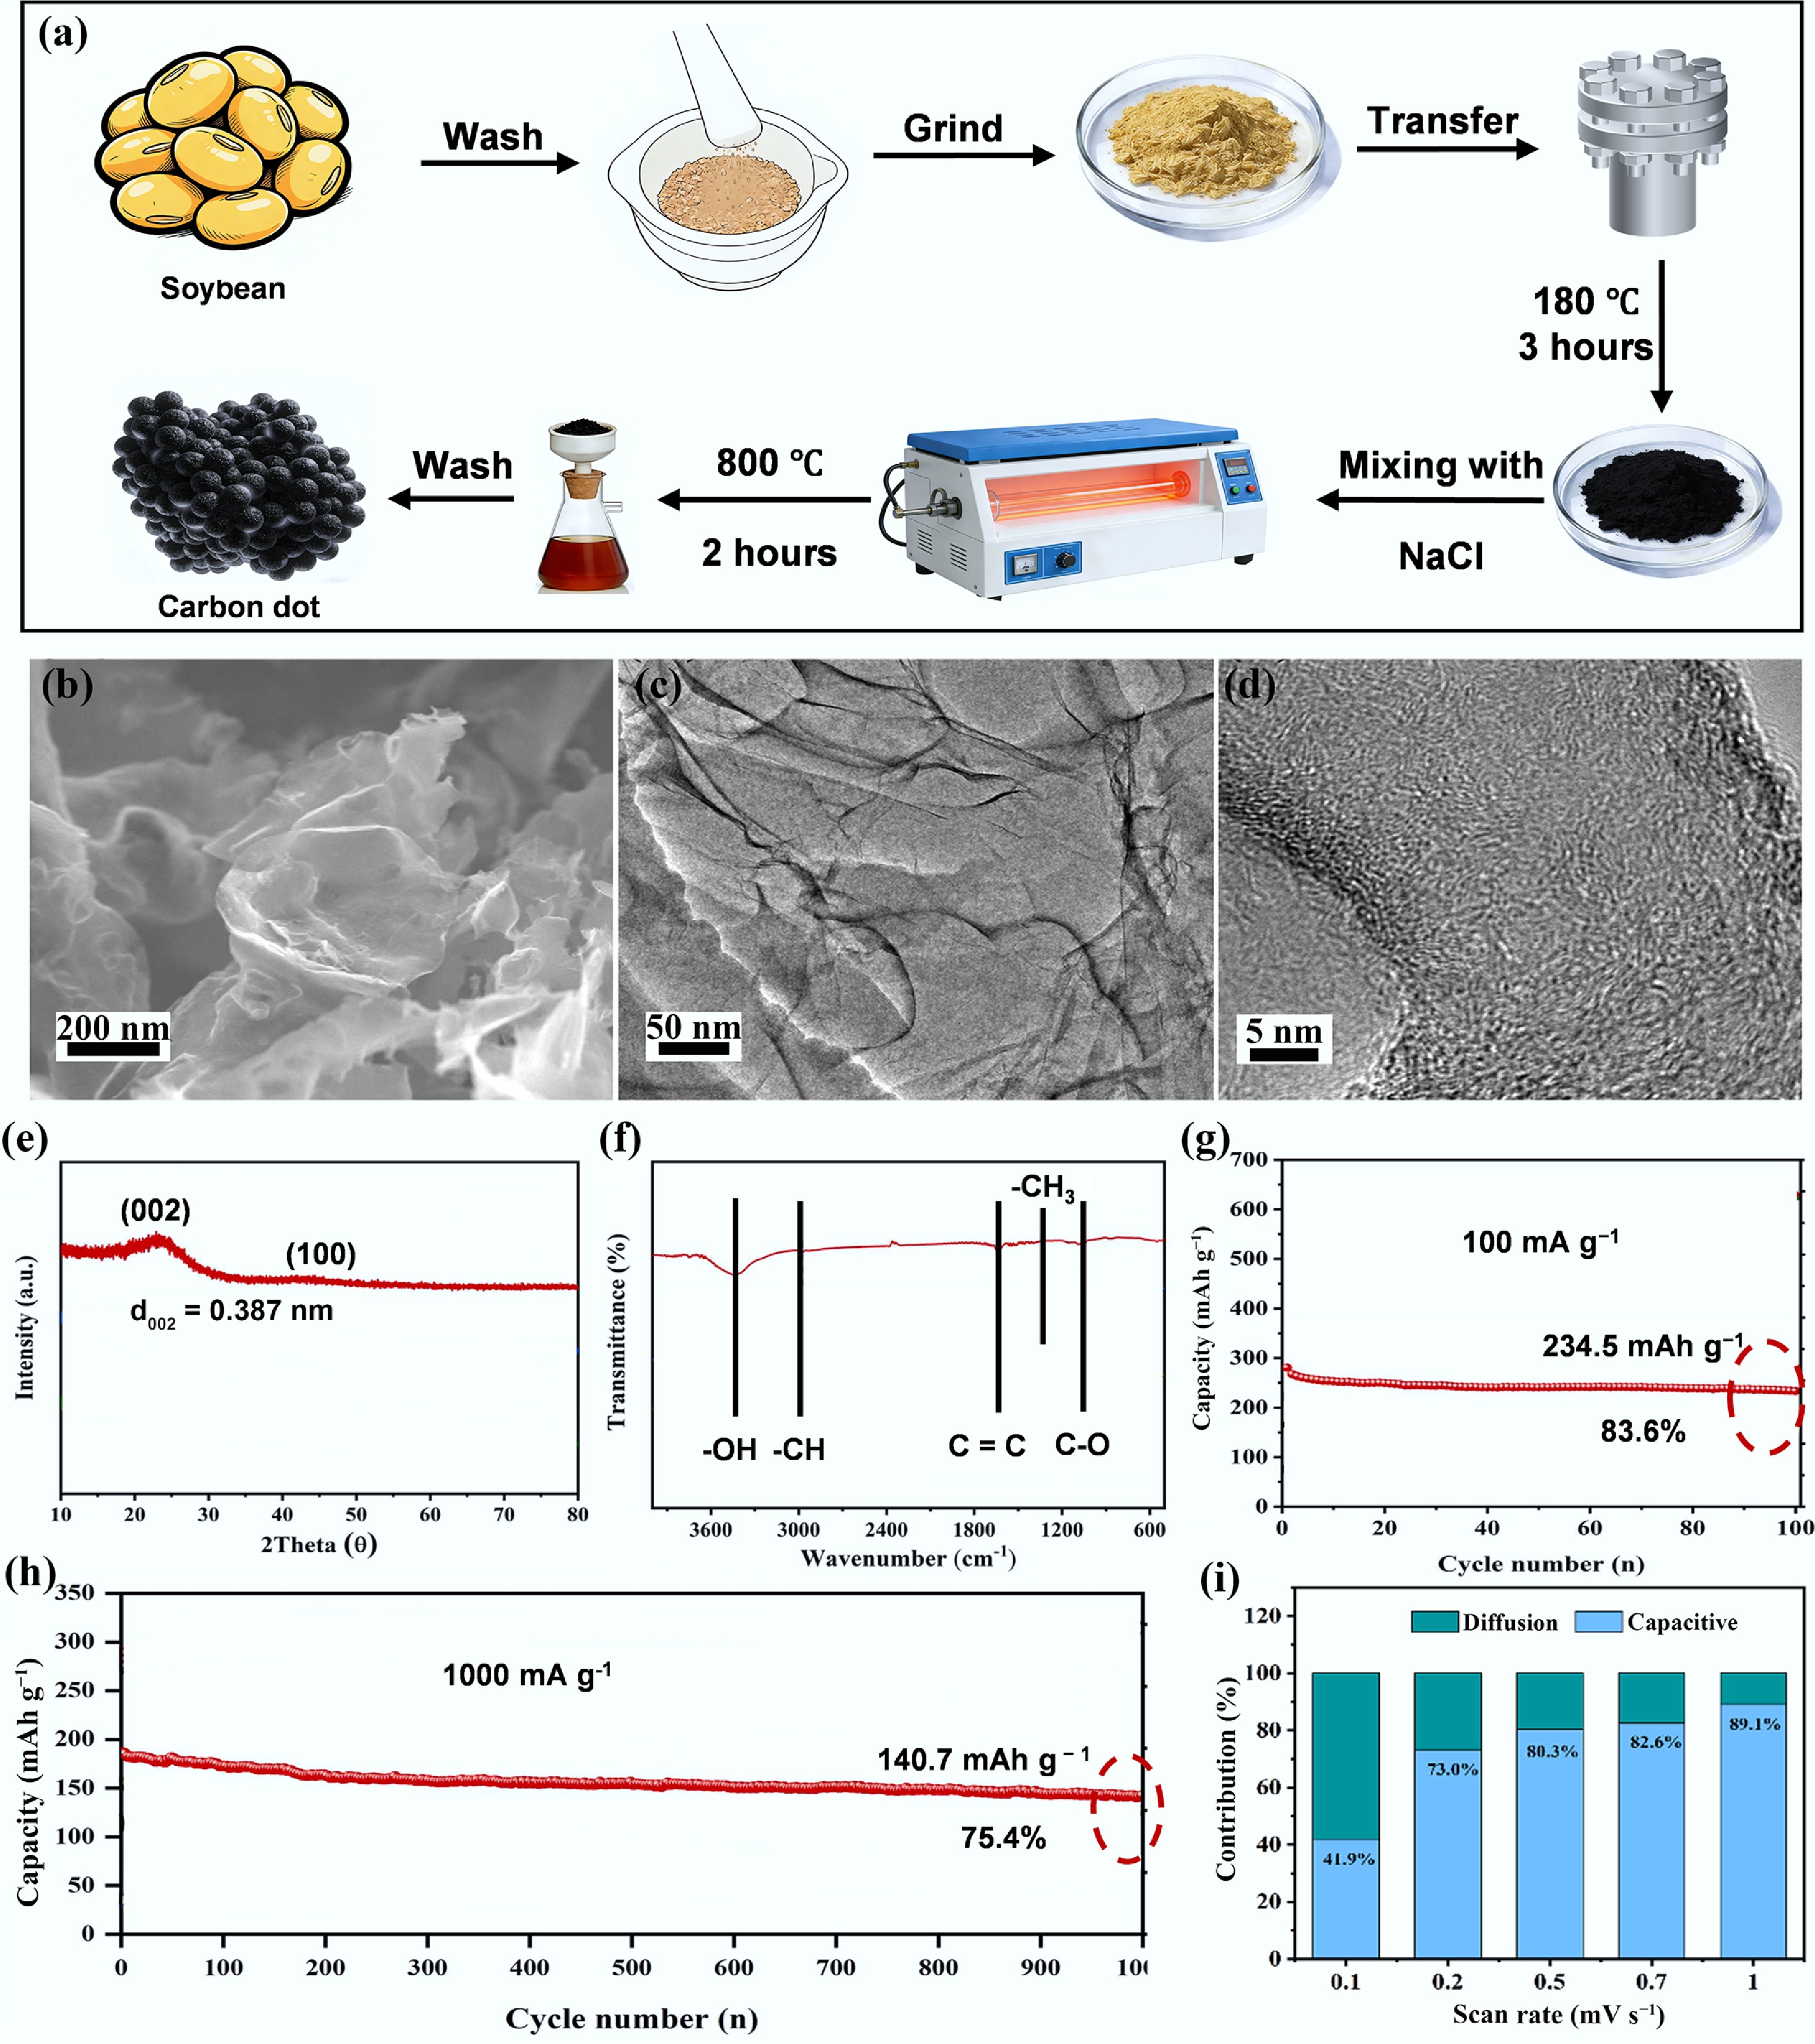
Figure 9.
(a) Synthetic process from soybean to CDs. (b) SEM images. (c), (d) TEM images. (e) XRD curve. (f) FT-IR. (g) Cycling performance at a current density of 100 mA g−1. (h) long cycling performance at a high current density of 1,000 mA g−1. (i) K+ storage performance kinetic analysis. Reproduced with permission[70]. Copyright 2022, Elsevier.
-
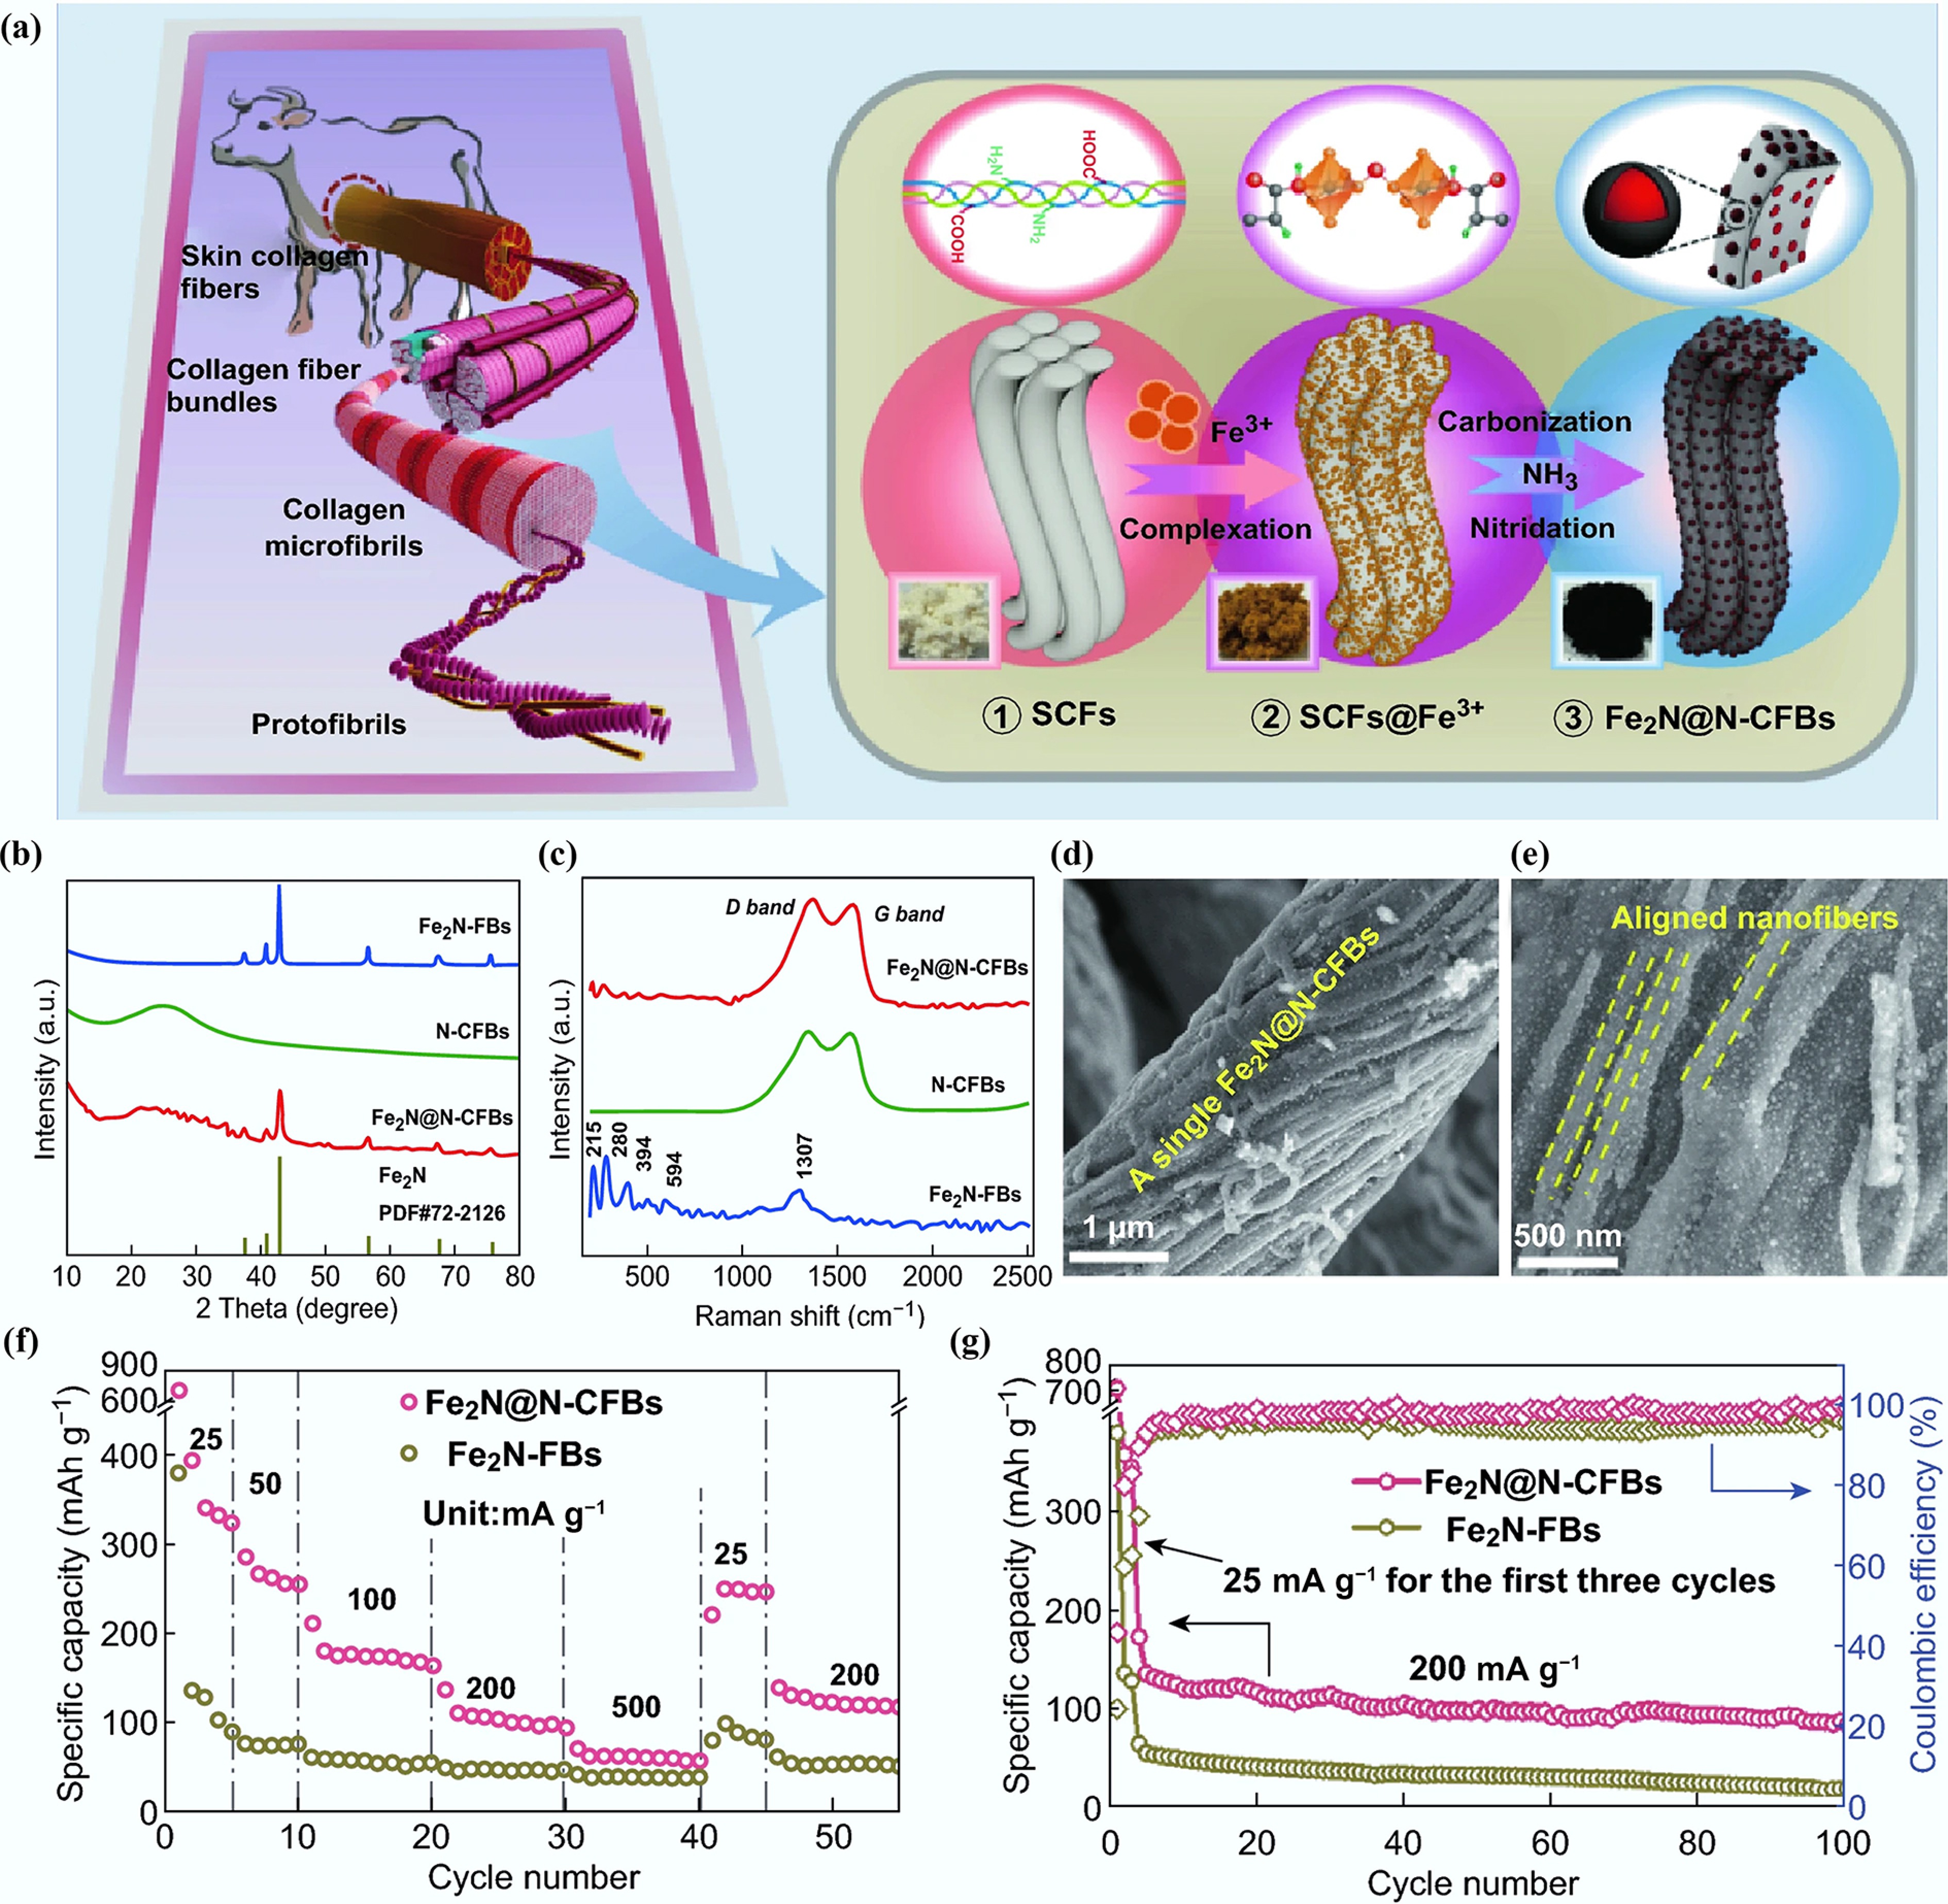
Figure 10.
(a) Synthetic process from bovine hide to Fe2N@N-CFB. (b) XRD patterns. (c) Raman spectra. (d), (e) SEM images. (f) Rate performance. (g) Cycling performance for 100 cycles at 200 mA g−1. Reproduced with permission[76]. Copyright 2019, Springer Nature.
-
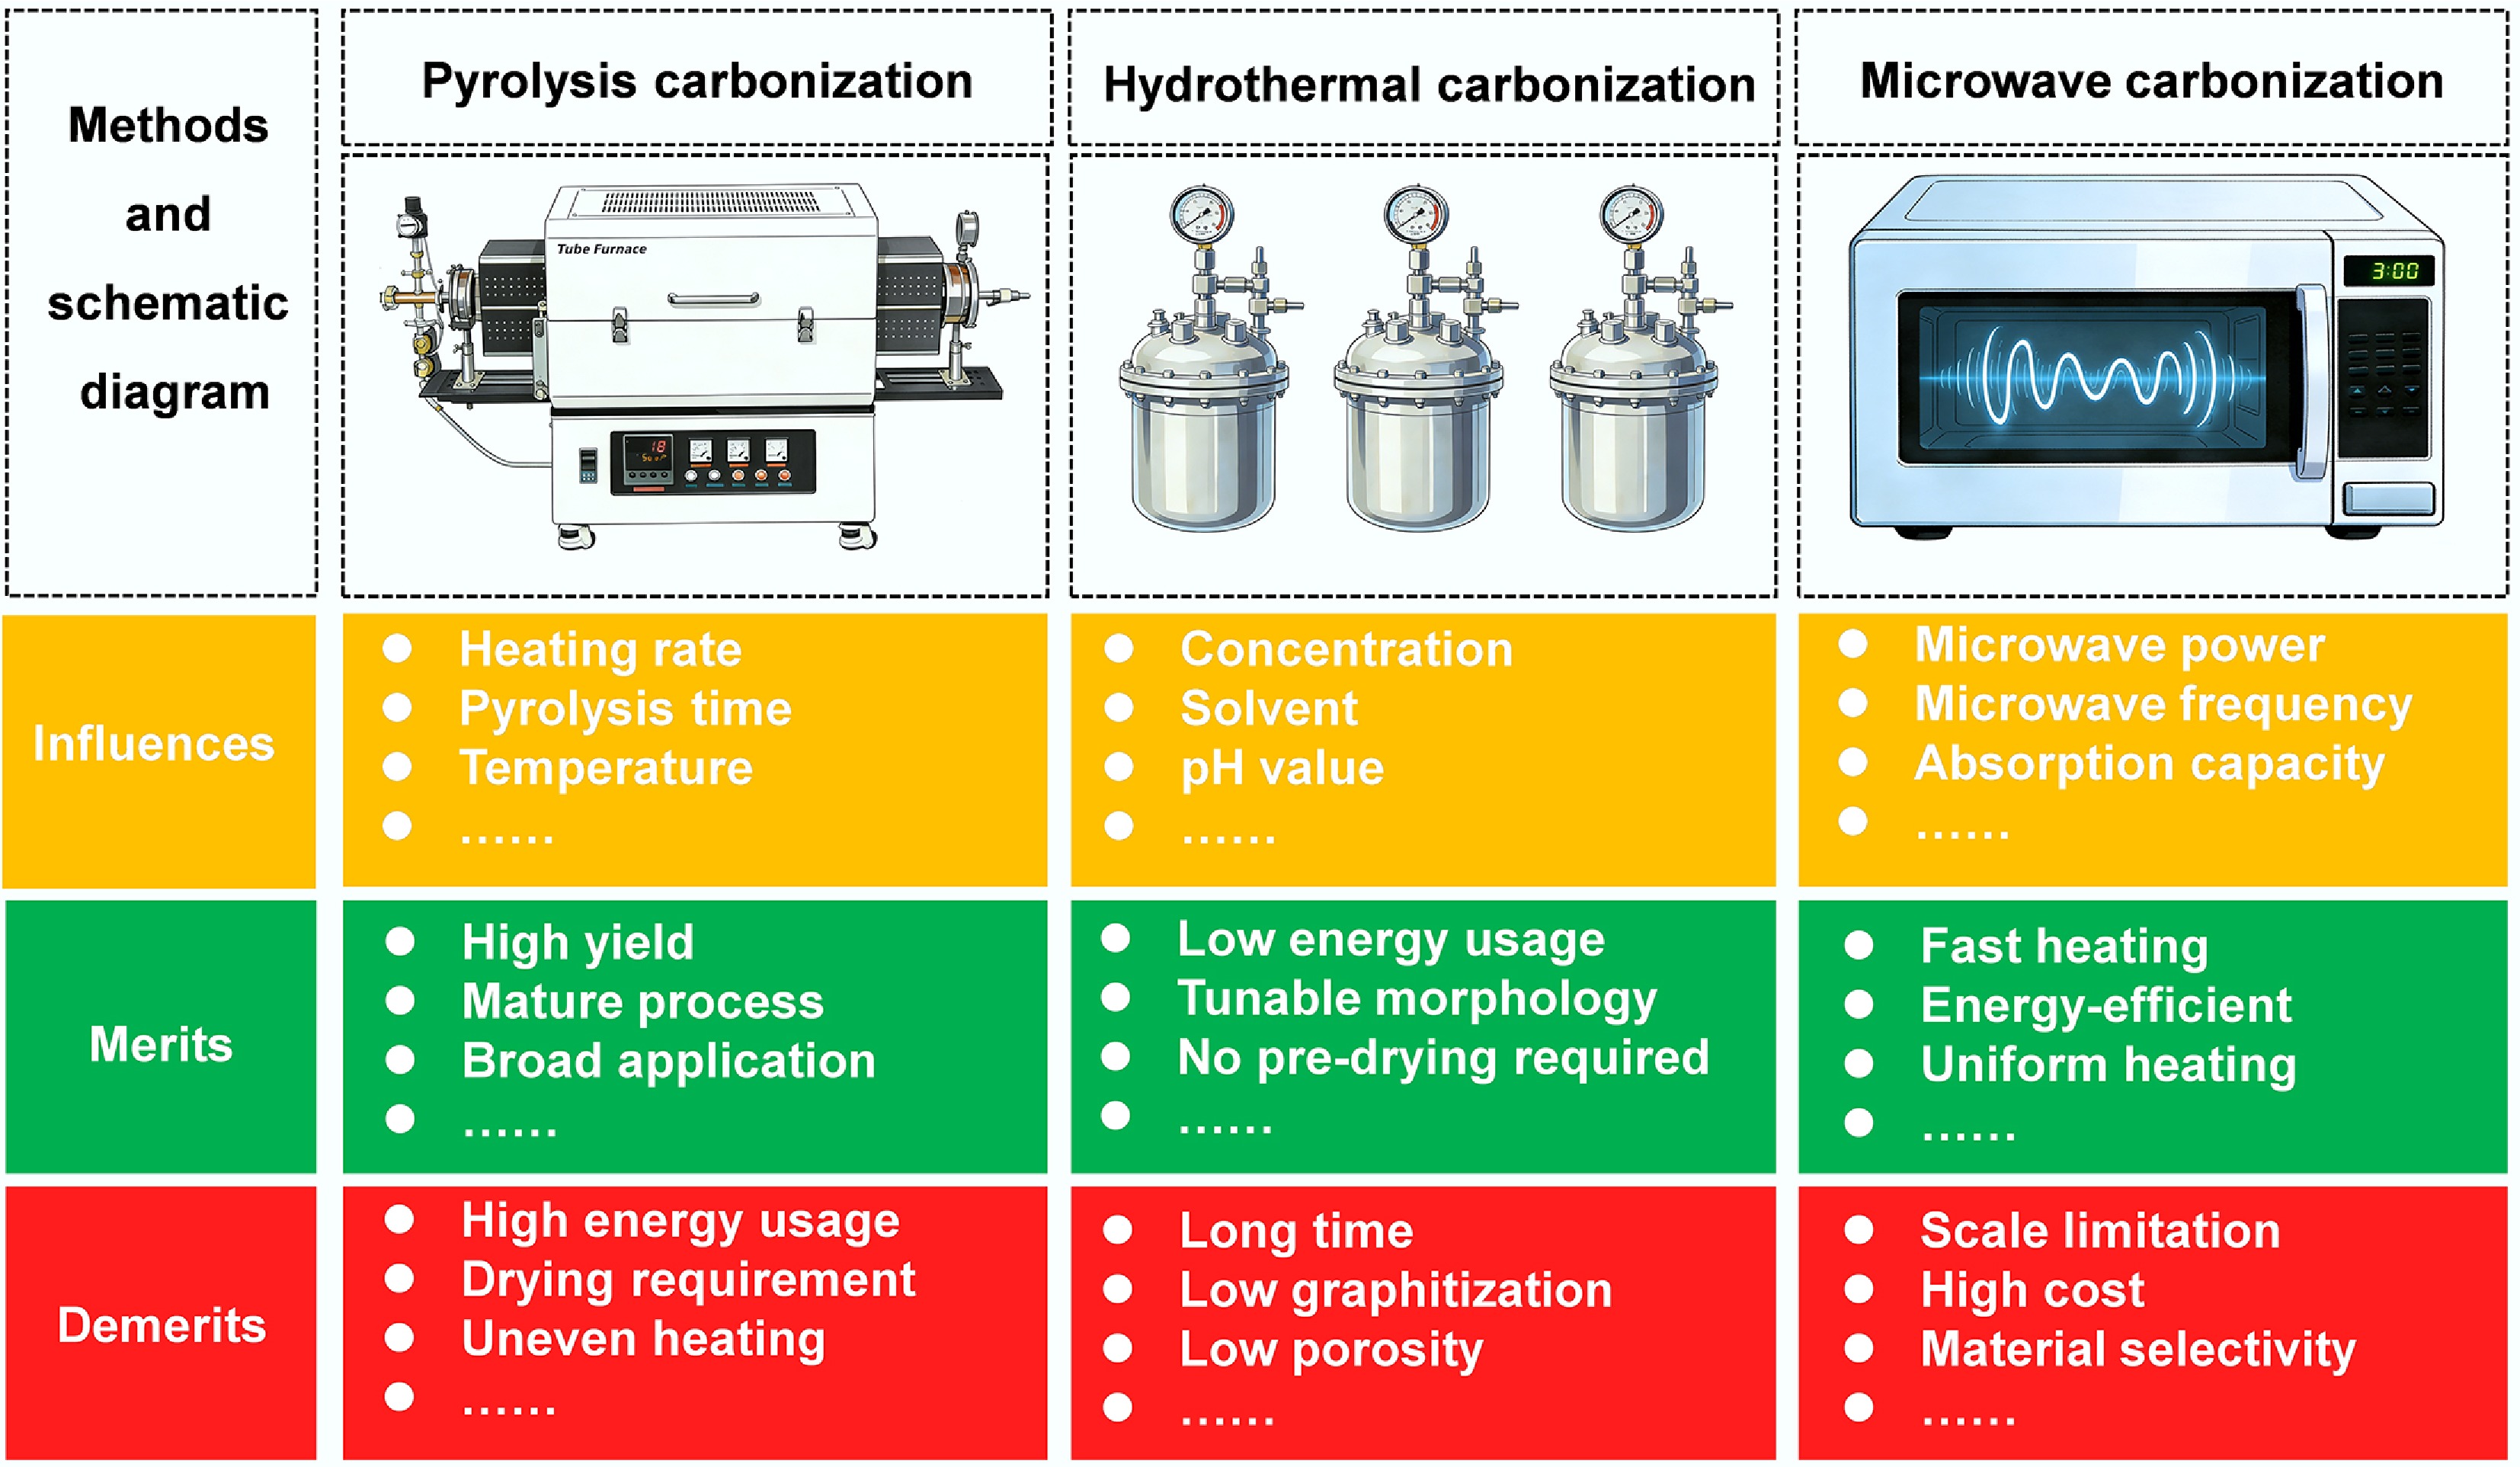
Figure 11.
Main carbonization methods, their influencing factors, merits, and demerits.
-
Physical/chemical properties Lithium (Li) Sodium (Na) Potassium (K) Abundance in earth crust (wt.%)[8] 0.0017 2.3 1.5 Cost of carbonate (US ${\$} $ 6,500 200 1,000 Cost of metals (US ${\$} $ 100,000 3,000 13,000 Desolvation energy in ethylene carbonate
(KJ mol−1)[10]208.9 152.8 114.6 Stokes radii in propylene carbonate (Å)[11] 4.8 4.6 3.6 Stokes radii in water (Å)[11] 2.38 1.84 1.25 Voltage vs SHE (V)[12] −3.04 −2.71 −2.92 Conductivity of 1M Li/Na/KFSI in ethylene carbonate/diethyl carbonate (mS cm−1)[11] 9.3 9.7 10.7 Density (g cm−3)[13] 0.535 0.968 0.856 Ionic radius (Å)[14] 0.68 0.97 1.38 Table 1.
Physicochemical properties and abundance of lithium, sodium, and potassium
Figures
(11)
Tables
(1)