-
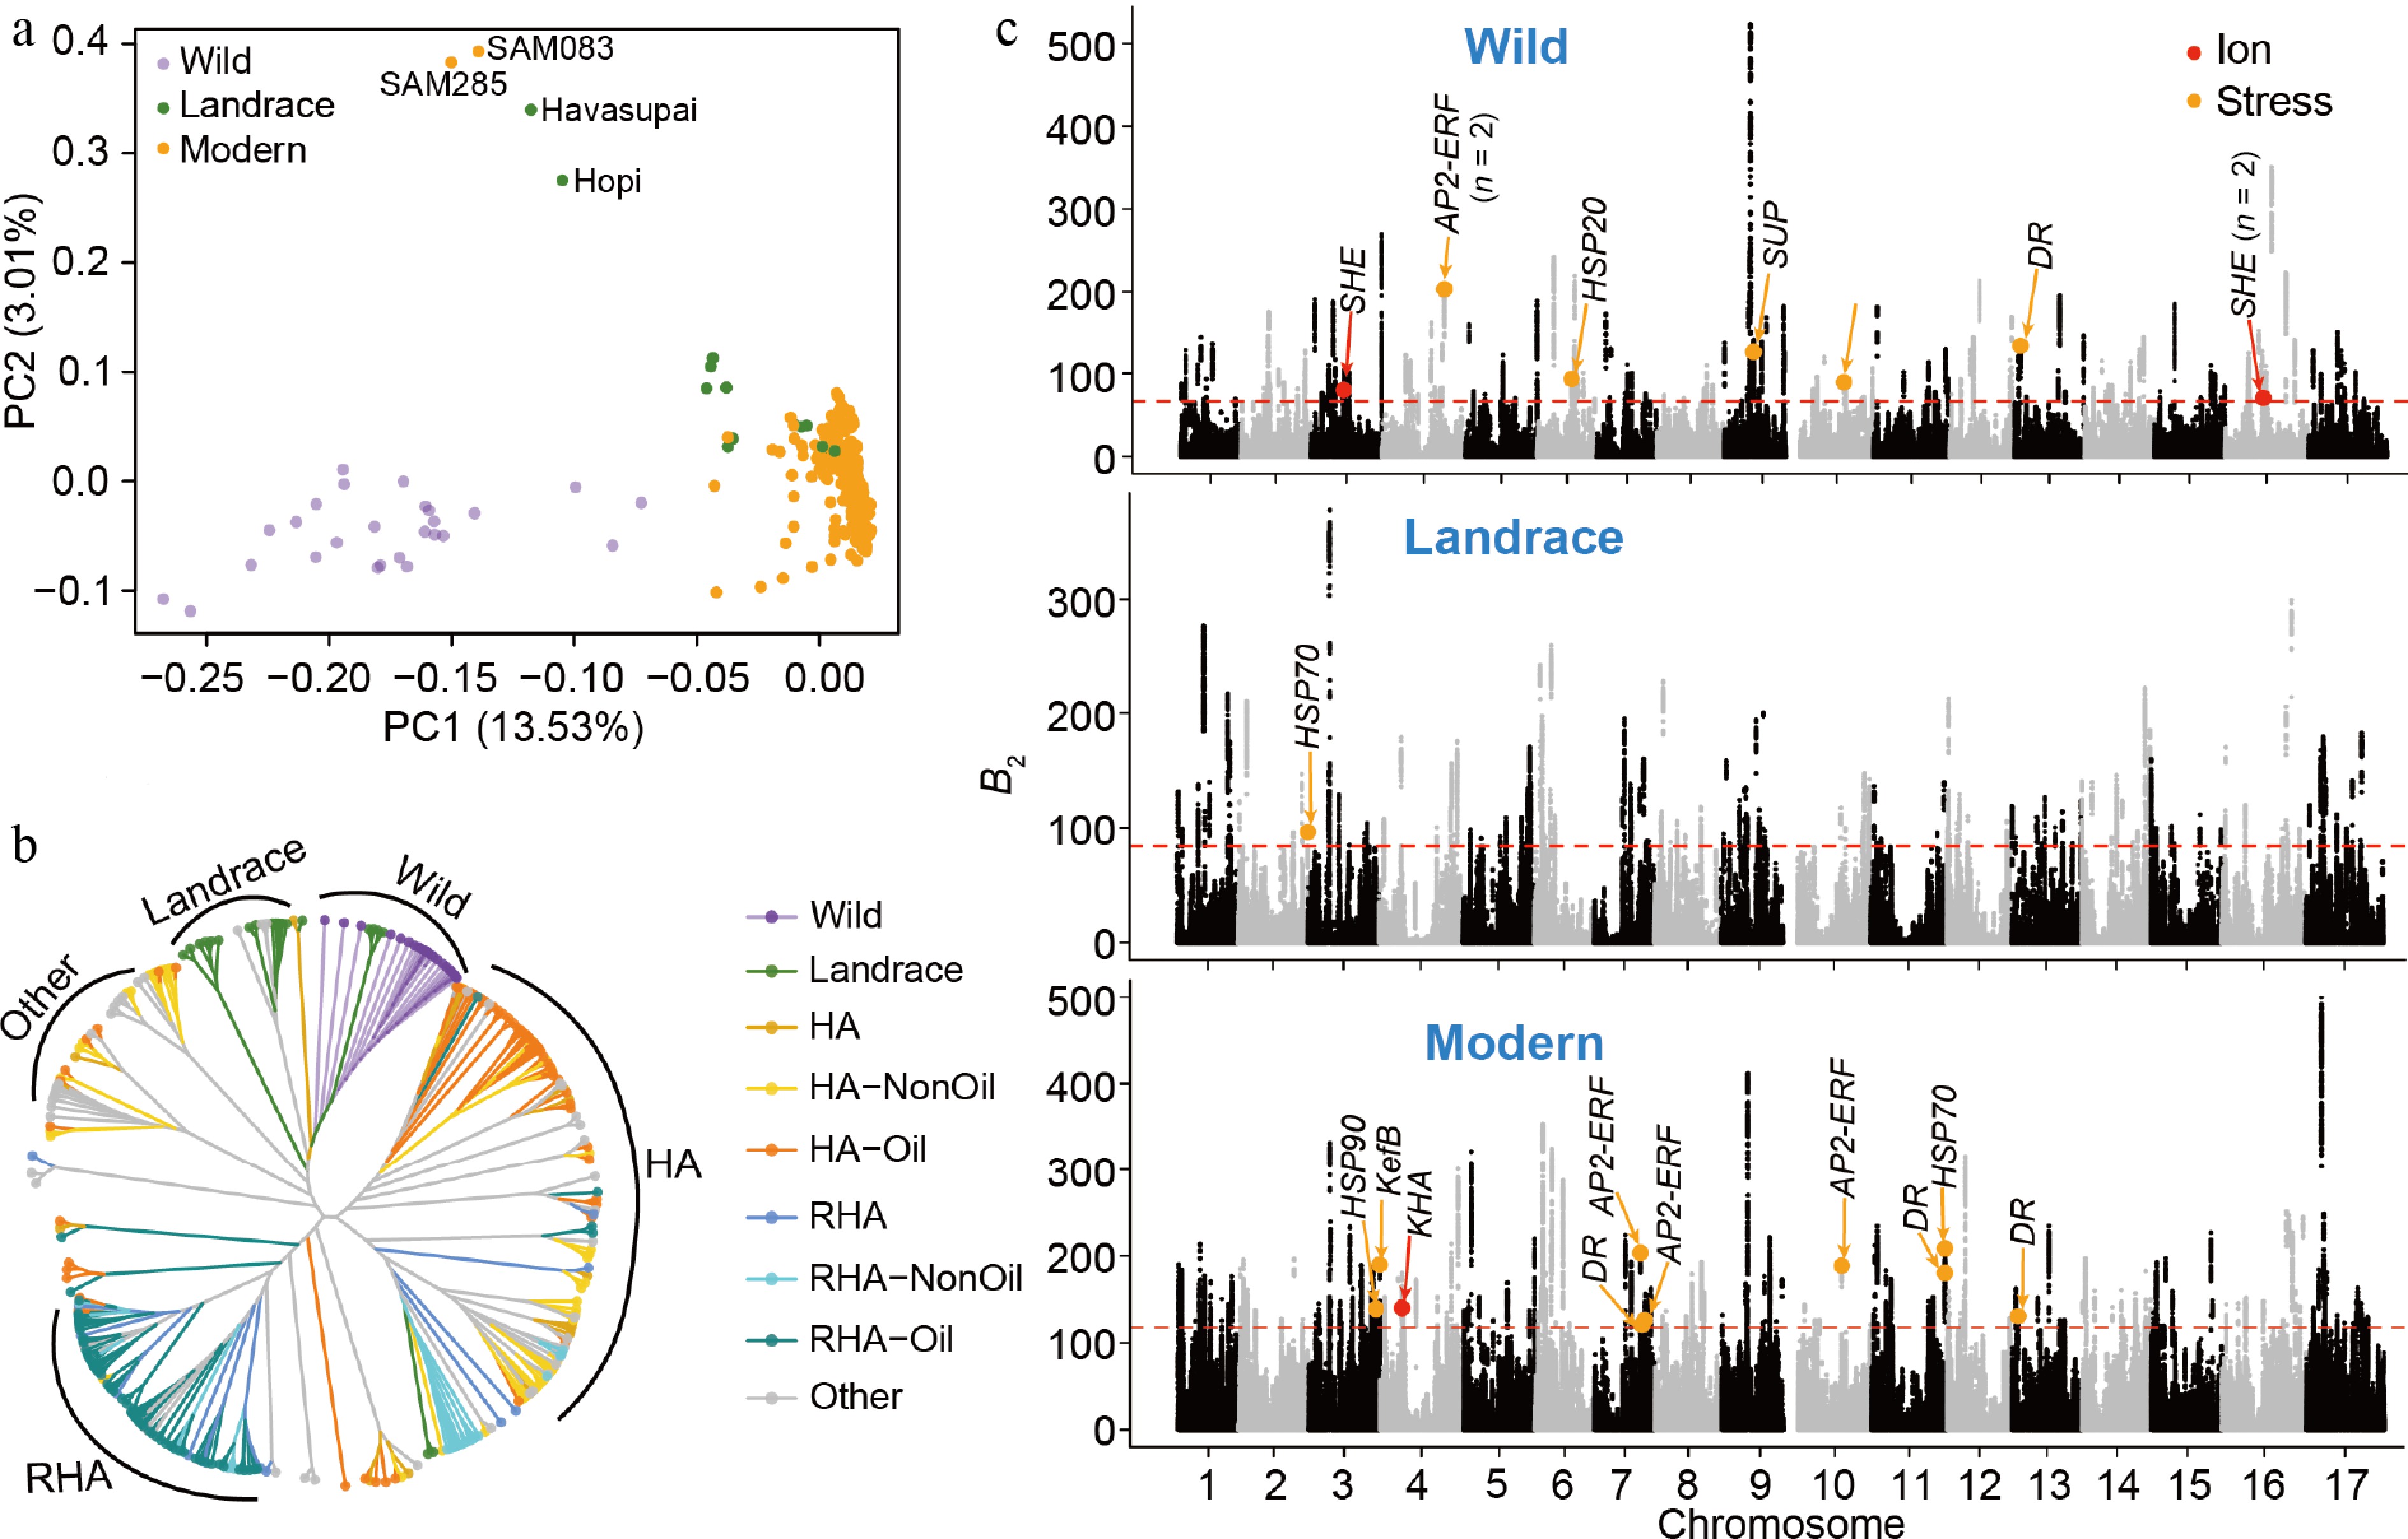
Figure 1.
Genomic regions under balancing selection and their relationship with salt-stress-responsive loci in sunflower. (a) Principal component analysis (PCA) of the 332 accessions showed clear population differentiation among wild, landrace, and modern accessions. (b) Neighbor-joining phylogenetic tree of the modern accessions constructed from genome-wide SNPs. Colors represent different groups according to the previous study[23]. HA and RHA represent female and male lines, respectively. 'Other' represents accessions that do not belong to the defined HA or RHA groups. (c) Genome-wide balancing selection signals in each population, with colored dots indicating candidate genes involved in ion transport (red) and stress-responsive pathways (orange). The red horizontal dashed lines represent the significance level of the top 1%. SHE, sodium hydrogen exchanger; AP2-EREBP, ethylene-responsive transcription factor; HSP, heat shock protein; SUP, stress upregulated; DR, disease resistance; KefB, potassium-efflux system protein; HKA, putative potassium channel.
-
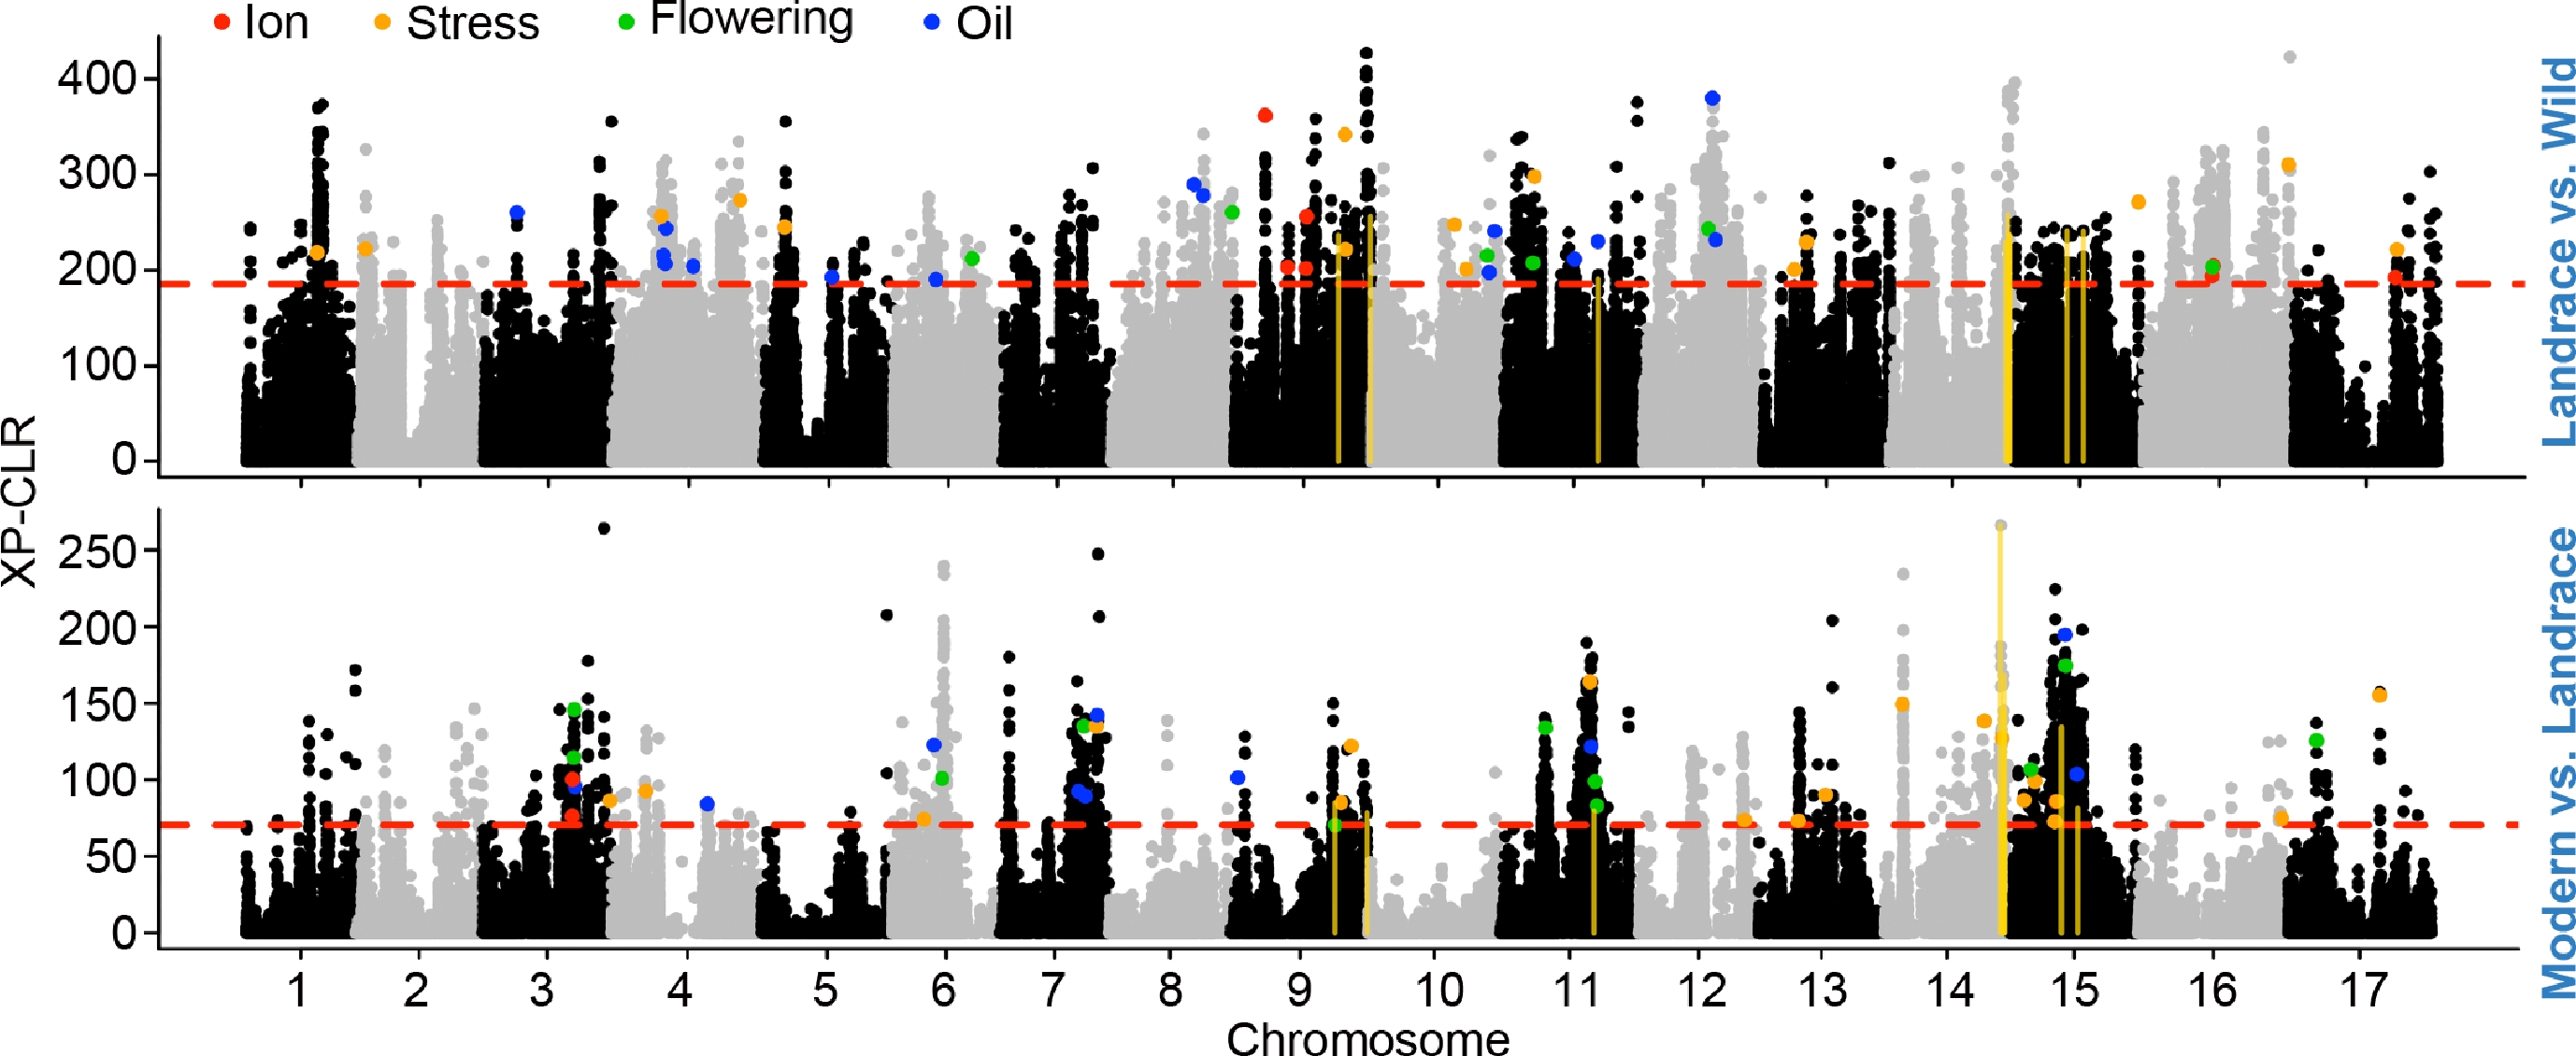
Figure 2.
Genomic regions under positive selection during sunflower domestication and improvement. Genome-wide XP-CLR analysis was performed to detect genomic regions under differential selection between landraces and wild accessions (top), and between modern cultivars and landraces (bottom). The red dashed line indicates the top 1% threshold used to define candidate selective sweep regions. Colored points indicate windows overlapping annotated genes, which are further categorized based on their putative biological functions: ion transport (red), stress response (orange), flowering regulation (green), and oil biosynthesis (blue). The gold vertical lines indicate the overlapped domestication and improvement sweeps.
-
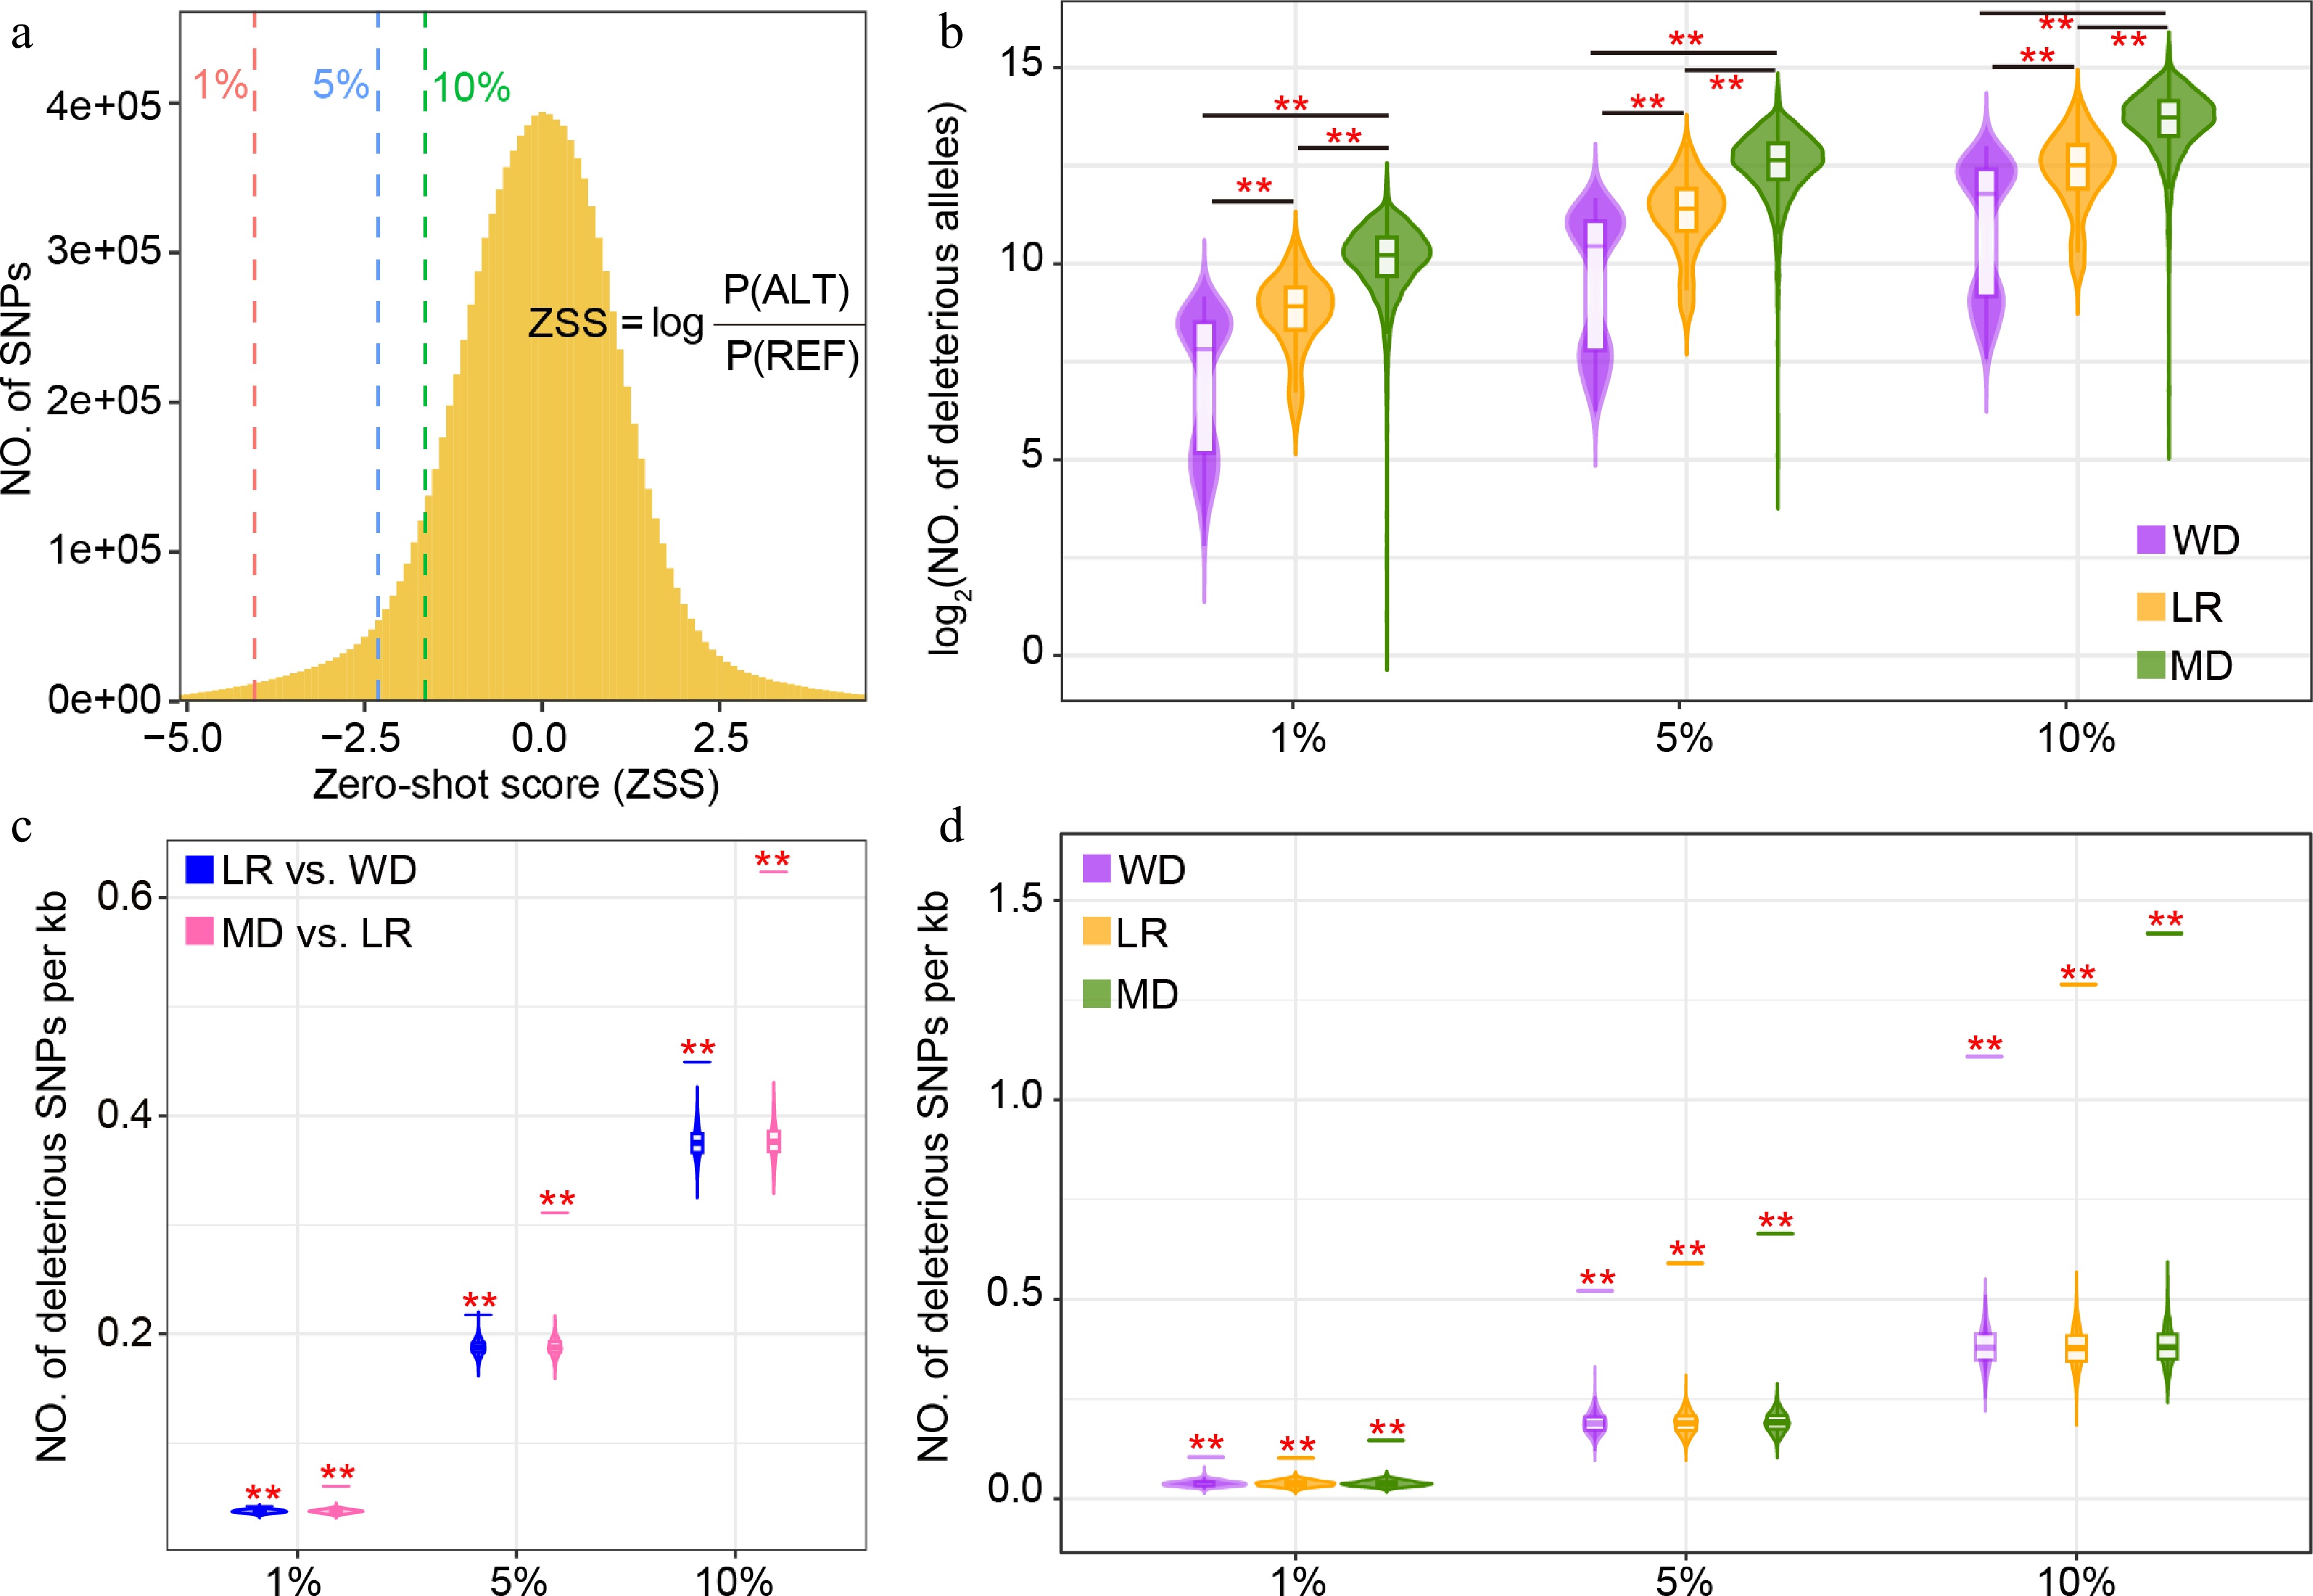
Figure 3.
Identification of deleterious mutations in sunflower. (a) Zero-shot score (ZSS) distribution of 11.3 million SNPs in the sunflower population. The 1%, 5%, and 10% cutoffs indicate increasingly relaxed deleteriousness thresholds, with 1% representing the most deleterious variants. (b) Distribution of deleterious score (sum of ZSS) across wild (WD), landrace (LR), and modern (MD) accessions under the three deleteriousness thresholds (1%, 5%, and 10%). Deleterious mutations located within regions under (c) positive, and (d) balancing selection. Violin plots show the distribution generated from 1,000 randomly selected genomic regions, and short horizontal lines indicate the observed values. Asterisks denote significance from permutation tests (** p ≤ 0.01).
-
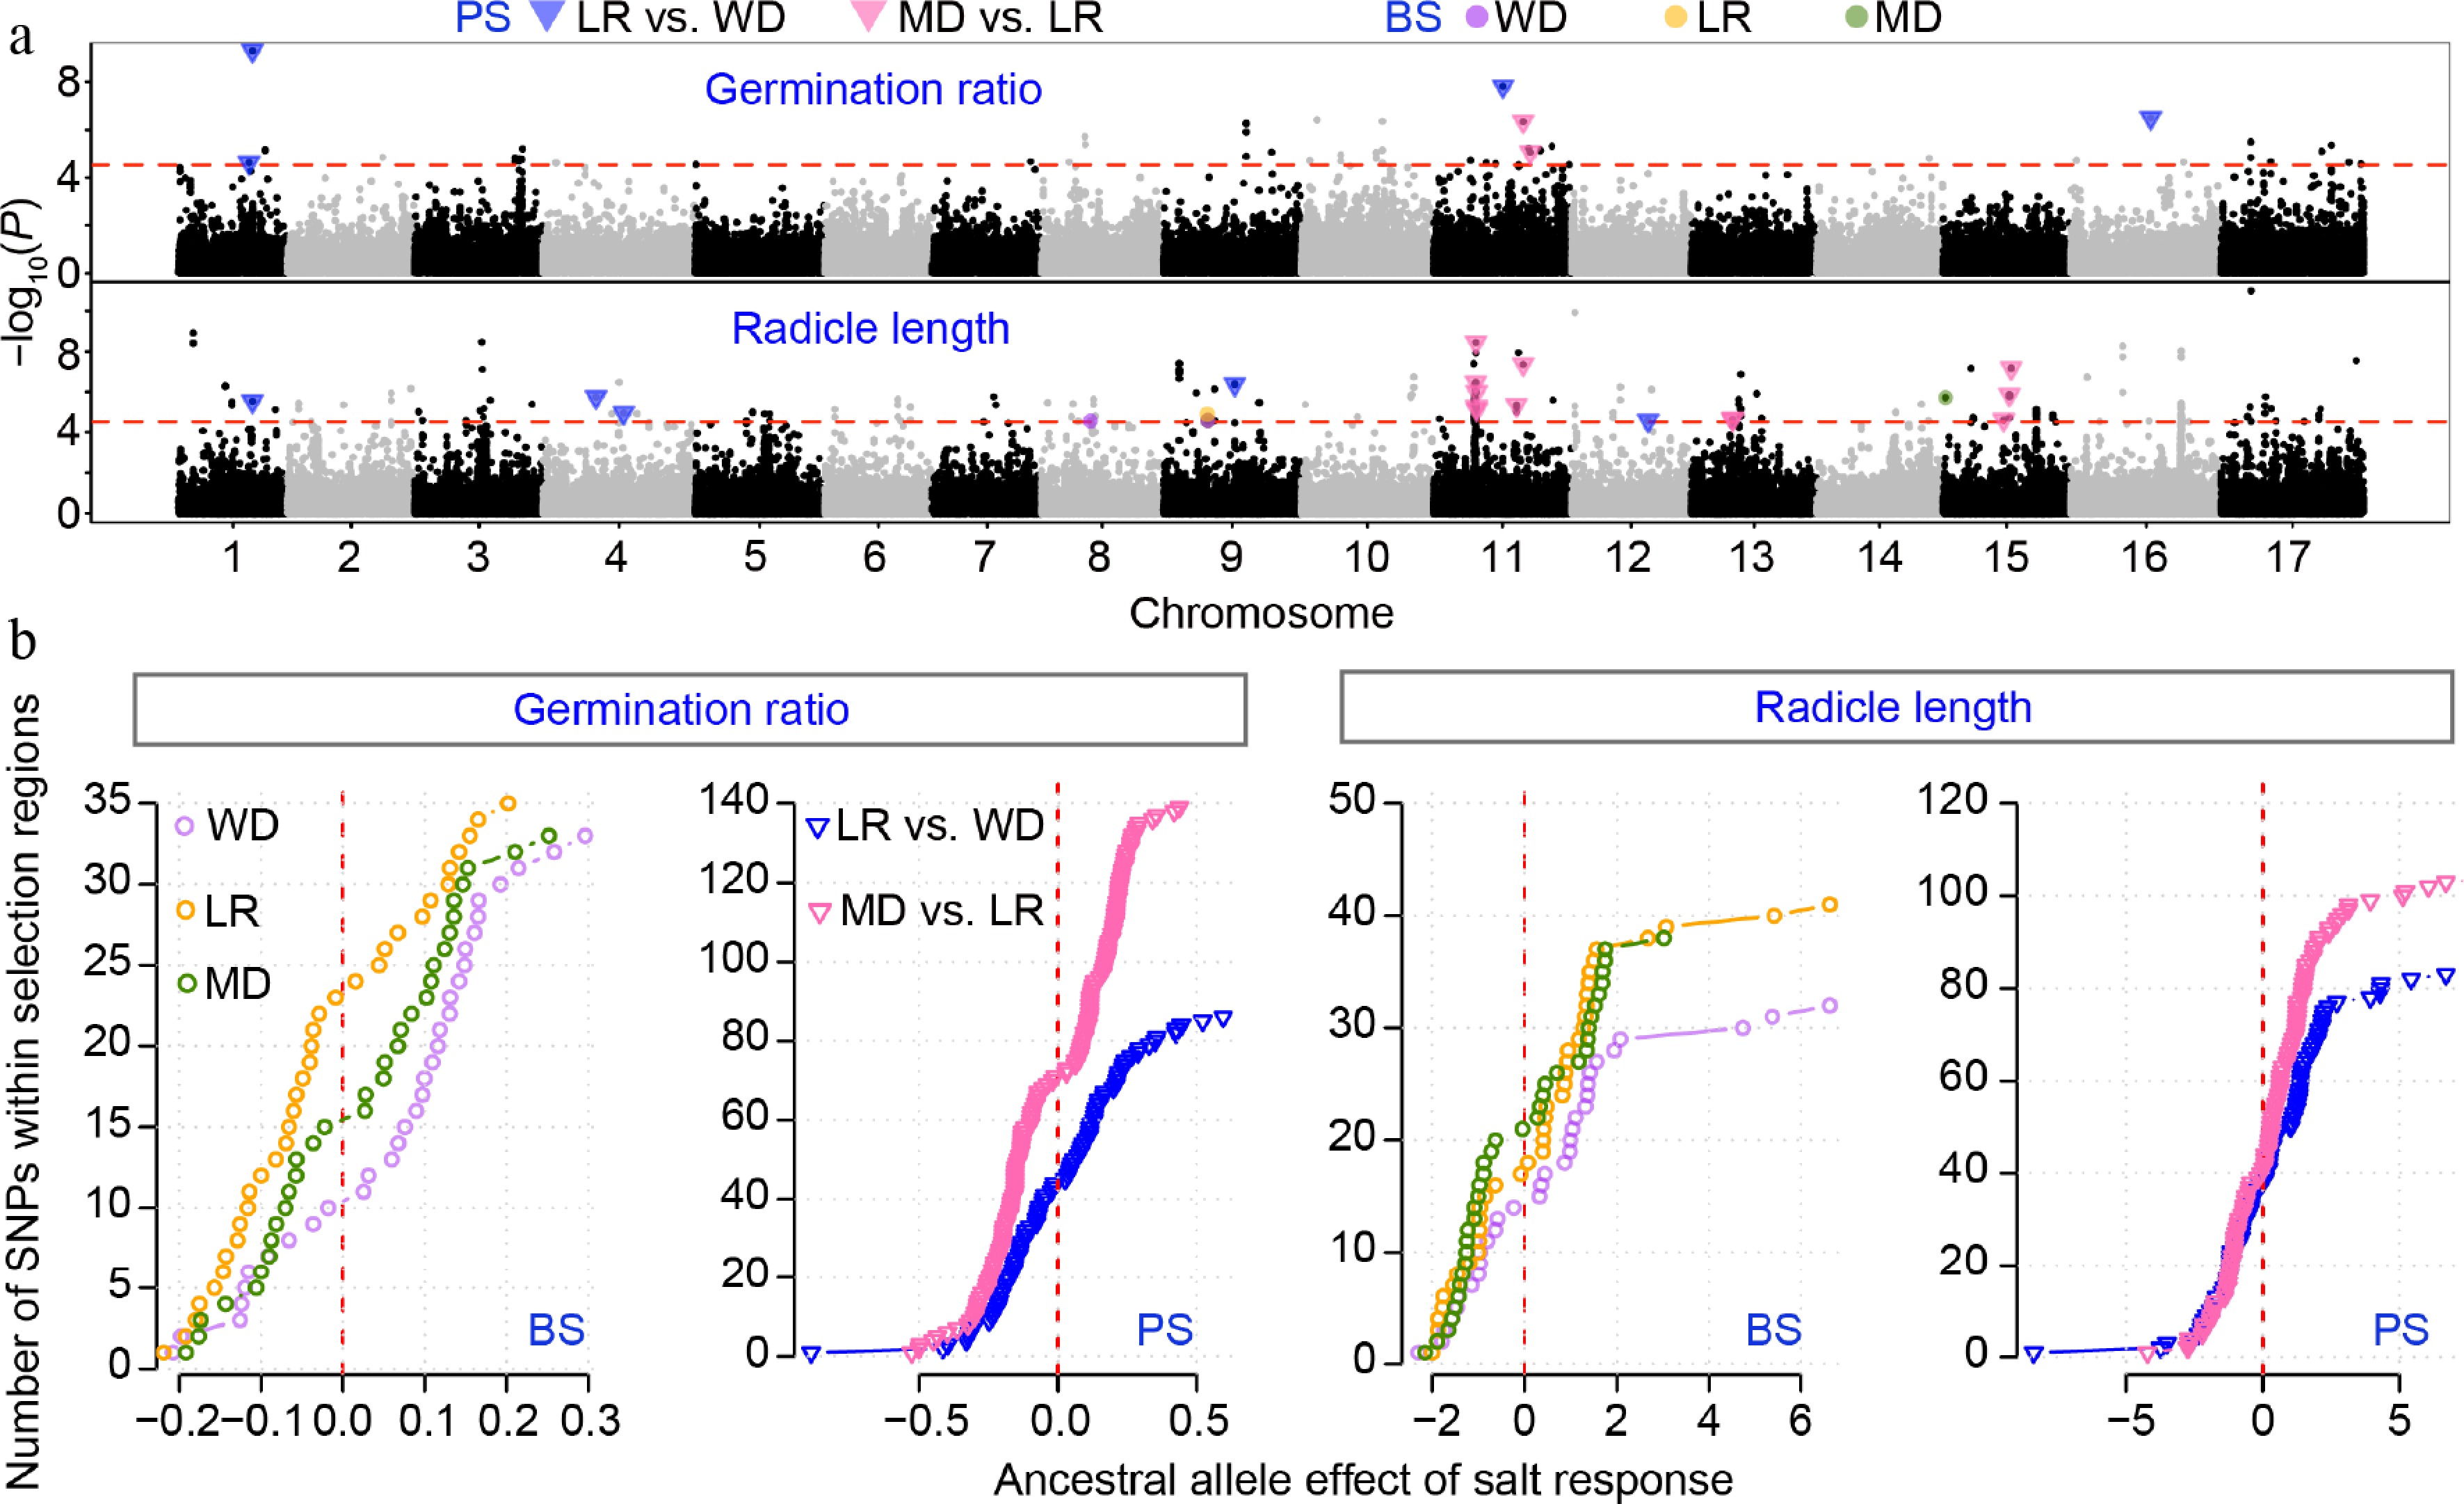
Figure 4.
GWAS results for salt-responsive traits of germination ratio and radicle length. (a) Stacked Manhattan plots for salt-responsive (SR) traits. The red horizontal dashed line denotes the genome-wide significance threshold. Colored points and triangles indicate significant SNPs that overlap with regions under balancing selection (BS) or positive selection (PS). (b) Effects of the ancestral allele for SNPs located within BS or PS regions. Trait responsive values are shown across wild (WD), landrace (LR), and modern (MD) accessions.
Figures
(4)
Tables
(0)