-
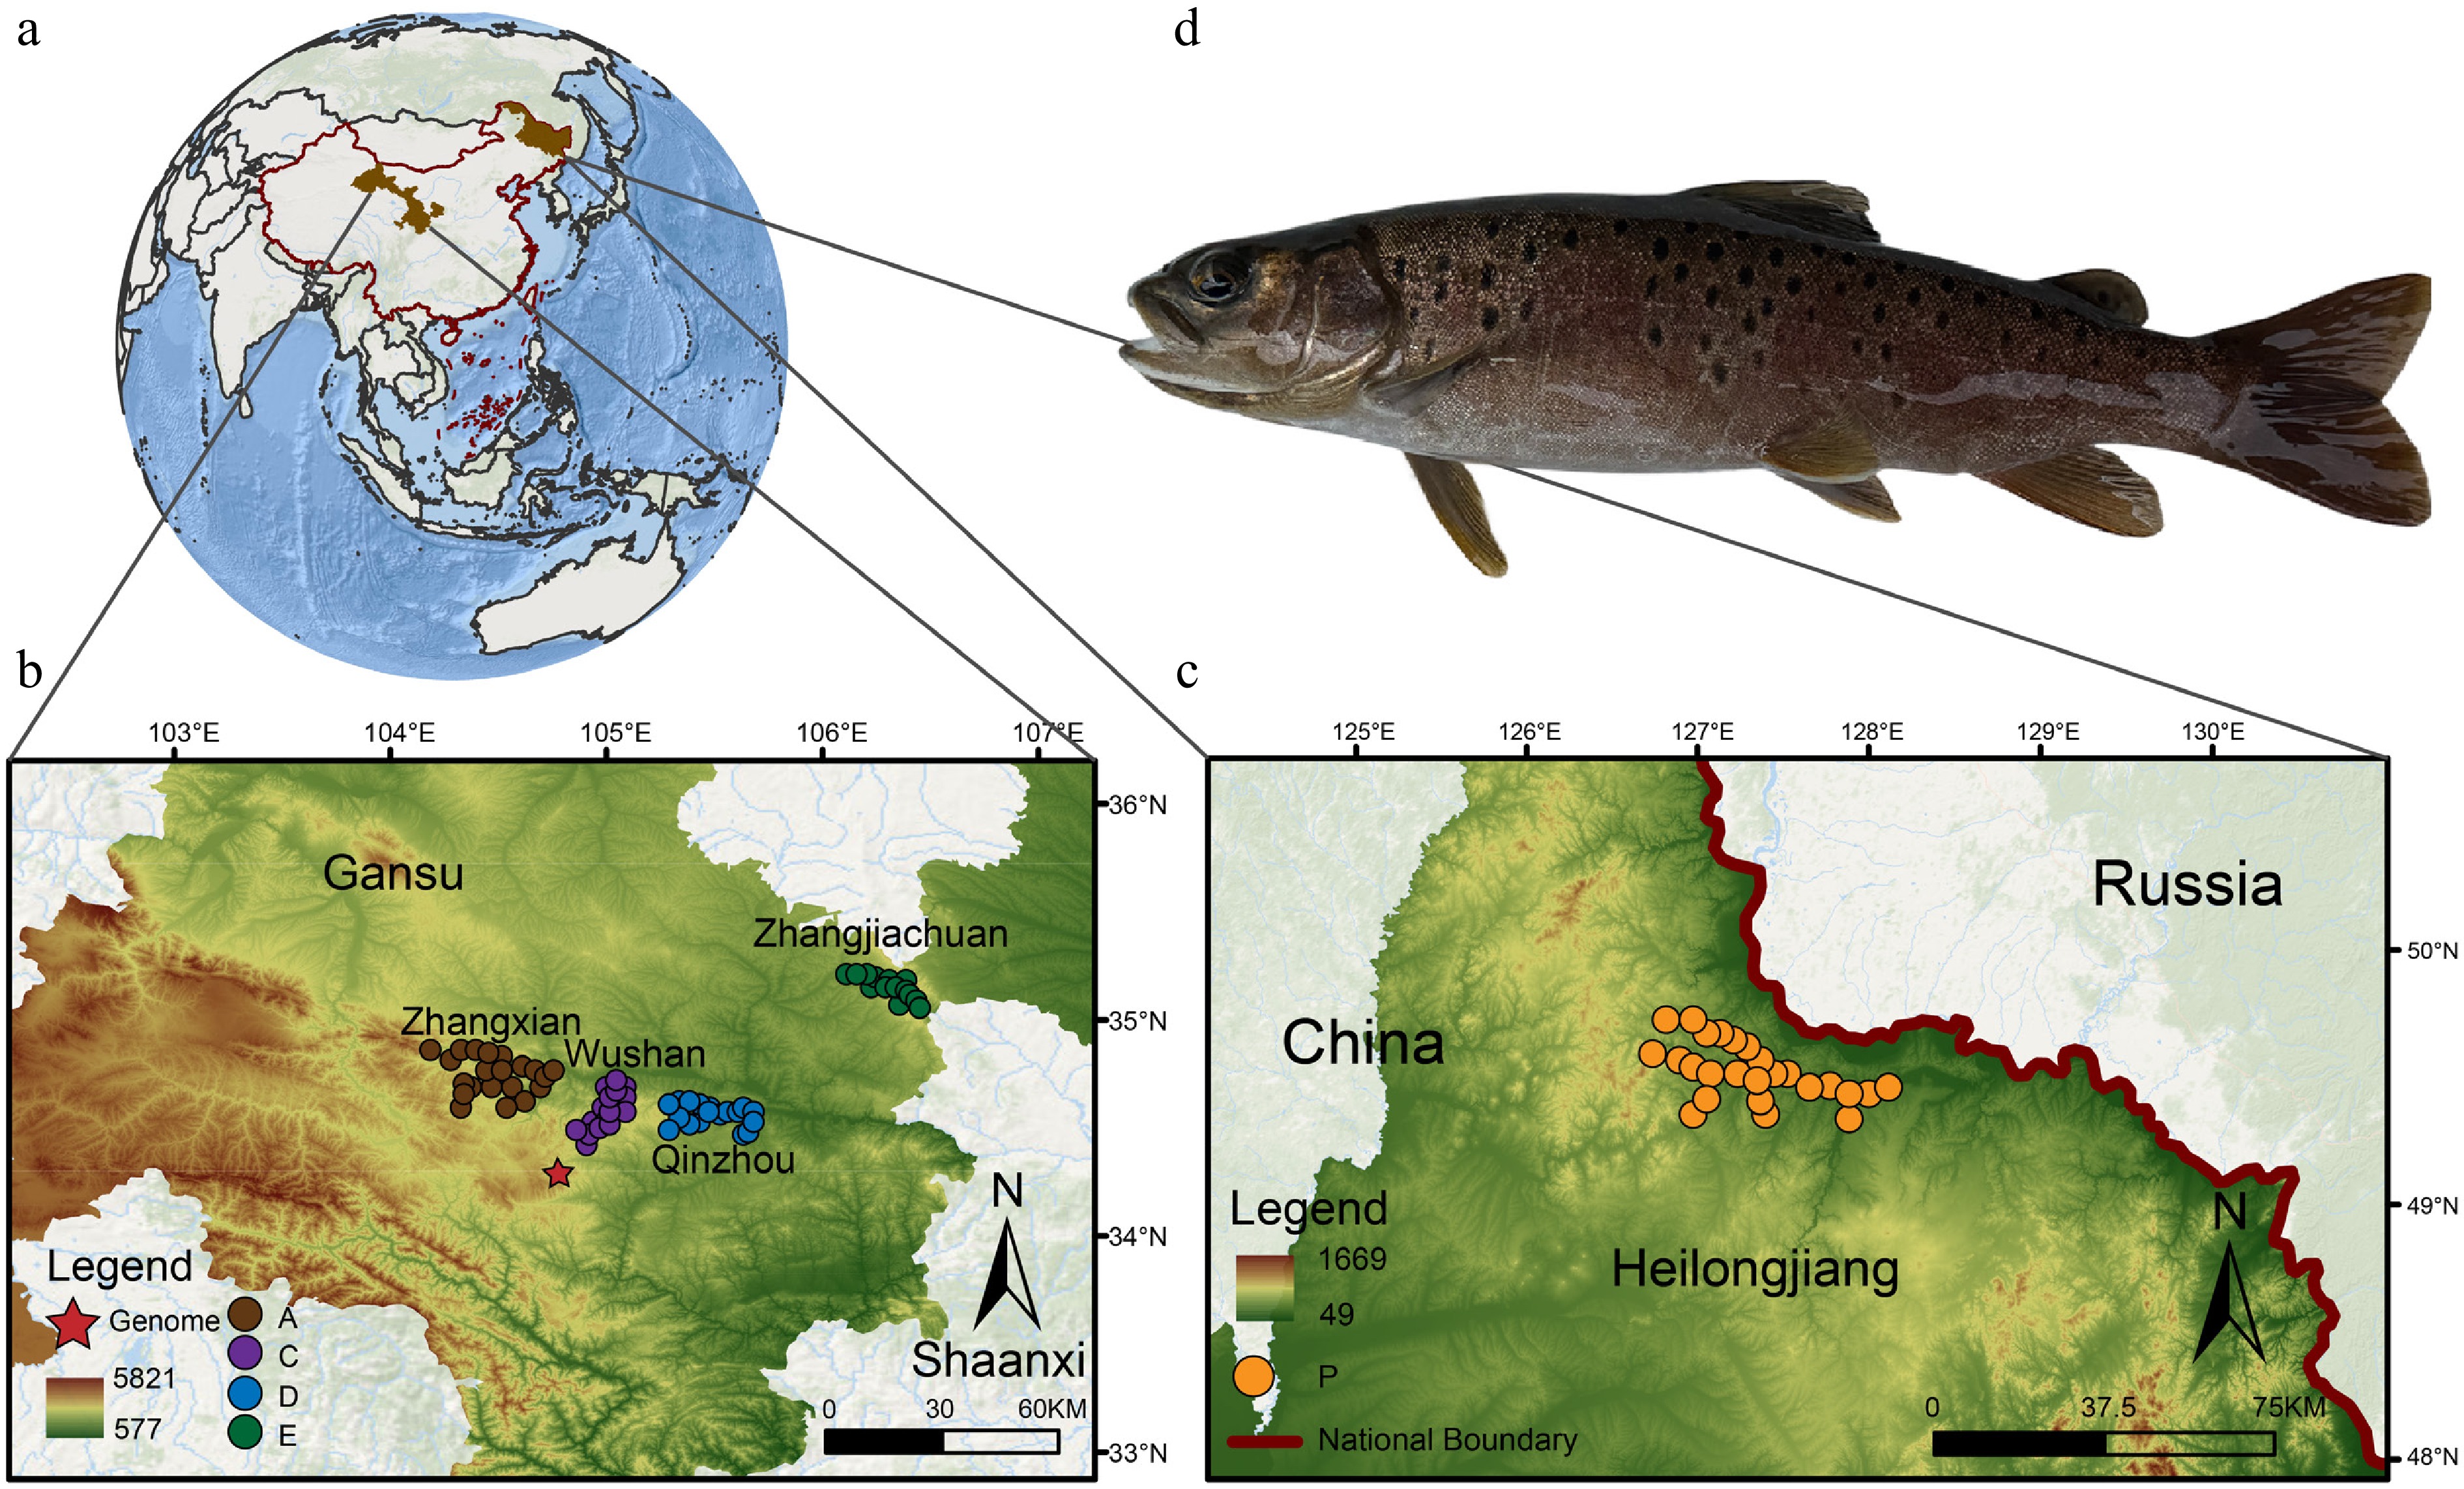
Figure 1.
Geographical distribution of Brachymystax lenok tsinlingensis. A total of 124 individuals were collected from five representative geographic populations of B. lenok tsinlingensis across its distribution range in China: Zhangxian (population A), Wushan (population C), Qinzhou (population D), Zhangjiachuan (population E), and Xunke-Sunwu (population P). (a) Geographical location of the sampling sites. (b) Locations of sampling sites for populations A, C, D, and E. (c) Locations of sampling sites for population P. (d) Morphological photos of B. lenok tsinlingensis. (Created with ArcMap 10.8; basemap sourced from the Geospatial Data Cloud,
www.gscloud.cn ). -
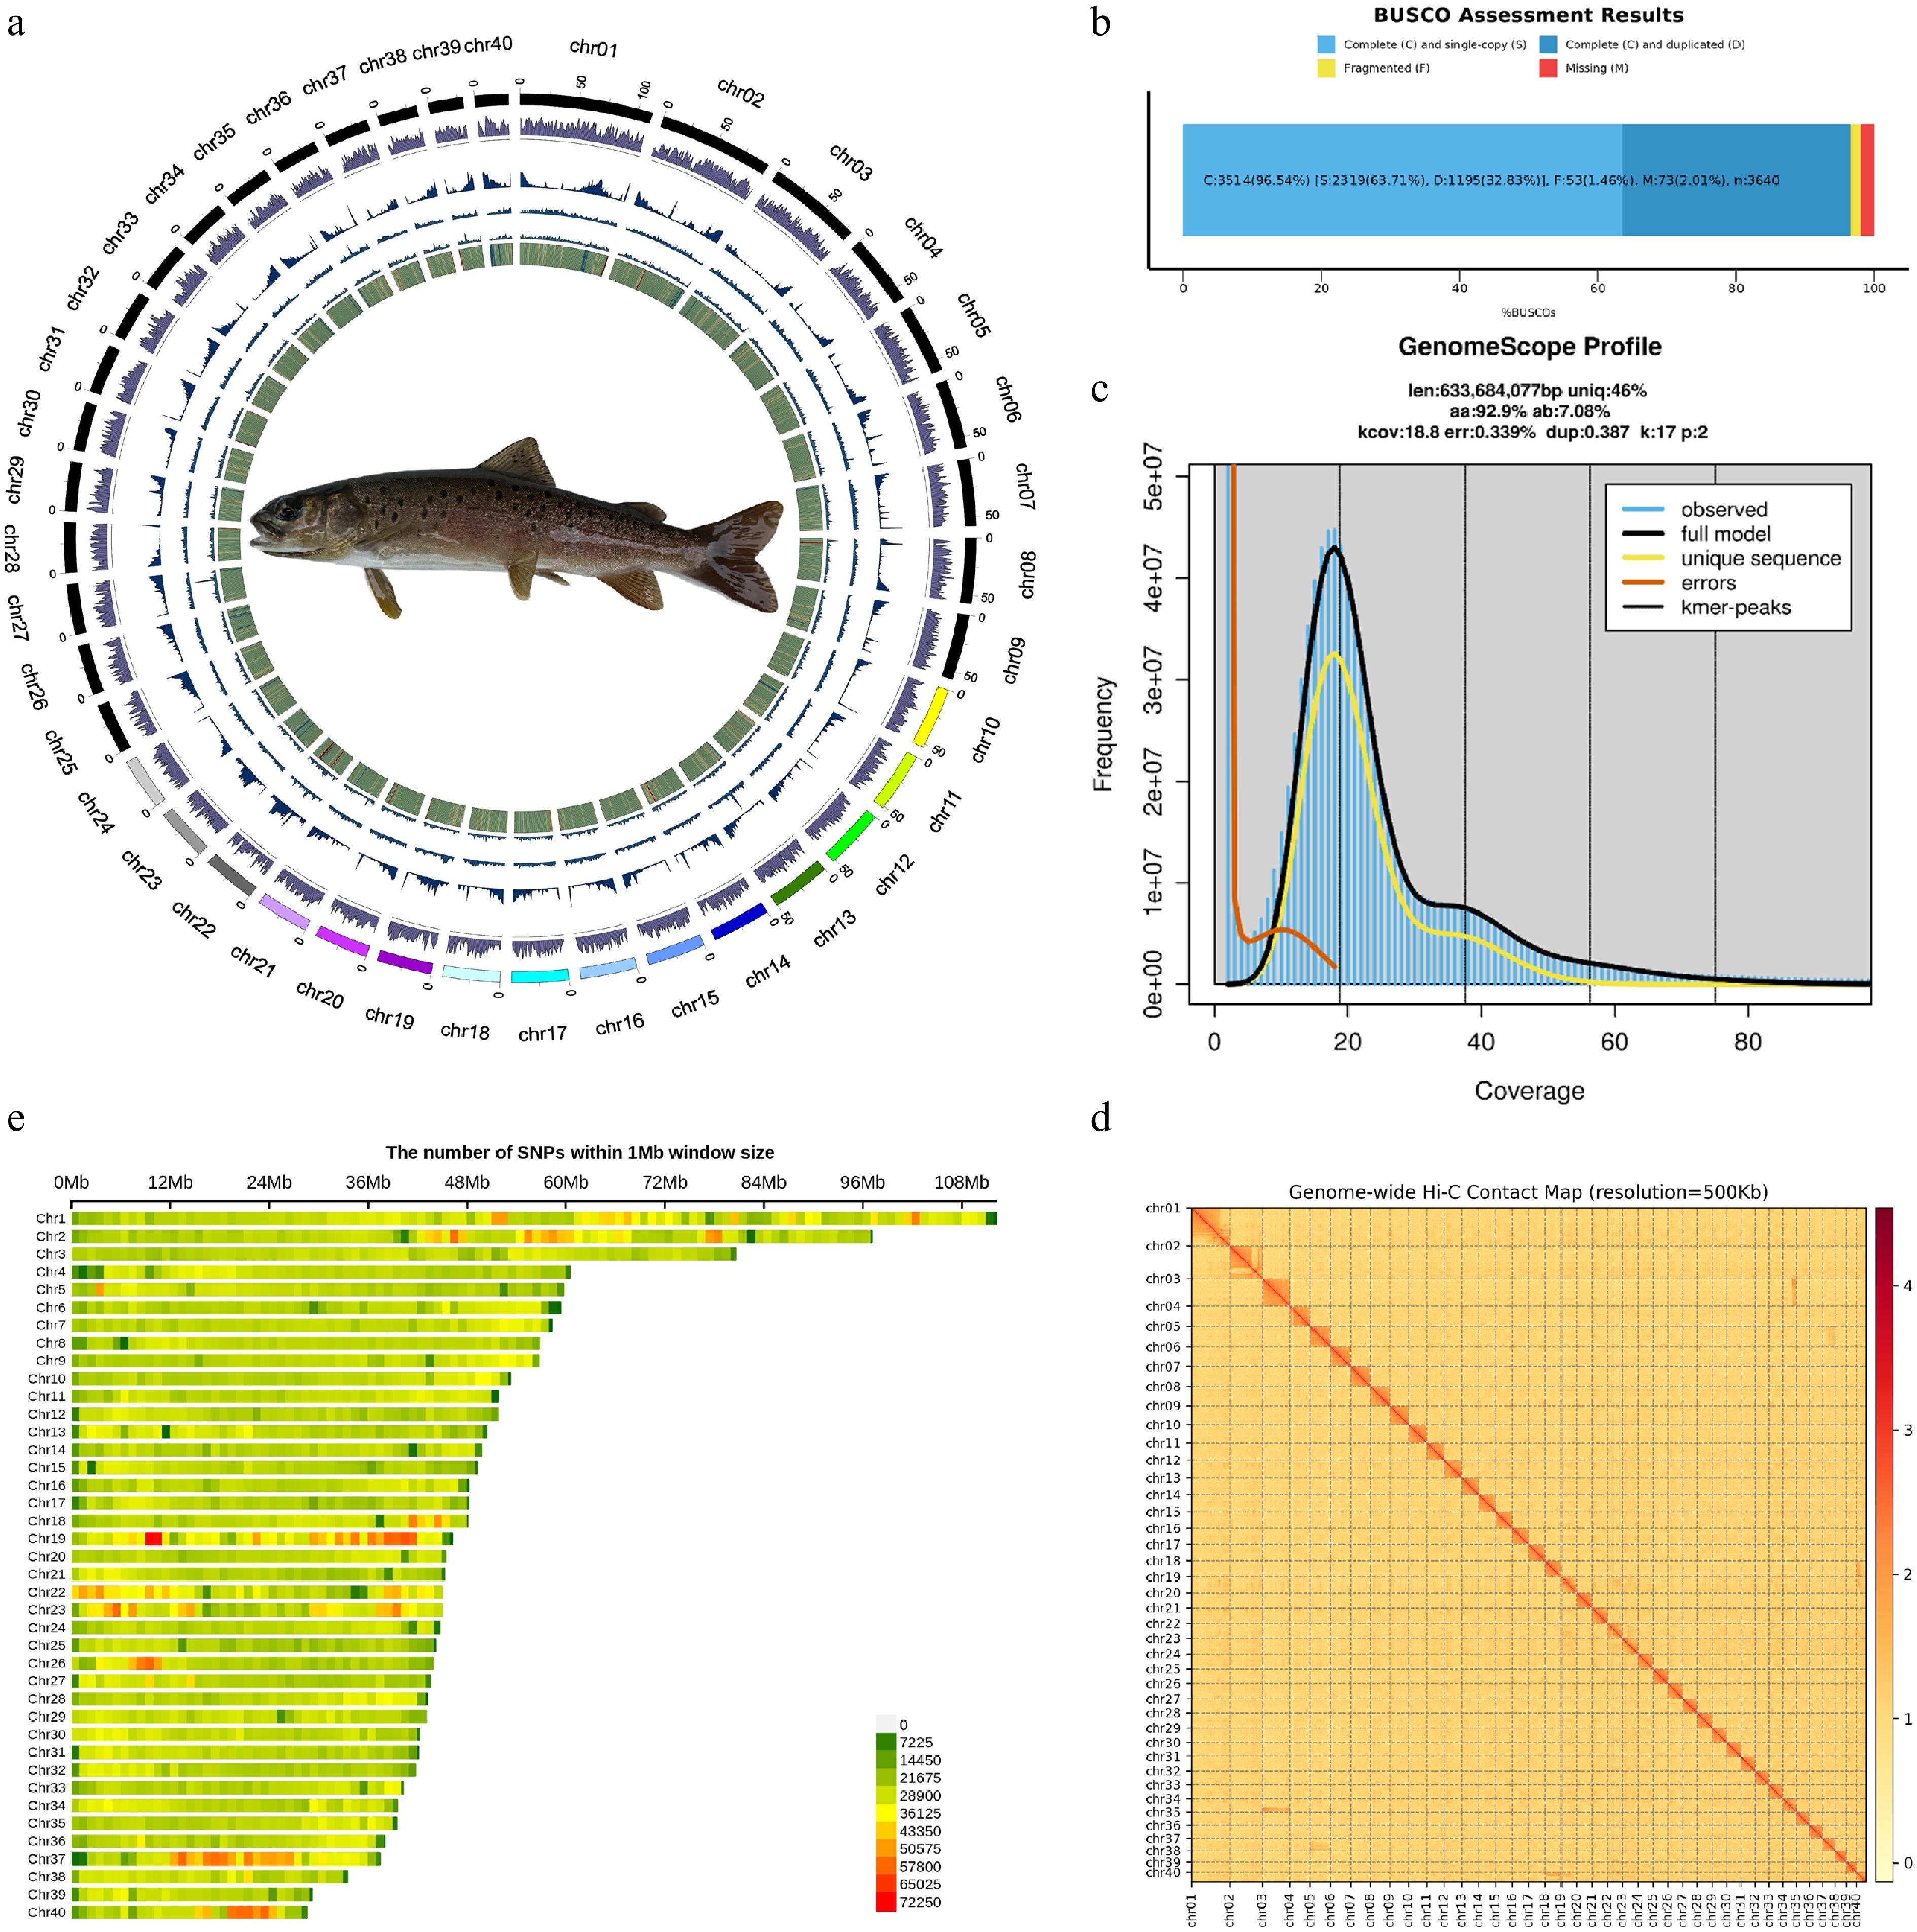
Figure 2.
Genome and SNP landscape of Brachymystax lenok tsinlingensis. (a) Landscape of B. lenok tsinlingensis, from the innermost to the outermost layer, as follows: GC content, Copia TEs, Gypsy TEs, repeat, and gene density. (b) BUSCO assessment of genome assembly completeness. (c) Genome survey of B. lenok tsinlingensis based on K-mer analysis, the genome size was estimated to be 633.68 Mb with a duplication rate of 0.39%. (d) Hi-C contact map revealing extensive hierarchical chromatin interactions in the genome of B. lenok tsinlingensis. (e) Chromosomal distribution of identified single-nucleotide polymorphisms.
-

Figure 3.
Population structure of 124 individuals from five representative geographic populations of Brachymystax lenok tsinlingensis. (a) Phylogenetic tree constructed using whole-genome SNPs from five geographic populations. (b) Principal component analysis of the five geographic populations. (c) Linkage disequilibrium (LD) decay pattern of different groups. (d) Cross-validation error rate value of ADMIXTURE analysis from K = 1 to K = 8 for all B. lenok tsinlingensis. (e) Population structure analysis based on whole-genome SNPs, with K values ranging from 2 to 4.
-
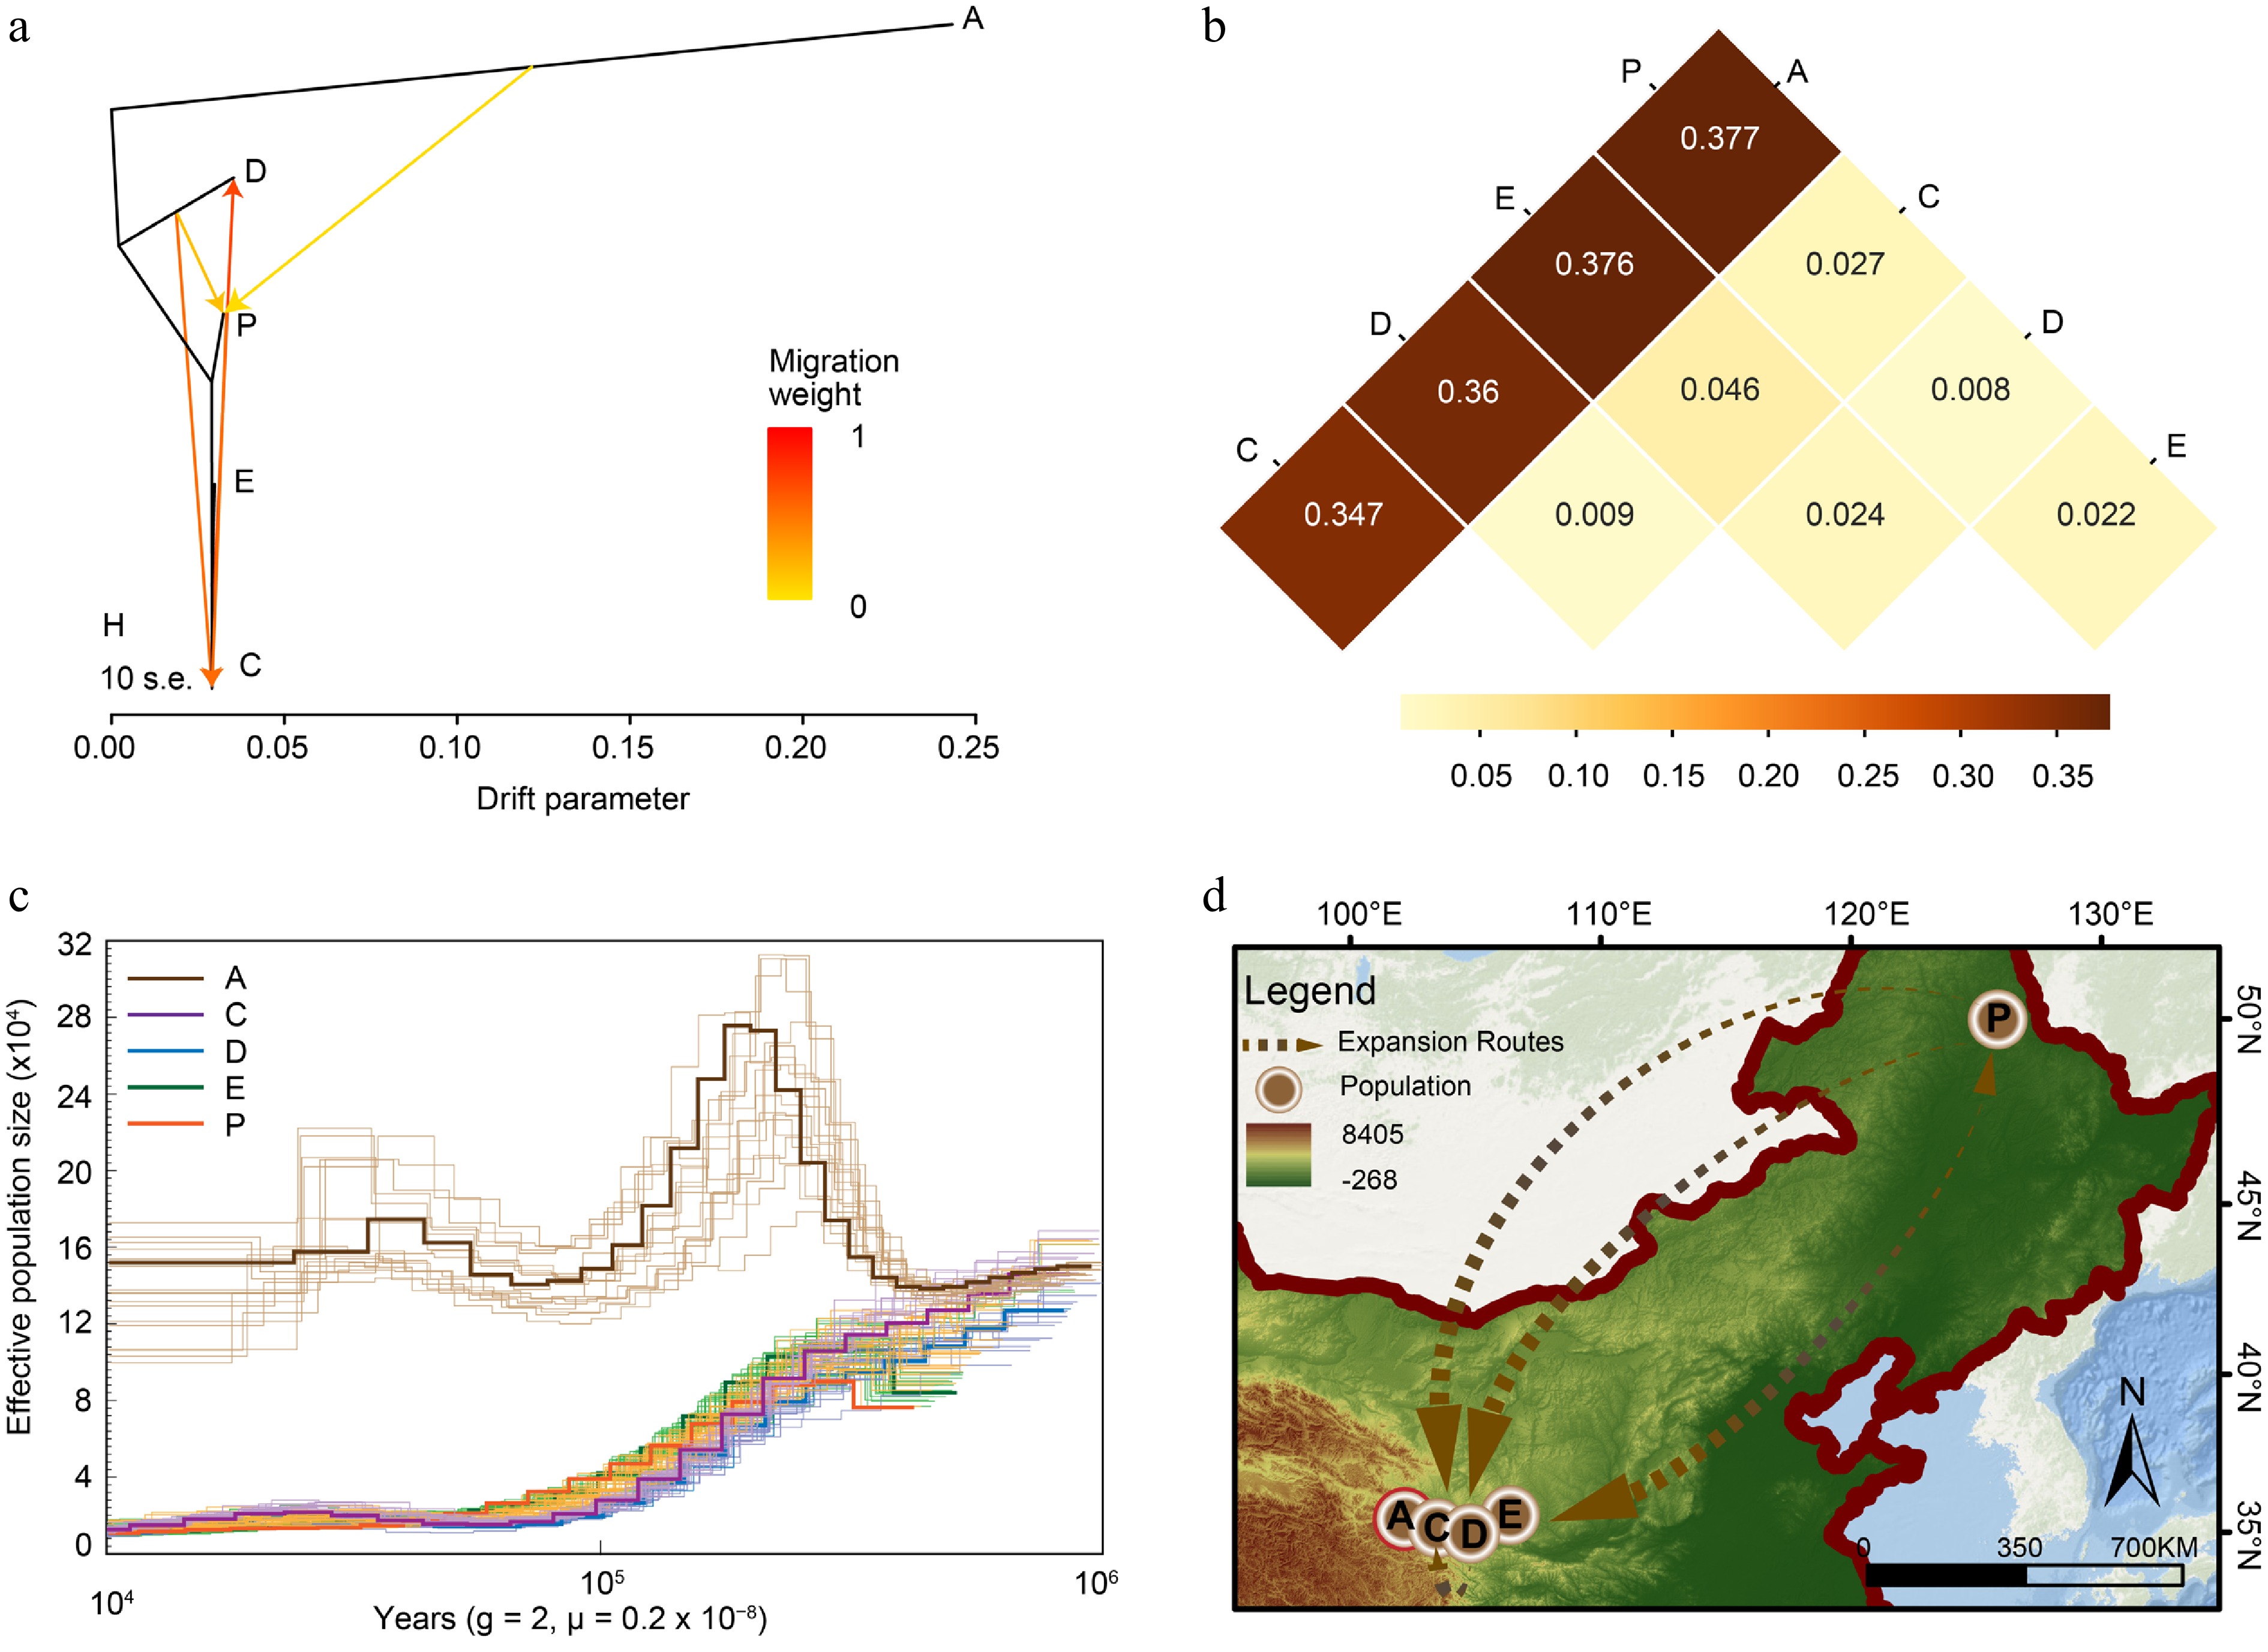
Figure 4.
Demographic history of Brachymystax lenok tsinlingensis. (a) Introgression among different populations of four migrations using TreeMix. (b) The fixation index (FST) between different populations, and the numbers in the squares represent FST values. (c) Pairwise Sequentially Markovian Coalescent (PSMC) analysis revealed the demographic history of the five geographic populations. (d) Postulated evolution center and expansion routes of B. lenok tsinlingensis in China. (Created with ArcMap 10.8; basemap sourced from the Geospatial Data Cloud,
www.gscloud.cn ). -
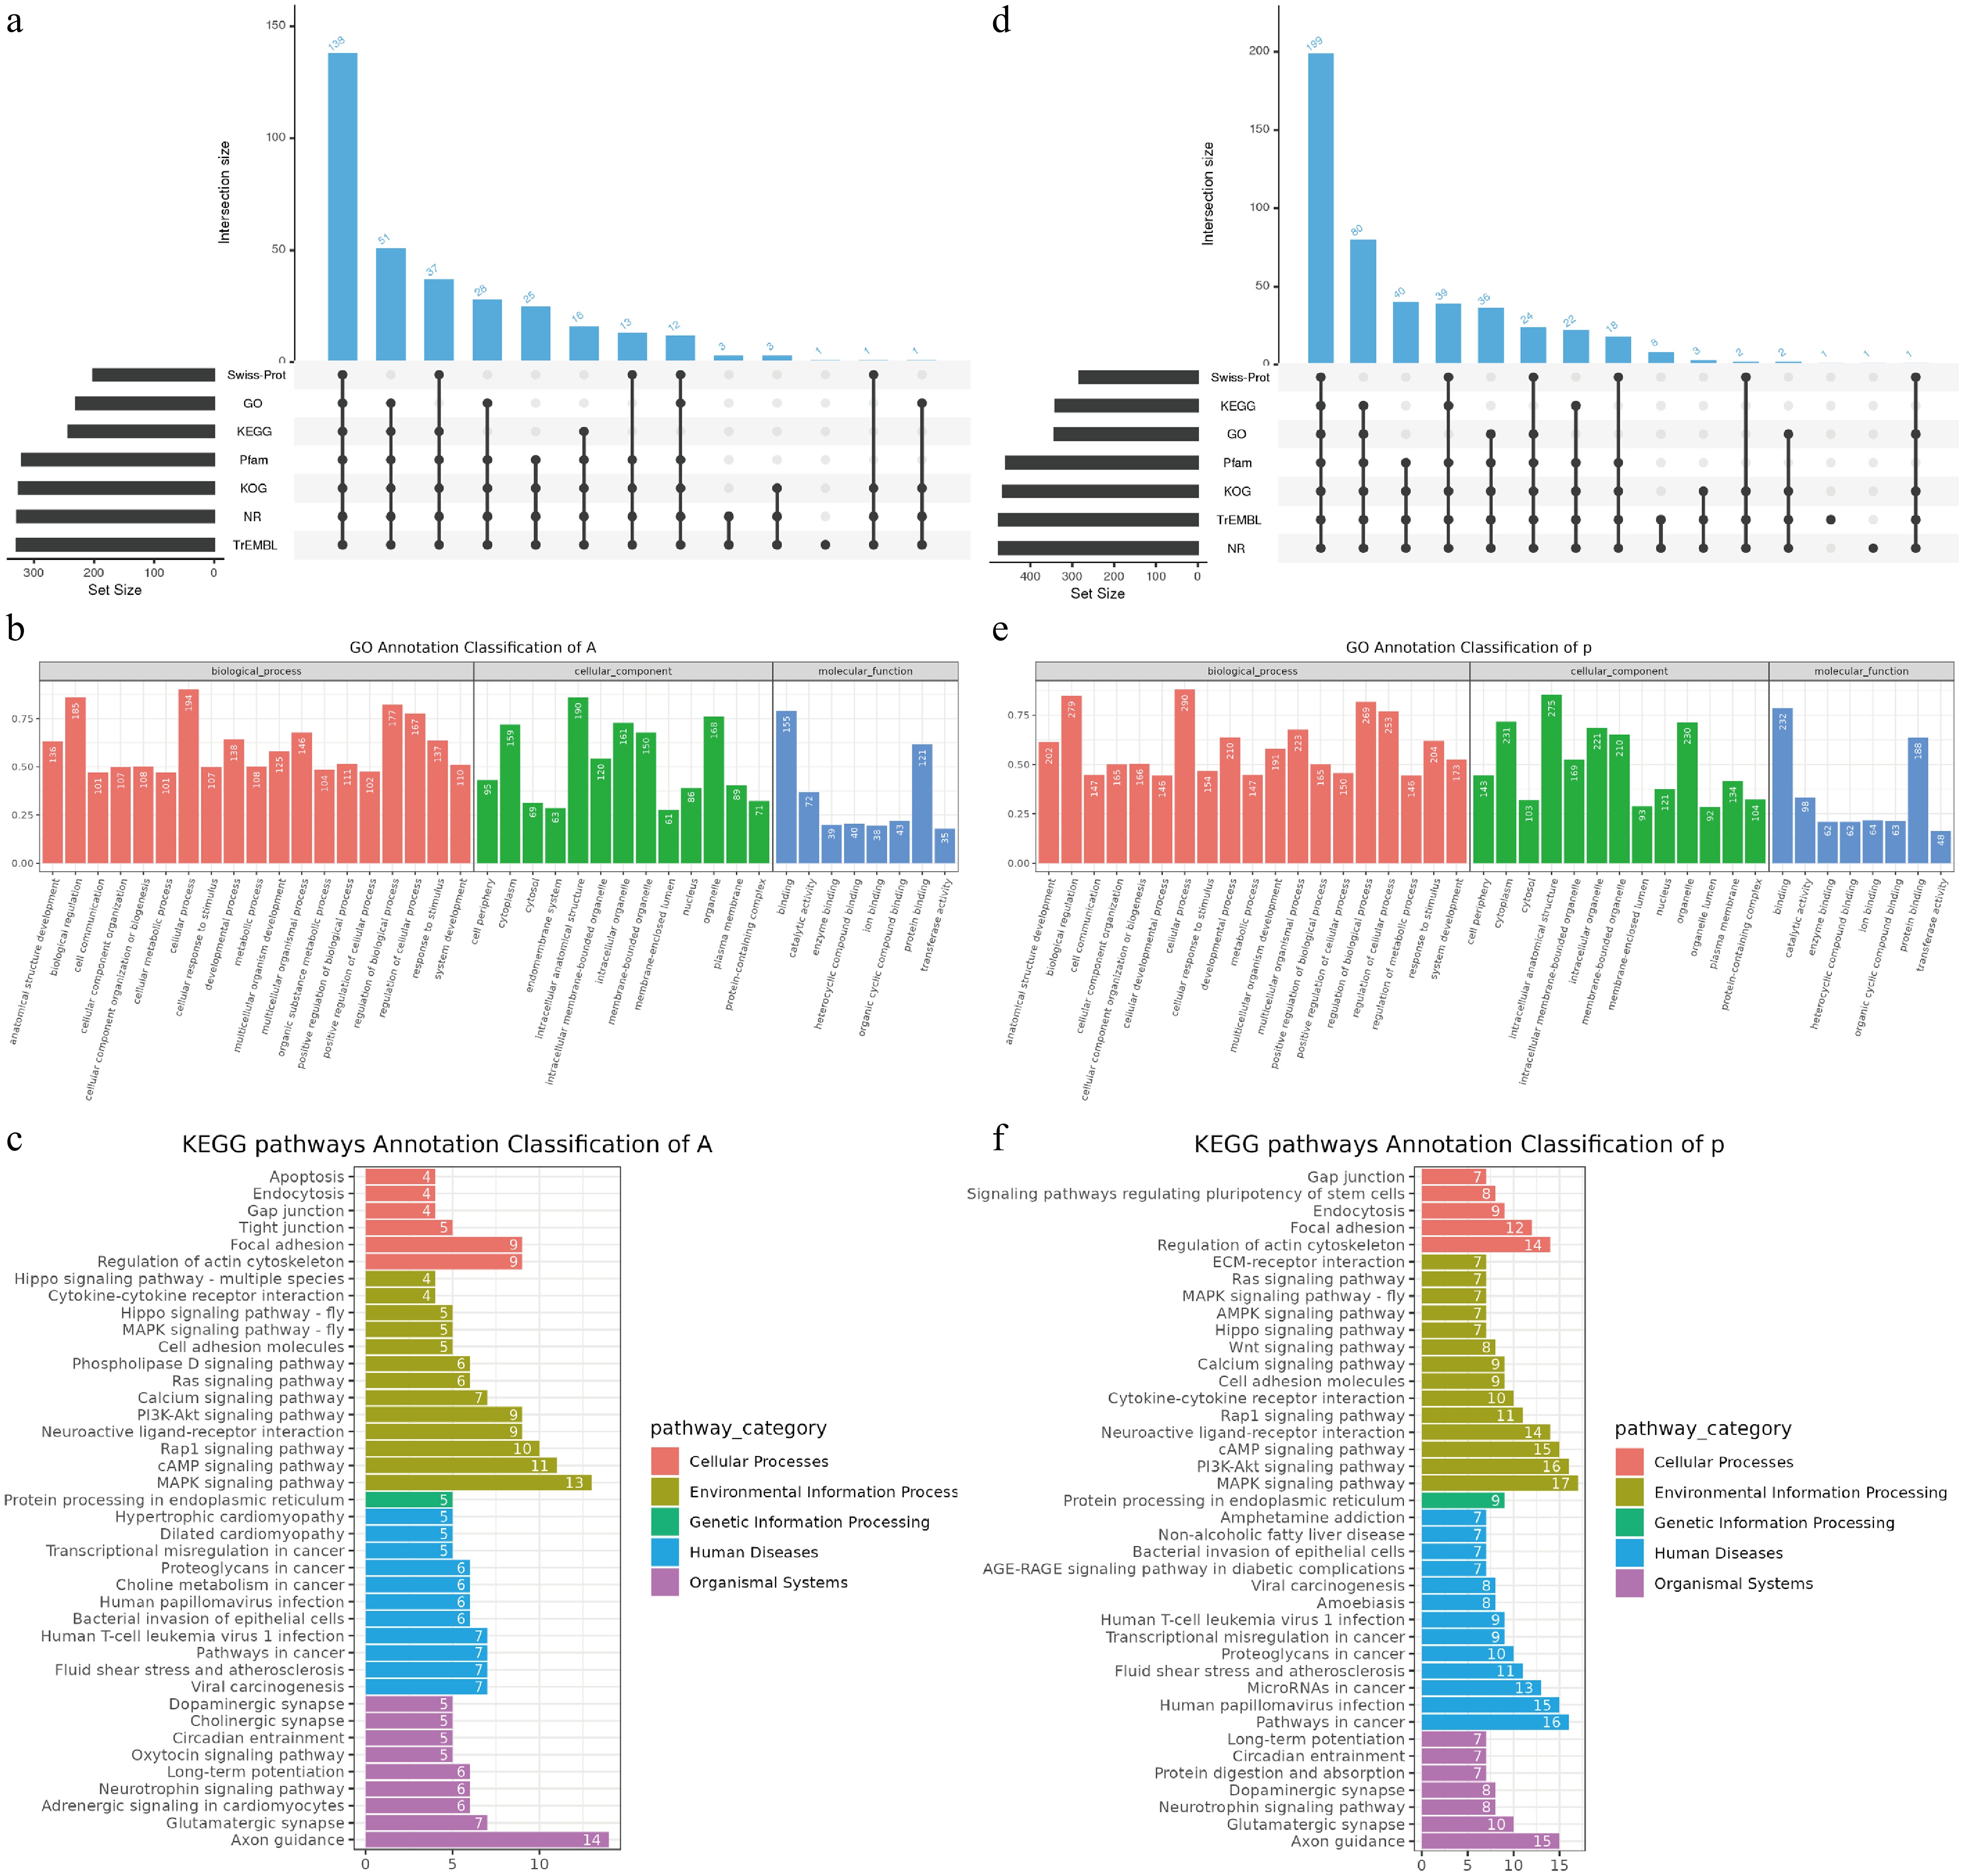
Figure 5.
Population-specific functional enrichment and gene annotation. The upset bar plots show (a) the functional, (b) GO, and (c) KEGG pathway annotation of population A, and (d)–(f) population P.
Figures
(5)
Tables
(0)