-
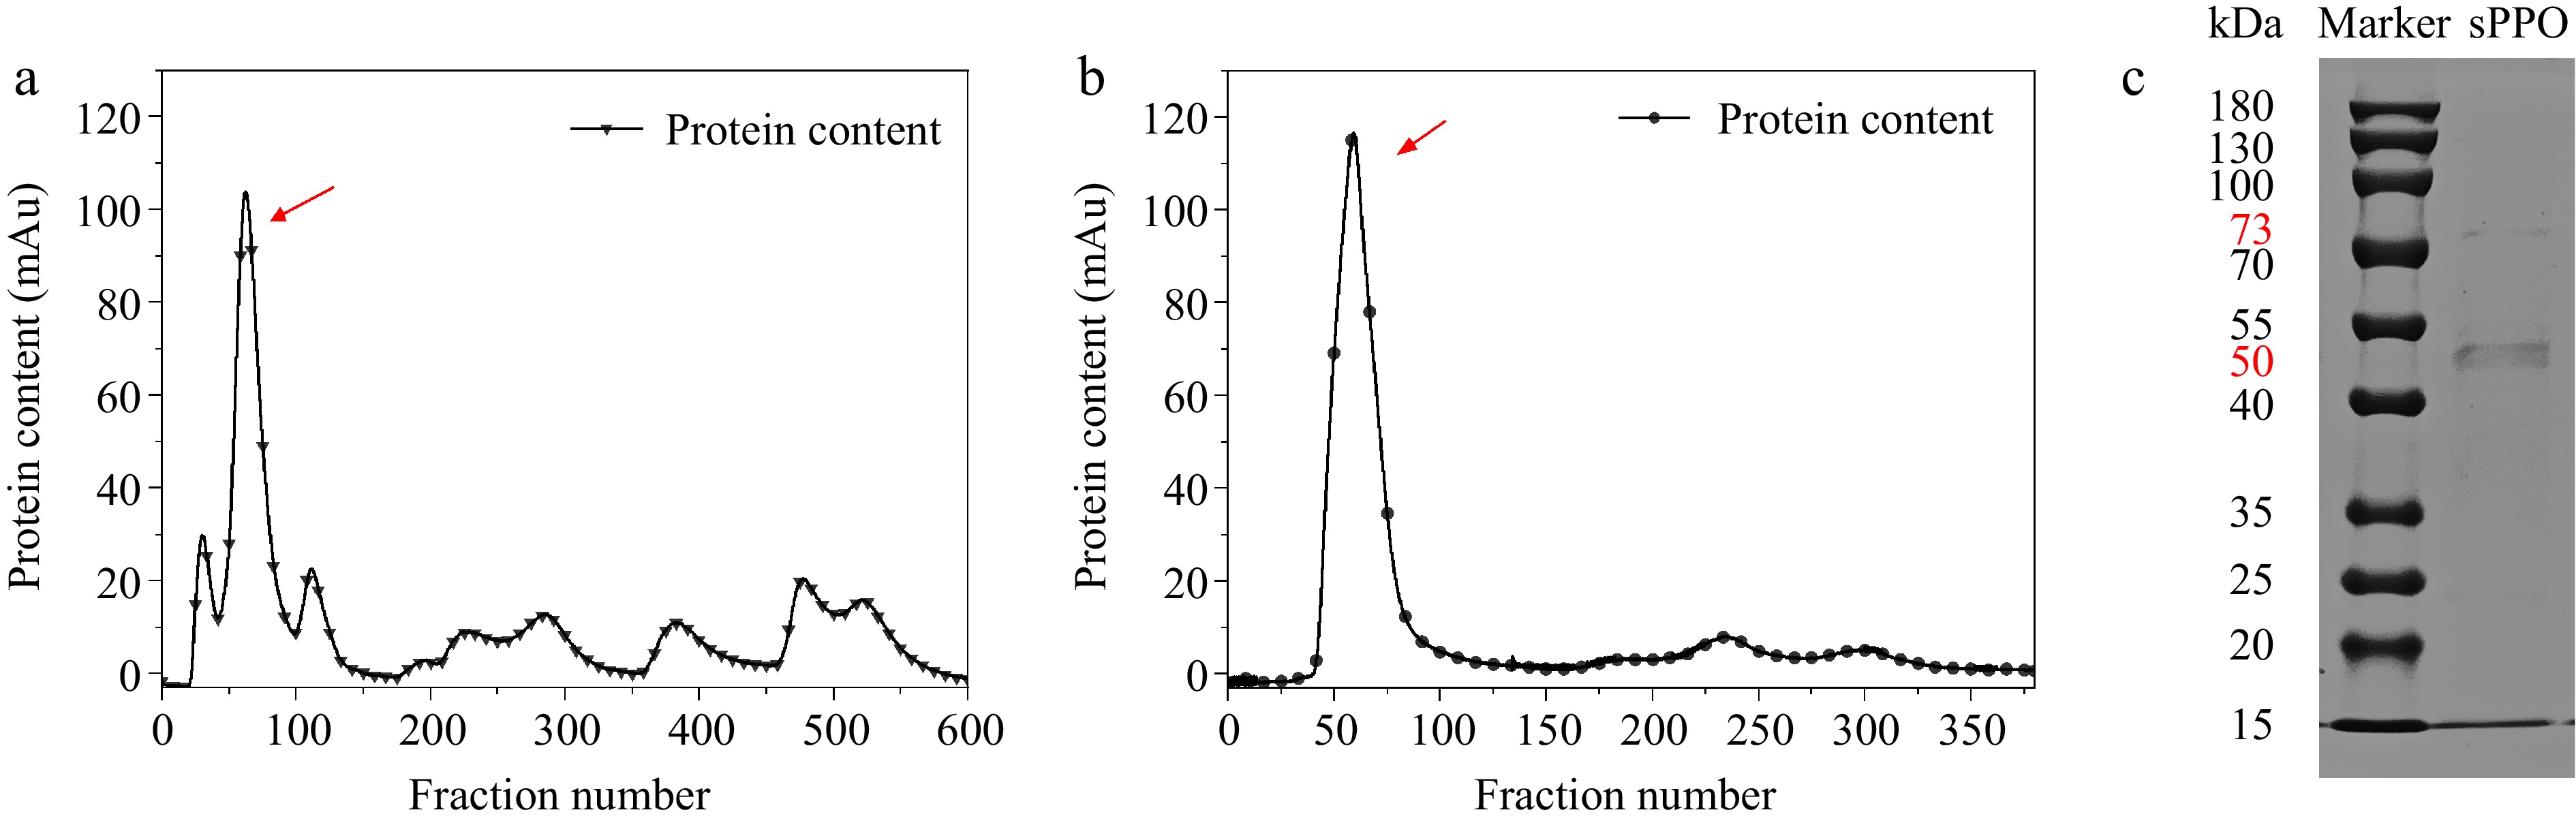
Figure 1.
Purification results of Agaricus bisporus sPPO. (a) DEAE ion-exchange chromatographic elution profile. (b) Sephadex G-75 size exclusion chromatographic elution profile. (c) Denaturing SDS-PAGE of purified sPPO protein stained with Coomassie Brilliant Blue R-250.
-
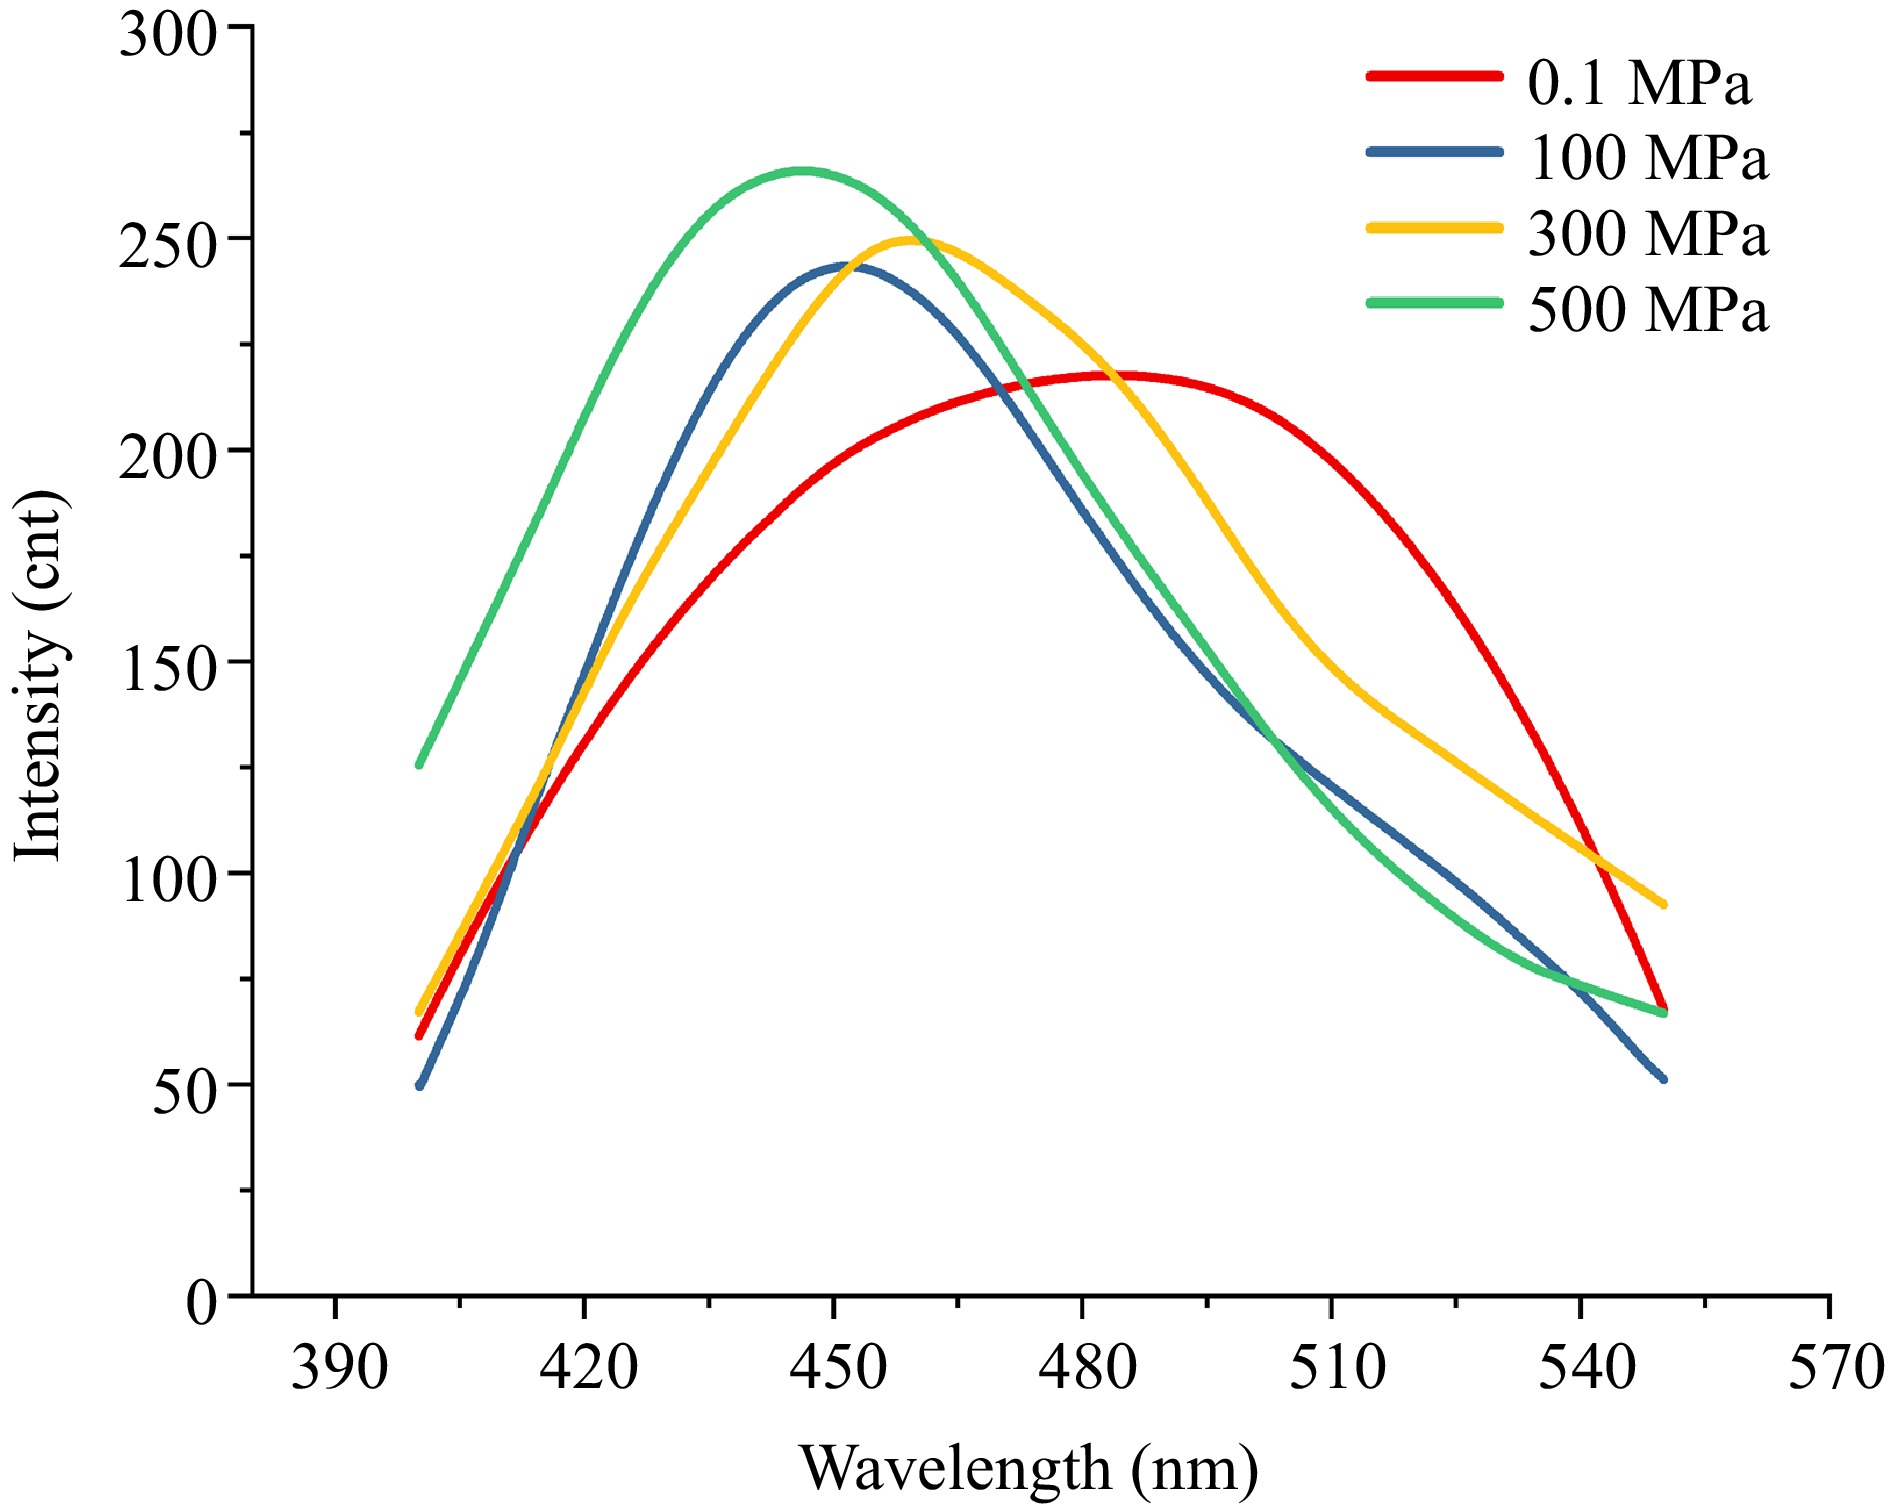
Figure 2.
ANS fluorescence spectra under different pressures. ANS–protein fluorescence spectra measured at 0.1, 100, 300, and 500 MPa.
-
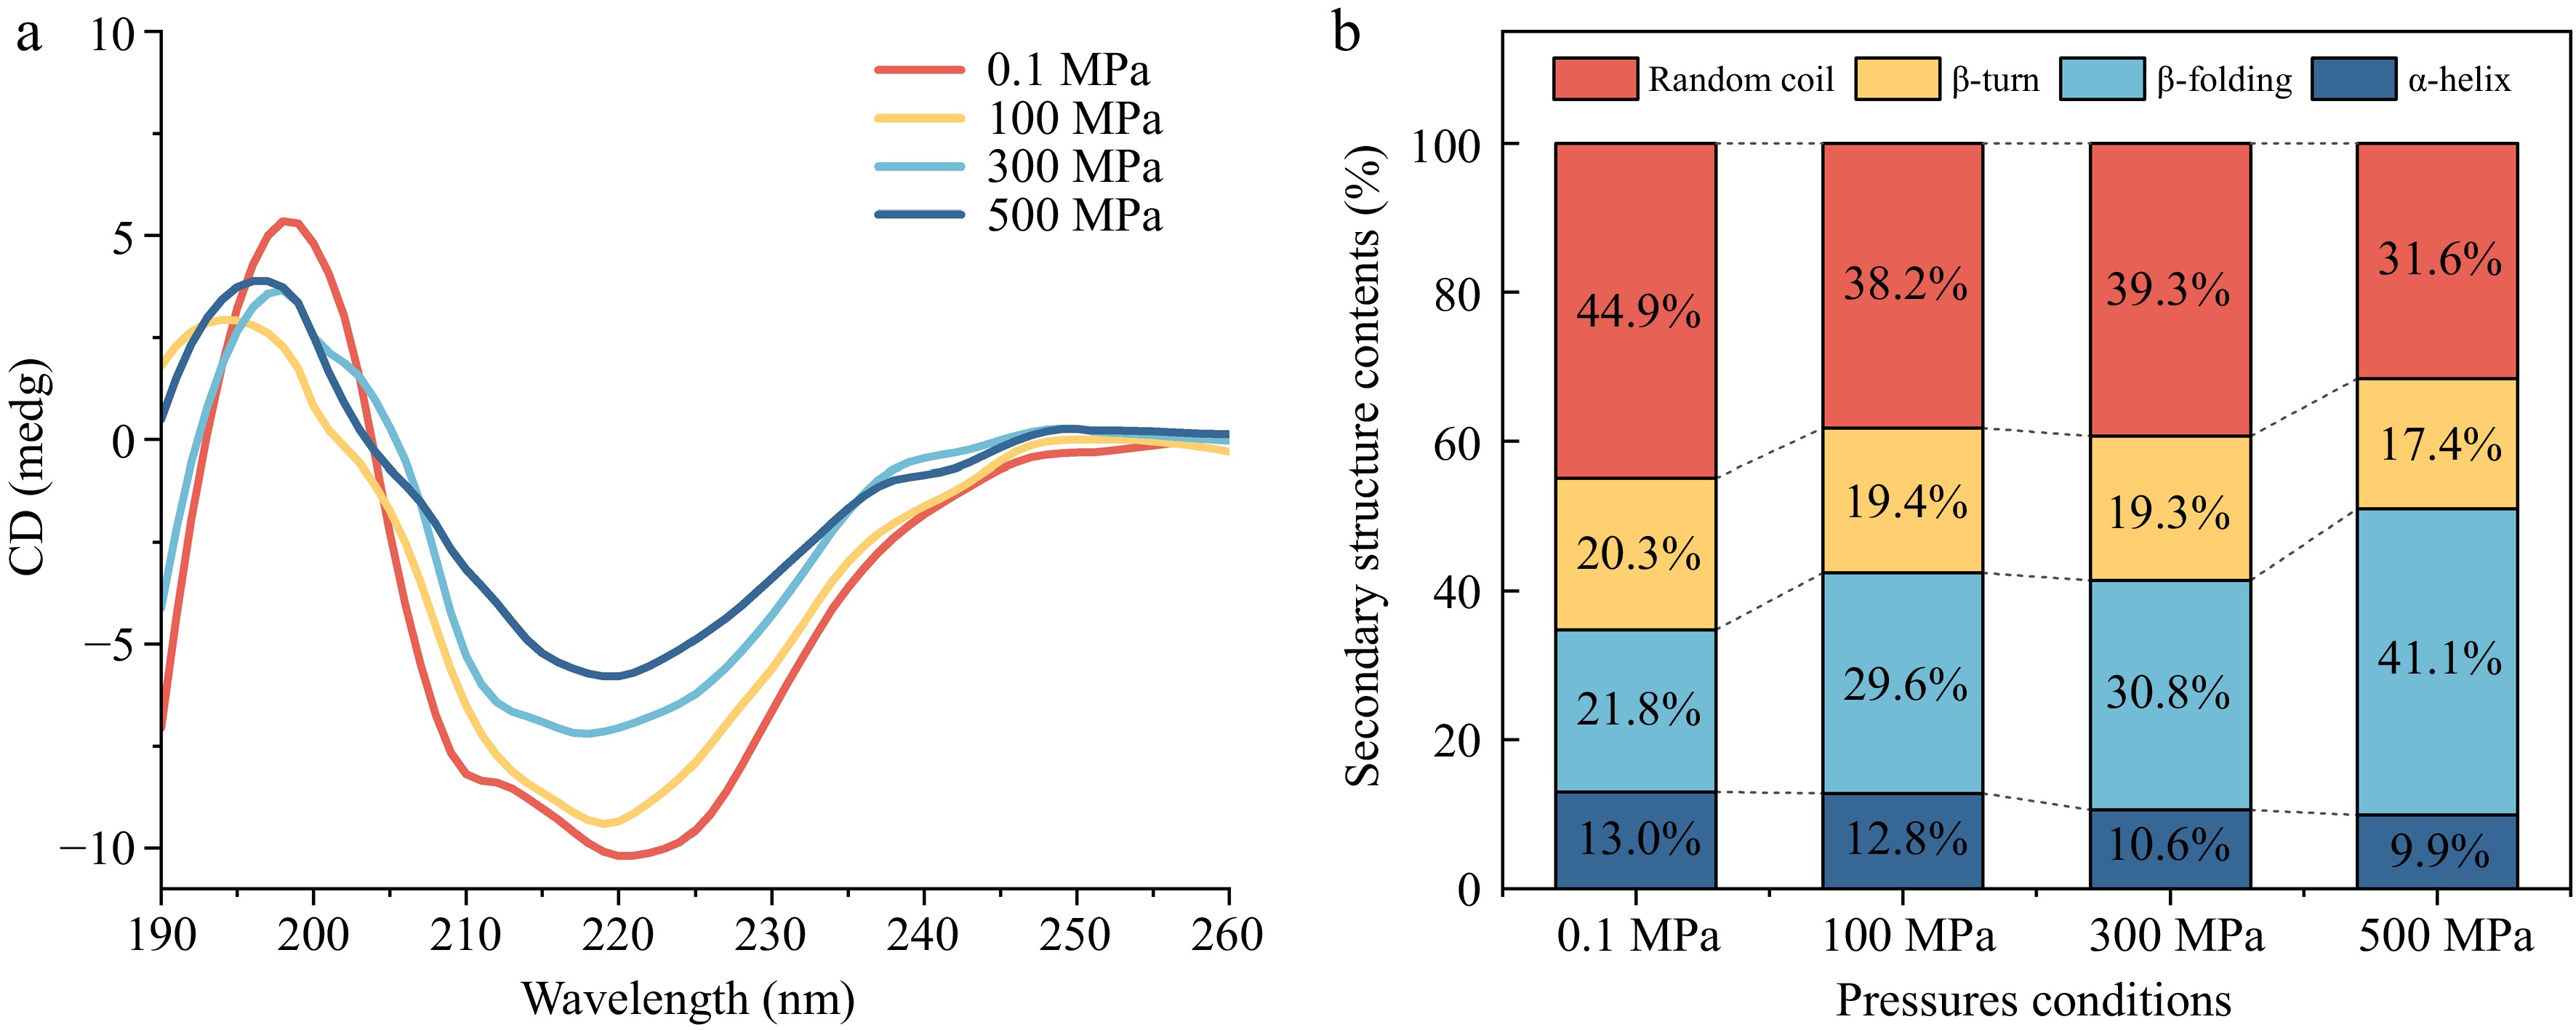
Figure 3.
Circular dichroism spectra of Agaricus bisporus sPPO. (a) CD spectra change under different pressure conditions. (b) Secondary structure contents.
-
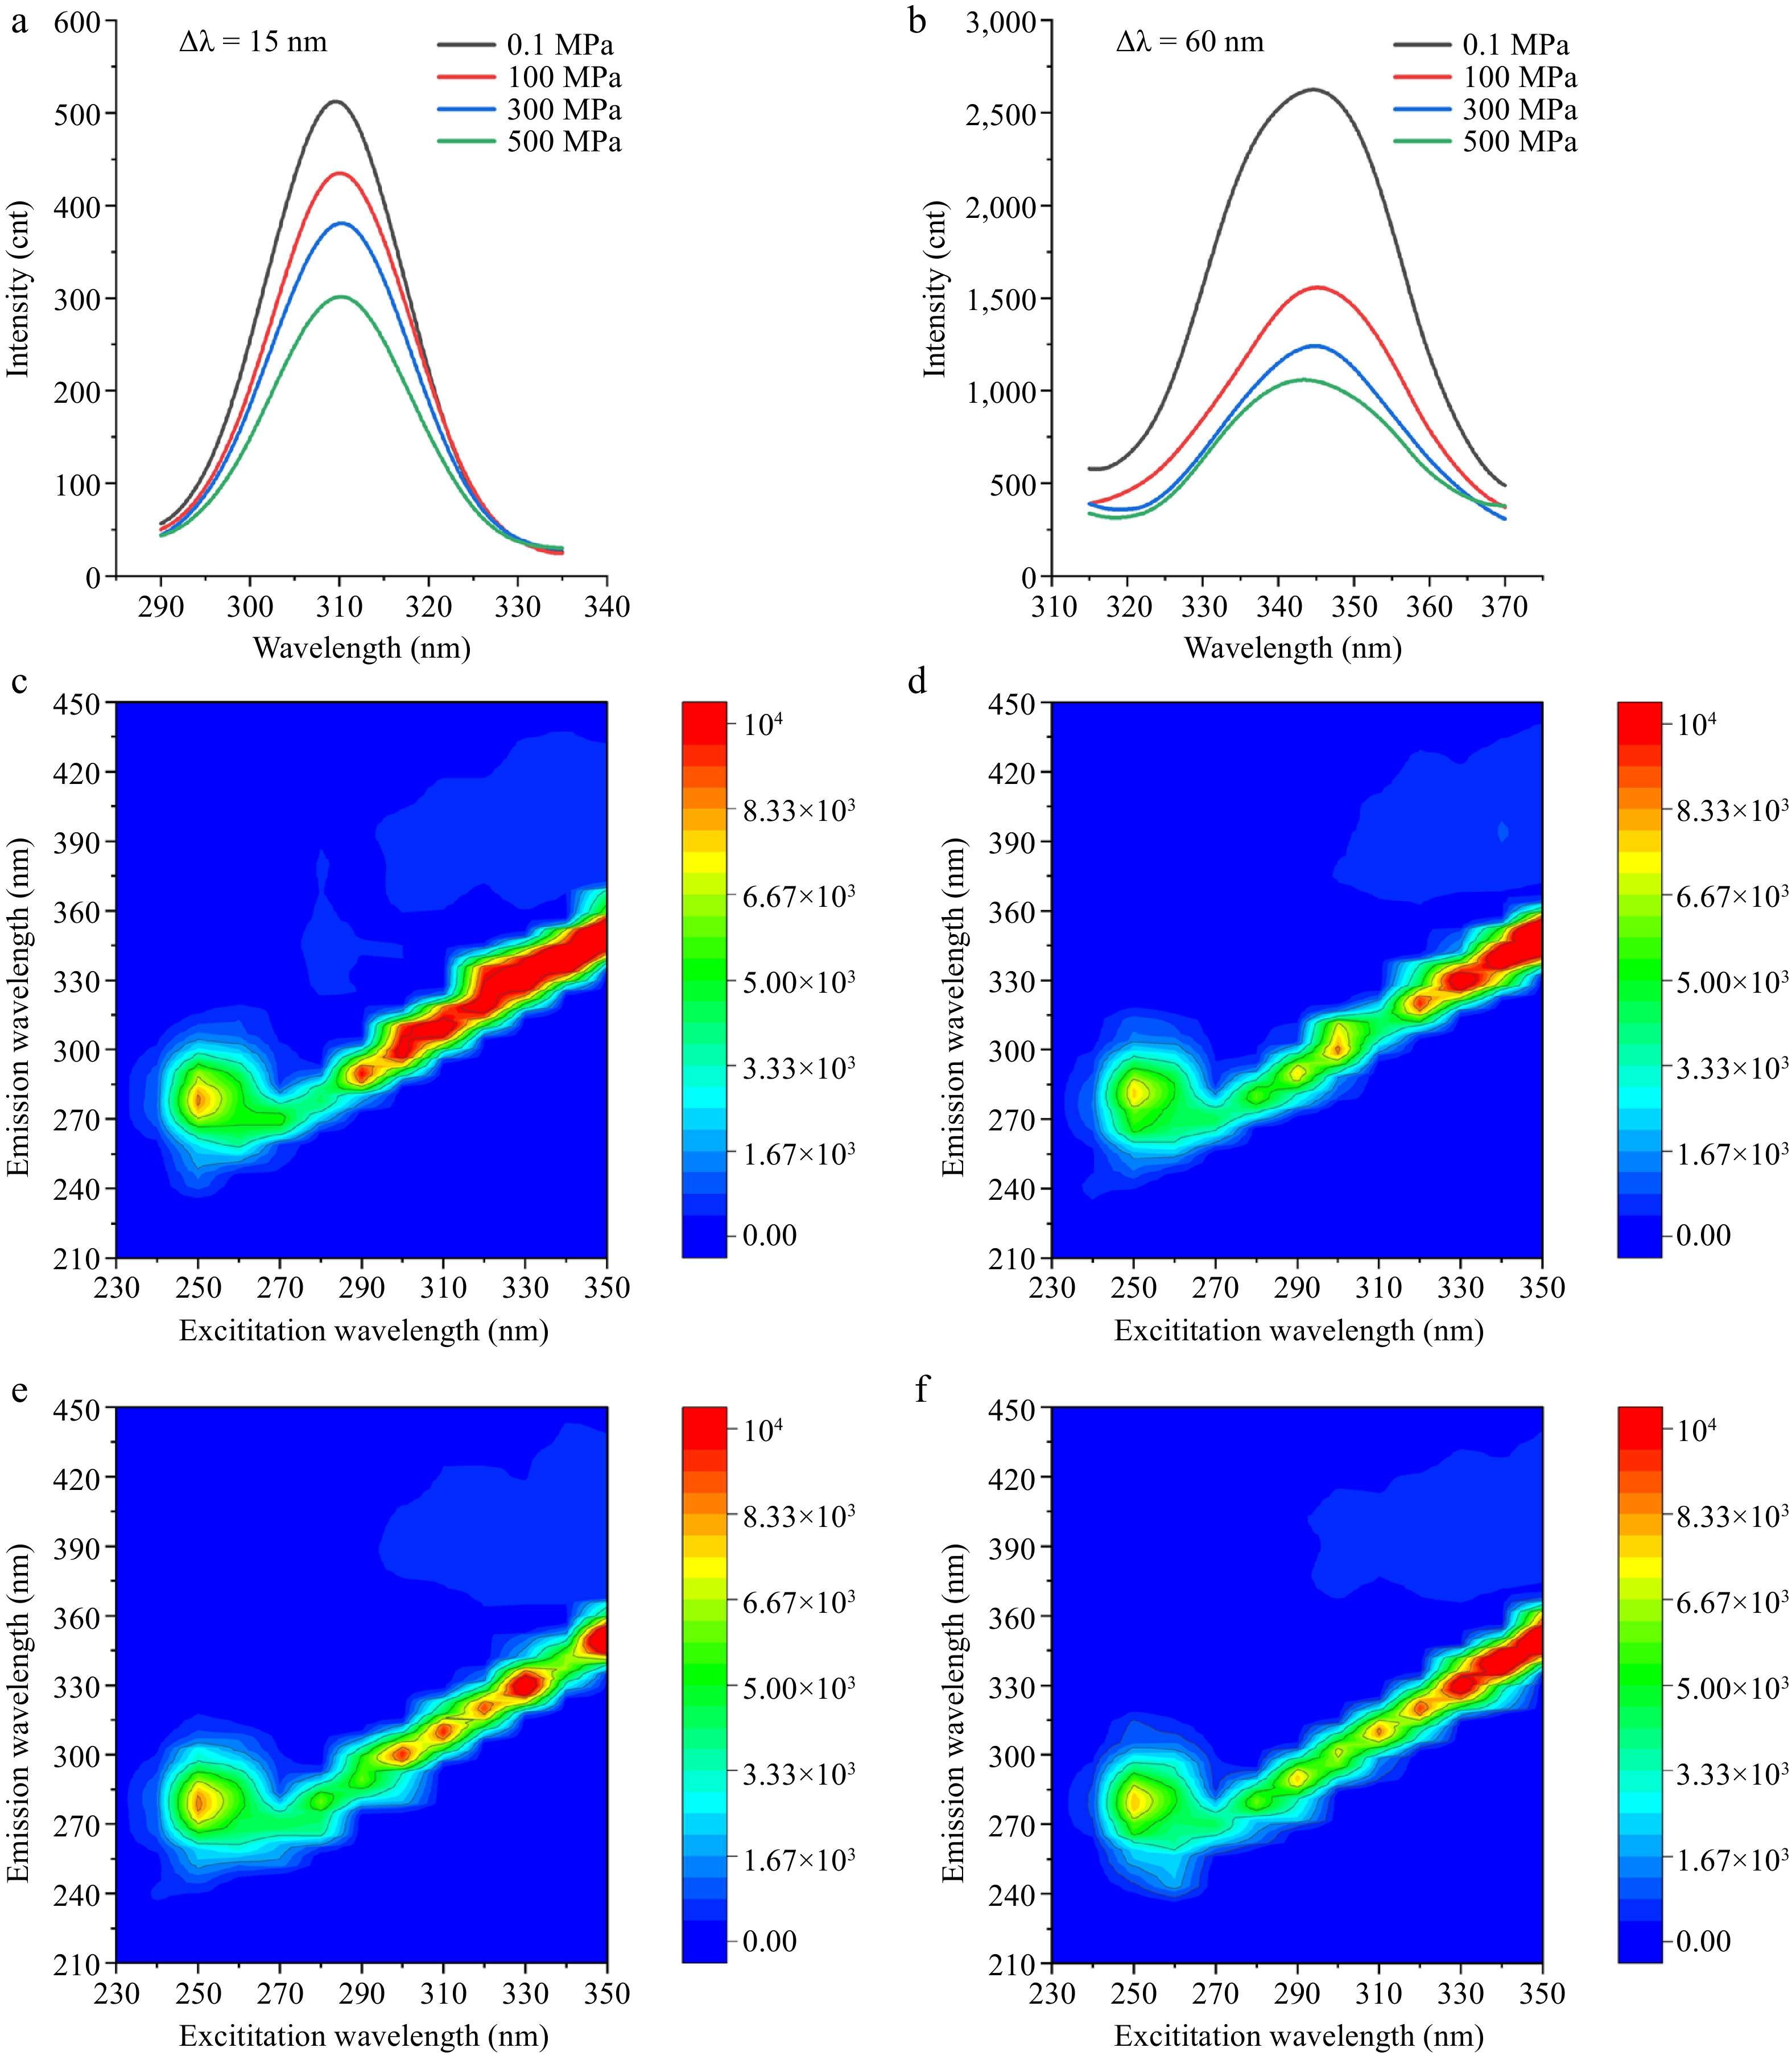
Figure 4.
Fluorescence spectrum under different HPP treatments. (a) Synchronous fluorescence spectra recorded at Δλ = 15 nm (Tyr), and (b) Δλ = 60 nm (Trp), respectively. 3D fluorescence spectra at (c) 0.1, (d) 100, (e) 300, and (f) 500 MPa, respectively.
-
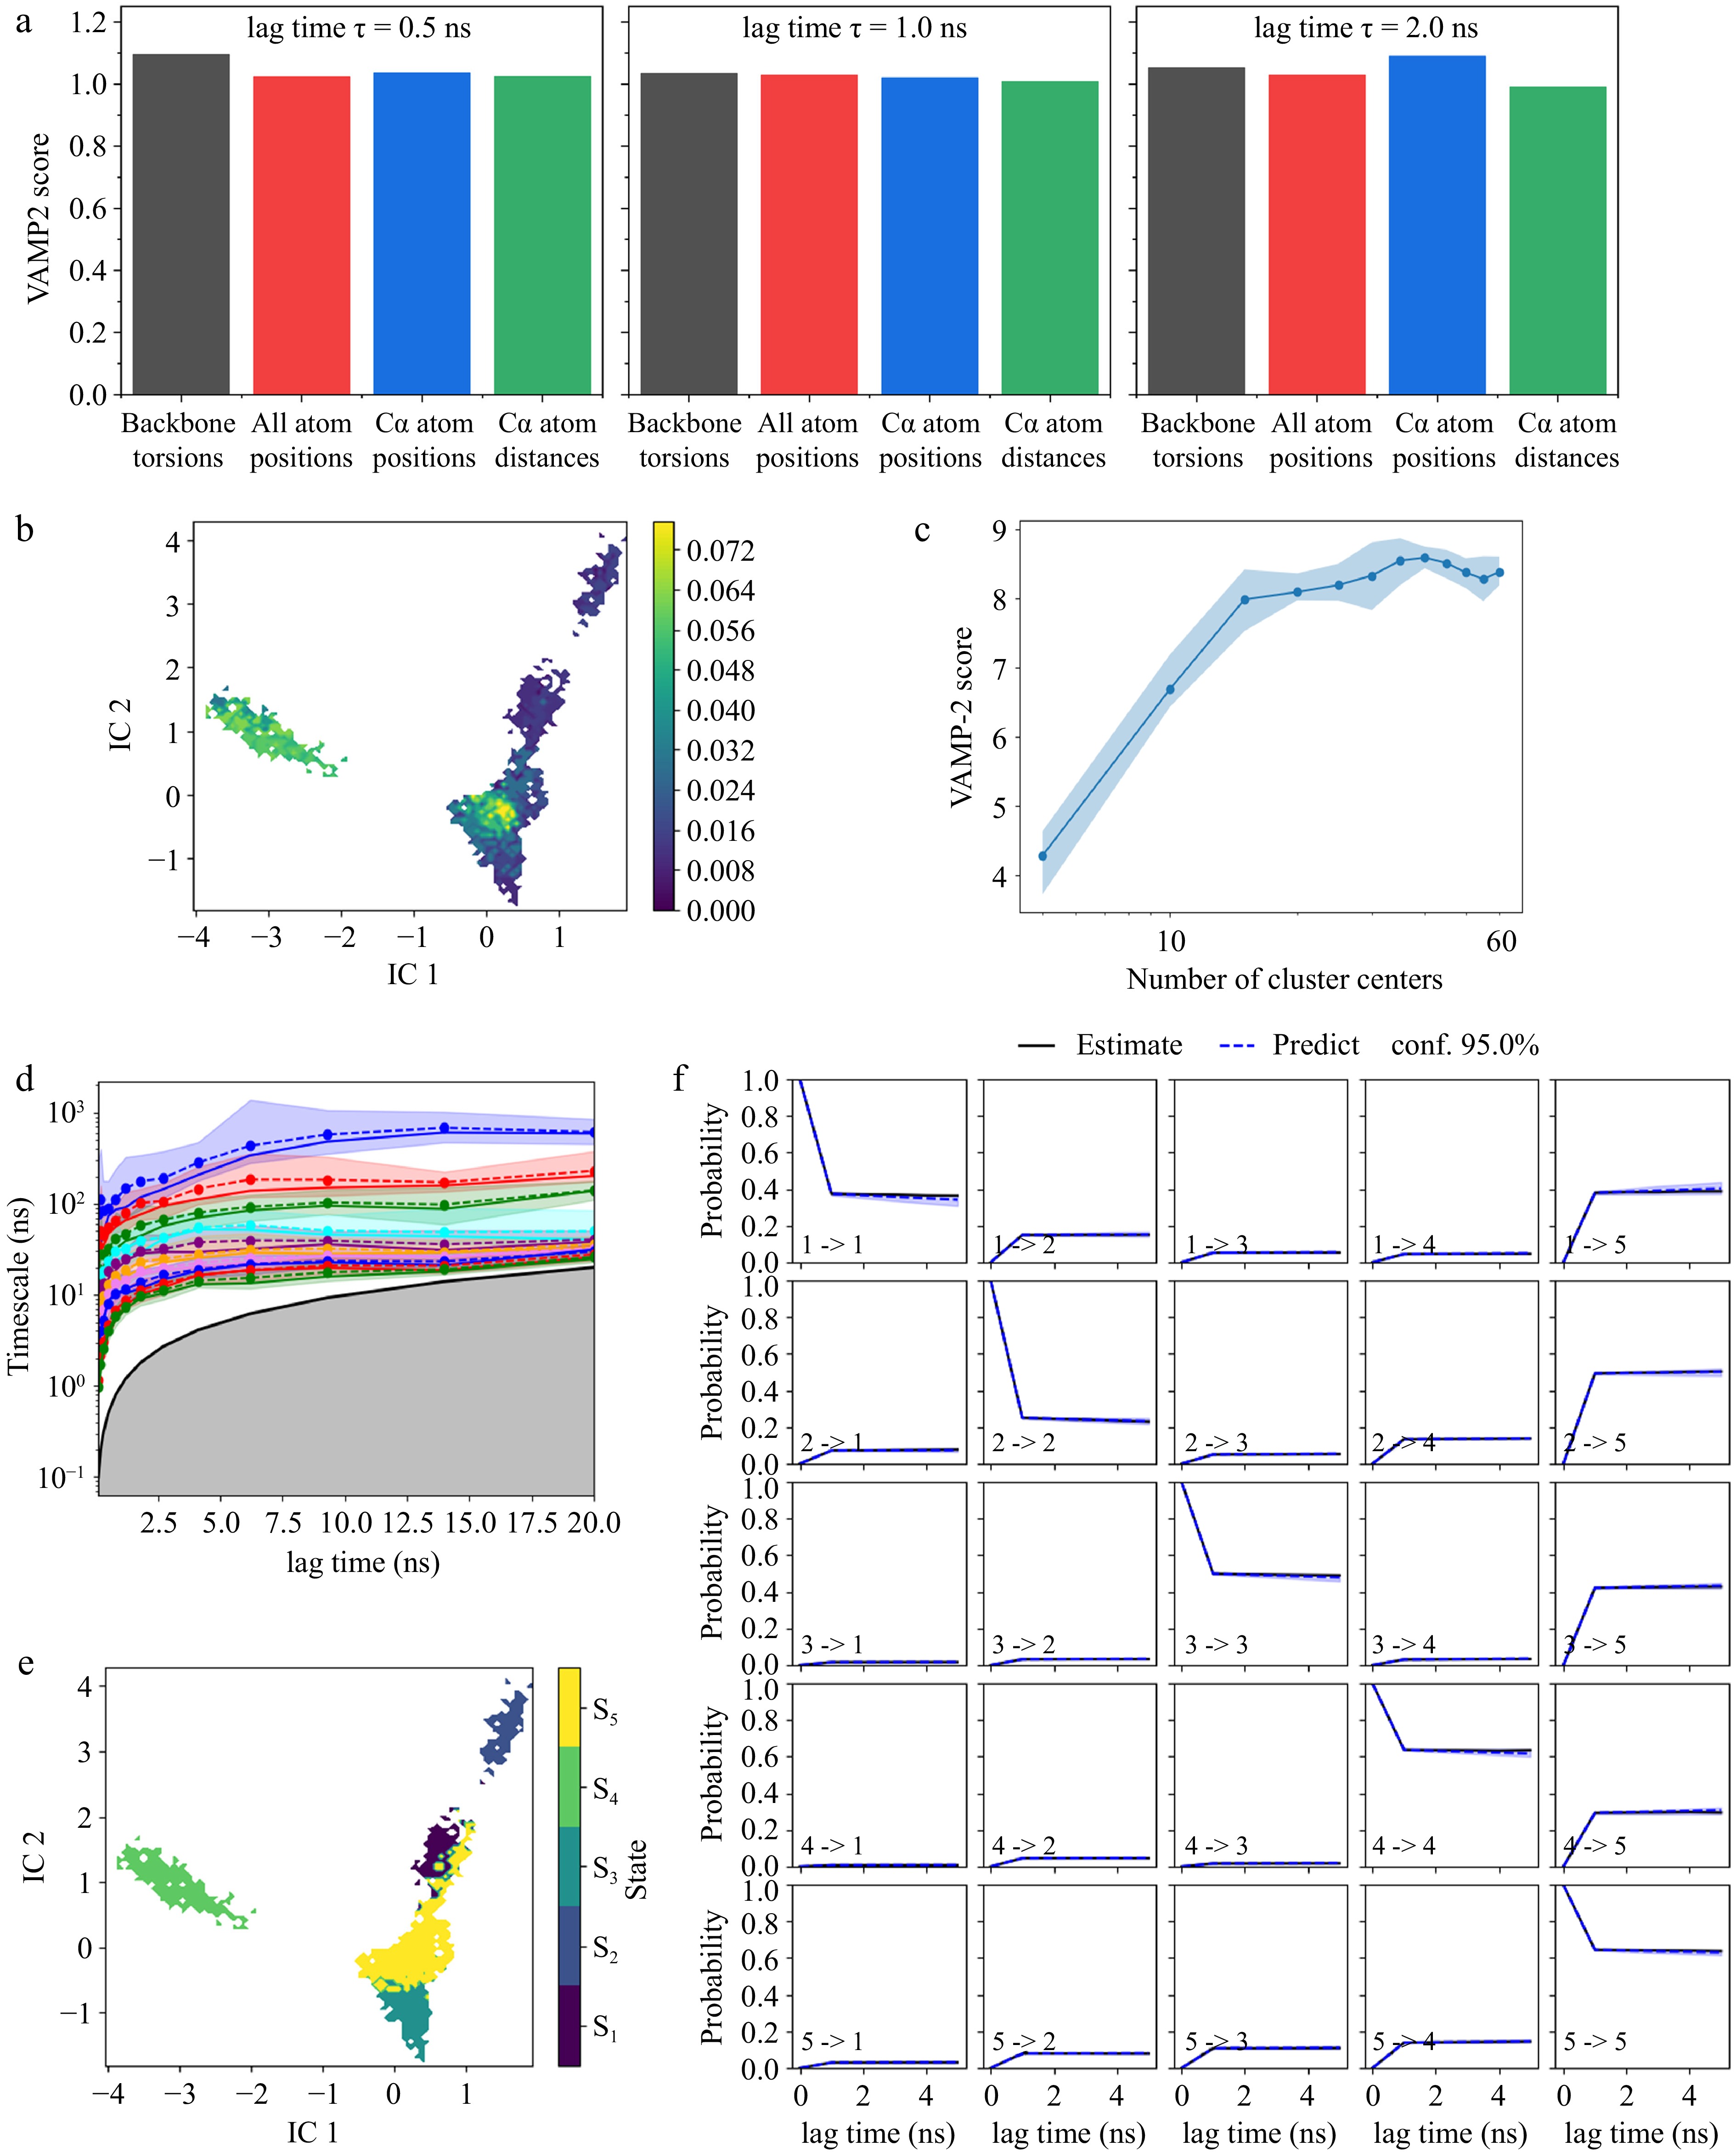
Figure 5.
Markov State Model analysis of mushroom polyphenol oxidase. (a) VAMP2 score of backbone torsion, all atom positions, Cα atom positions, and Cα atom distance; (b) time-lagged independent component analysis (tICA); (c) k-means cluster number validation using VAMP2 score; (d) implied timescales of different lag time; (e) Perron Cluster Cluster Analysis (PCCA) of metastable states. S1–S5 indicate the five metastable sets corresponding to states 1–5 in the MSM. (f) Markov State Model validation with Chapman-Kolmogorov test.
-
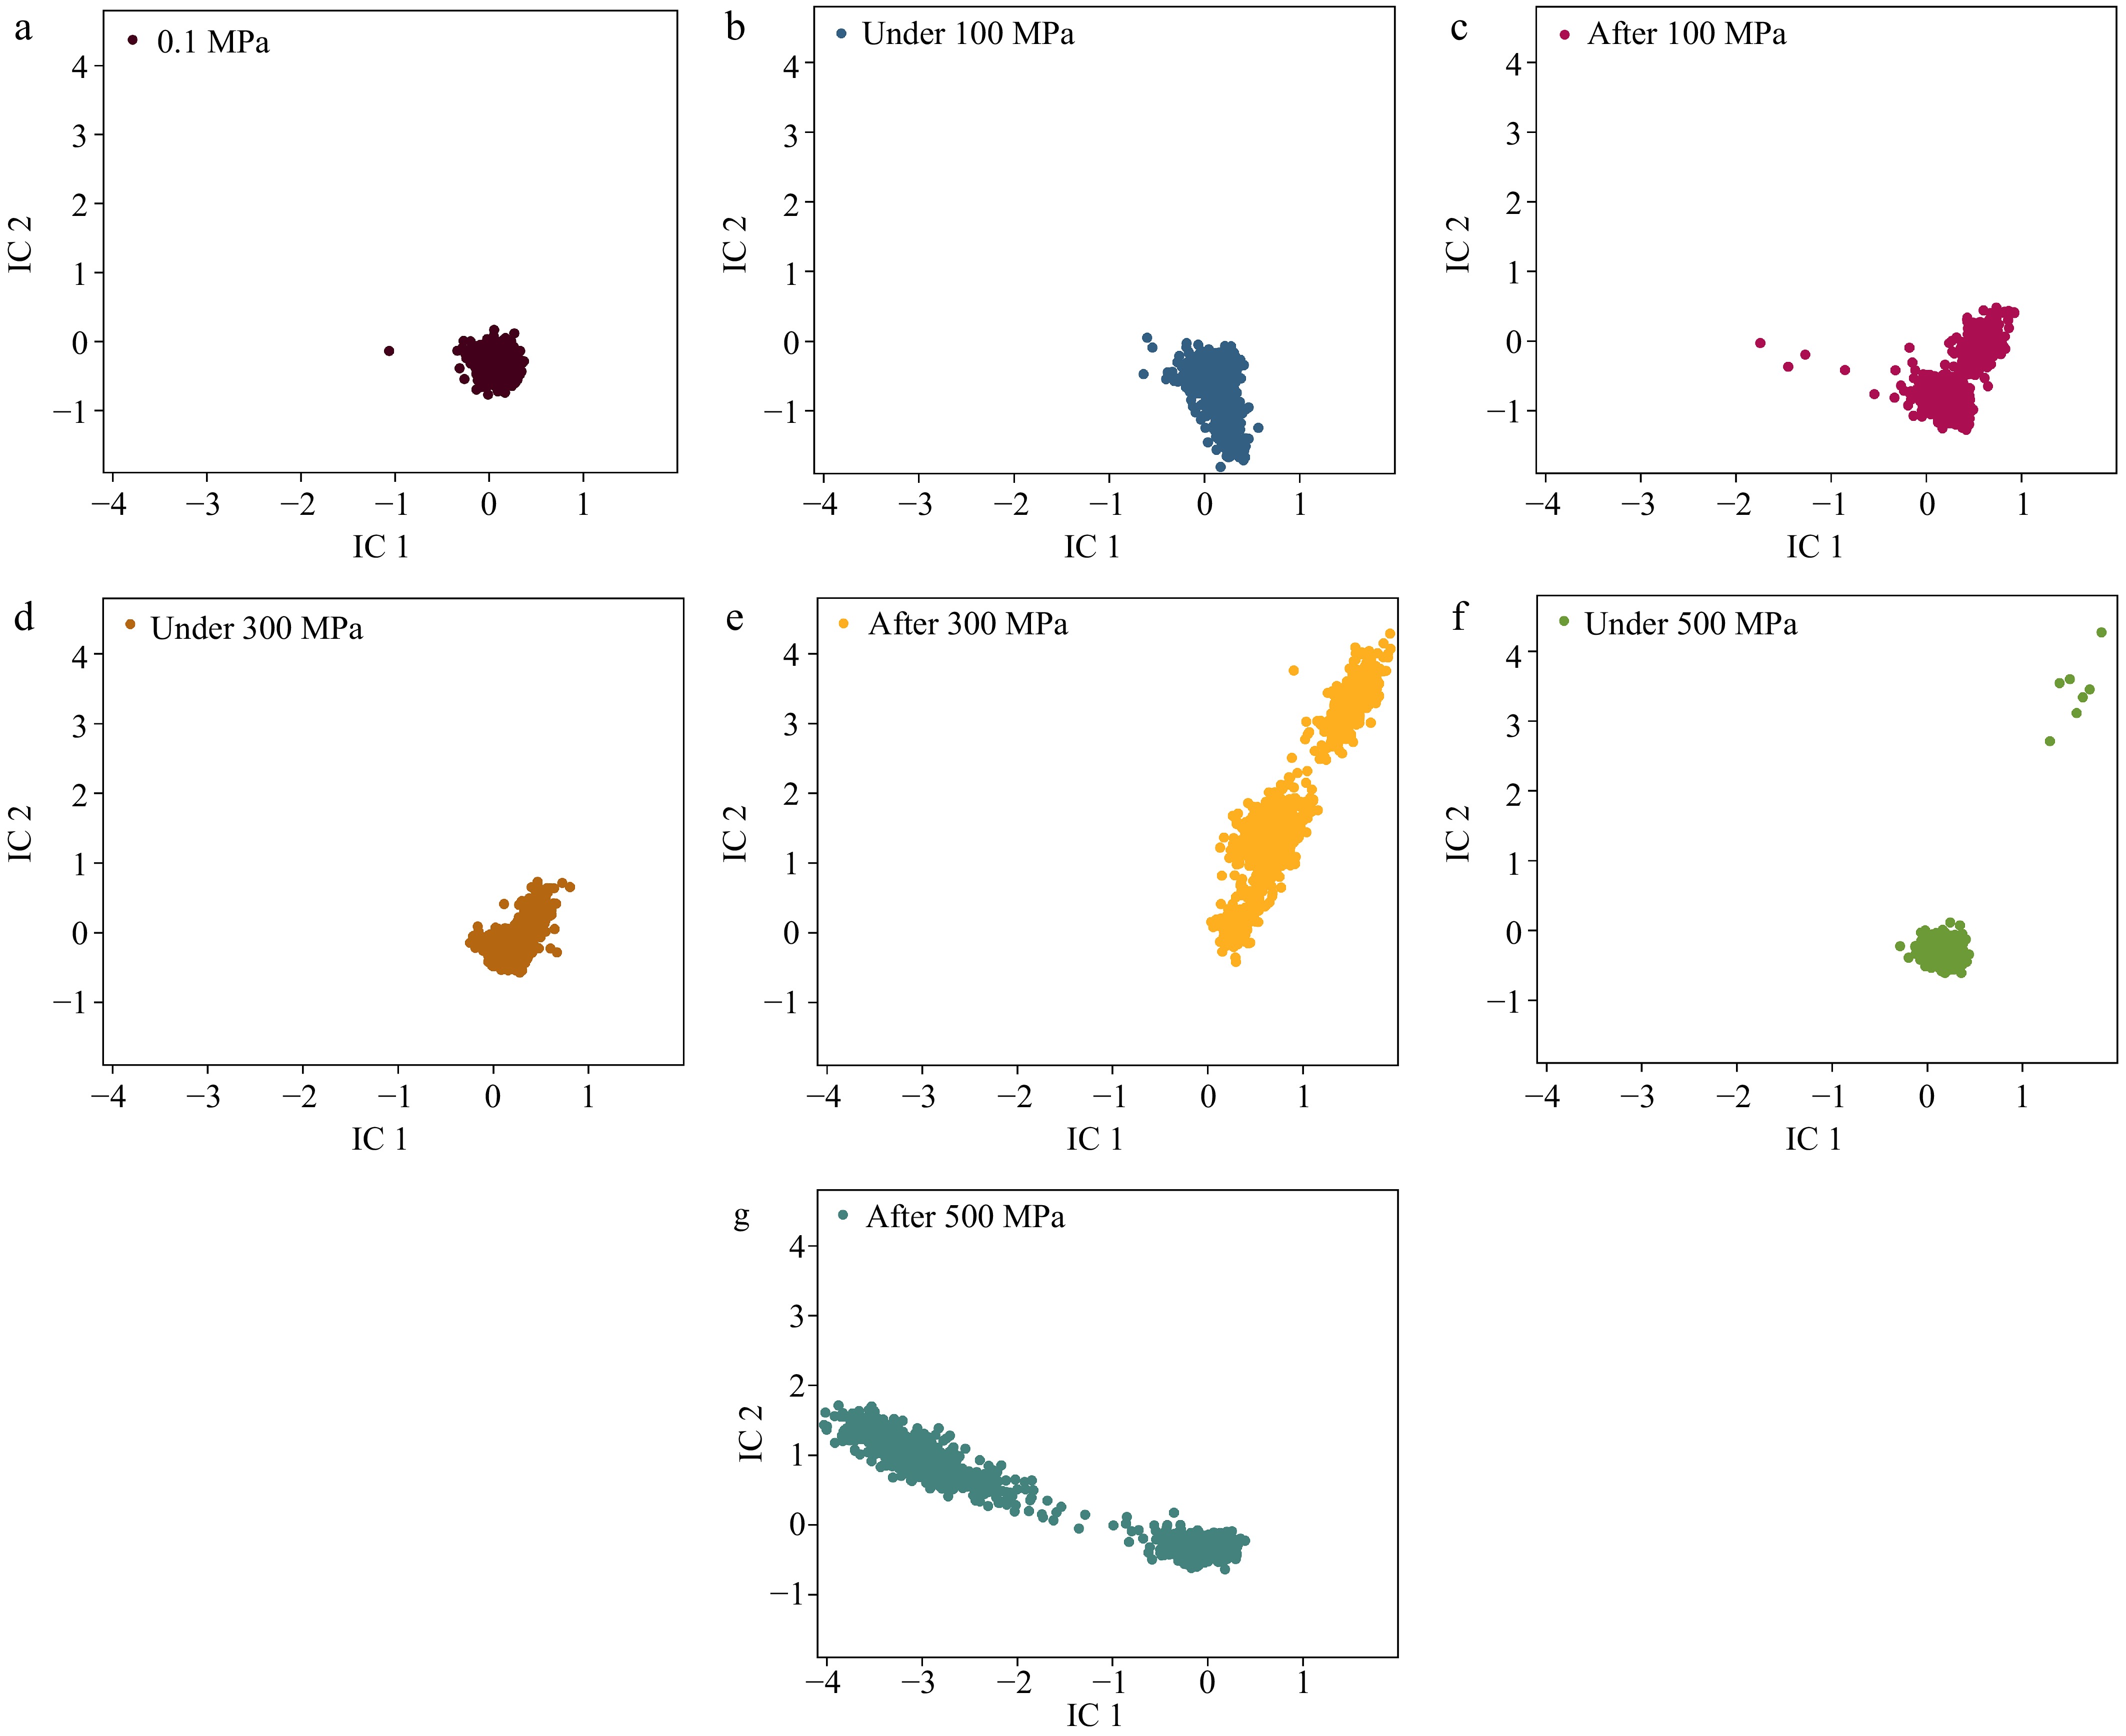
Figure 6.
Conformational distributions in tICA space. Conformational distributions at pressures of (a) 0.1 MPa, (b) under 100 MPa, (c) after 100 MPa, (d) under 300 MPa, (e) after 300 MPa, (f) under 500 MPa, and (g) after 500 MPa.
-
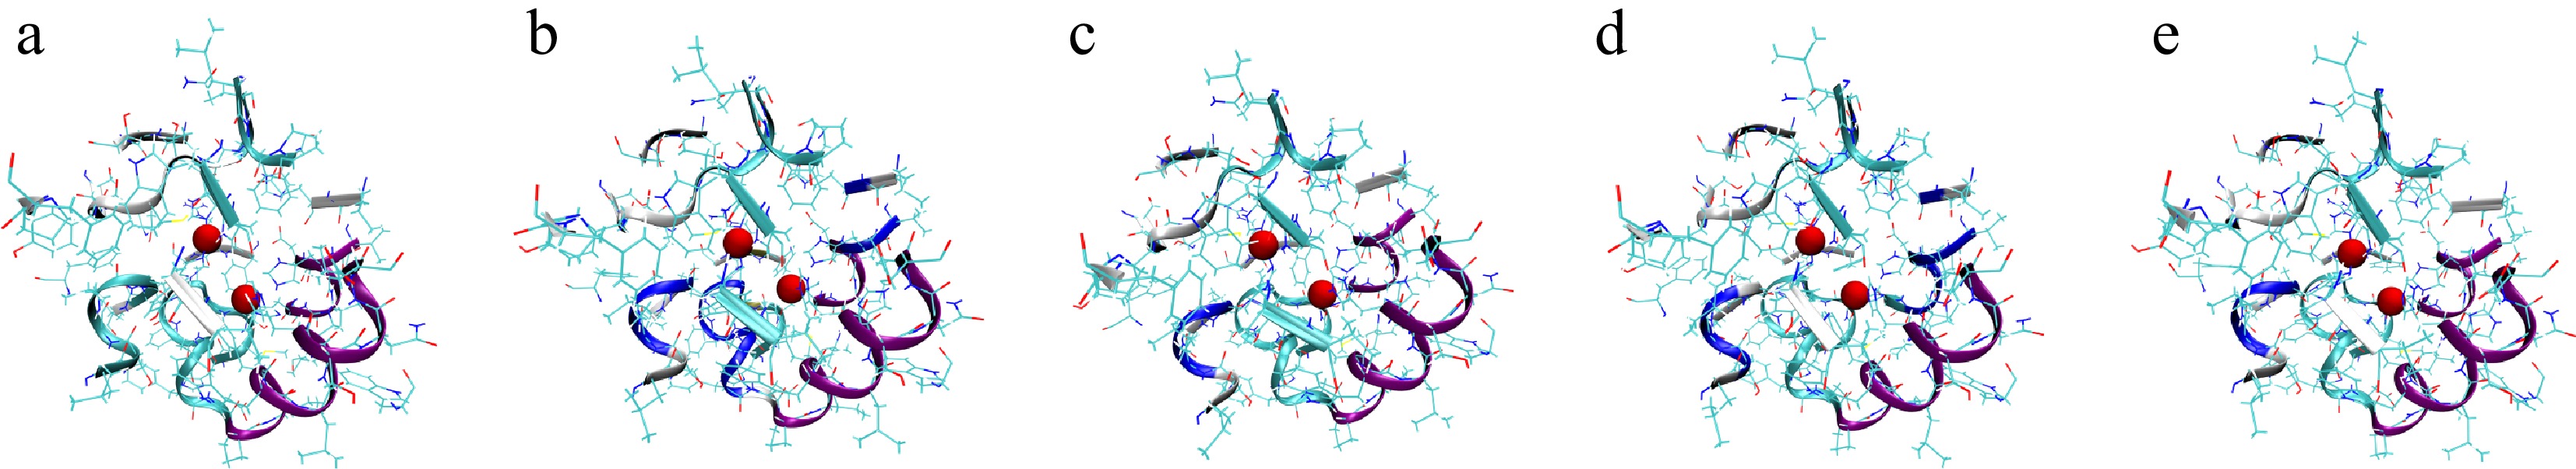
Figure 7.
Mushroom PPO structures corresponding to the five metastable states obtained from PCCA clustering. (a)–(e) The representative conformations of the five metastable states. The two red spheres denote the Cu2+ ions at the catalytic active site, defined as residues within 20 Å of the copper ions, and these surrounding residues are shown in New Cartoon representation to highlight the local active-site environment.
-
Pressure (MPa) Processing time (min) RA (%) 0.1 30 100.00 ± 5.80a 100 30 16.55 ± 0.61b 300 30 13.28 ± 1.30b 500 30 12.76 ± 0.96b Different lowercase letters in the same column indicate significant differences at the 0.05 level. Table 1.
Residual enzyme activity under different high pressure processing.
Figures
(7)
Tables
(1)