-
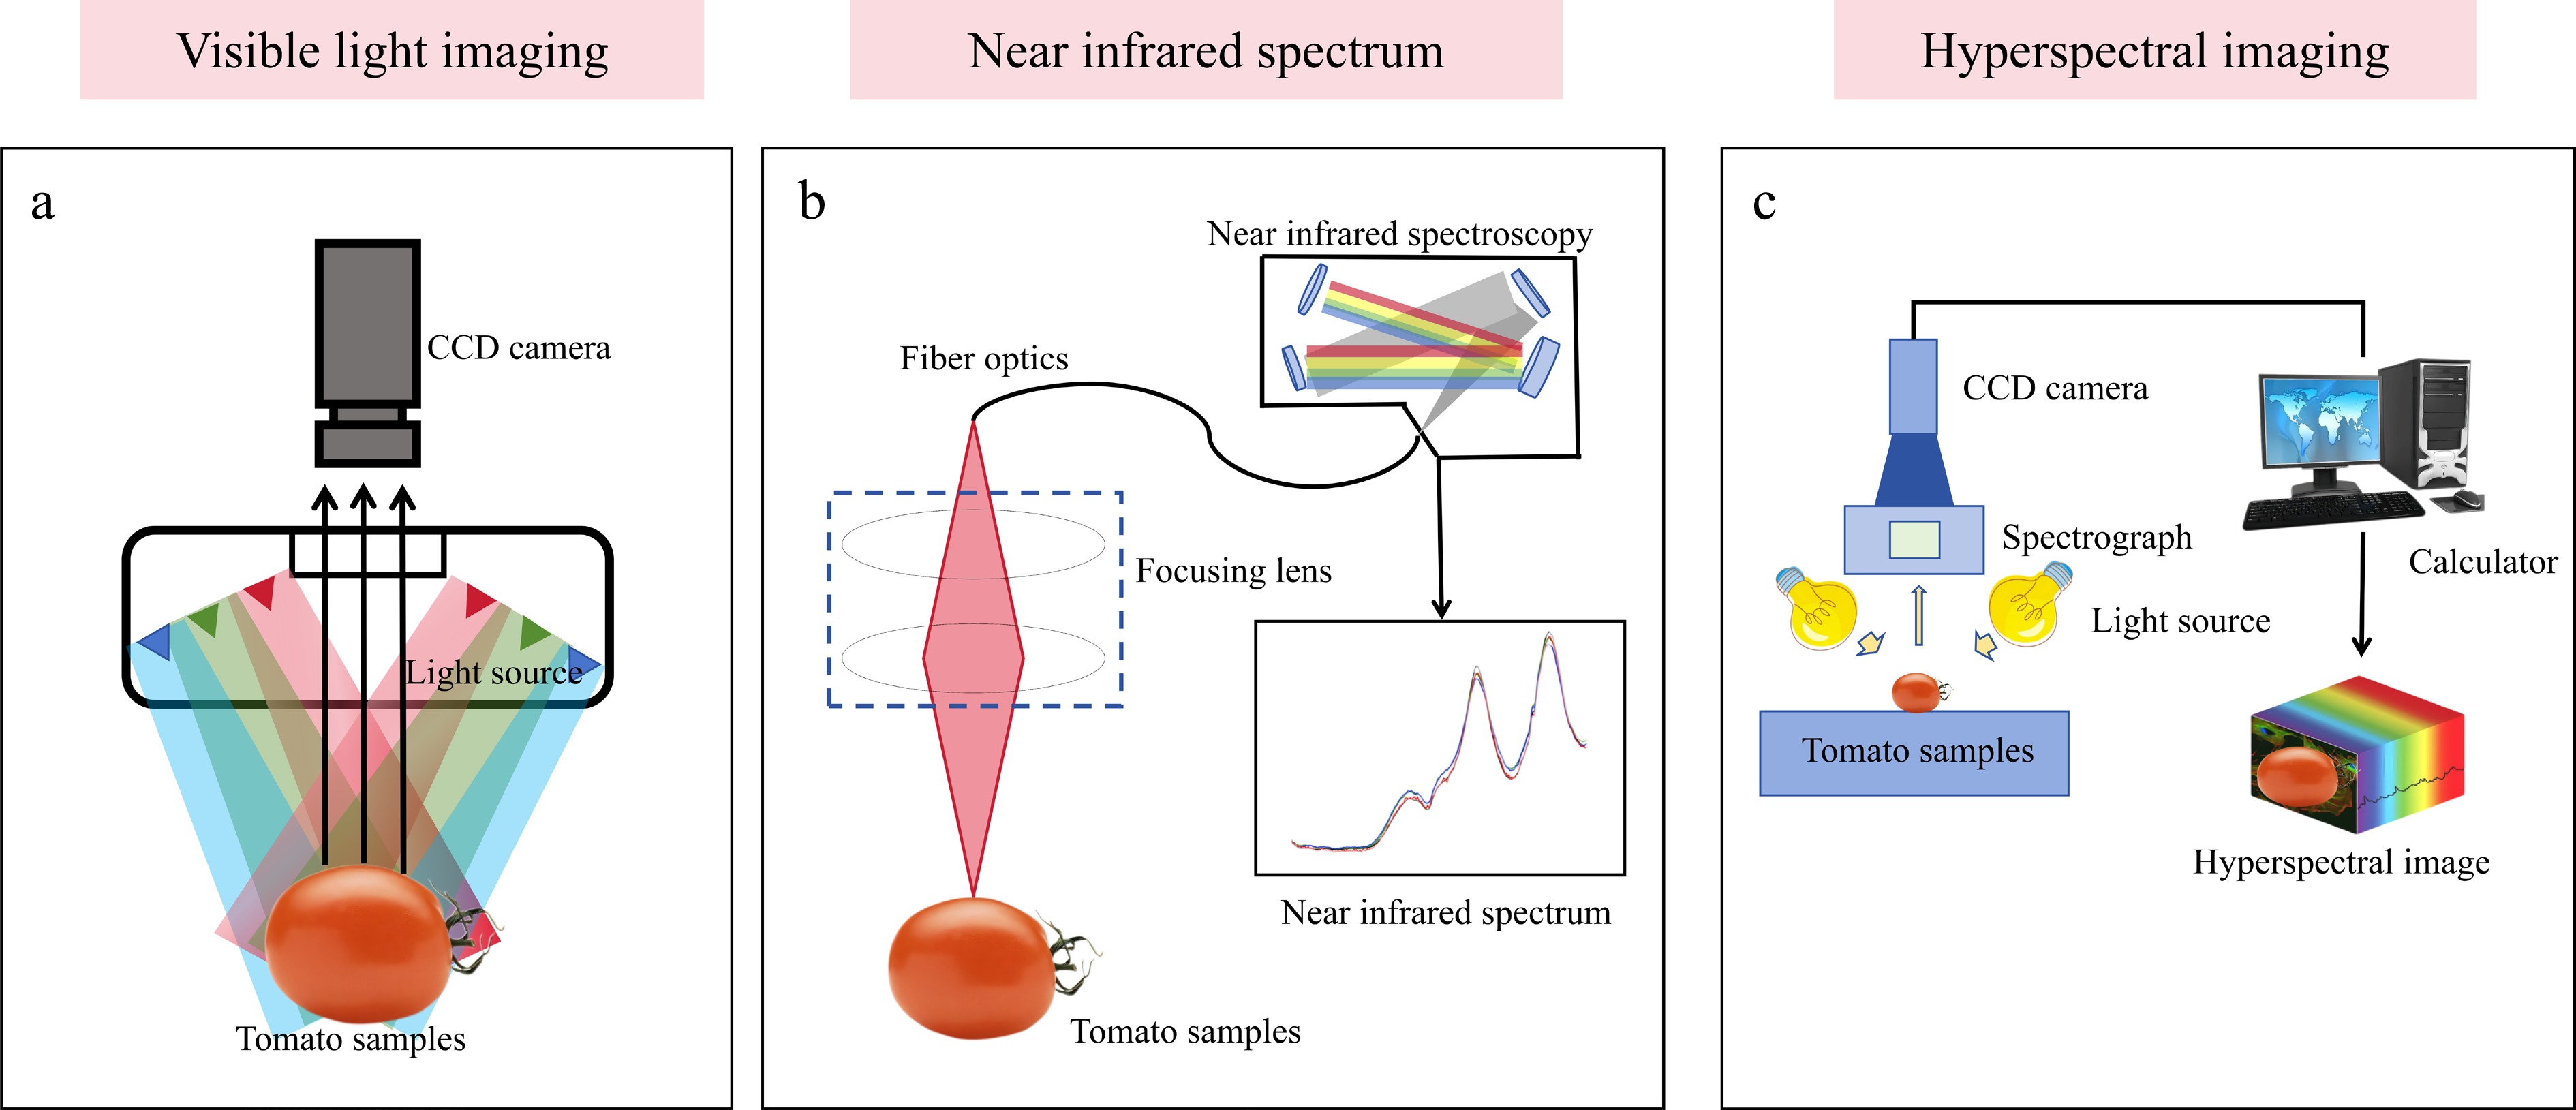
Figure 1.
Principle and system configuration of three optical sensing techniques: (a) Visible light imaging, (b) near-infrared spectroscopy, and (c) hyperspectral imaging.
-
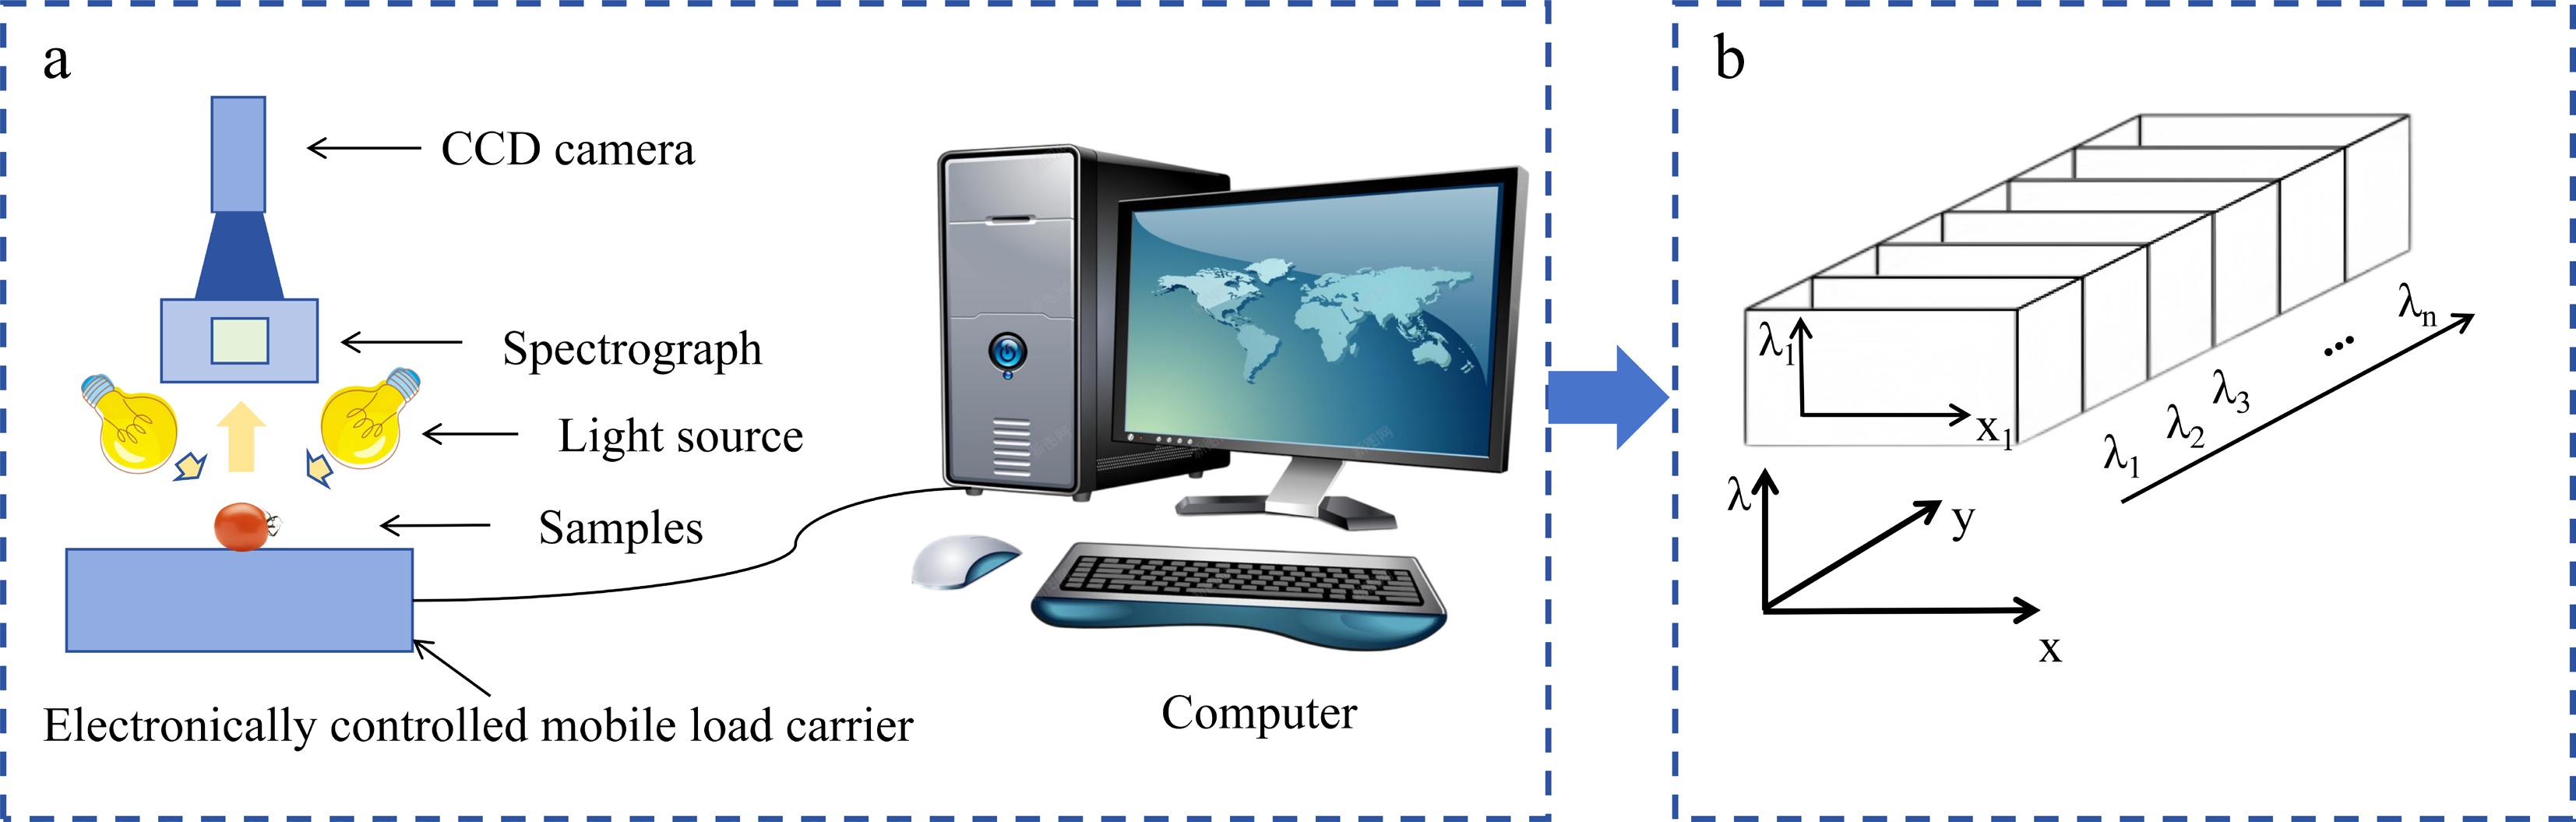
Figure 2.
Schematic diagram of the working principle of a hyperspectral imaging system. (a) Schematic diagram of system optical path and components. (b) Schematic diagram of hyperspectral data cube.
-
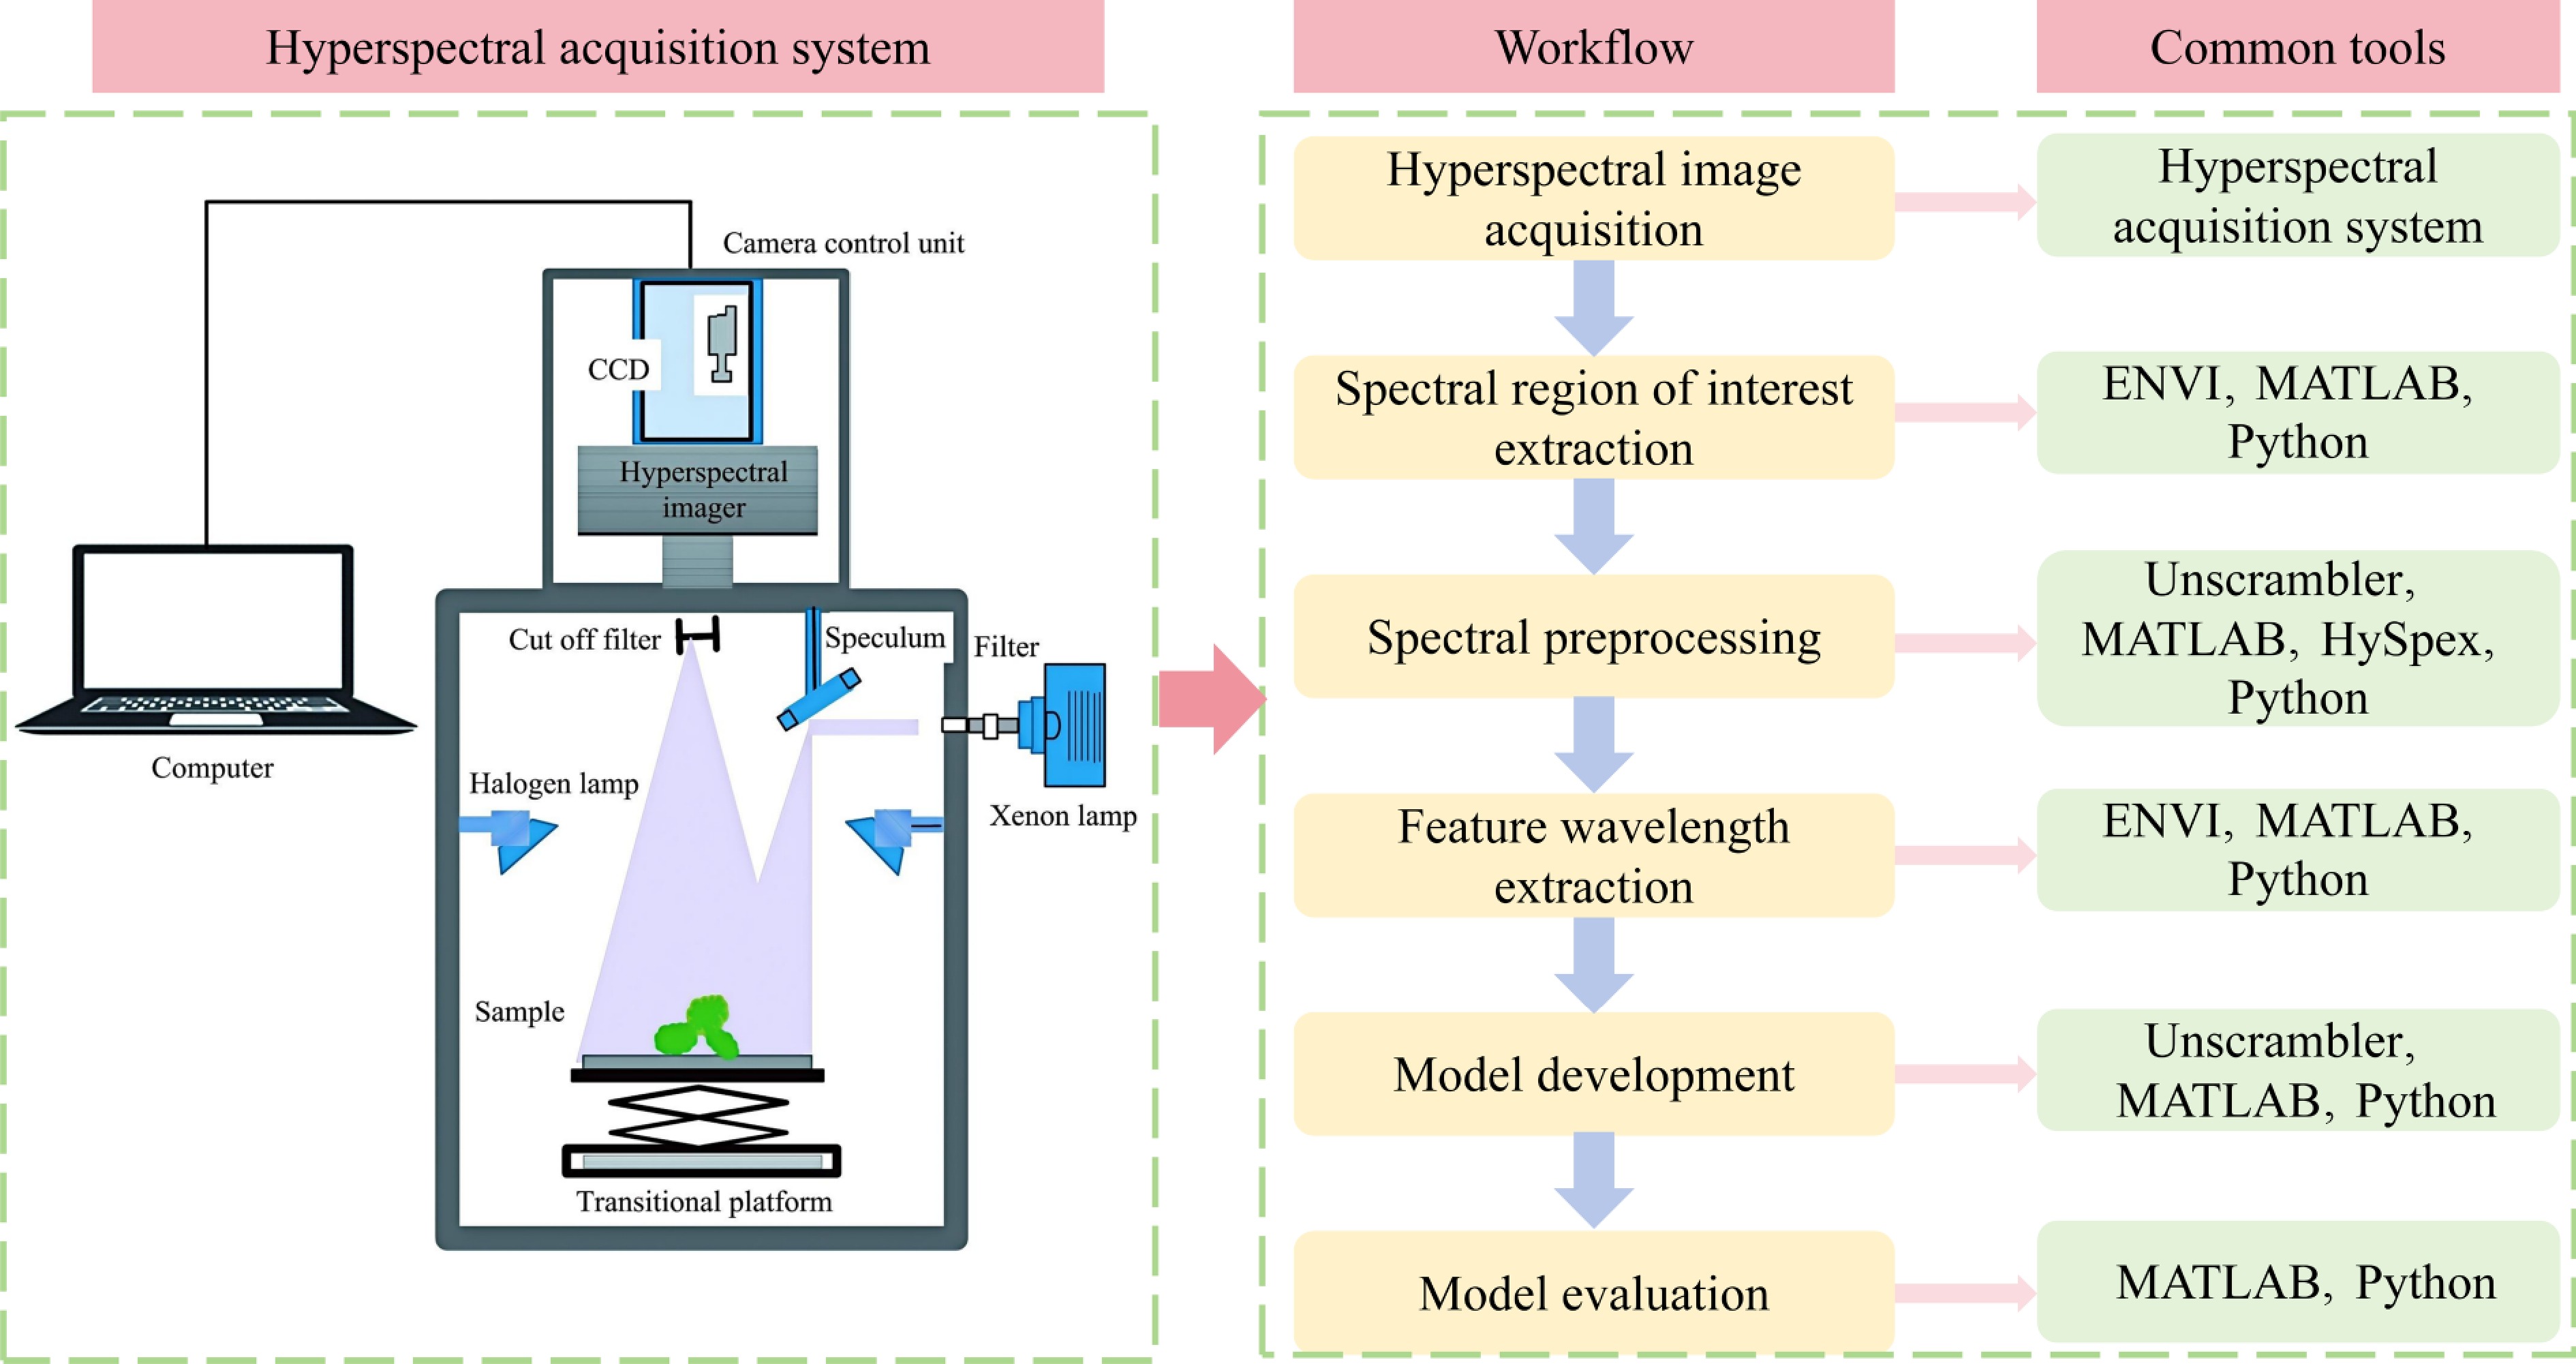
Figure 3.
Hyperspectral imaging technology workflow.
-
Technology type Visible light imaging Near-infrared spectroscopy Hyperspectral imaging Equipment composition Charge-coupled device (CCD) camera, light source, sample Optical fiber, focusing lens, near-infrared spectrometer, sample CCD camera, spectrometer, light source, sample, computer Working principle Collect visible light reflected by objects (400−700 nm) Collect spectral information of objects in the near-infrared wavelength range
(700−2,500 nm)Simultaneously acquire spatial imagery and continuous spectral information to form a data cube Testing content Color, shape, surface defects Chemical composition (such as moisture content, sugar content, acidity) Image information combining spatial distribution and chemical composition Spatial resolution High (spatial information only) None (single-point or small-area measurement) High (spatial + spectral information) Spectral resolution Low (red–green–blue, three channels) High (continuous spectrum) Extremely high (hundreds of contiguous spectral bands) Data dimension 2D (spatial information + color information) 1D (single-point spectral information + chemical information) 3D (spatial information + spectral information + chemical imaging information) Output results Color photographs depicting the sample's appearance, color, texture, defects, and other surface characteristics. Single spectral curve reflecting the internal chemical composition of the sample (moisture, protein, etc.) Hyperspectral images + spectral curves for each pixel, simultaneously revealing the spatial distribution of surface defects and internal composition Primary application scenarios Visual inspection, sorting, size grading Rapid component detection, qualitative and quantitative analysis Fine-grained classification, detection of internal defects, visualization of the material distribution Advantages Low cost, simple operation, and strong real-time capability Capable of detecting internal components, nondestructive, fast Comprehensive information, simultaneous analysis of spatial and chemical properties, high sensitivity Disadvantages Unable to detect internal or chemical composition No spatial distribution information; requires contact or close-range measurement High cost, complex data processing, and slow acquisition speed Ref. [15,16] [17−19] [20−22] Table 1.
Comparative analysis of visible light imaging, near-infrared spectroscopy, and hyperspectral imaging technologies.
-
Imaging mode Scanning method Core optical components System configuration and data acquisition characteristics Typical application scenarios Ref. Spot scanning Spot scanning Single-point spectrometer Spectra are measured point by point using a 2D translation stage, then synthesized into images. The system's structure is relatively simple, but data acquisition is extremely slow, with a high signal-to-noise ratio. Laboratory-based precision spectral analysis of stationary samples, microscopic hyperspectral imaging [32,33] Pushbroom Line scan Grating/prism Spectral data are acquired line by line through continuous movement of the sample or camera; featuring high spatial resolution and excellent spectral resolution, this is the most popular mode. Aerial remote sensing, laboratory precision testing, agricultural product sorting lines [34,35] Gazing Surface scanning (spectral scanning) Tunable filter The camera remains stationary, capturing full-frame images across different wavelengths by rapidly switching filters; no moving parts are required, but spectral continuity is limited. Real-time dynamic monitoring, medical diagnosis [36,37] Snapshot-like Instantaneous imaging Image slicer/coding aperture Capture the complete spectral cube of the entire scene in a single exposure; no moving parts; suitable for transient processes, but spatial or spectral resolution may require
trade-offs.Biomedical imaging, industrial process monitoring [38,39] Table 2.
Primary hyperspectral imaging modes and characteristics of their system's configuration.
-
Modal technology Detection principle Key physiological parameters obtained How to address the limitations of
hyperspectral imagingExample application scenarios Thermal imaging Detect infrared radiation (thermal radiation)
emitted from the
surface of objectsCanopy/leaf temperature, used for inversion of stomatal conductance and transpiration rate Directly reflects stomatal behavior. Helps distinguish between ABA-induced stomatal closure and water stress directly caused by soil drought, which may exhibit similar patterns in hyperspectral water indices Precision irrigation decision-making, evaluation of ABA's drought resistance effects[66] Chlorophyll fluorescence imaging Detect the fluorescence
re-emitted by PSIIPhotochemical efficiency (Fv/Fm) and nonphotochemical quenching (NPQ) reflect the real-time functional state of the photosynthetic apparatus Directly detect photosynthetic physiological states. This aids in distinguishing whether the causes of red edge blue shift and pigment changes in the stem from ABA inhibition, light stress, or senescence (ethylene), which may overlap with hyperspectral reflectance features Early warning of stress, mechanistic study of hormones' effects on photosynthesis[67] LiDAR Emit laser pulses and measure the reflection time to generate a
three-dimensional
point cloud.Canopy height, LAI, vertical structural distribution, biomass Provides precise 3D structural quantification. Assists in distinguishing the relative contributions of auxin (primarily altering cell structure) and gibberellin (significantly increasing biomass and LAI) to the effects on
NIR reflectanceCrop growth monitoring, biomass estimation, plant architecture analysis[68] Hyperspectral fluorescence Detection of chlorophyll fluorescence emission in the red to far infrared wavelength range Chlorophyll fluorescence yield under sunlight is closely related to the electron transport chain and carbon assimilation Provides an independent data dimension that is highly sensitive to photosynthetic metabolism and fundamentally different from reflectance spectra Monitor photosynthetic function on a large scale to evaluate the impact of hormones on crops' productivity[69] Gas exchange measurement Measurement of CO2 and H2O flux variations within
a sealed chamberNet photosynthetic rate, transpiration rate, stomatal conductance (direct measurements) Provide ground truth values serving as the gold standard for leaves' physiological functions. Used for calibrating and validating model parameters derived from hyperspectral, thermal imaging, and other inversion techniques Construction of a mechanism model and benchmark validation for cross-modal data fusion[70] Table 3.
Multimodal sensing technologies for enhancing diagnostic specificity of hormonal effects in hyperspectral imaging.
-
Model category Representative algorithm Core principles and features Key advantages Typical application scenarios Ref. Linear model Partial least squares regression (PLSR), principal component regression (PCR) Establish a mapping model based on the global linear assumption between the spectral features and target variables The model is simple, computationally efficient, and highly interpretable, making it suitable for analyzing small-sample data Preliminary quantitative analysis and trend assessment of single hormones' effects under controlled conditions [76,77] Nonlinear model Support vector regression (SVR), Gaussian process regression (GPR) Processing nonlinear relationships through kernel function mapping to find the optimal fitting hyperplane or probability distribution Suitable for nonlinear fitting with moderate sample sizes, offering superior generalization capabilities compared with simple linear models Scenarios where the hormone dose–response relationship is nonlinear or where moderate background interference is present [78,79] Machine learning model Random forest (RF), gradient boosting machine (GBM) Integrating multiple decision trees to make predictions through voting or weighting; excels at handling high-dimensional features Strong antioverfitting capability, insensitive to noise, capable of assessing features' importance, and excellent generalization performance Prediction of hormone levels or classification of stress states under complex field conditions involving multiple factors [80] Deep learning model Convolutional neural networks (CNNs), recurrent neural networks (RNNs) Deep abstract representations that automatically extract spectral-spatial features through multilayer network architectures Possesses strong feature learning capabilities, enabling it to capture complex spatial patterns and contextual information Precision inversion (e.g., mapping hormones' spatial distribution), dynamic monitoring of time series, and large-scale data processing [81,82] Table 4.
Comparison of hyperspectral data analysis models for monitoring the effects of plant hormones.
Figures
(3)
Tables
(4)