-
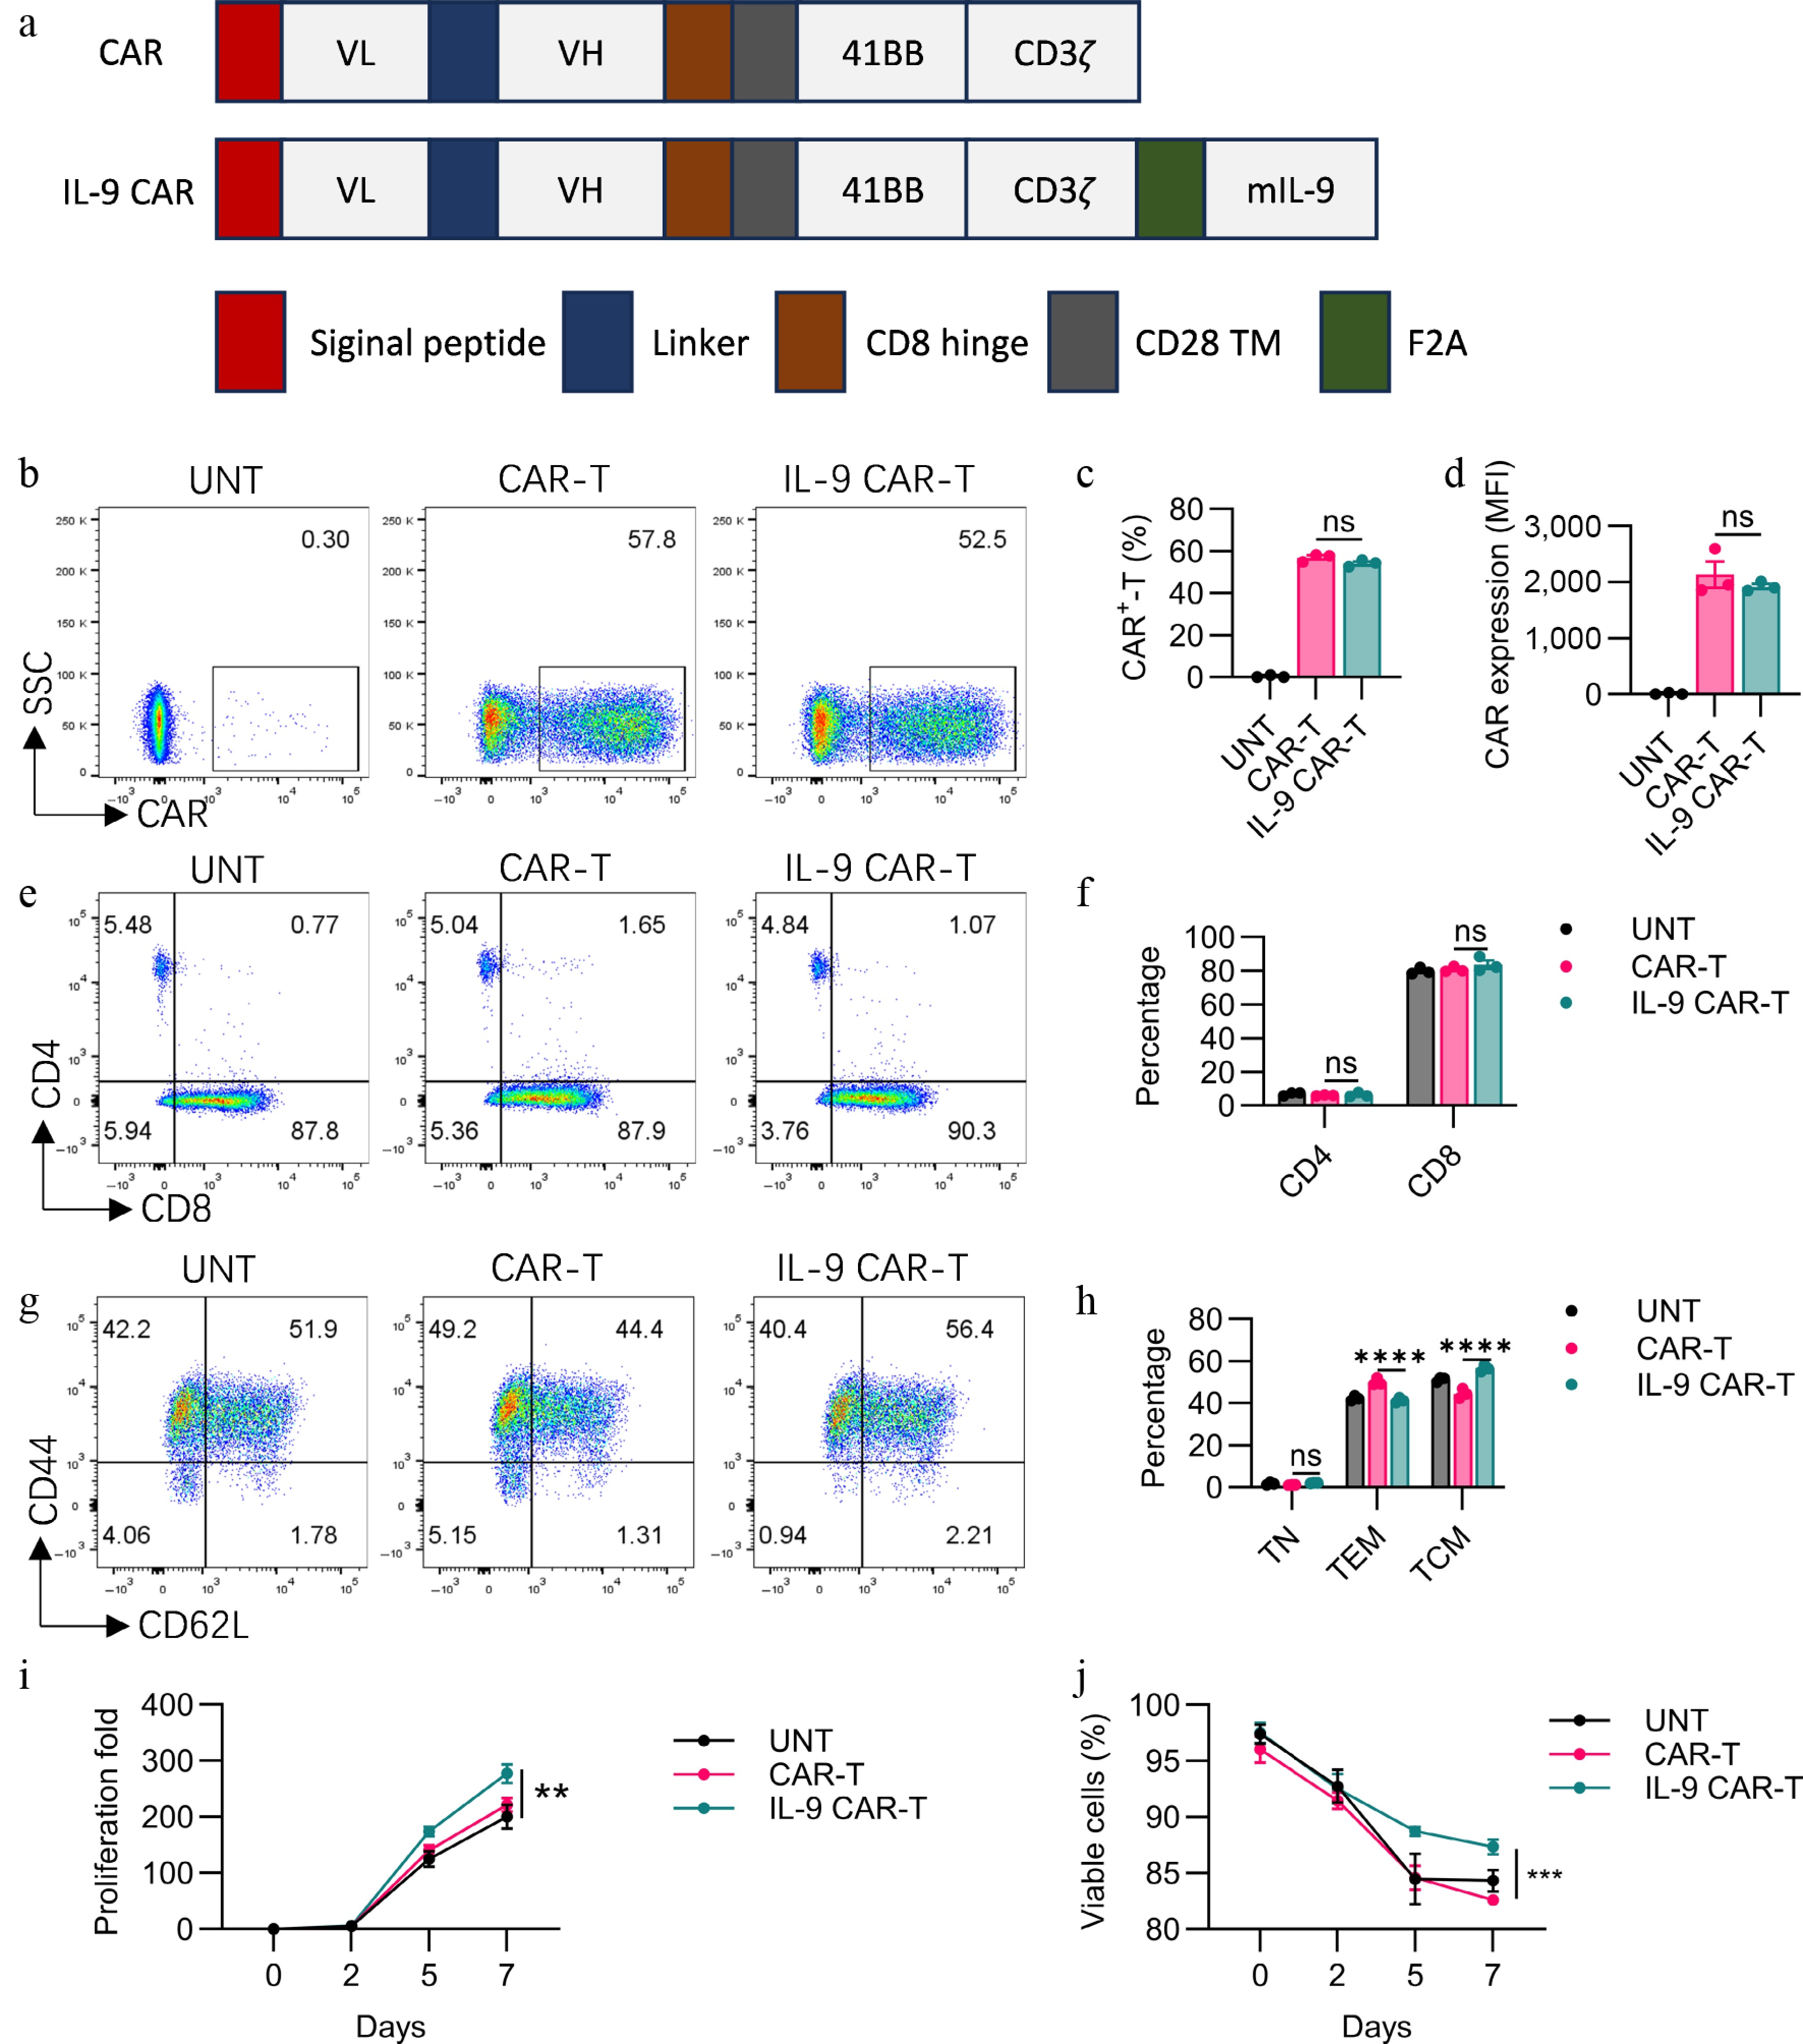
Figure 1.
Functional characterization of engineered IL-9-expressing anti-Claudin18.2 CAR-T cells. (a) Architecture of the conventional and cytokine-incorporated CAR retroviral constructs. CAR expression was validated by (b) flow cytometry, with the (c) transduction efficiency, and (d) expression level (MFI) quantified. The CD4/CD8 ratio within the CAR-T cell products was (e) analyzed, and (f) summarized. The immunophenotype defined by CD44 and CD62L expression is displayed in (g) representative plots, and (h) a cumulative bar graph. Proliferative capacity, (i) fold expansion, and (j) cell viability were tracked over time in culture. Results are representative of three independent experiments performed in triplicate (mean ± SEM; n = 3 biologically independent samples). Statistical notations: ns, p > 0.05; ** p < 0.01; *** p < 0.001; **** p < 0.0001.
-
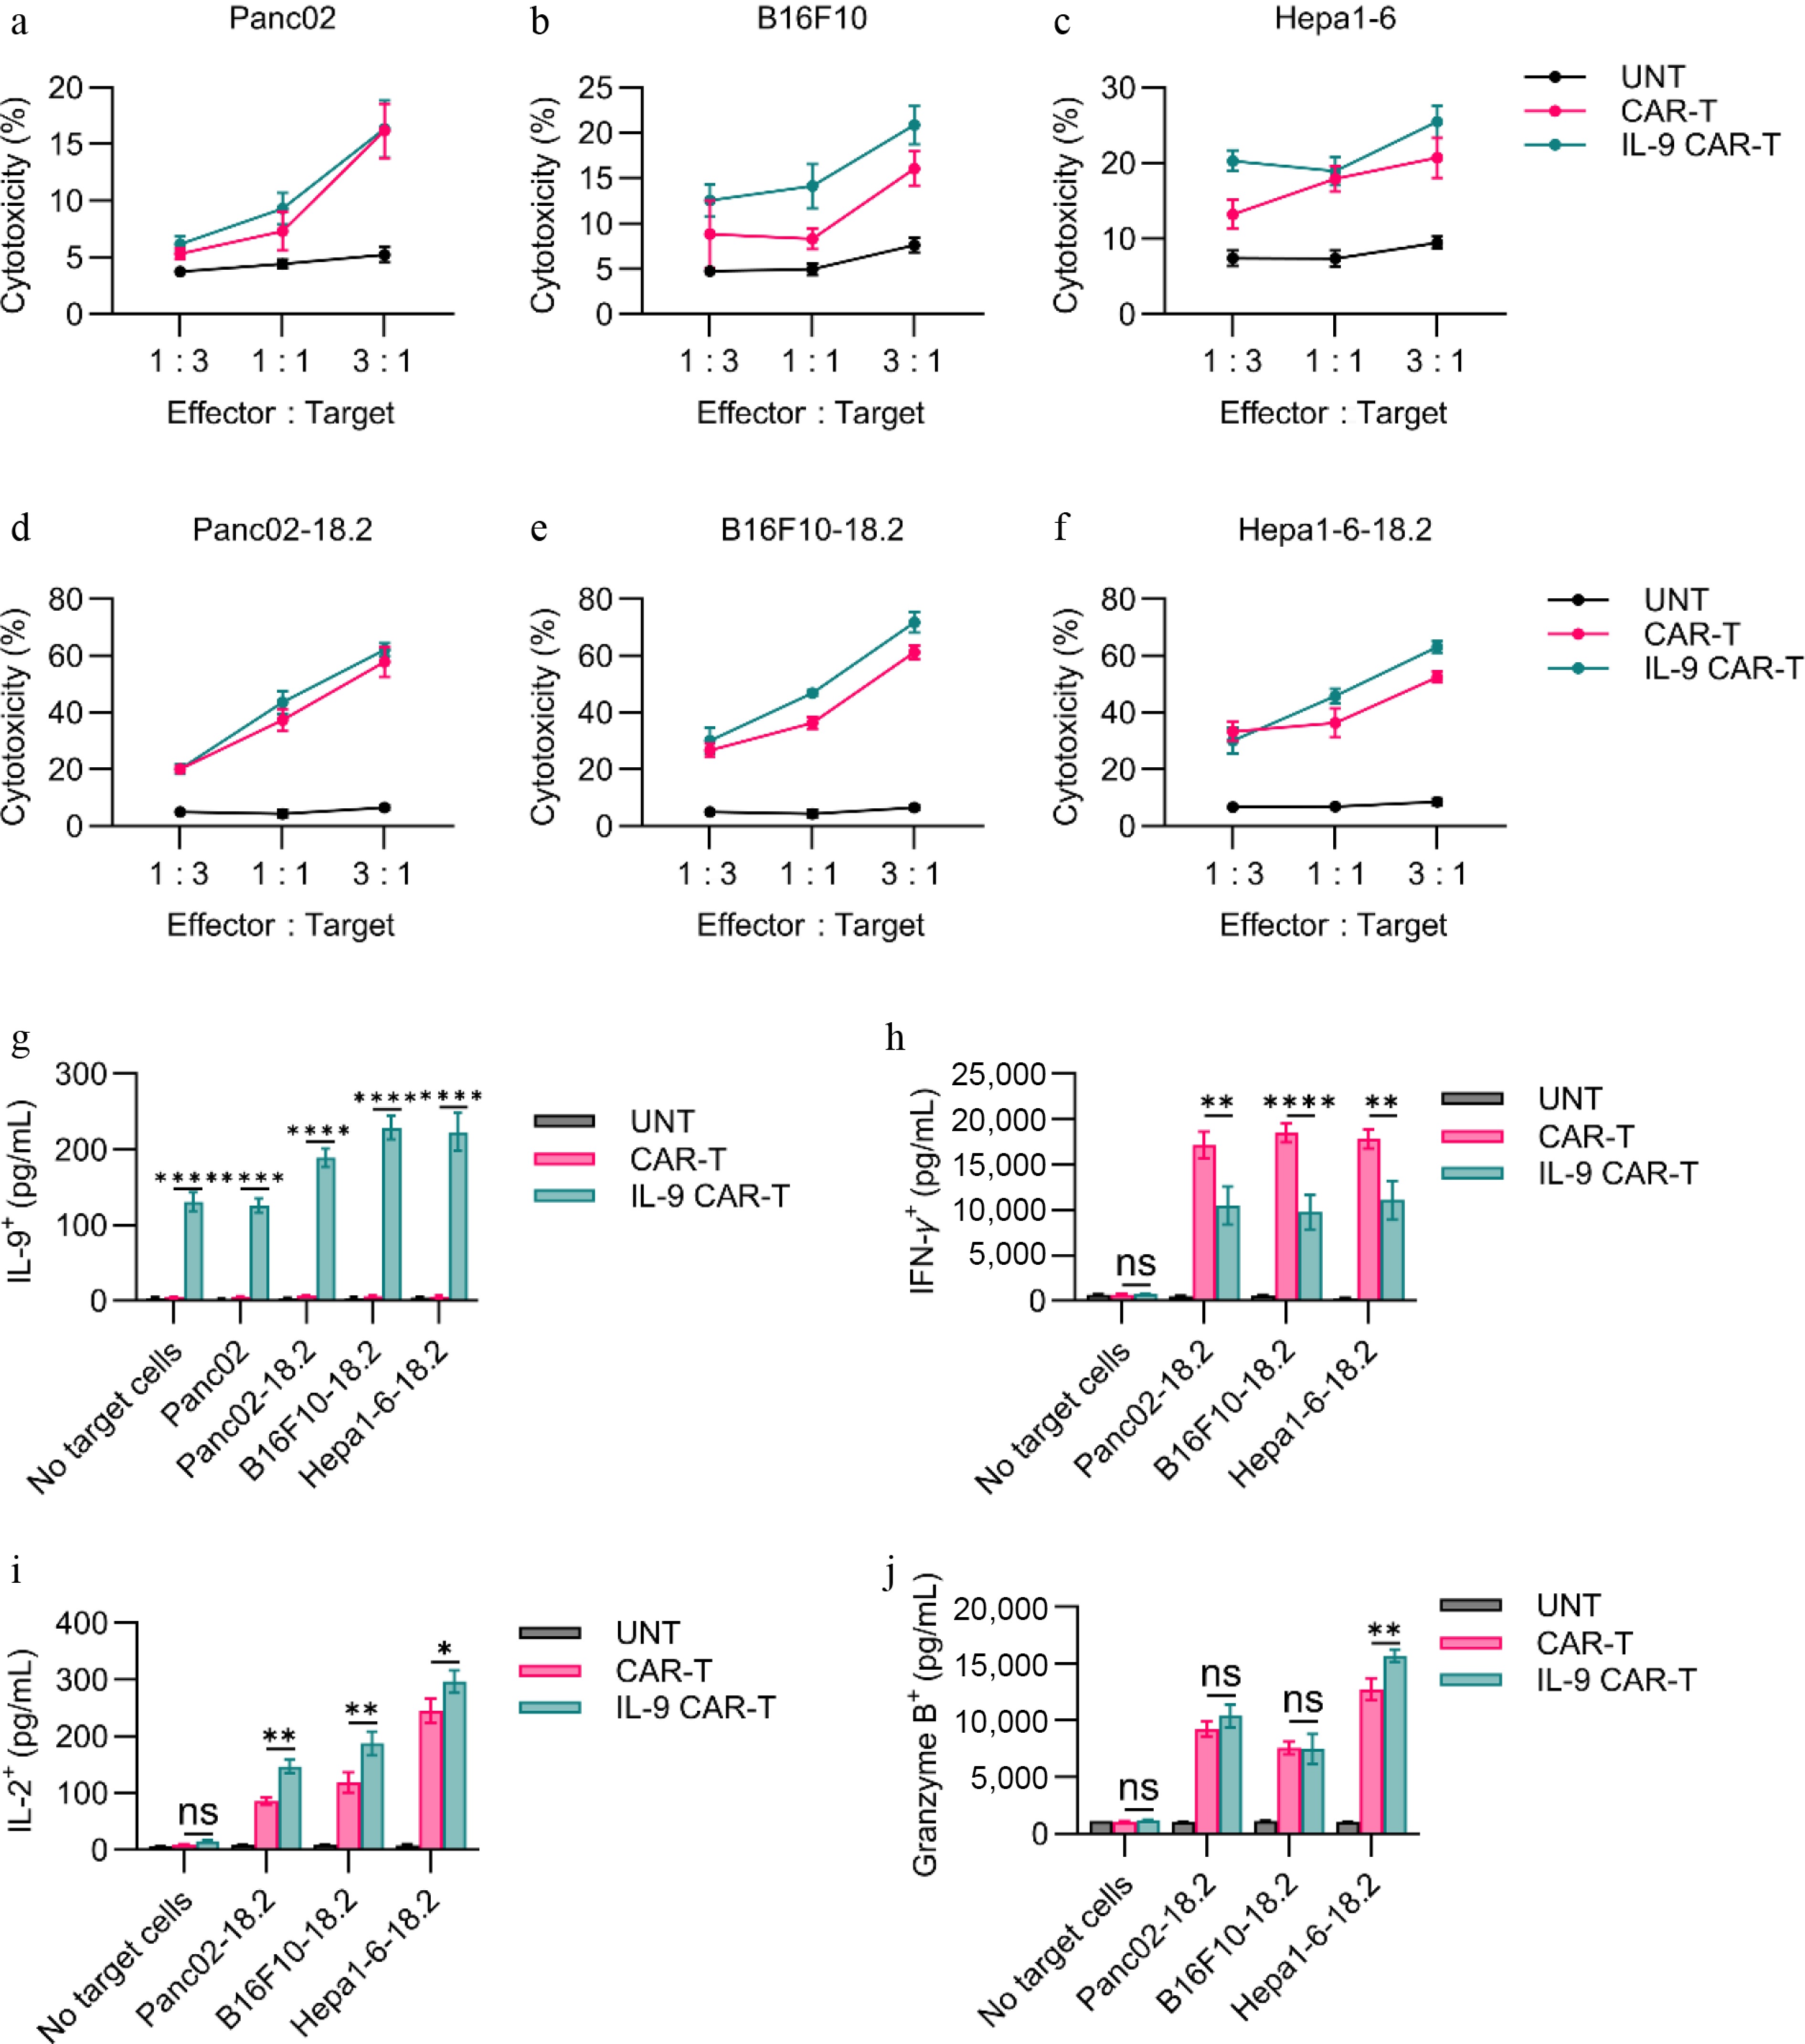
Figure 2.
In vitro functional assessment of CAR-T cells. (a)–(f) Cytotoxic activity of CAR-T cells against Claudin18.2-negative or Claudin18.2-overexpressing target cells was evaluated after 24 h of co-culture at various effector-to-target (E : T) ratios, using a standard non-radioactive cytotoxicity assay. (g)–(j) Production of IL-9, IFN-γ, Granzyme B, and IL-2 by CAR-T cells was measured by ELISA following 24-h co-culture with target cells at a 1:1 E : T ratio. Data are representative of at least three independent experiments performed in triplicate (n = 3 biologically independent samples), and presented as mean ± SEM. Statistical significance: ns, not significant (p > 0.05); * p < 0.05; ** p < 0.01; **** p < 0.0001.
-
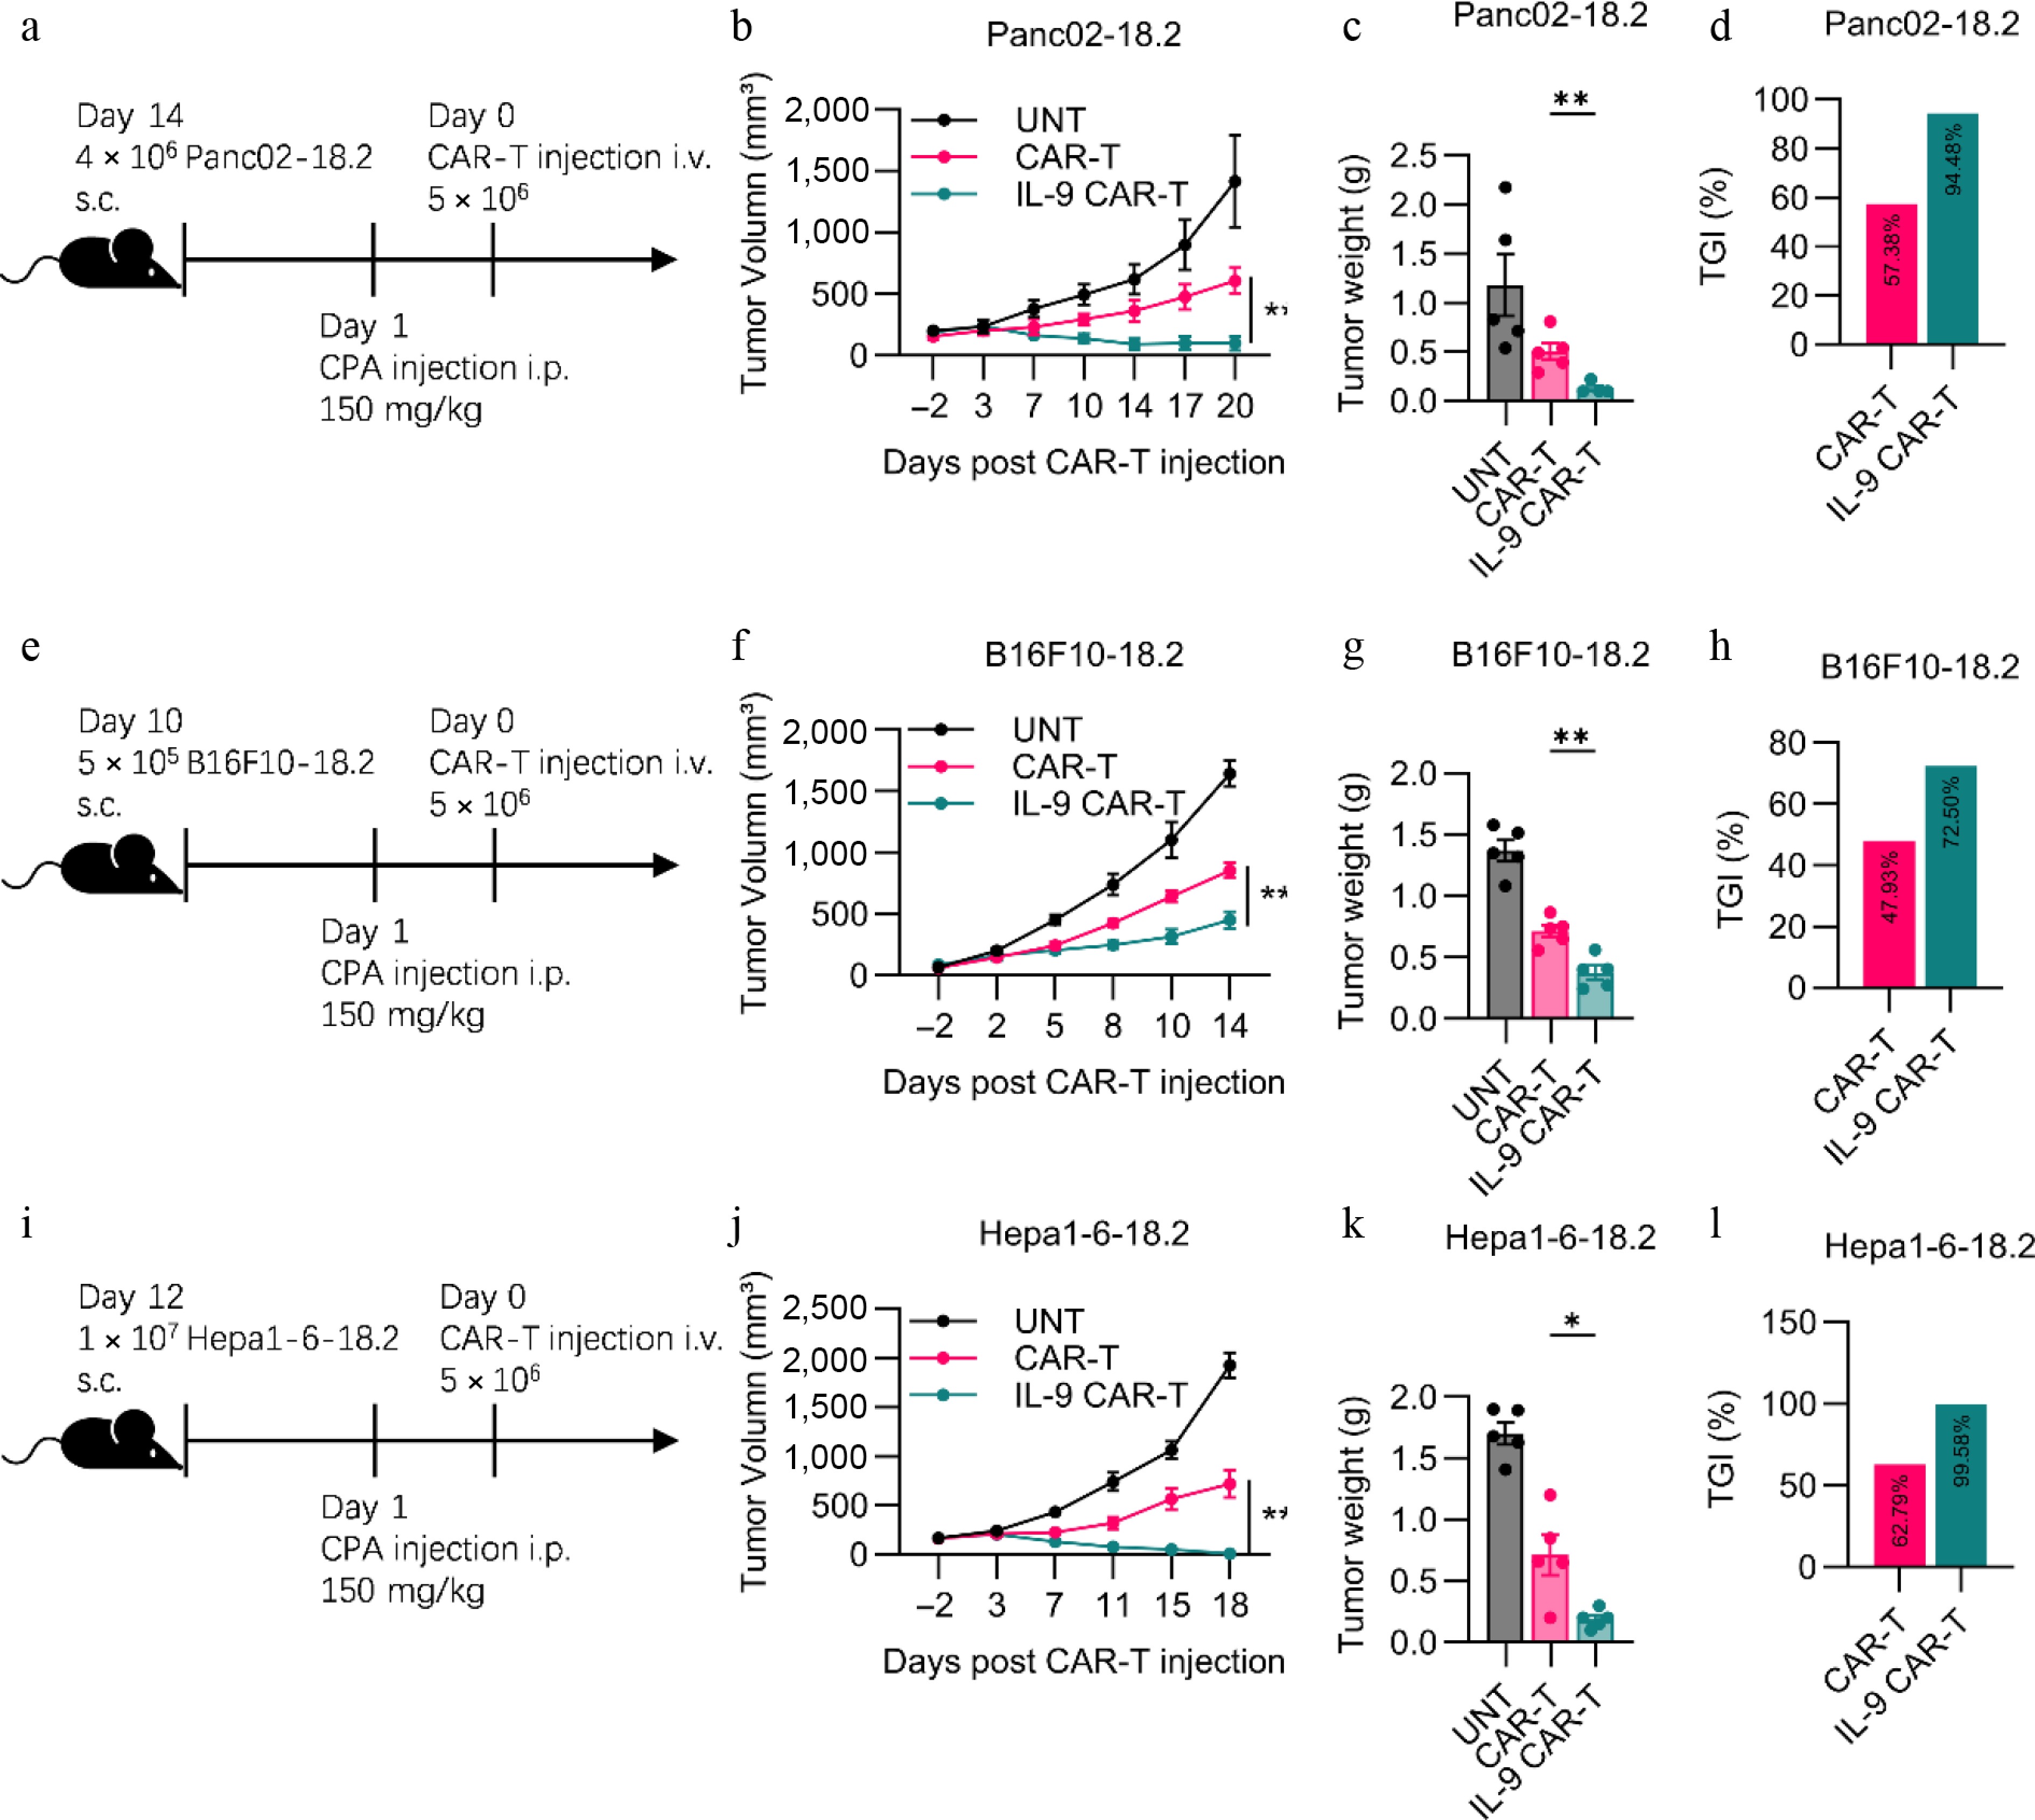
Figure 3.
Enhanced antitumor efficacy of IL-9-expressing CAR-T cells in immunocompetent solid tumor models. (a) Experimental timeline for the Panc02-hClaudin18.2 pancreatic cancer model. Endpoint (b) tumor volume, (c) tumor weight, and (d) tumor growth inhibition (TGI) for the pancreatic cancer model. (e) Experimental timeline for the B16F10-hClaudin18.2 melanoma model. Endpoint (f) tumor volume, (g) tumor weight, and (h) TGI for the melanoma model. (i) Experimental timeline for the Hepa1-6-hClaudin18.2 liver cancer model. Experimental scheme of Hepa1-6-18.2 mouse liver solid tumor model in vivo antitumor experiment. (j) Histogram of the volume of tumors at the endpoint of the animal experiment. (k) Histogram of tumor weight at the endpoint of the animal experiment. (l) Histogram showed tumor growth inhibition of CAR-T cell treatment. All animal experiments were repeated more than twice with similar results. The results are expressed as the mean ± SEM. Statistical significance was defined as follows: p > 0.05; * p < 0.05; ** p < 0.01; *** p < 0.001.
-
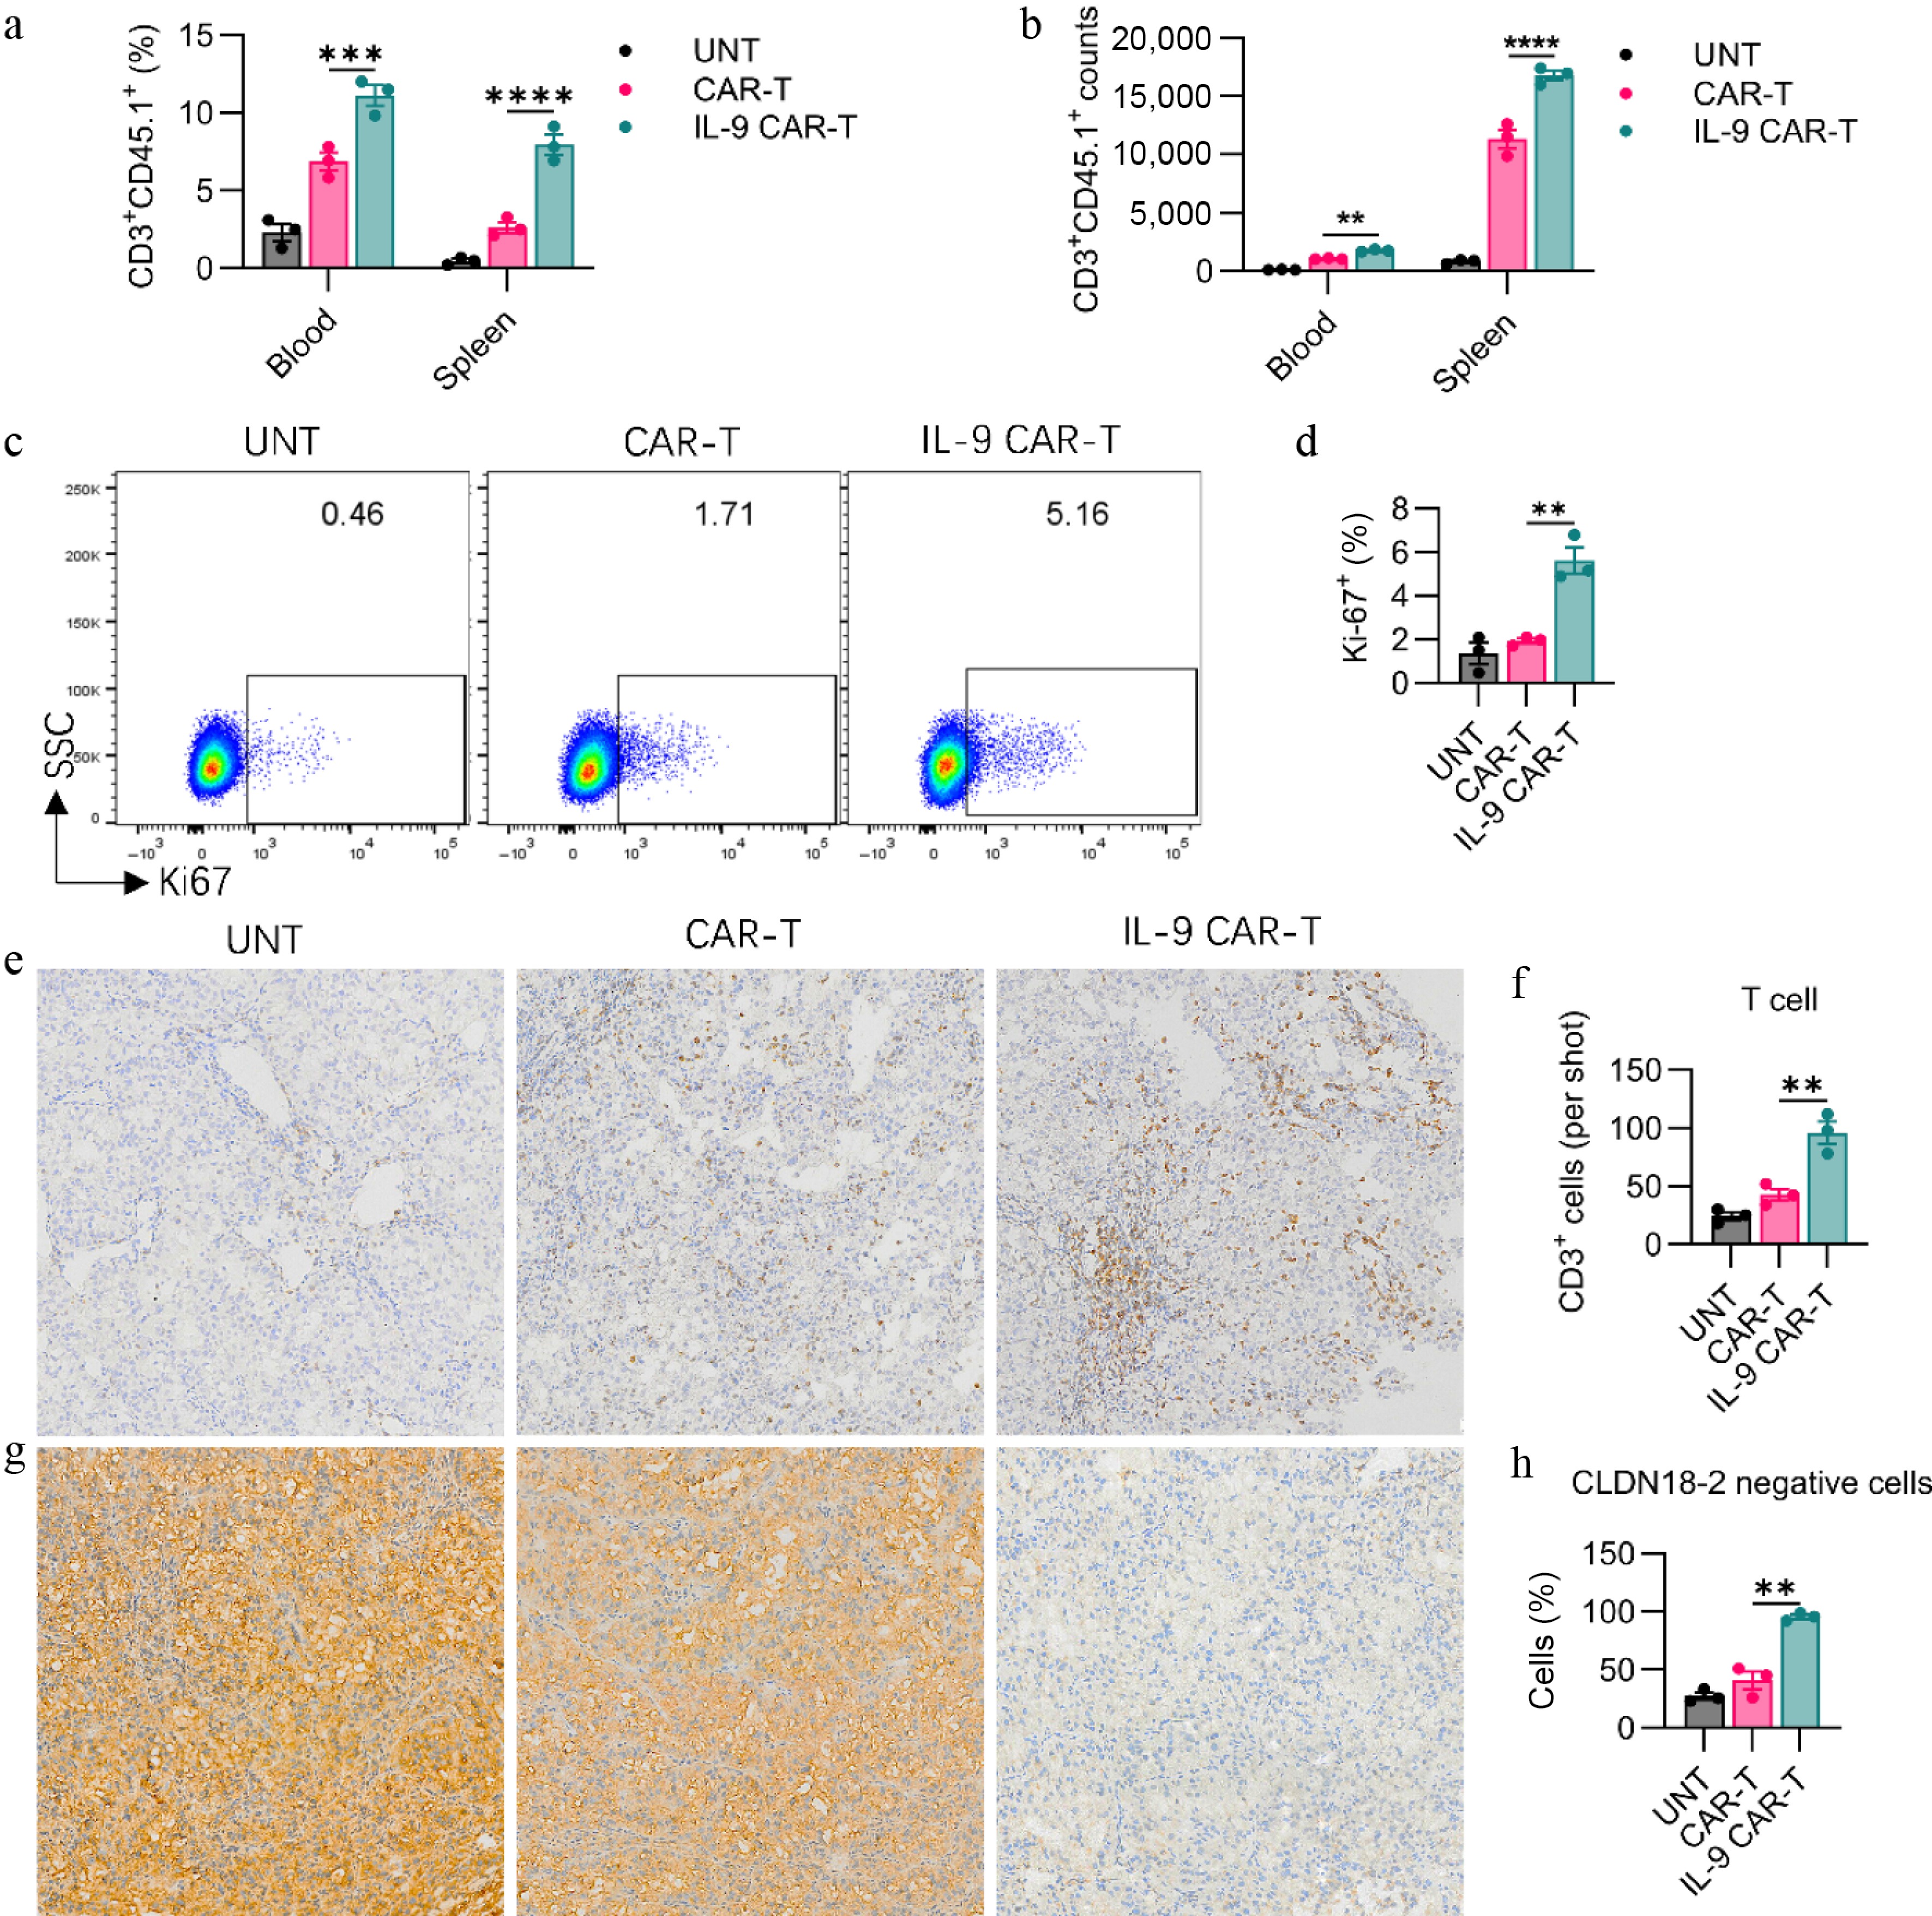
Figure 4.
IL-9 expression enhances CAR-T cell expansion, persistence, and tumor infiltration in vivo. The (a) percentage, and (b) absolute number of transferred CD3+CD45.1+ CAR-T cells in the blood and spleen of treated mice on day 7 post-infusion. Representative (c) flow cytometry plots and (d) quantification of Ki67 expression in CD3+CD45.1+ CAR-T cells from the spleen, indicating proliferating cells. Representative (e) immunohistochemistry (IHC) images (200× magnification), and (f) quantitative analysis of CD3+ T cell infiltration in tumor tissues on day 7. Representative (g) IHC images (200× magnification), and (h) quantification of Claudin 18.2 (Claudin18.2) expression in tumor tissues. Data in (a), (b), (d), (f), and (h) represent mean ± SEM (n = 3 mice per group). Significance: ns, not significant; ** p < 0.01; *** p < 0.001; ****p < 0.0001.
-
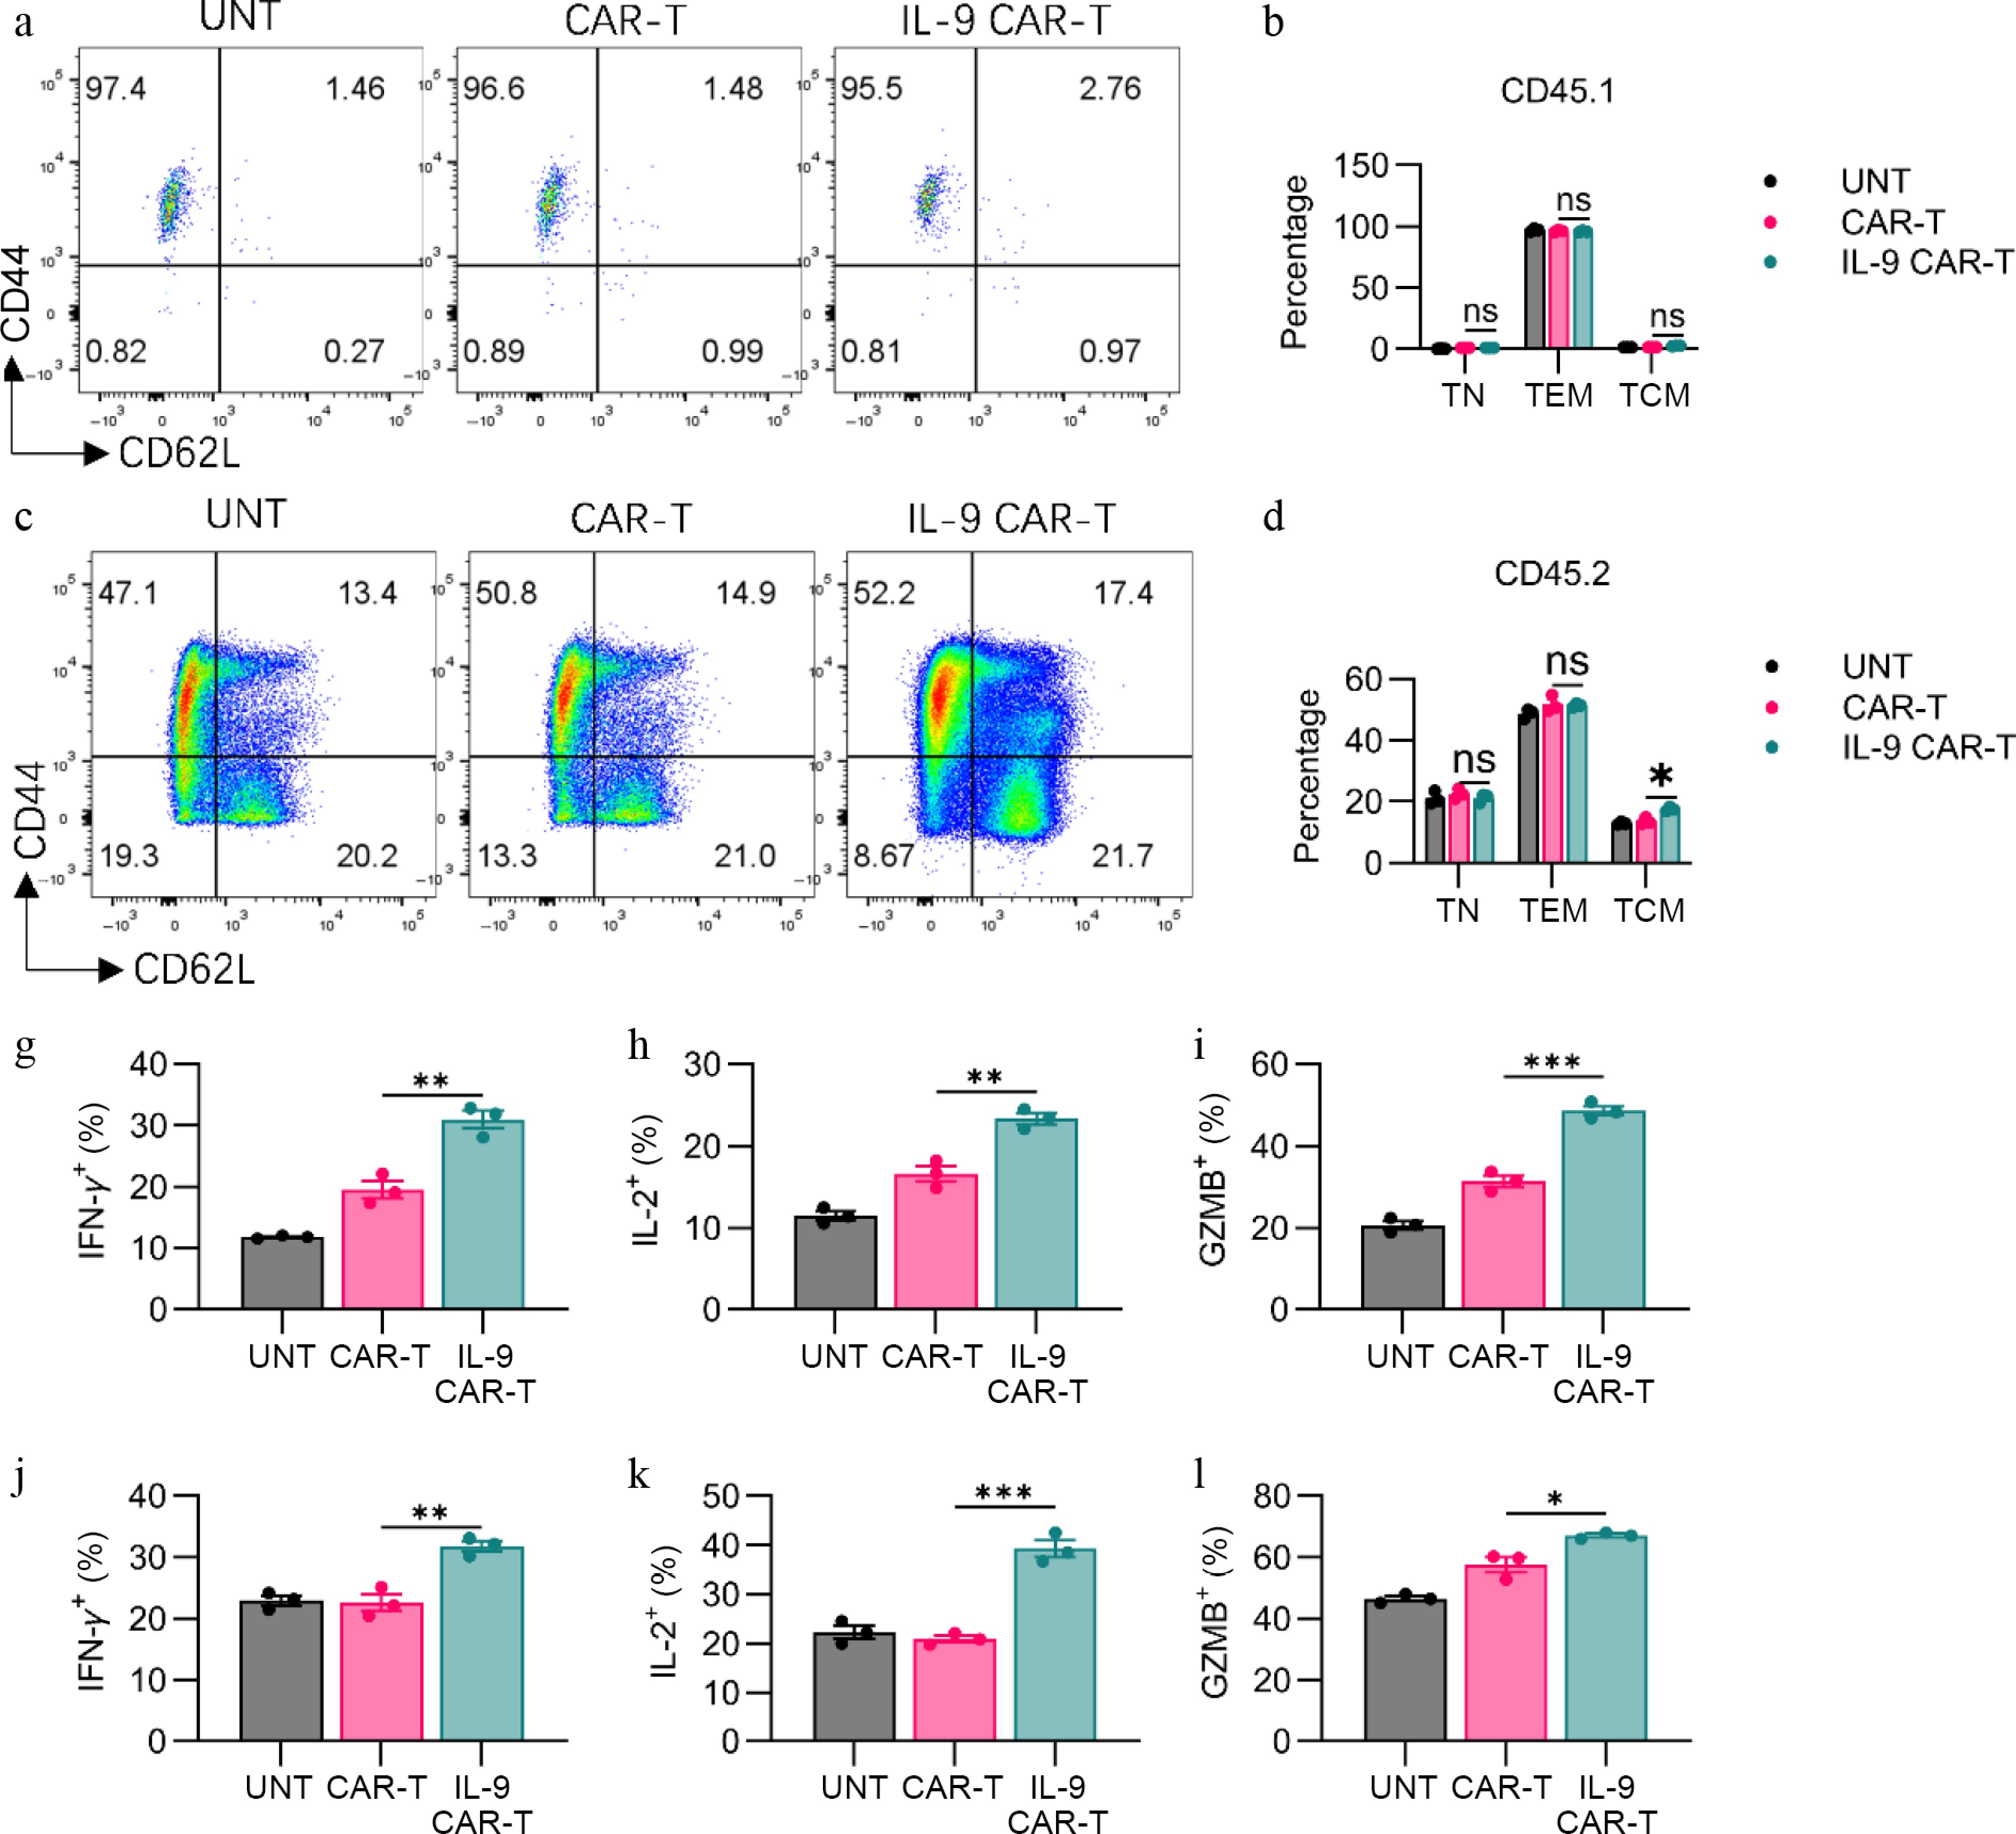
Figure 5.
IL-9 expression promoted the shift to memory phenotype and the anti-tumor efficacy of CAR-T cells. (a) Representative flow plots showed CD44 or CD62L expression on CD3+CD45.1+ T cells. (b) Histogram showing percentage of CD44 or CD62L expression on CD3+CD45.1+ T cells. (c) Representative flow plots showing CD44 or CD62L expression on CAR-T cells. (d) Histogram showing percentage of CD44 or CD62L expression on CD3+CD45.2+ T cells. Histogram showing percentage of (g) IFN-γ, (h) IL-2, and (i) granzyme B expression on CD3+CD45.1+ T cells. Histogram showing percentage of (j) IFN-γ, (k) IL-2, and (l) granzyme B expression on CD3+CD45.2+ T cells. The results are expressed as the mean ± SEM. Statistical significance was defined as follows: ns, not significant, p > 0.05; * p < 0.05; ** p < 0.01; *** p < 0.001.
Figures
(5)
Tables
(0)