-
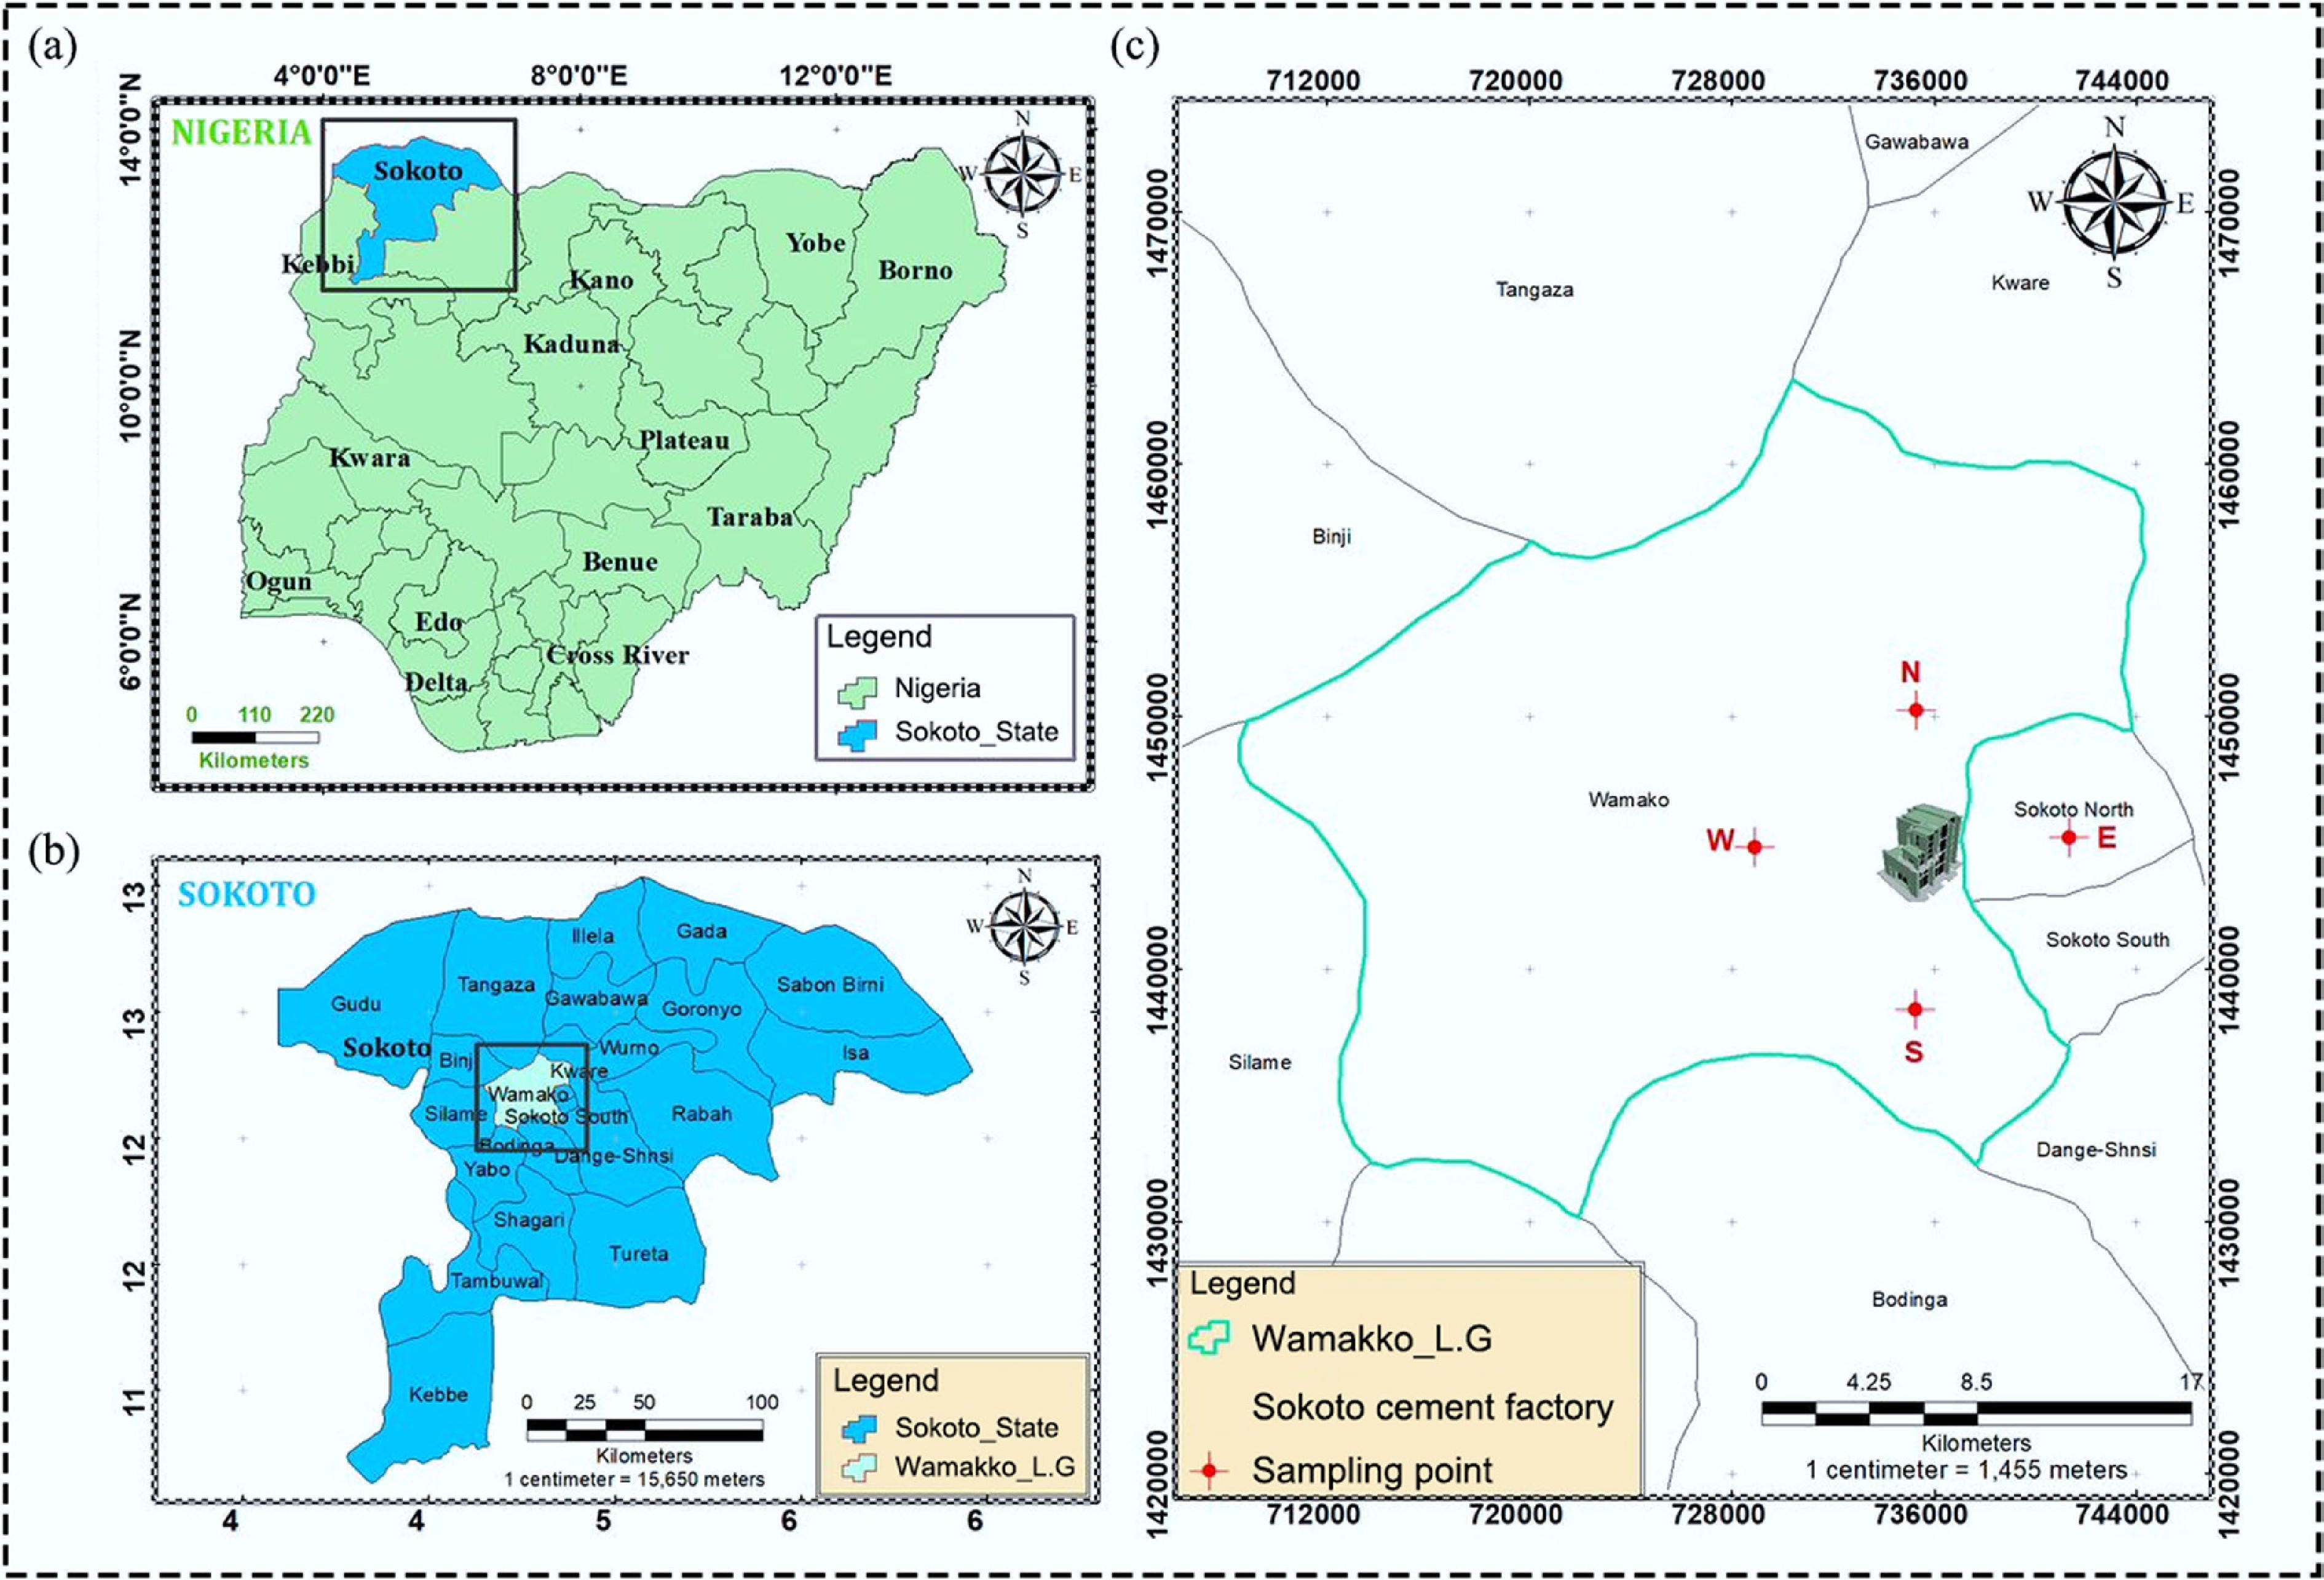
Figure 1.
Map of the study area showing (a) Nigeria, (b) Sokoto State, and (c) sampling points (drawn using ArcGIS 10.3 software).
-
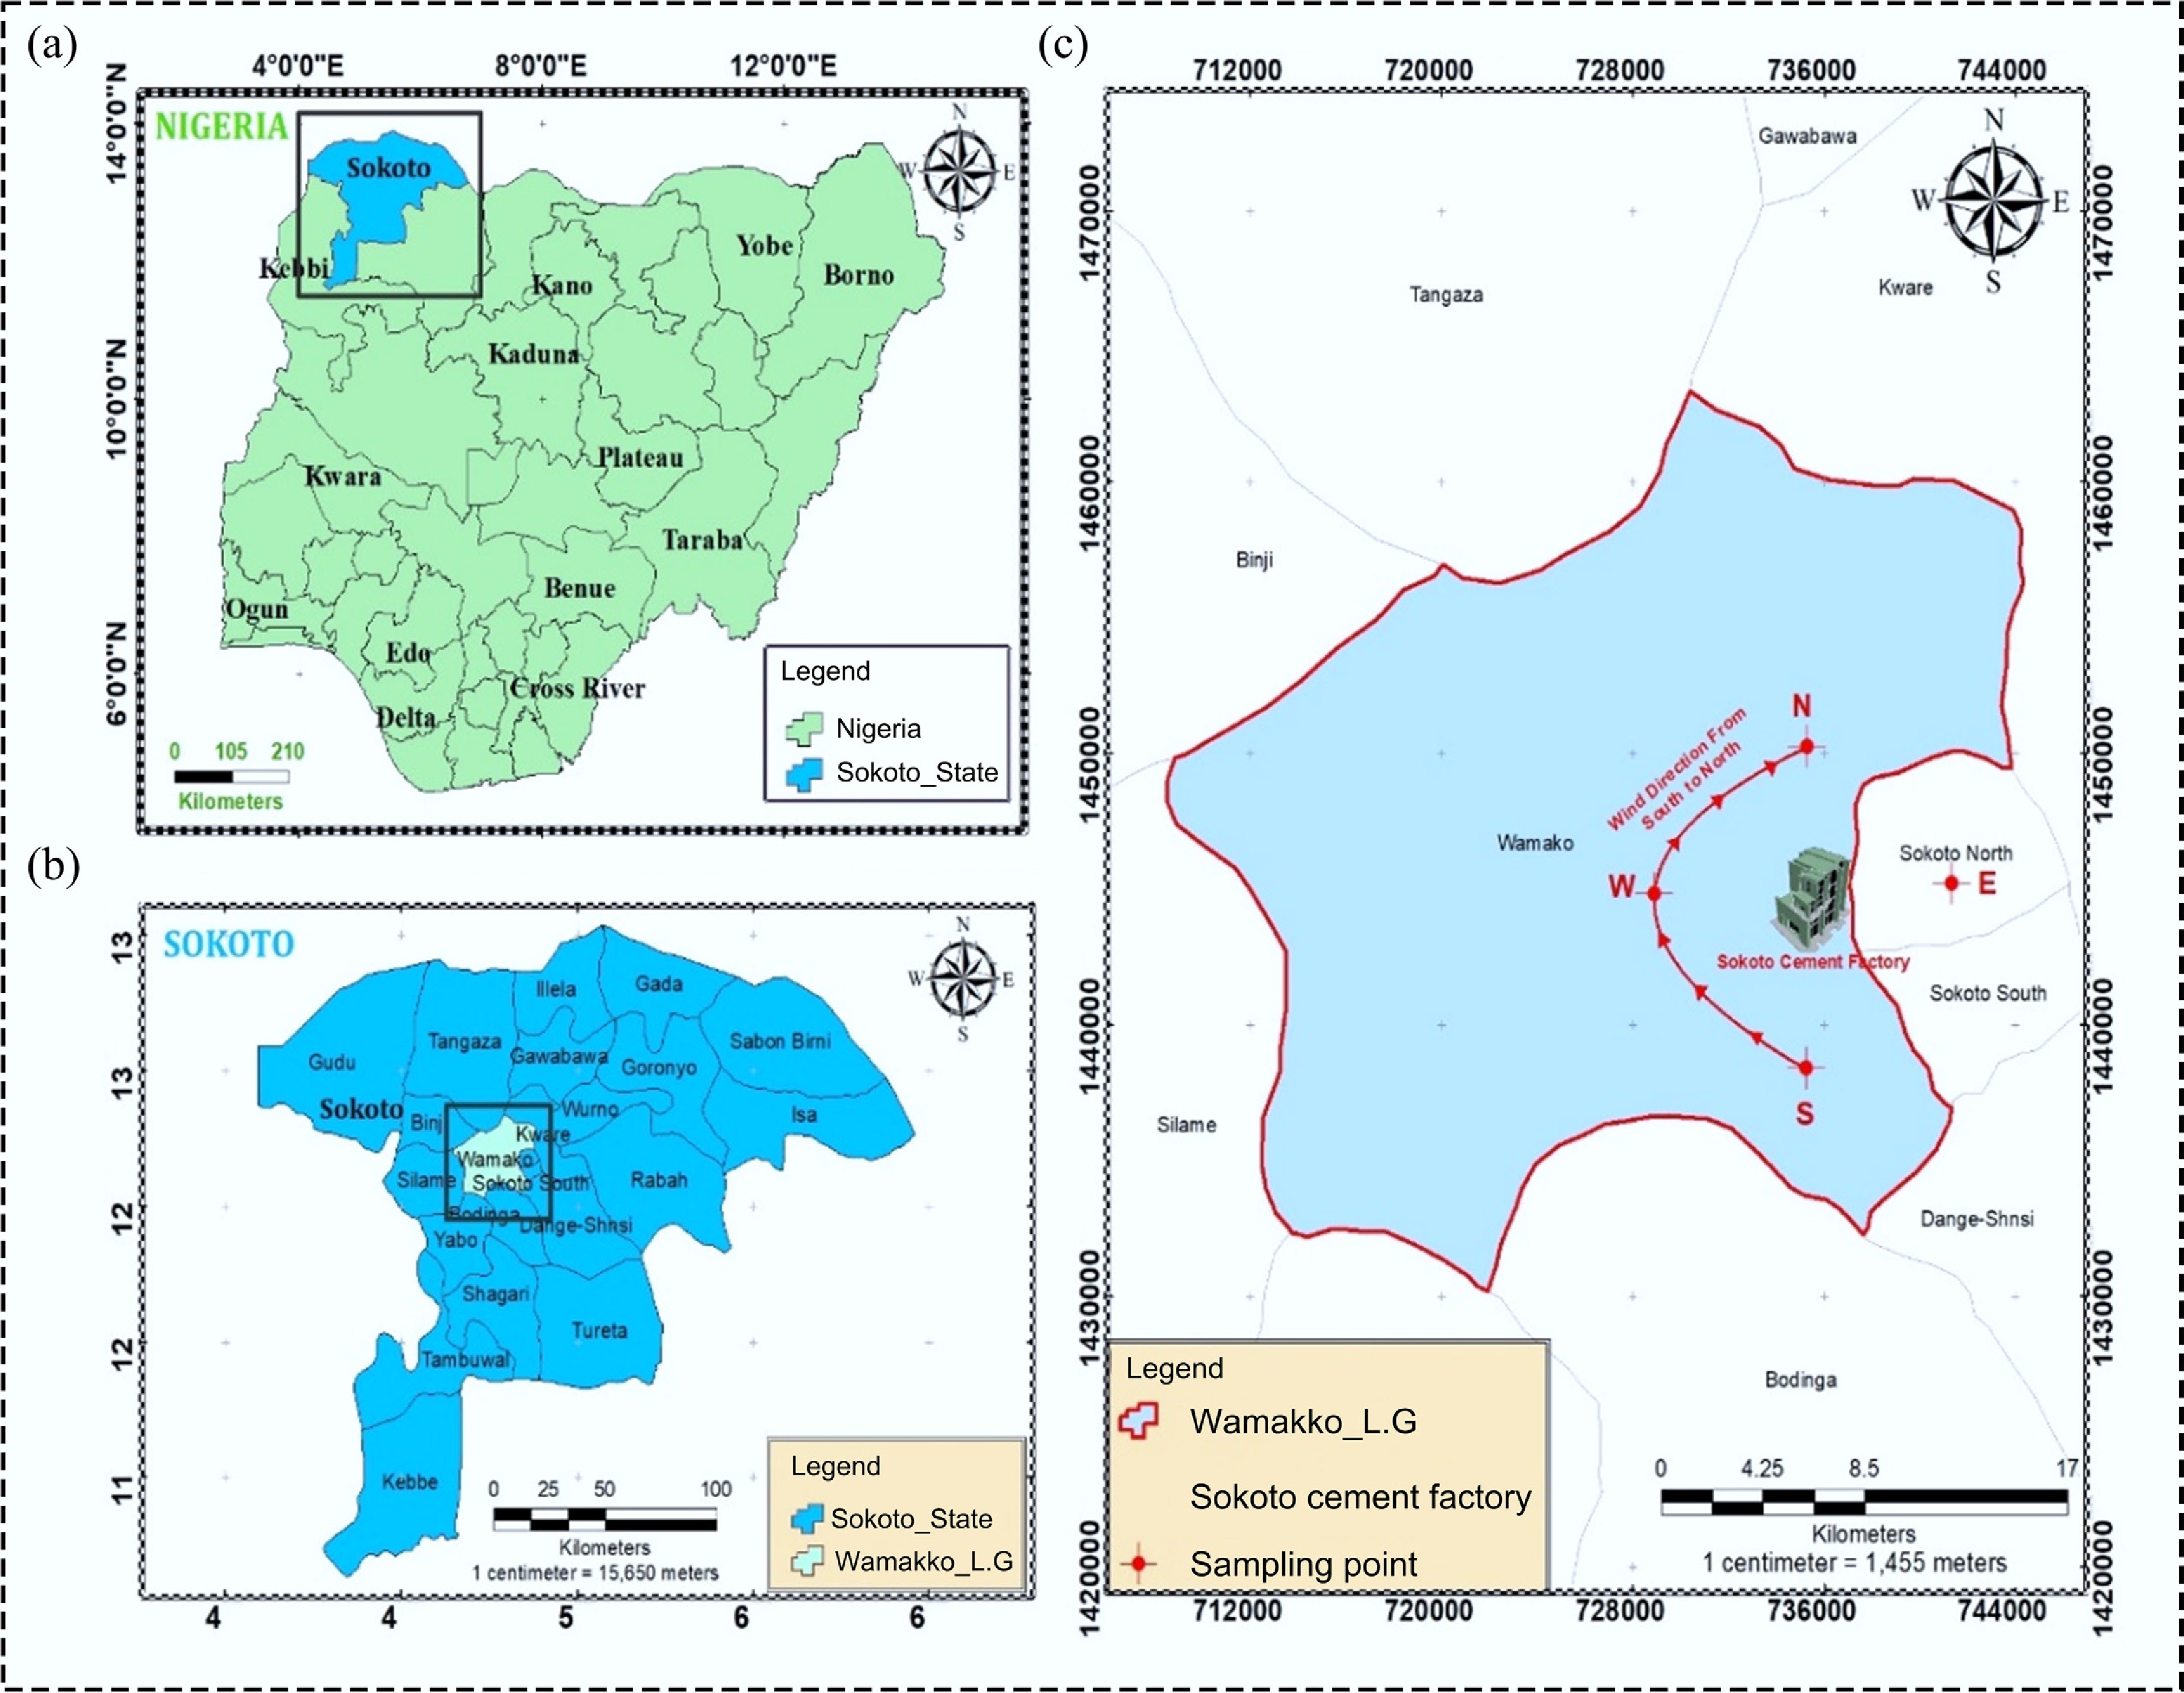
Figure 2.
Map showing wind direction during the study period. (a) Nigeria, (b) Sokoto State, and (c) sampling points (drawn using ArcGIS 10.3 software).
-
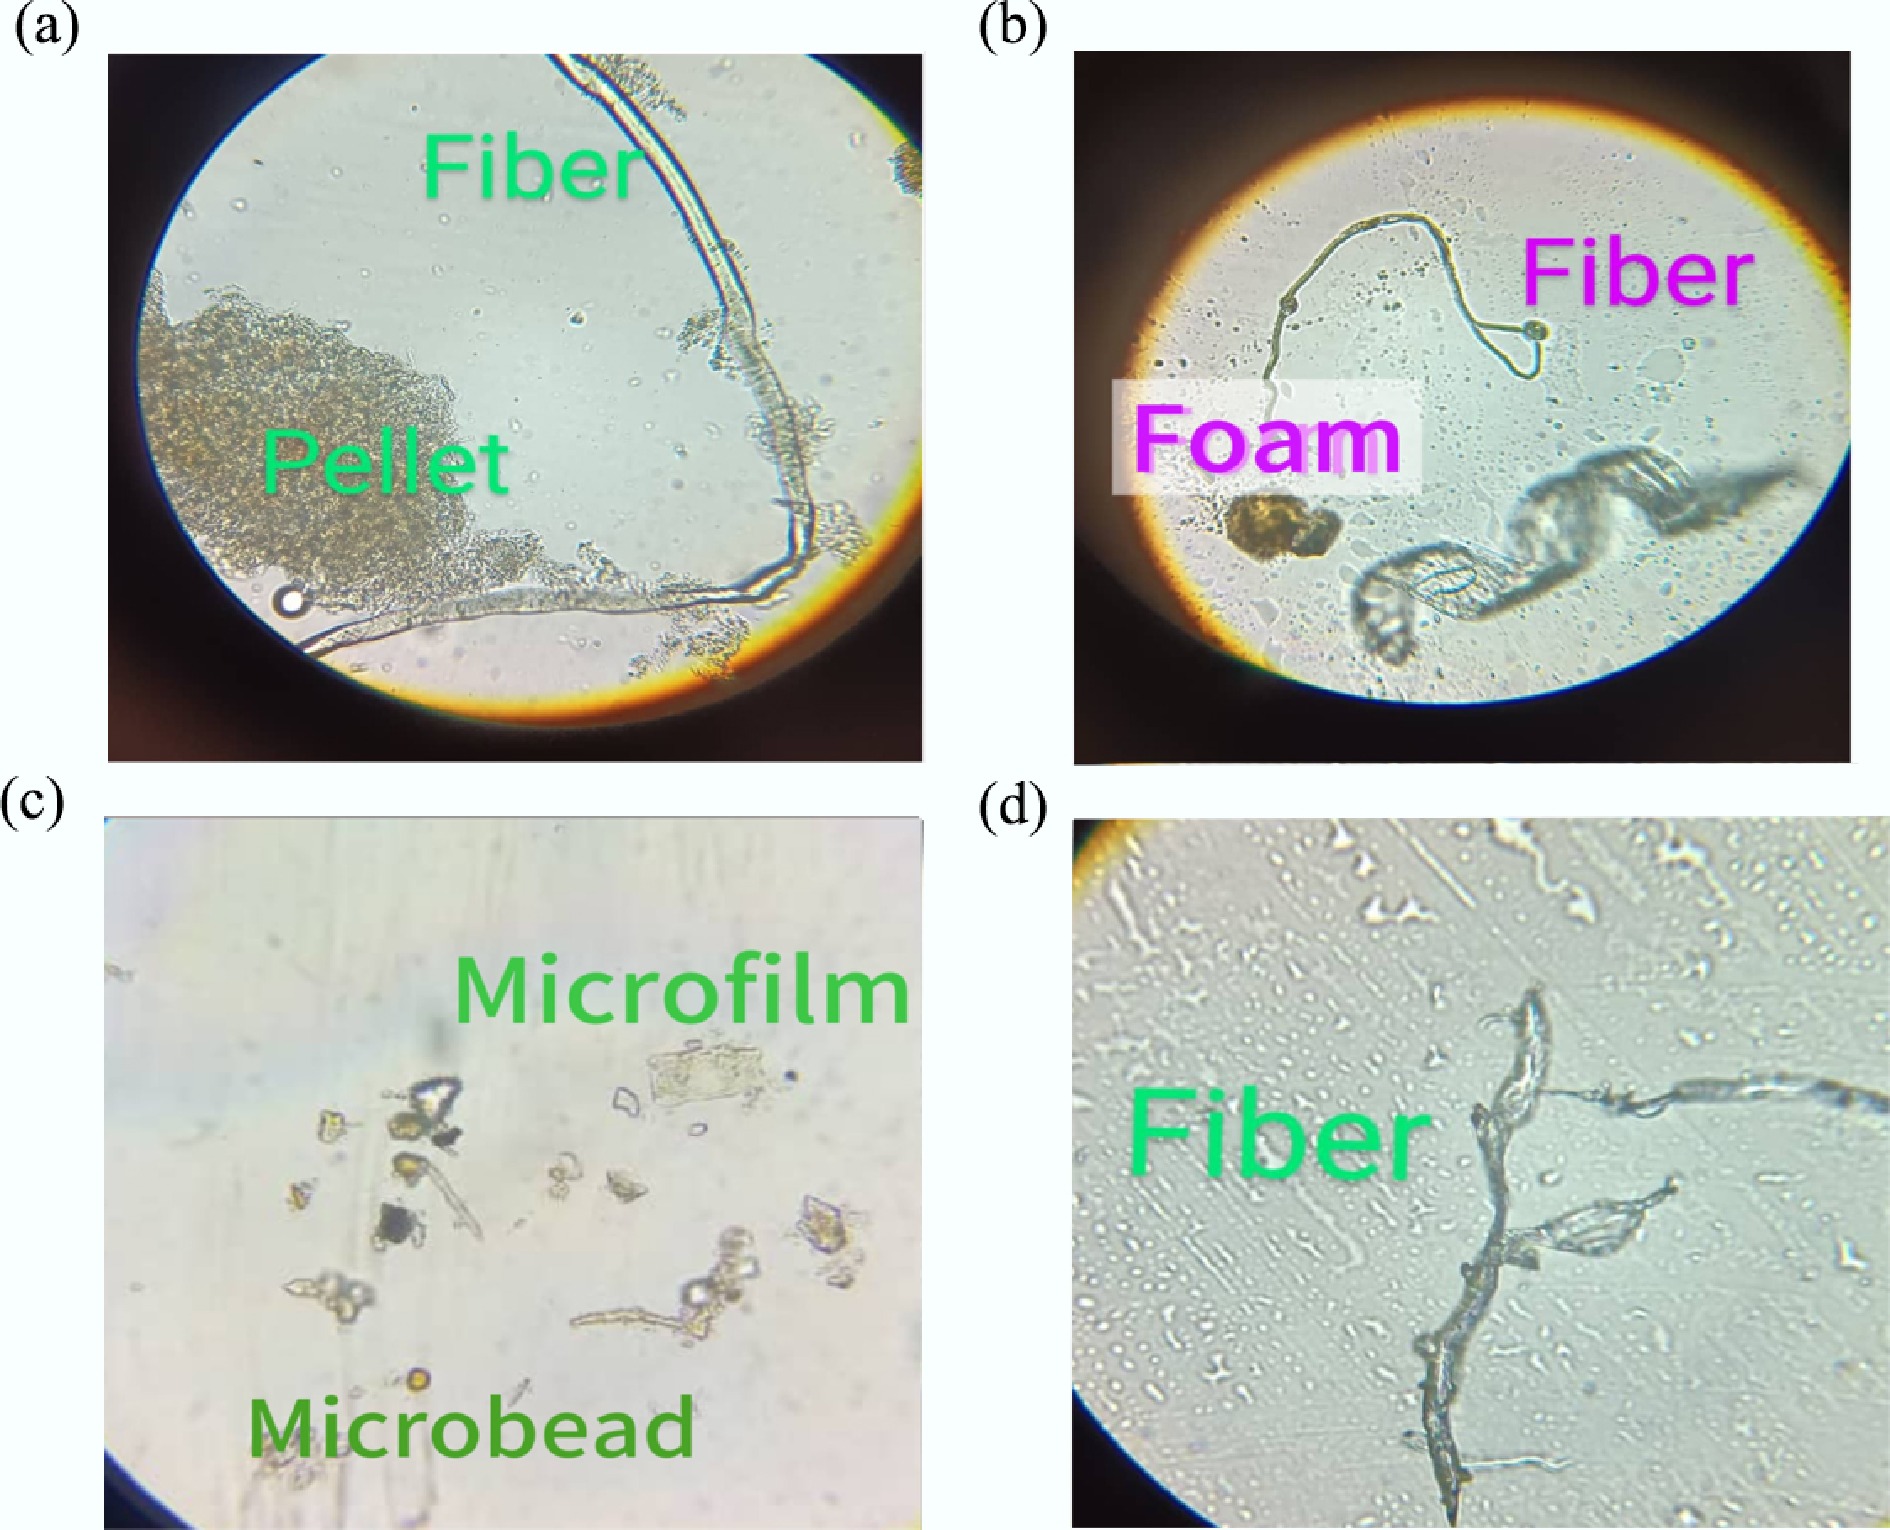
Figure 3.
Microplastic shapes identified in the water samples showing (a) fiber and pellet, (b) fiber and foam, (c) microbead and microfilm and (d) fiber.
-
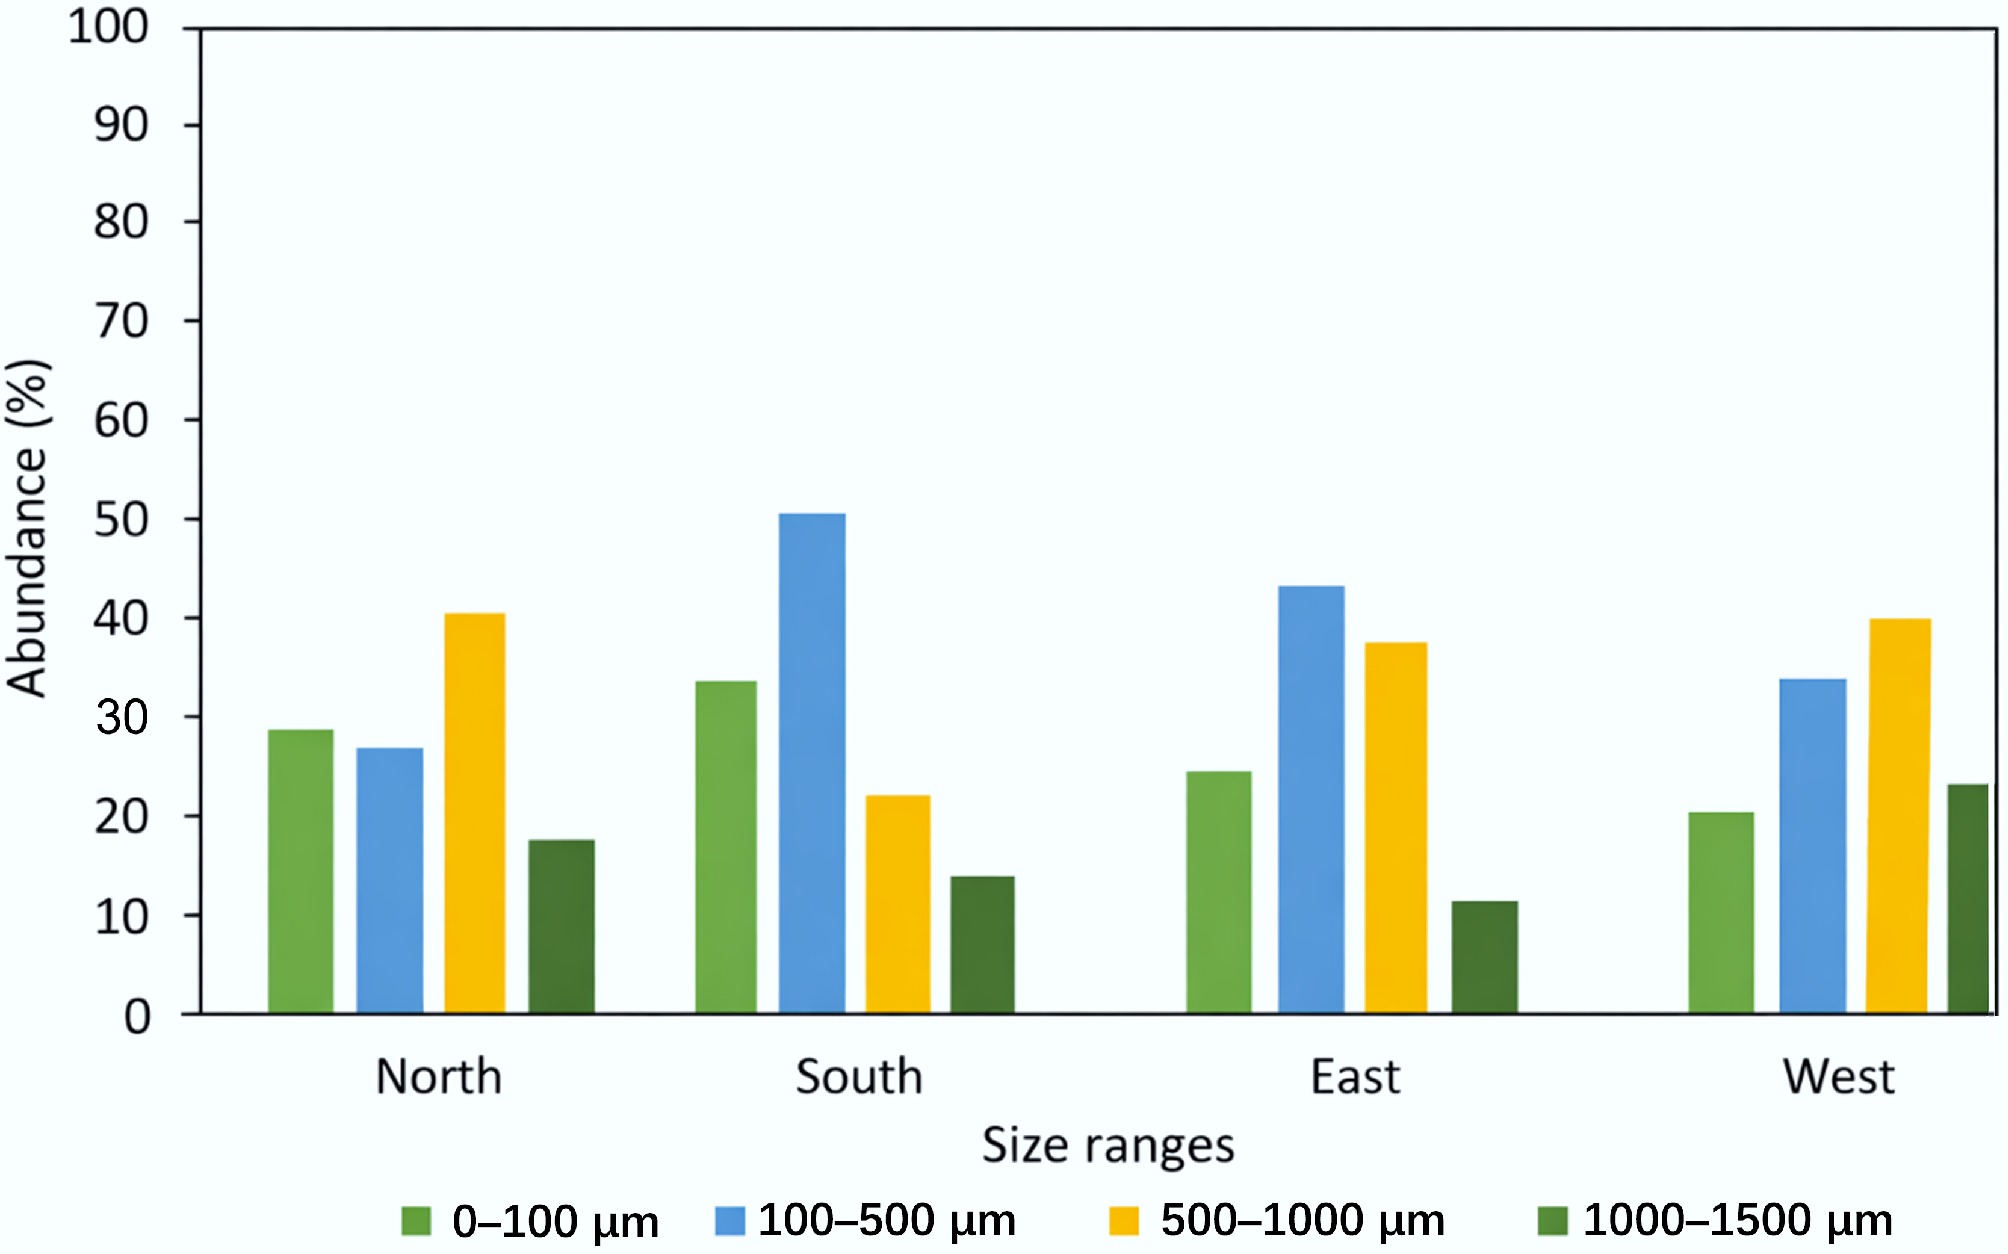
Figure 4.
Distribution (%) of microplastic size in the water samples.
-
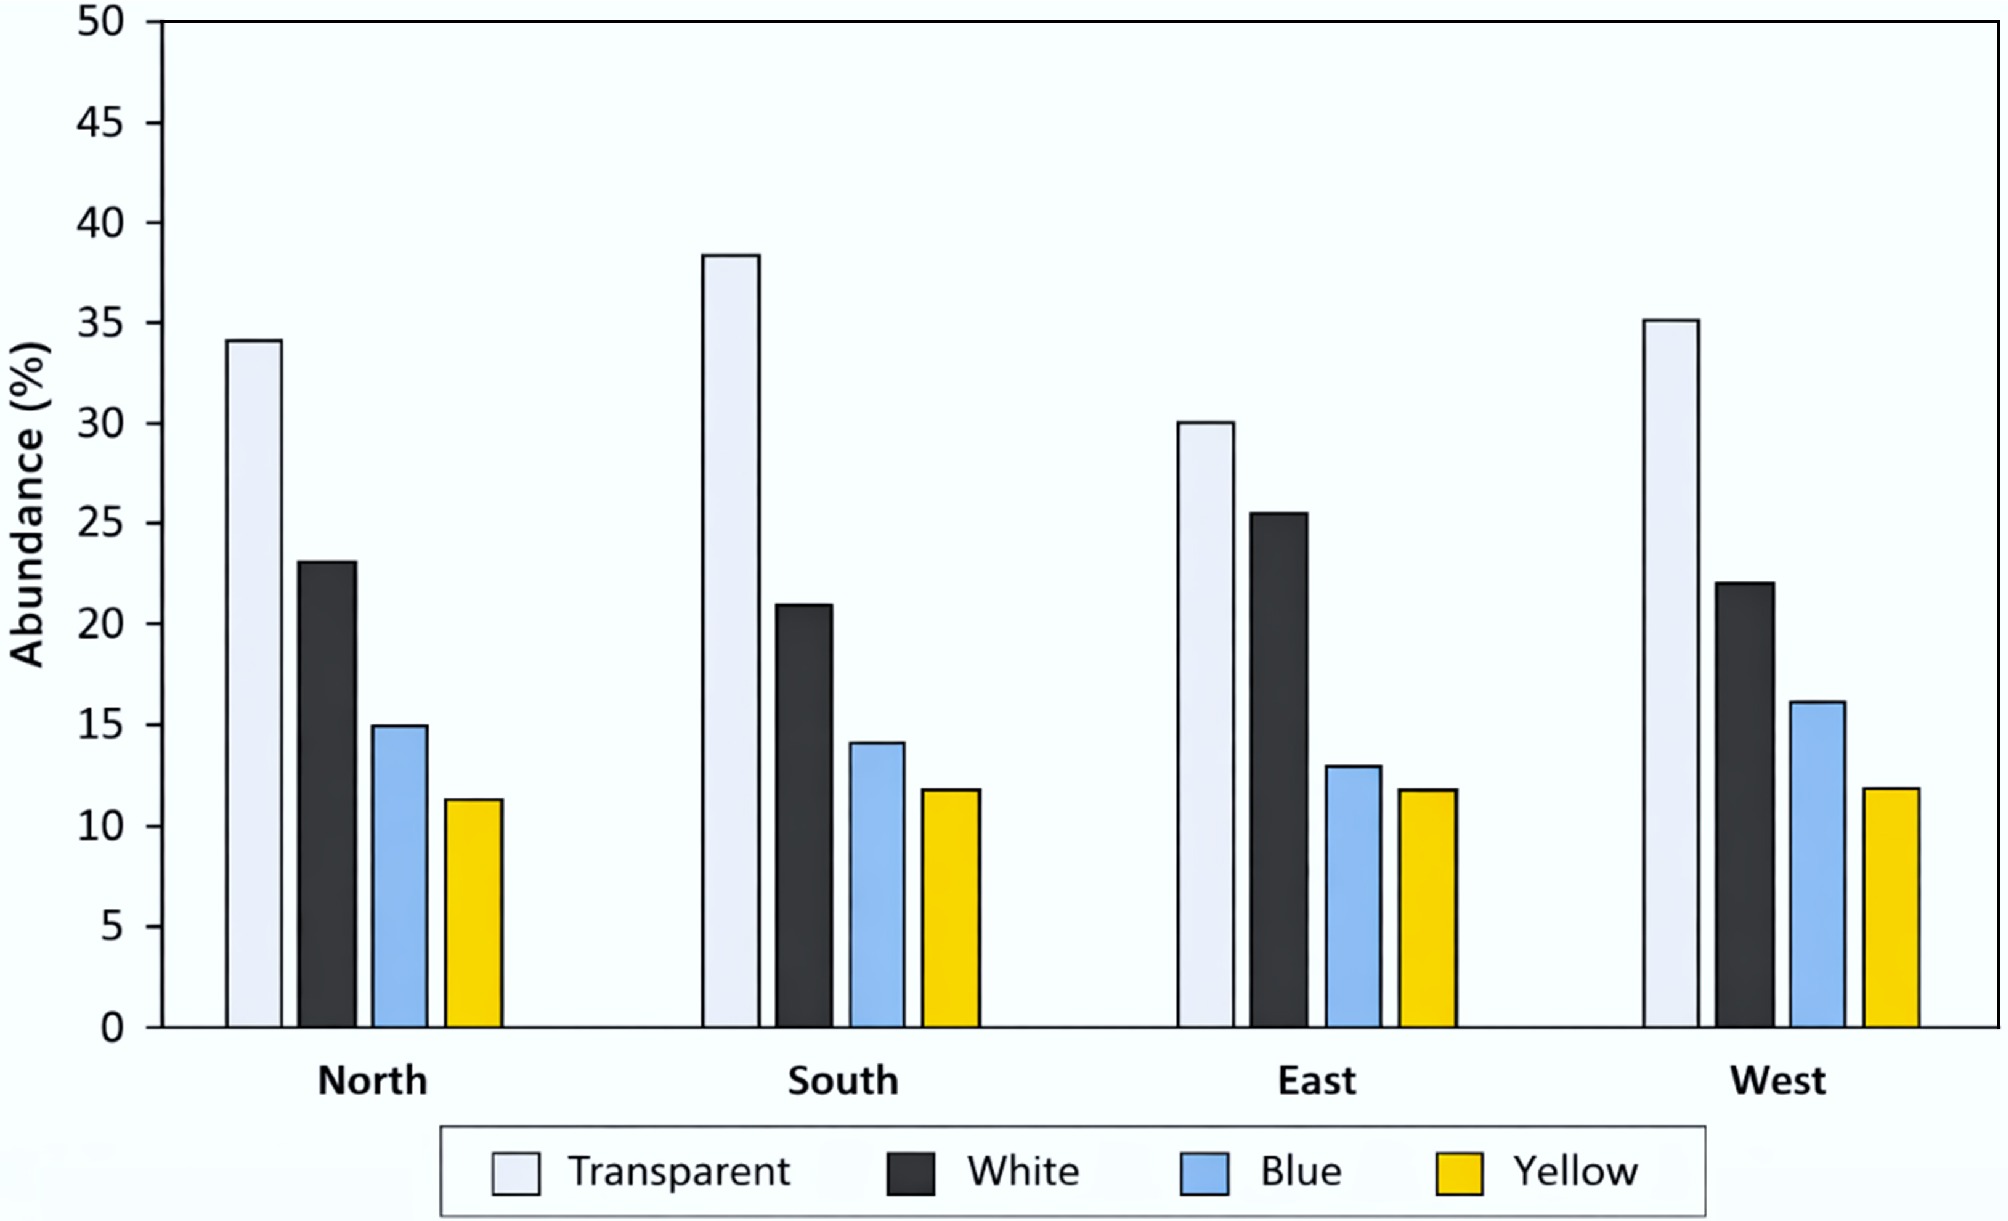
Figure 5.
Distribution (%) of microplastic colors in the water samples.
-
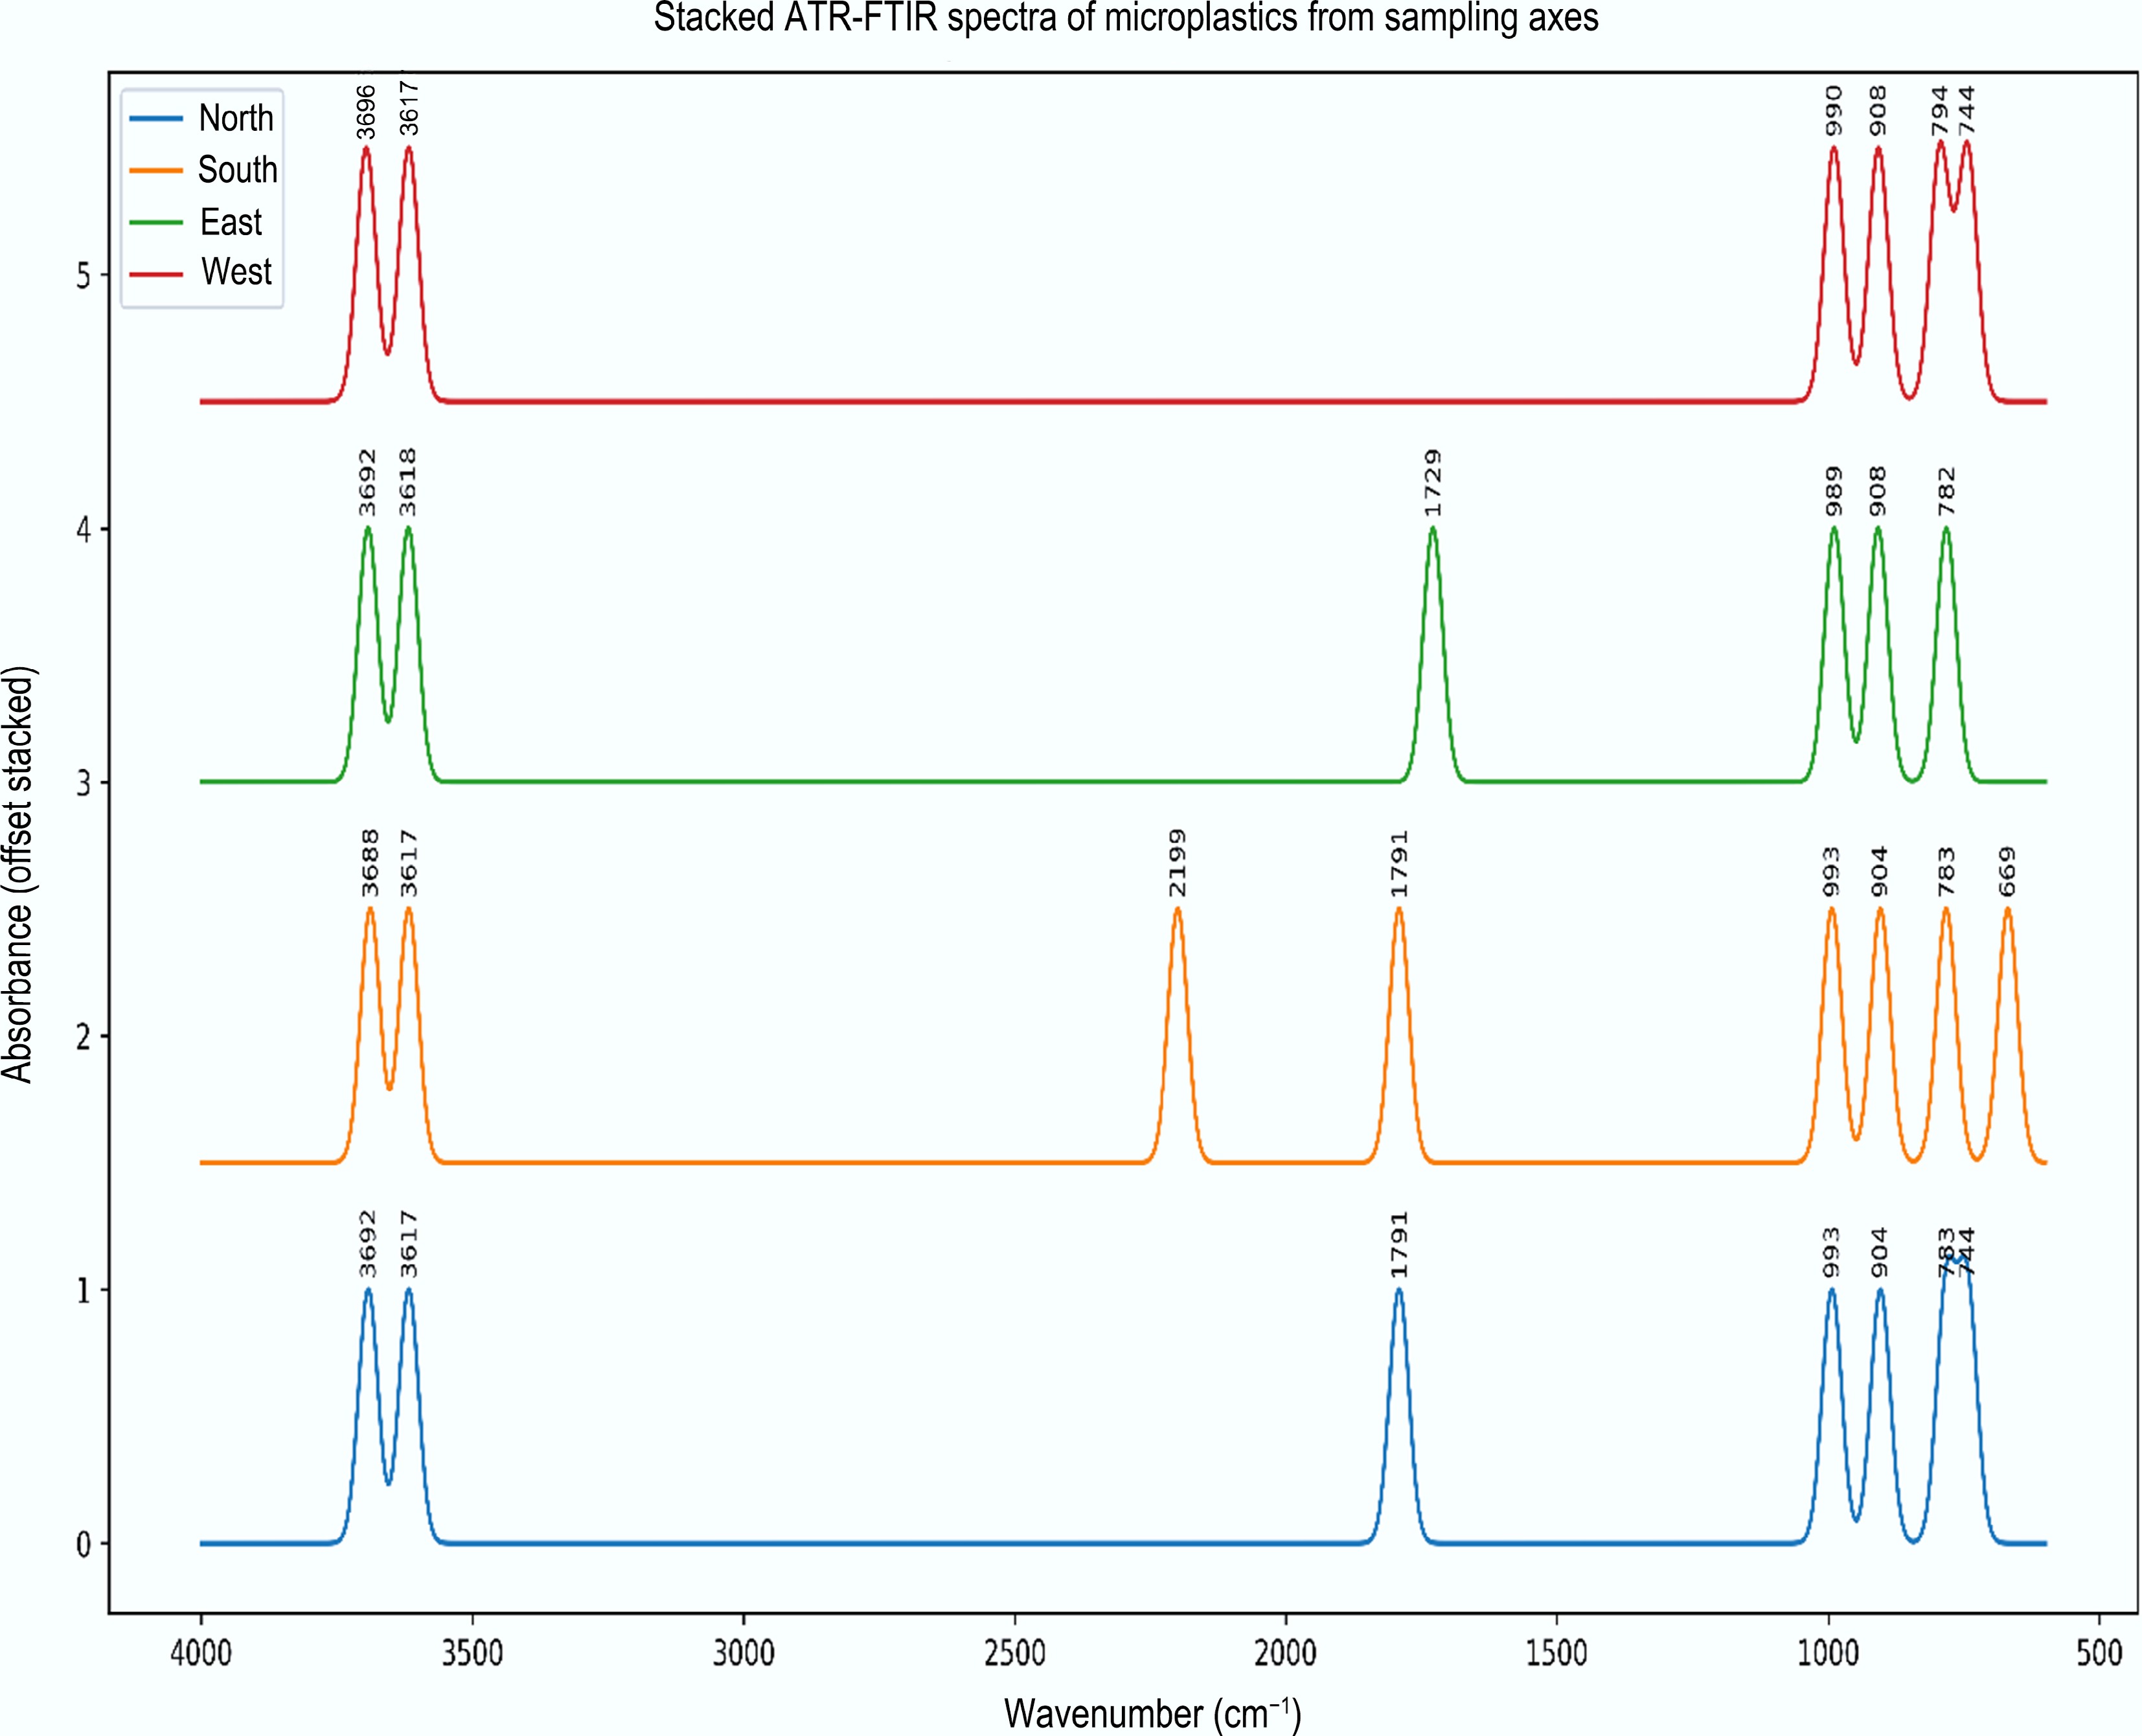
Figure 6.
Representative ATR-FTIR spectra of microplastics from each sampling axis.
-
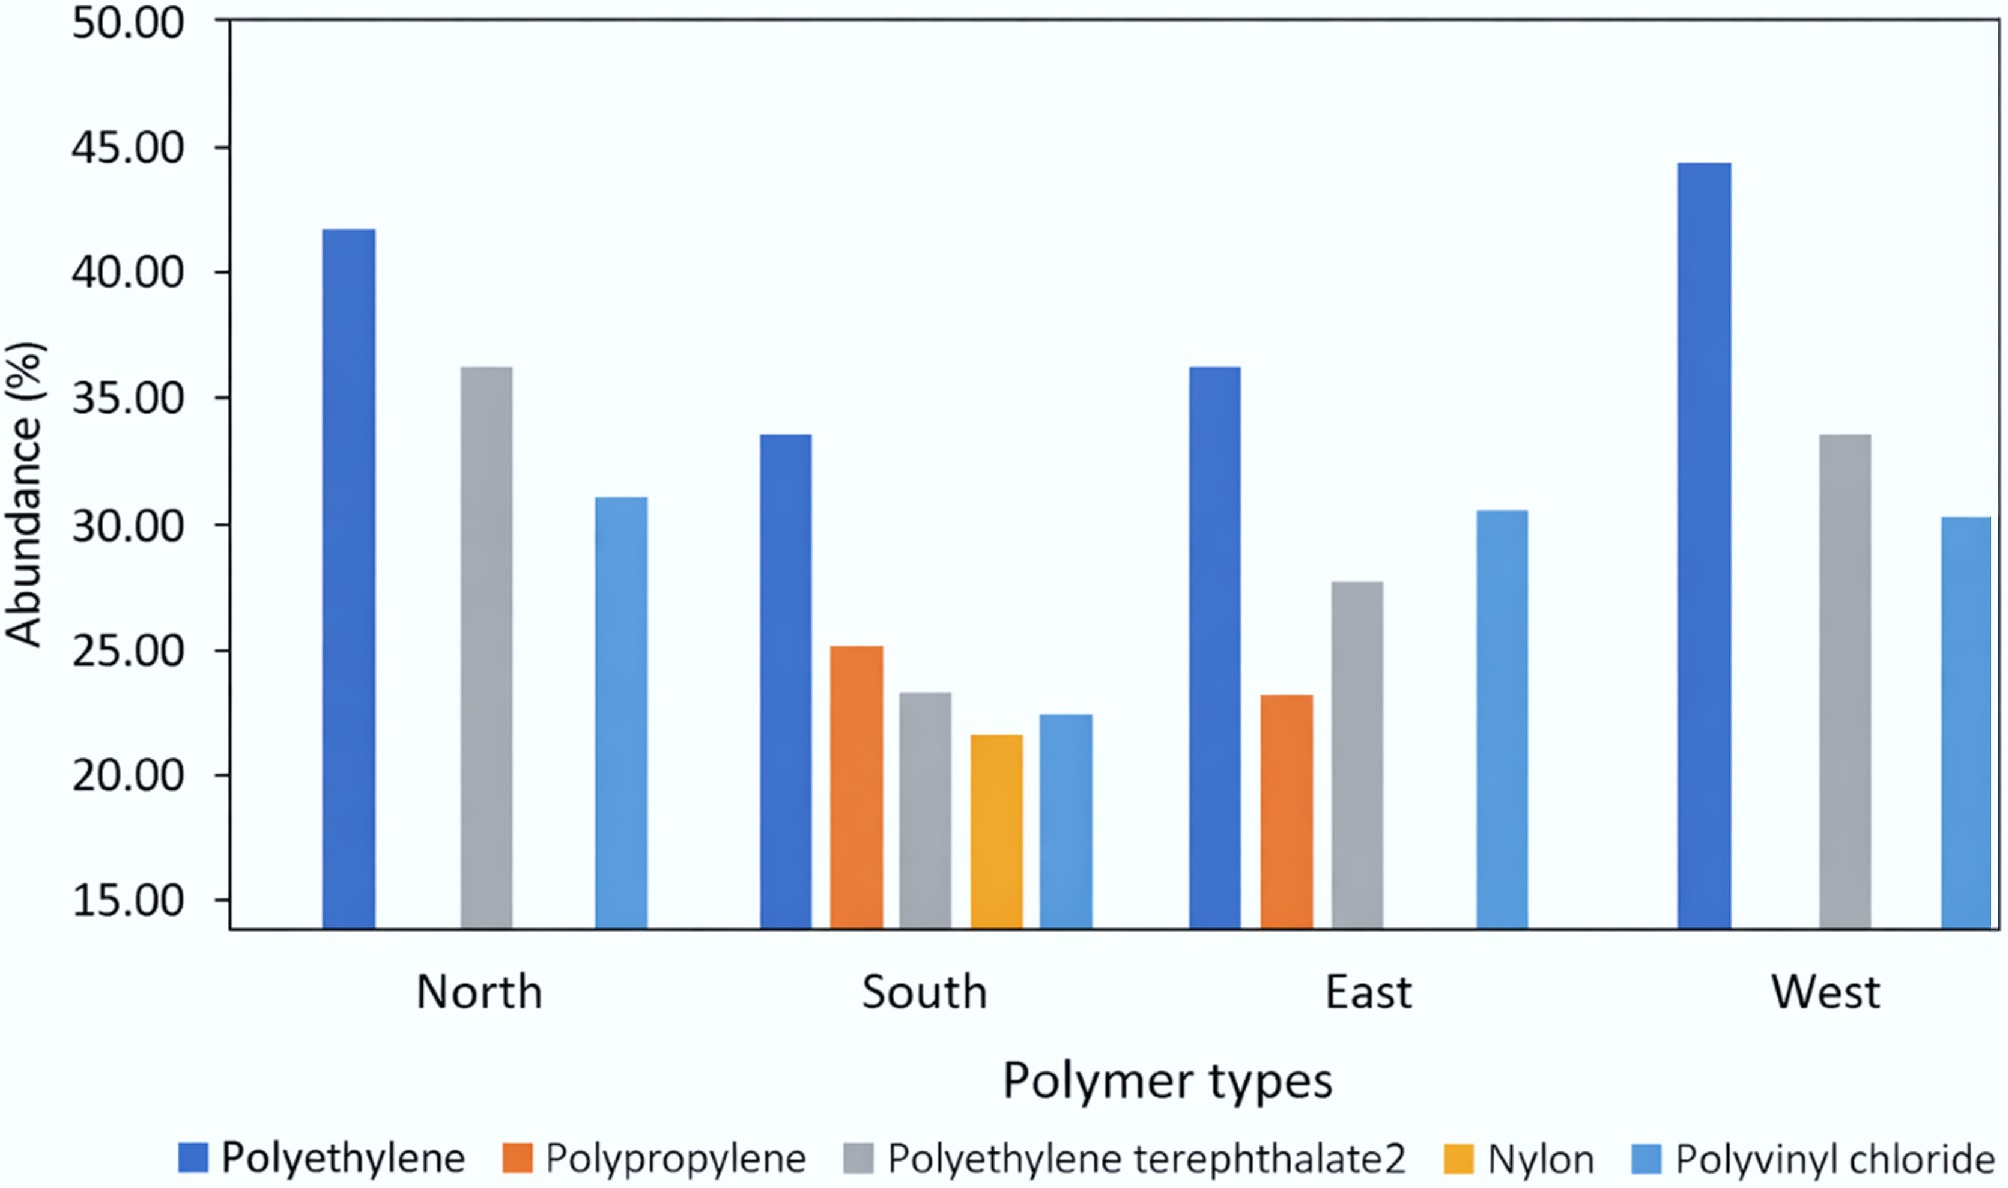
Figure 7.
Distribution (%) of polymer types in the water samples.
-
Location GPS coordinate Concentration (items/L) North N 13°0842, E 5°24′3289 460 ± 20 South N 13°0652, E 5°23′7822 200 ± 20 East N 13°0342, E 5°10′1549 180 ± 10 West N 13°0721, E 5°22′3259 150 ± 10 Values are presented as mean ± SD (n = 9). Table 1.
Concentrations of microplastics in water samples
-
Source SS df MS F p-value η2 Between groups
(sampling axes)553,275.0 3 184,425.0 737.7 1.33 × 10⁻²⁹ 0.986 Within groups (error) 8,000.0 32 250.0 Total 561,275.0 35 One-way ANOVA testing spatial differences in microplastic concentration (items/L) among sampling axes (north n = 9, south n = 9, east n = 9, west n = 9). F (3,32) = 737.7, p < 0.001, η2 = 0.986 indicates 98.6% of variance explained by location. Tukey HSD post hoc: north significantly higher than all others (p < 0.001); no differences among south/east/west (p > 0.05). Table 2.
Spatial distribution of microplastics around the axes of the cement plant
-
Location GPS coordinate Concentration (items/L) Cement plant N 13°0618, E 5°17'1114 510 ± 110 2 km north of cement plant N 13°0798, E 5°17'1114 110 ± 20 2 km south of cement plant N 13°0876°, E 5°23'3411 90 ± 10 Table 3.
Concentrations of microplastics in water around the Sokoto cement plant compared with cement-free environments
-
Microplastic shape North South East West Fiber 100 42 35 23 Microfilm 0 33 20 8 Microbead 0 10 25 38 Foam 0 10 10 21 Pellet 0 5 10 10 Total (%) 100 100 100 100 Table 4.
Distribution of microplastic shapes in the water samples
-
Sample Absorbance
peak (cm−1)Functional group Polymer type[3] South 2,915–2,848 C–H stretching
(aliphatic hydrocarbons)PE, PP 1,630–1,680 Amide I and II bands NY 1,715–1,730 C=O stretching
(ester group)PET 600–700 C–Cl stretching PVC West 2,915, 2,848 C–H stretching PE 989.6, 907.6 C–H bending/rocking PE 793.9, 743.6 C–Cl stretching PVC 1,715–1,730 C=O stretching (ester) PET North 2,915–2,848 C–H stretching PE 1,715–1,730 C=O stretching
(ester group)PET 993.3, 903.9 C–H bending PVC 782.7, 743.6 C–Cl stretching PVC East 2,915-2,848 C–H stretching PE 1,728.6 C=O stretching
(ester group)PET 989.1, 908.3 C–H bending, C–Cl stretching PVC 1,450–1,375 CH3 bending PP PP = Polypropylene, PE = Polyethylene, PVC = Polyvinyl Chloride, PET = Polyethylene Terephthalate, NY = Nylon. Table 5.
Absorbance peaks, functional groups, and polymers identified in the water samples
-
Location PE (%) PET (%) PVC
(%)PP
(%)NY
(%)Total PRI Risk level North 40.0 33.3 26.7 0.0 0.0 1507.7 IV (> 1,000) South 30.0 17.7 16.7 20.0 15.6 1738.5 IV (> 1,000) East 33.3 23.3 26.7 16.7 0.0 1410.7 IV (> 1,000) West 43.3 30.0 26.7 0.0 0.0 1530.8 IV (> 1,000) Risk level IV indicates very high risk. The PRI indicates relative polymer hazard potential and does not represent a quantitative drinking water exposure risk assessment. Table 6.
Risk index of polymers in the water samples
-
Location PLI North 3.07 South 1.33 East 1.20 West 1.00 PLI zone 1.54 Pollution load index greater than 1 signifies water pollution. Table 7.
Pollution load index (PLI) of the water samples
Figures
(7)
Tables
(7)