-
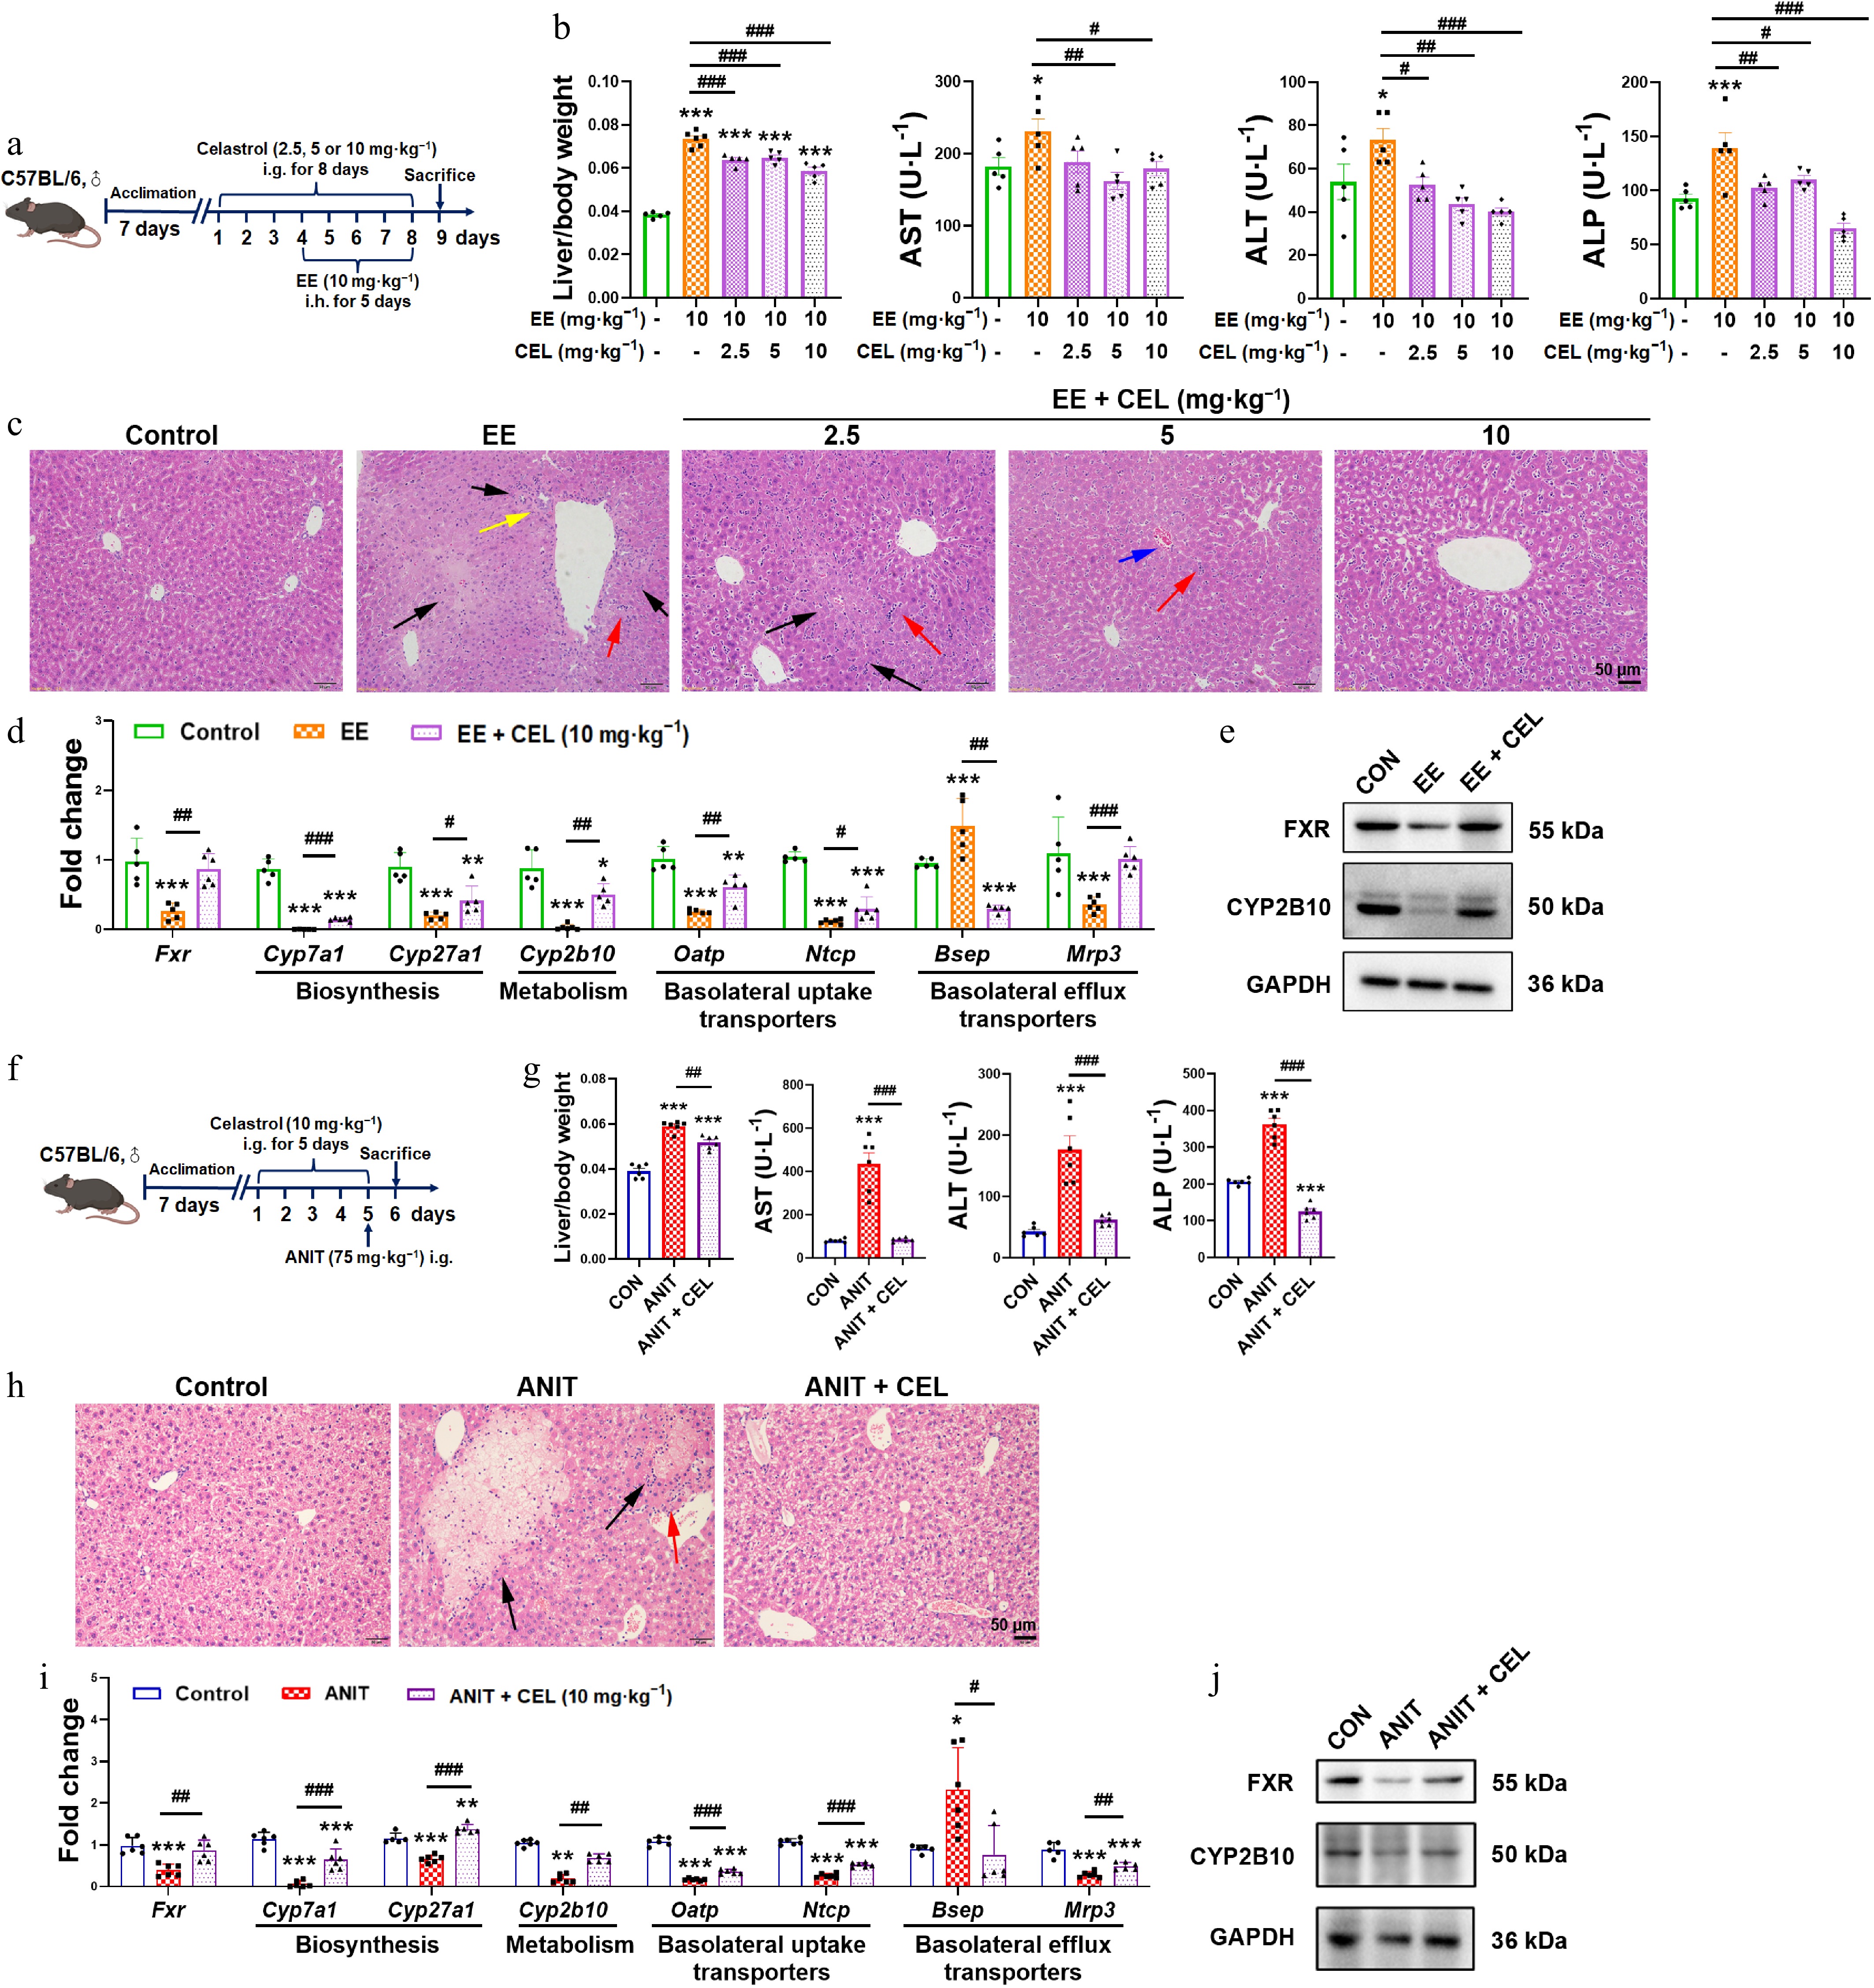
Figure 1.
Celastrol protects against EE- and ANIT-induced cholestasis. (a) The administration methods of celastrol and EE. (b), (g) Liver/body weight ratio, and the serum levels of AST, ALT, and ALP. (c), (h) H&E staining of liver (200 ×, scale bar = 50 μm, black arrow: necrosis; red arrows: inflammatory infiltration; yellow arrows: proliferation of the pseudocholangiolar duct; blue arrows: hepatic sinusoidal congestion). (d), (i) The mRNA expression of key genes related to bile acid homeostasis. (e), (j) The protein levels of FXR and CYP2B10. (f) The administration methods of celastrol and ANIT. Data are presented as mean ± SEM, n = 5–6, * P < 0.05, ** P < 0.01, *** P < 0.001 vs control group; # P < 0.05, ## P < 0.01, ### P < 0.001 vs EE or ANIT group.
-
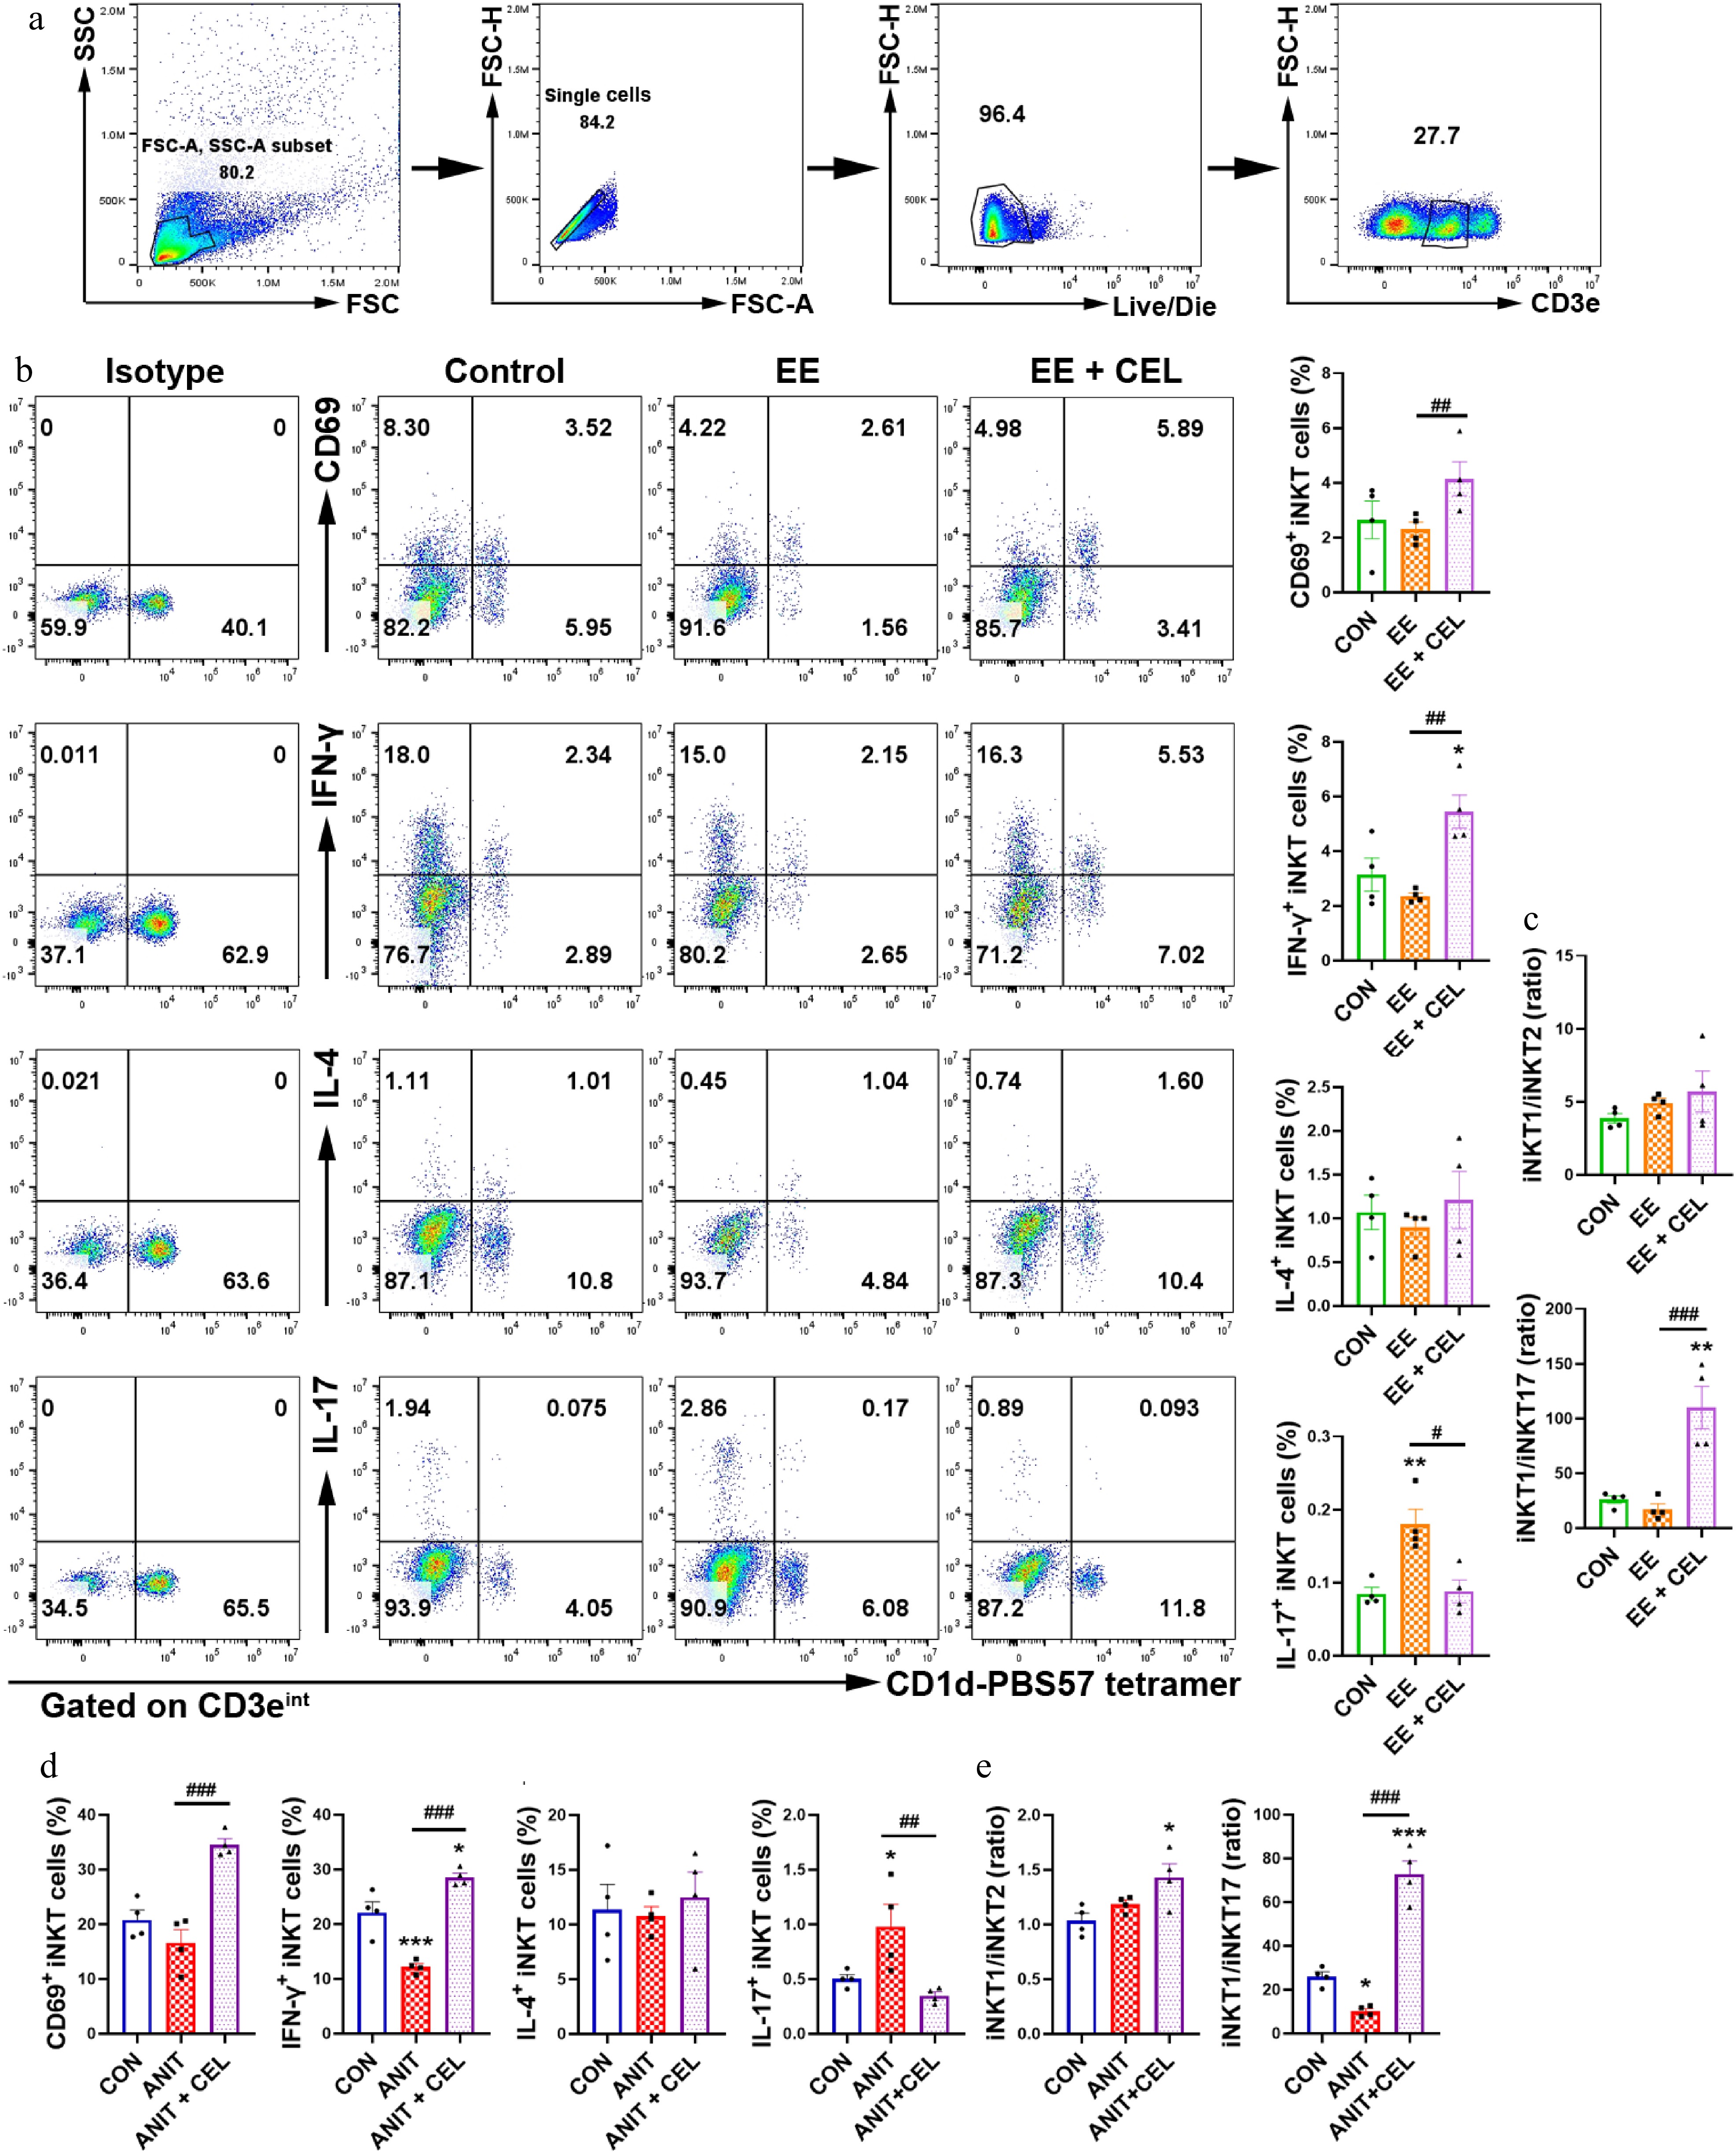
Figure 2.
Celastrol promotes an iNKT1 subtype bias in cholestatic liver. (a) The gating strategy for iNKT cells (CD3eintCD1d-PBS-57 tetramer+). (b), (d) The percentage and analysis of CD69+ iNKT cells, IFN-γ+ iNKT1, IL-4+ iNKT2, and IL-17+ iNKT17 cells, respectively. (c), (e) iNKT1/iNKT2 ratio, iNKT1/iNKT17 ratio. Data are presented as mean ± SEM, n = 4, * P < 0.05, ** P < 0.01, *** P < 0.001 vs control group; # P < 0.05, ## P < 0.01, ### P < 0.001 vs EE or ANIT group.
-
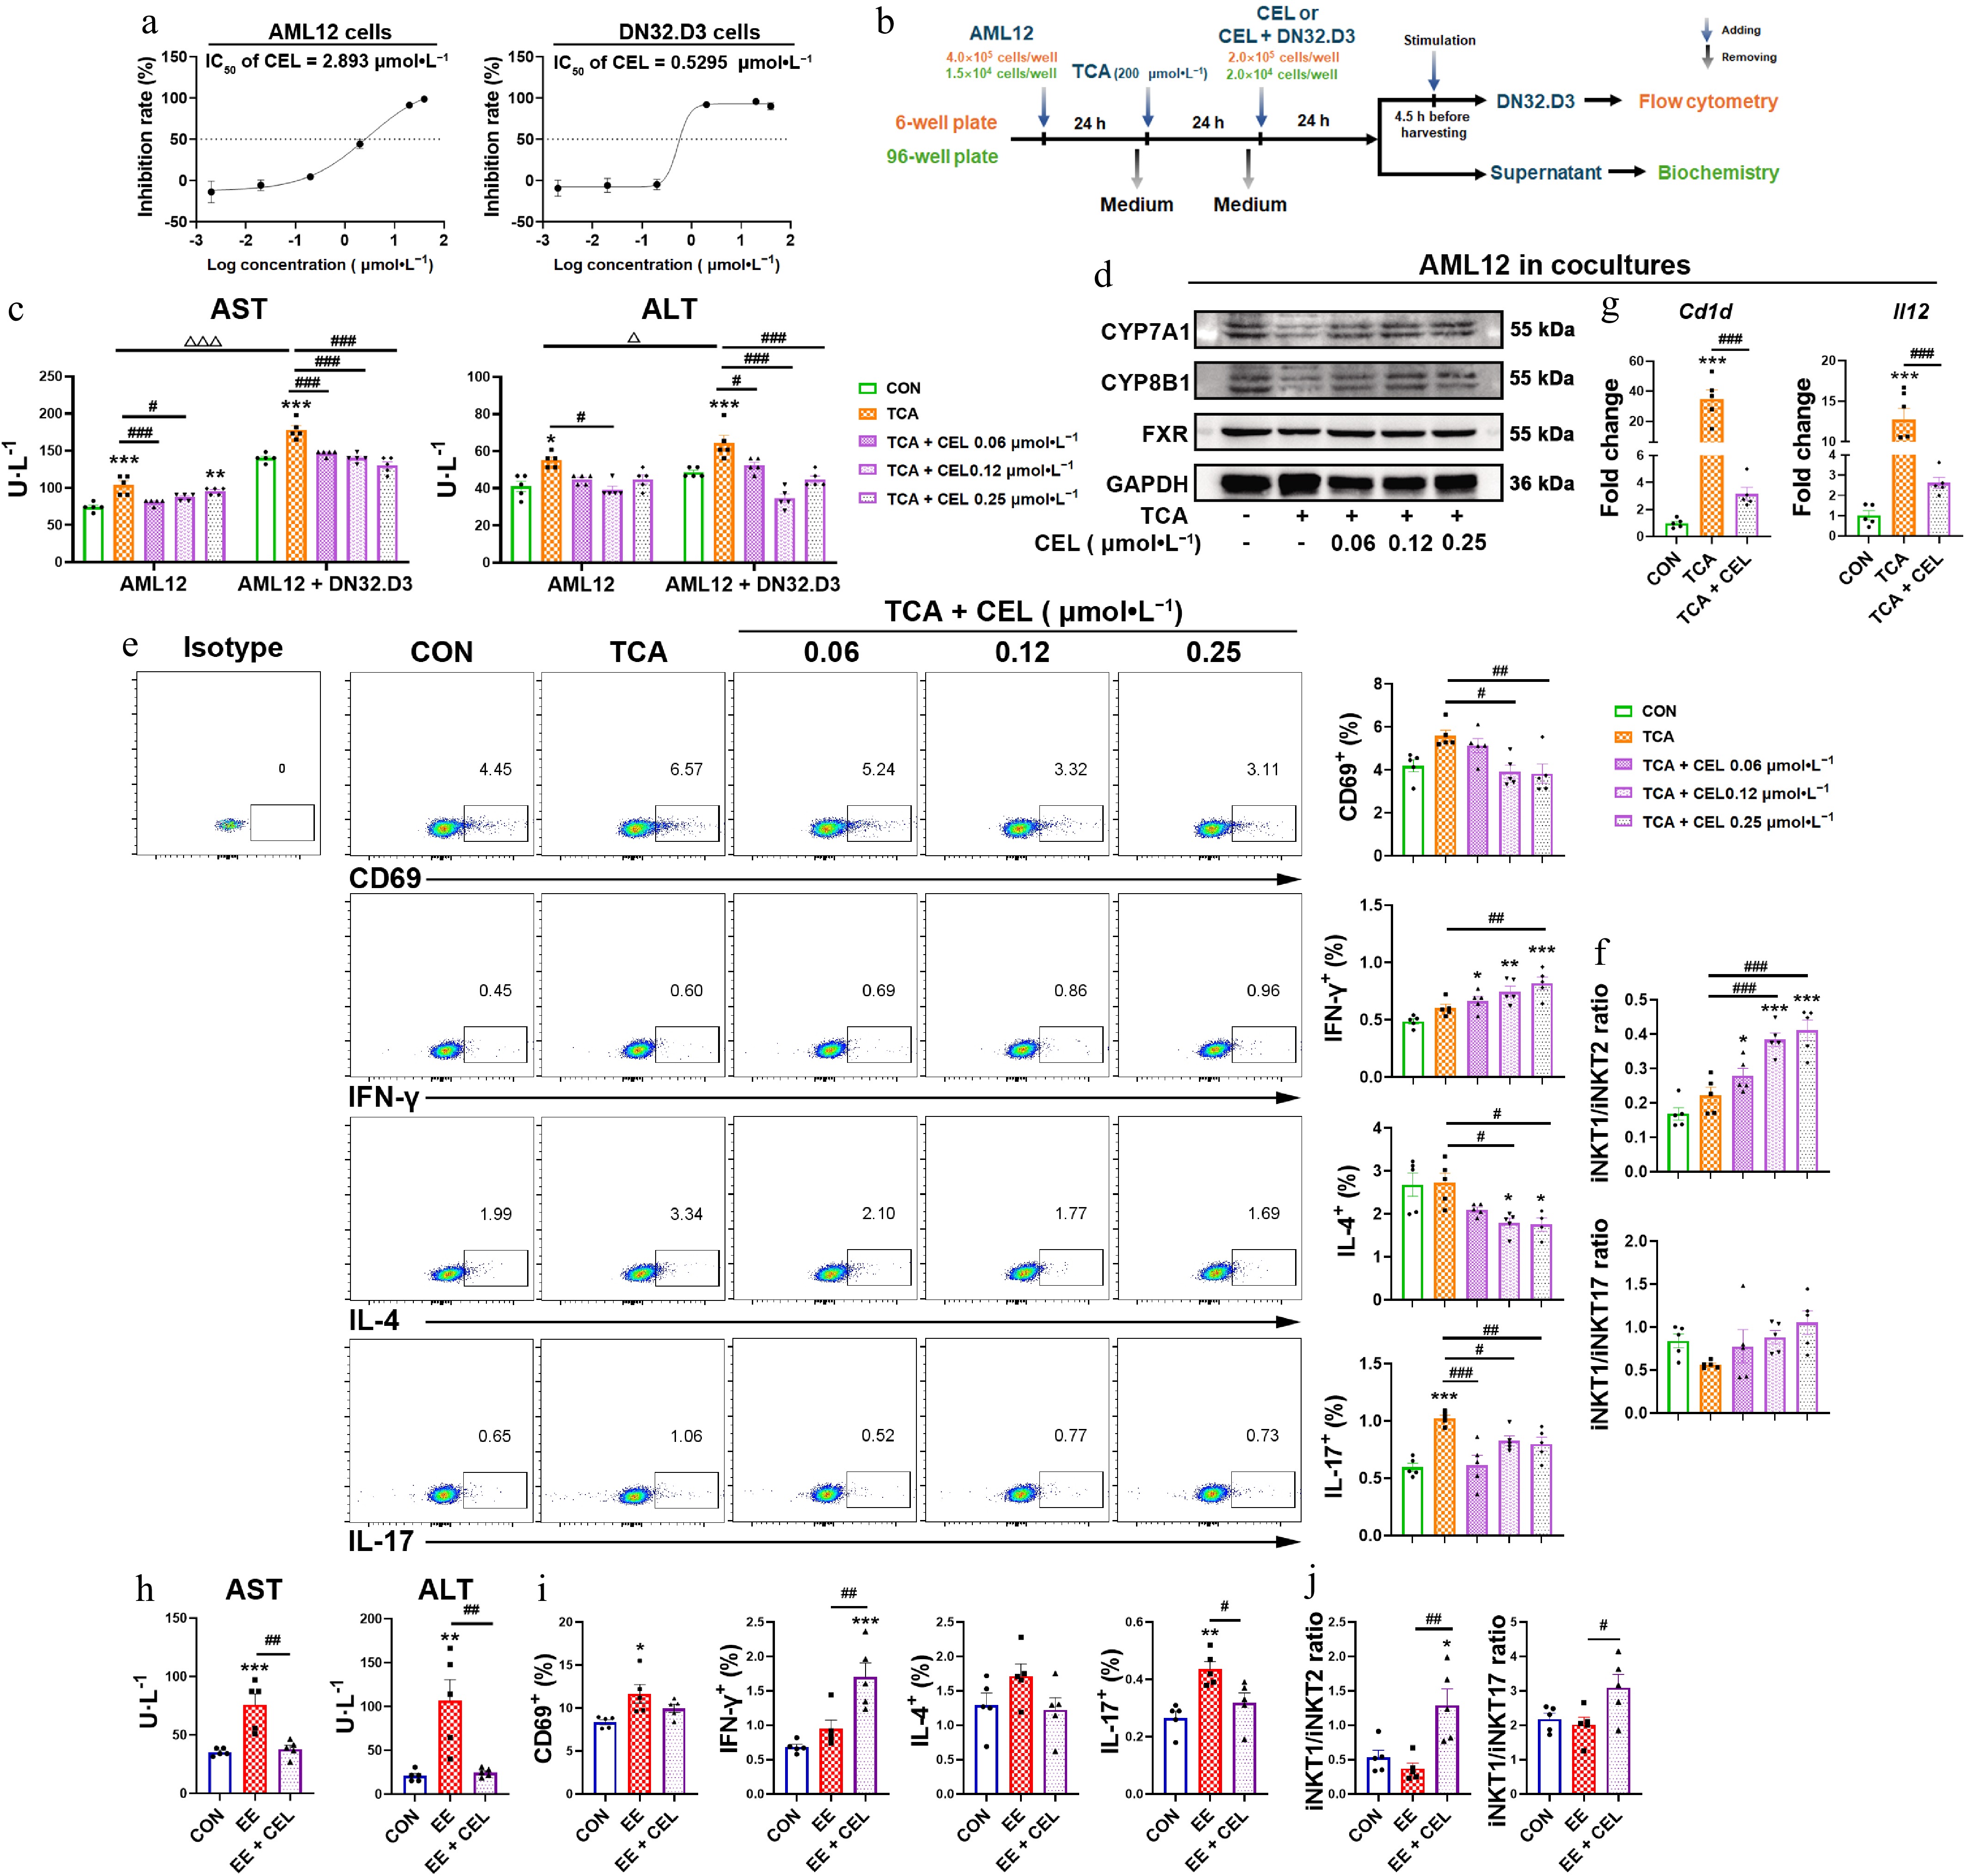
Figure 3.
Celastrol induces an iNKT1 subtype bias in iNKT-hepatocyte co-cultures. (a) The IC50 value of AML12 cells and DN32.D3 cells treated with celastrol. (b) In vitro co-culture method of AML12 cells and DN32.D3 cells, and the method of TCA and celastrol administration. In the in vitro co-culture system, (c), (h) the levels of AST and ALT in the cell supernatant. (d) The protein levels of CYP7A1, CYP8B1, and FXR in AML12 cells. (e), (i) Activation (CD69) and cytokine production (IFN-γ, IL-4, IL-17) by DN32.D3 cells. (f), (j) iNKT1/iNKT2 ratio, iNKT1/iNKT17 ratio. (g) The mRNA levels of Cd1d and Il12 in AML12 cells of the co-culture system. Data are presented as mean ± SEM, n = 5, * P < 0.05, ** P < 0.001, *** P < 0.0001 vs control group; # P < 0.05, ## P < 0.001, ### P < 0.0001 vs TCA or EE group; Δ P < 0.05, ΔΔΔ P < 0.001 vs AML12 cells.
-
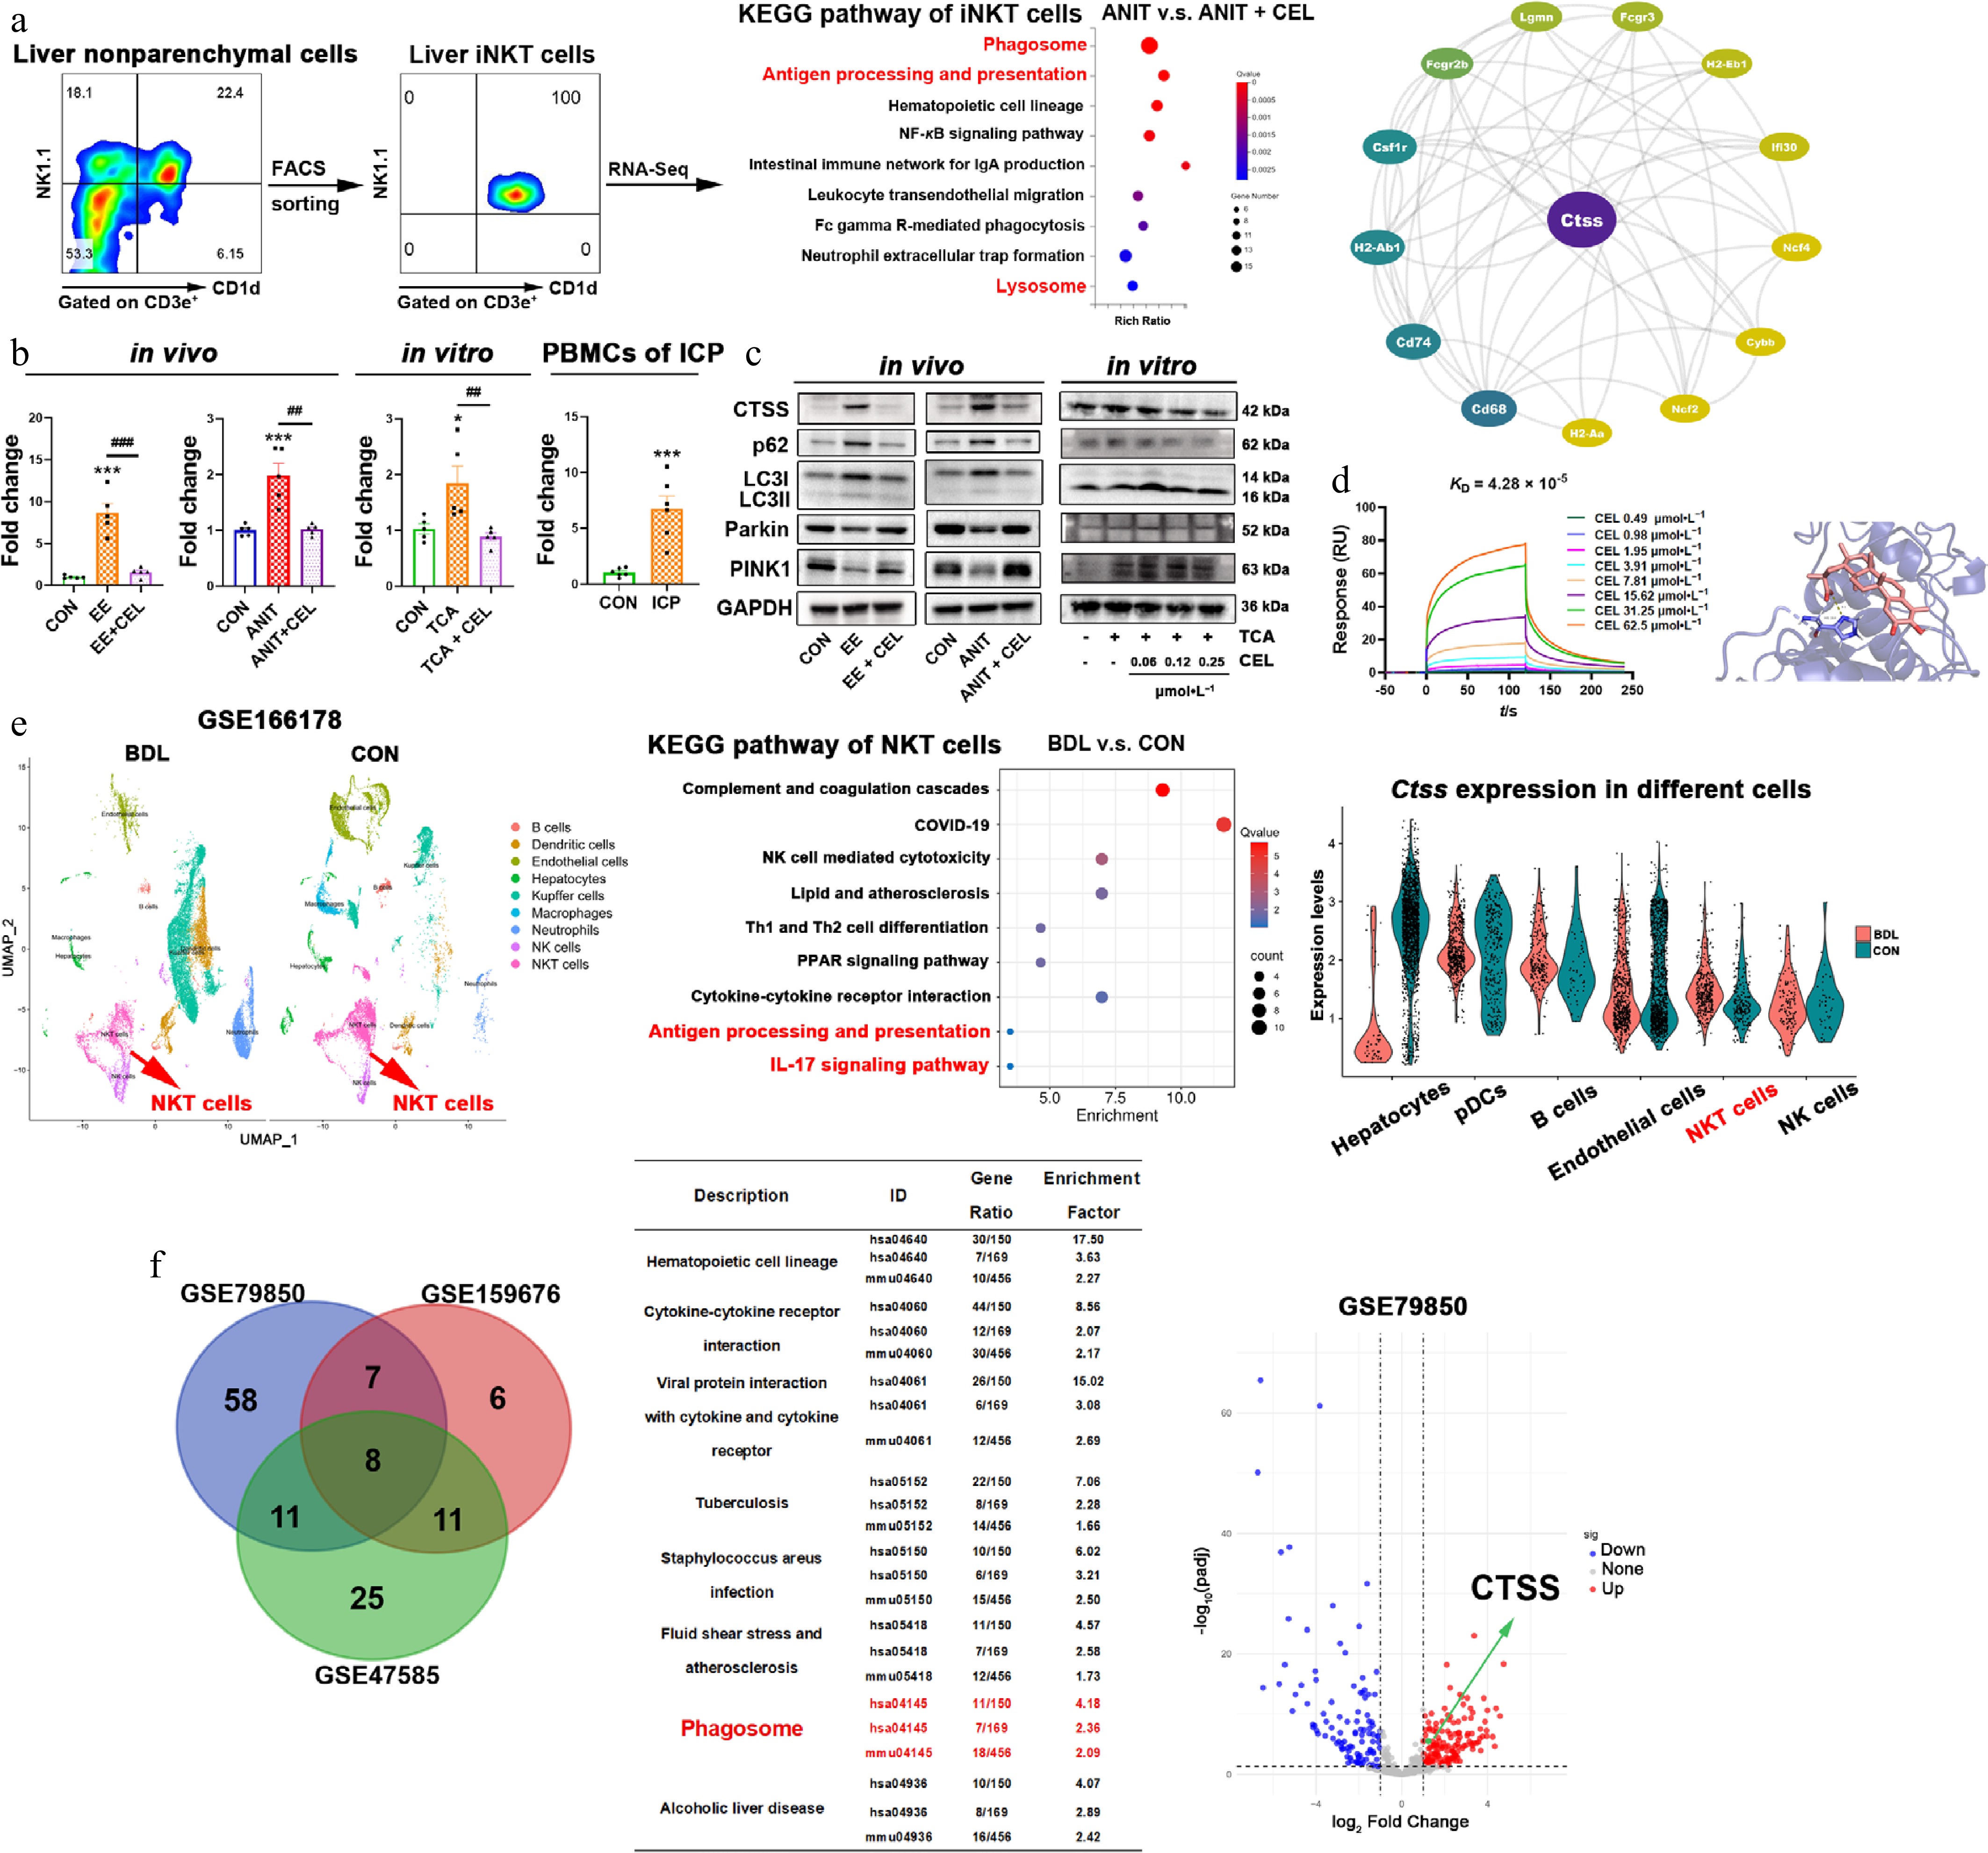
Figure 4.
Celastrol downregulates CTSS and promotes autophagy/mitophagy in iNKT cells. (a) The results of flow cytometry sorting liver iNKT cells, KEGG enrichment pathway analysis of differentially expressed genes (DEGs) using transcriptome sequencing, and protein-protein interaction (PPI) analysis. (b) The CTSS mRNA levels in vivo, in vitro, and in patients. Data are presented as mean ± SEM, n = 5–6, * P < 0.05, *** P < 0.001 vs control group; ## P < 0.01, ### P < 0.001 vs EE, ANIT, or TCA group. (c) The protein levels of CTSS, p62, LC3I/II, Parkin, and PINK1 in vivo, and in vitro. (d) The equilibrium dissociation constant (KD) was obtained by surface plasmon resonance (SPR) experiments using recombinant CTSS protein and celastrol. The binding region and linking amino acids were predicted through molecular docking between celastrol and CTSS (dashed line represents the hydrogen bonding force between CTSS and celastrol, which was 3.1 Å). (e) UMAP visualization of liver nonparenchymal cells from bile duct ligation (BDL) and control (CON) mice in the single cell sequencing dataset (GSE166178). KEGG analysis of upregulated DEGs in NKT cells, and cell type-specific CTSS expression. (f) Venn diagram of shared KEGG pathways from three datasets (liver of patients or mice with cholestasis and healthy controls), and volcano plot from GSE79850.
-
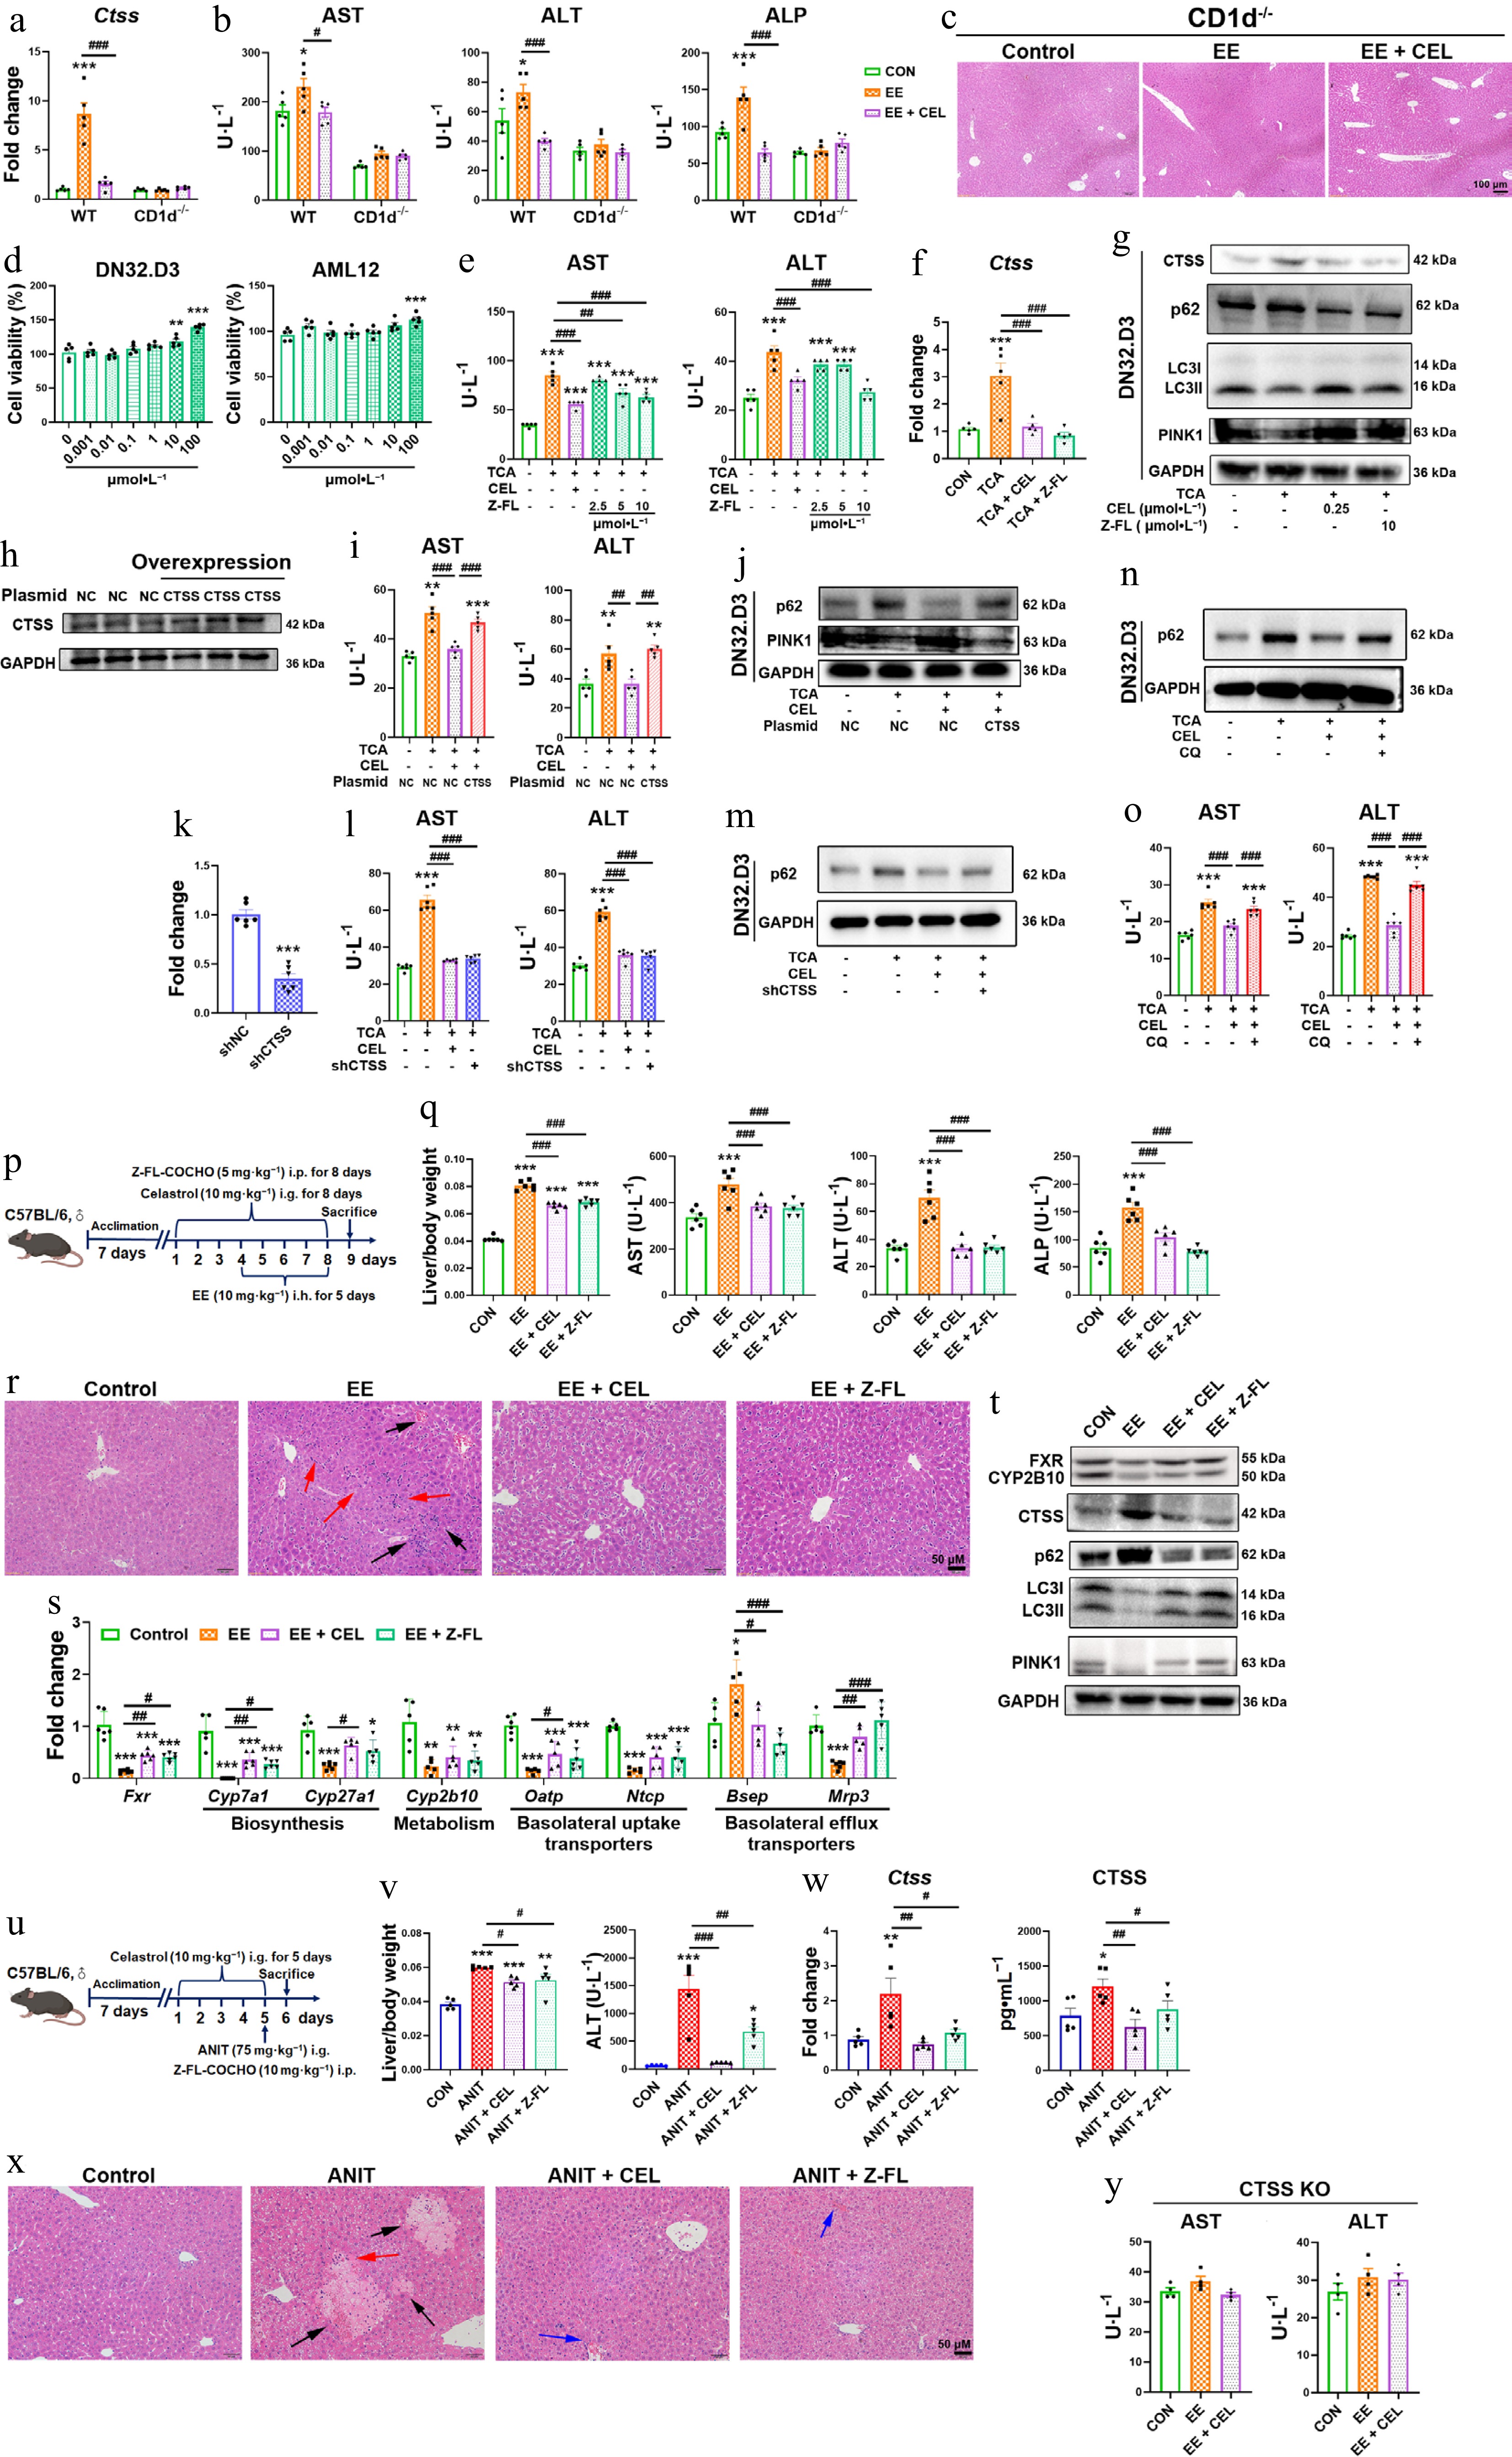
Figure 5.
CTSS inhibition protects against cholestatic liver injury. (a) CTSS mRNA expressions, and (b) serum AST, ALT, and ALP levels in CD1d–/– mice. (c), (r) and (x) H&E staining of liver (black arrow: necrosis; red arrows: inflammatory infiltration; blue arrows: hepatic sinusoidal congestion). (d) Cell viability of DN32.D3 and AML12 cells treated with Z-FL-COCHO. In co-culture, (e), (i), (l) and (o) AST and ALT levels in supernatant. (f) The mRNA expressions of Ctss in DN32.D3 cells. (g) Protein levels of autophagy/mitophagy markers in DN32.D3 cells. (h) CTSS overexpression in DN32.D3 cells. (j) Autophagy/mitophagy markers in CTSS-overexpressing DN32.D3 cells. (k) After shRNA-mediated knockdown of CTSS, the mRNA expression of Ctss in DN32.D3 cells. (m), (n) Protein levels of p62 in shCTSS-expressing or chloroquine (CQ)-treated DN32.D3 cells. (p), (u) The administration methods. (q) Liver/body weight ratio, and the serum levels of AST, ALT, and ALP. (s) The mRNA expression of key genes related to bile acid homeostasis. (t) The protein levels of FXR, CYP2B10, CTSS, p62, LC3I/II, and PINK1. (v) Liver/body weight ratio and the serum levels of ALT in ANIT-induced cholestasis. (w) The mRNA and protein levels of CTSS. (y) The serum levels of AST and ALT in CTSS knockout mice. Data are presented as mean ± SEM, n = 5–6, * P < 0.05, ** P < 0.01, *** P < 0.001 vs control group; # P < 0.05, ## P < 0.01, ### P < 0.001 vs EE, ANIT, TCA, or CEL group.
-
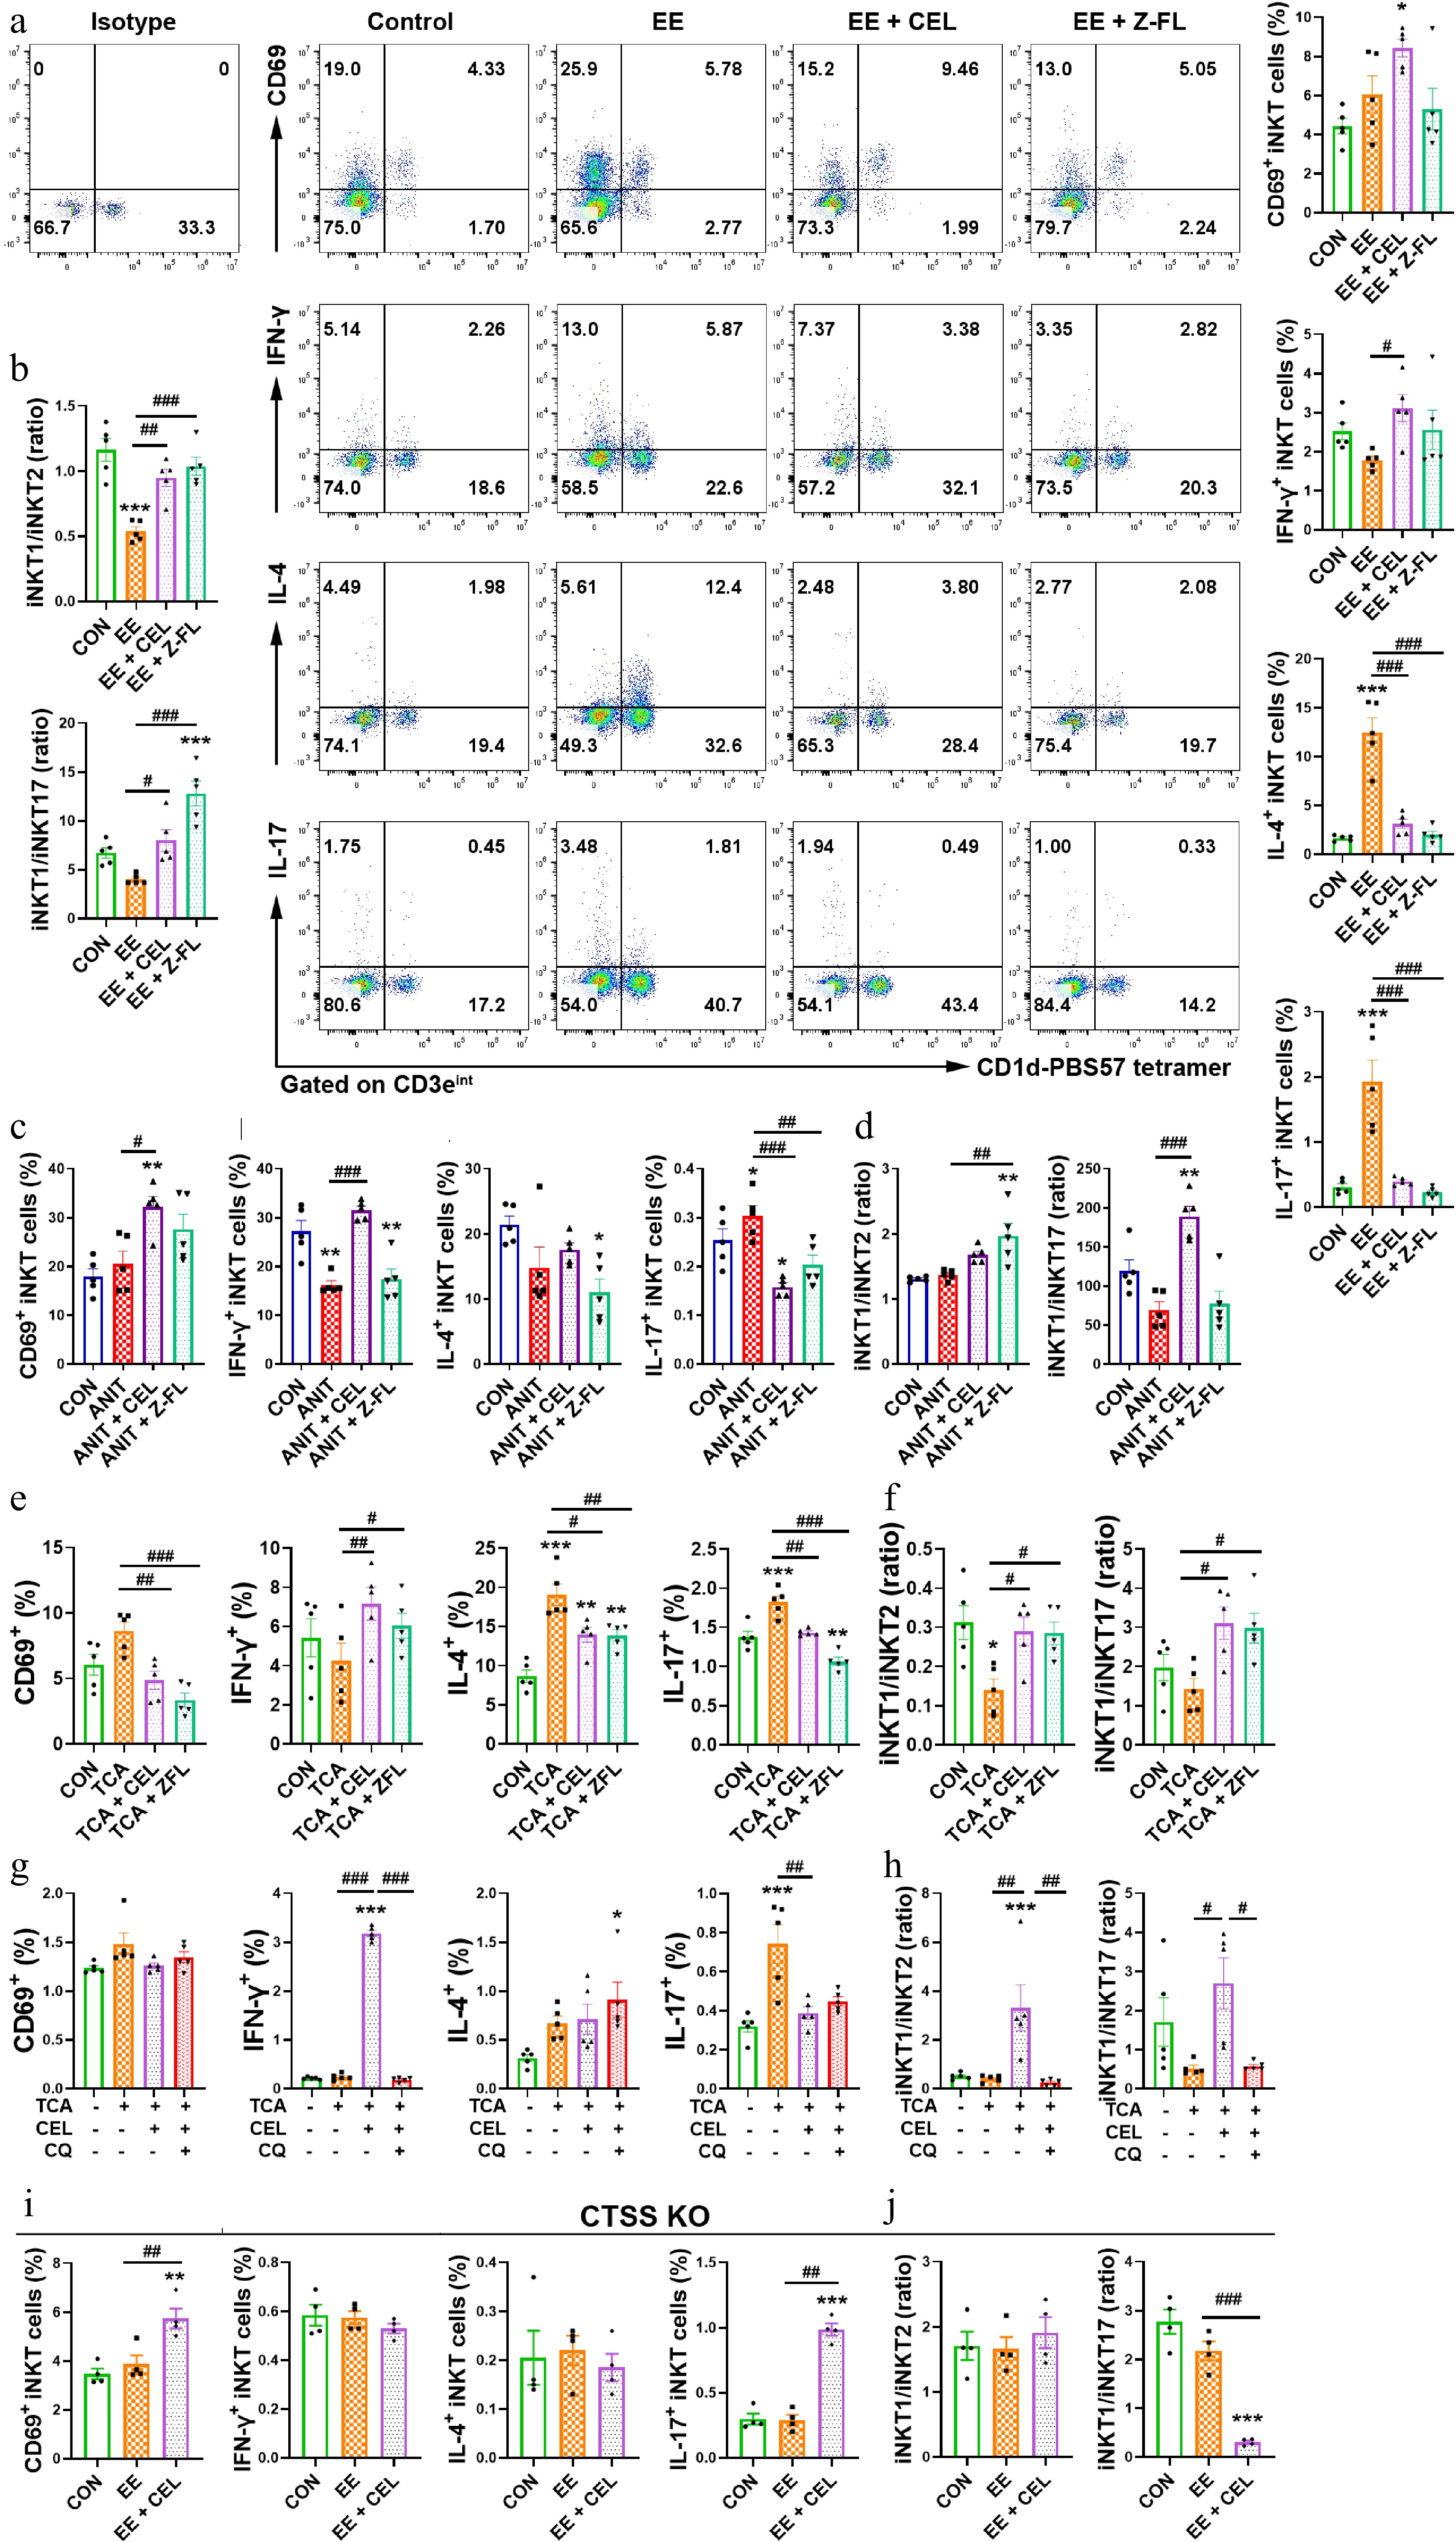
Figure 6.
CTSS inhibition promotes an iNKT1 subtype bias. (a), (c), (e), (g), and (i) The percentages of activated (CD69+) iNKT, IFN-γ+ iNKT1, IL-4+ iNKT2 and IL-17+ iNKT17 cell subsets. (b), (d), (f), (h), and (j) iNKT1/iNKT2 and iNKT1/iNKT17 ratios. Data are presented as mean ± SEM, n = 5, * P < 0.05, ** P < 0.01, *** P < 0.001 vs control group; # P < 0.05, ## P < 0.01, ### P < 0.001 vs EE, ANIT, TCA, or TCA + CEL groups.
-
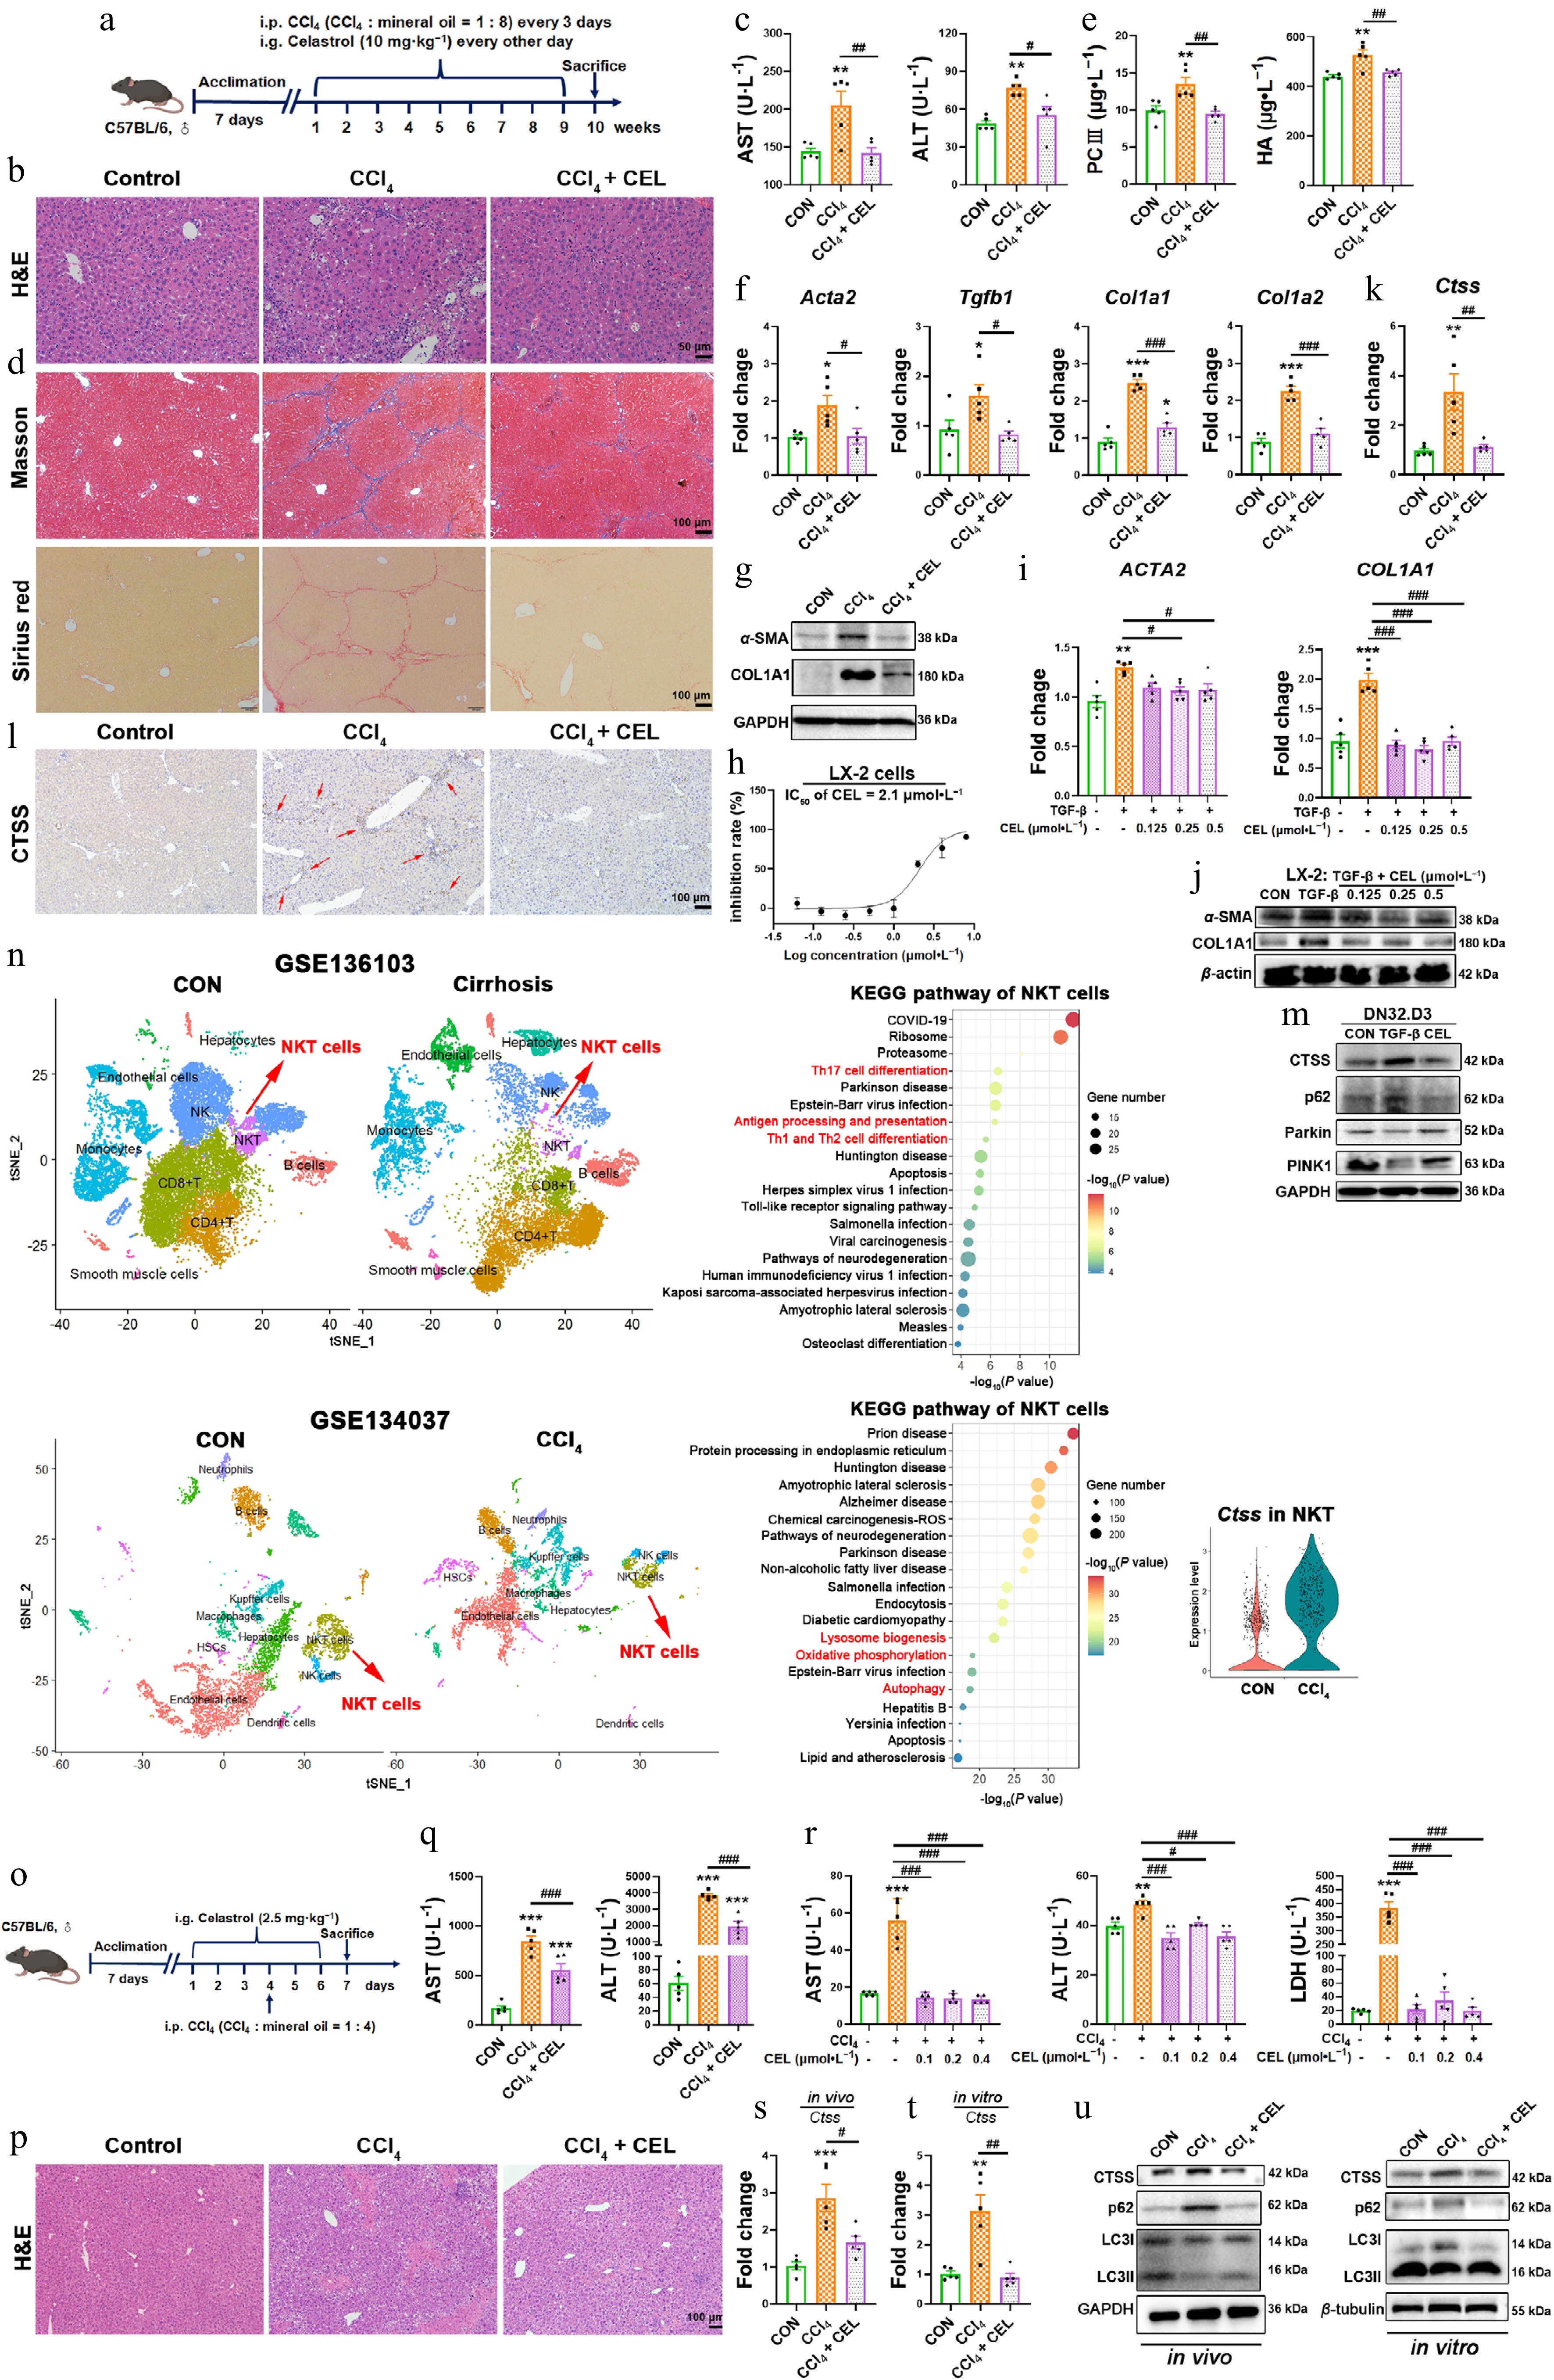
Figure 7.
Celastrol attenuates CCl4-induced liver fibrosis and liver injury via CTSS-autophagy-iNKT1 polarization axis. (a), (o) Experimental schematics. (b), (p) H&E staining of liver sections. (c), (q) Serum AST and ALT levels. (d) Masson's trichrome and Sirius Red staining of liver sections. (e) Serum PCIII and HA levels. (f) Hepatic mRNA expressions of Acta2, Tgfb1, Col1a1, and Col1a2. (g), (j) Protein levels of α-SMA and COL1A1. (h) Cytotoxicity of celastrol in LX-2 cells. The mRNA expressions of (i) ACTA2, COL1A1, and (k), (s), and (t) Ctss. (l) Immunohistochemistry, and (m) Western blotting measurement of CTSS, p62, Parkin, and PINK1 proteins. (n) UMAP analysis was performed on liver cirrhosis patients and healthy control (CON, GSE136103), or liver nonparenchymal cells from CCl4 and control (CON) mice (GSE134037). KEGG enrichment pathway analysis of NKT cells, and CTSS expression in NKT cells (GSE134037). (r) The levels of AST, ALT, and LDH in cell supernatant. (u) The protein levels of CTSS and autophagy markers in liver tissue and iNKT cells. Data are presented as mean ± SEM, n = 5, * P < 0.05, ** P < 0.01, *** P < 0.001 vs control group; # P < 0.05, ## P < 0.01, ### P < 0.001 vs CCl4 or TGF-β group.
-
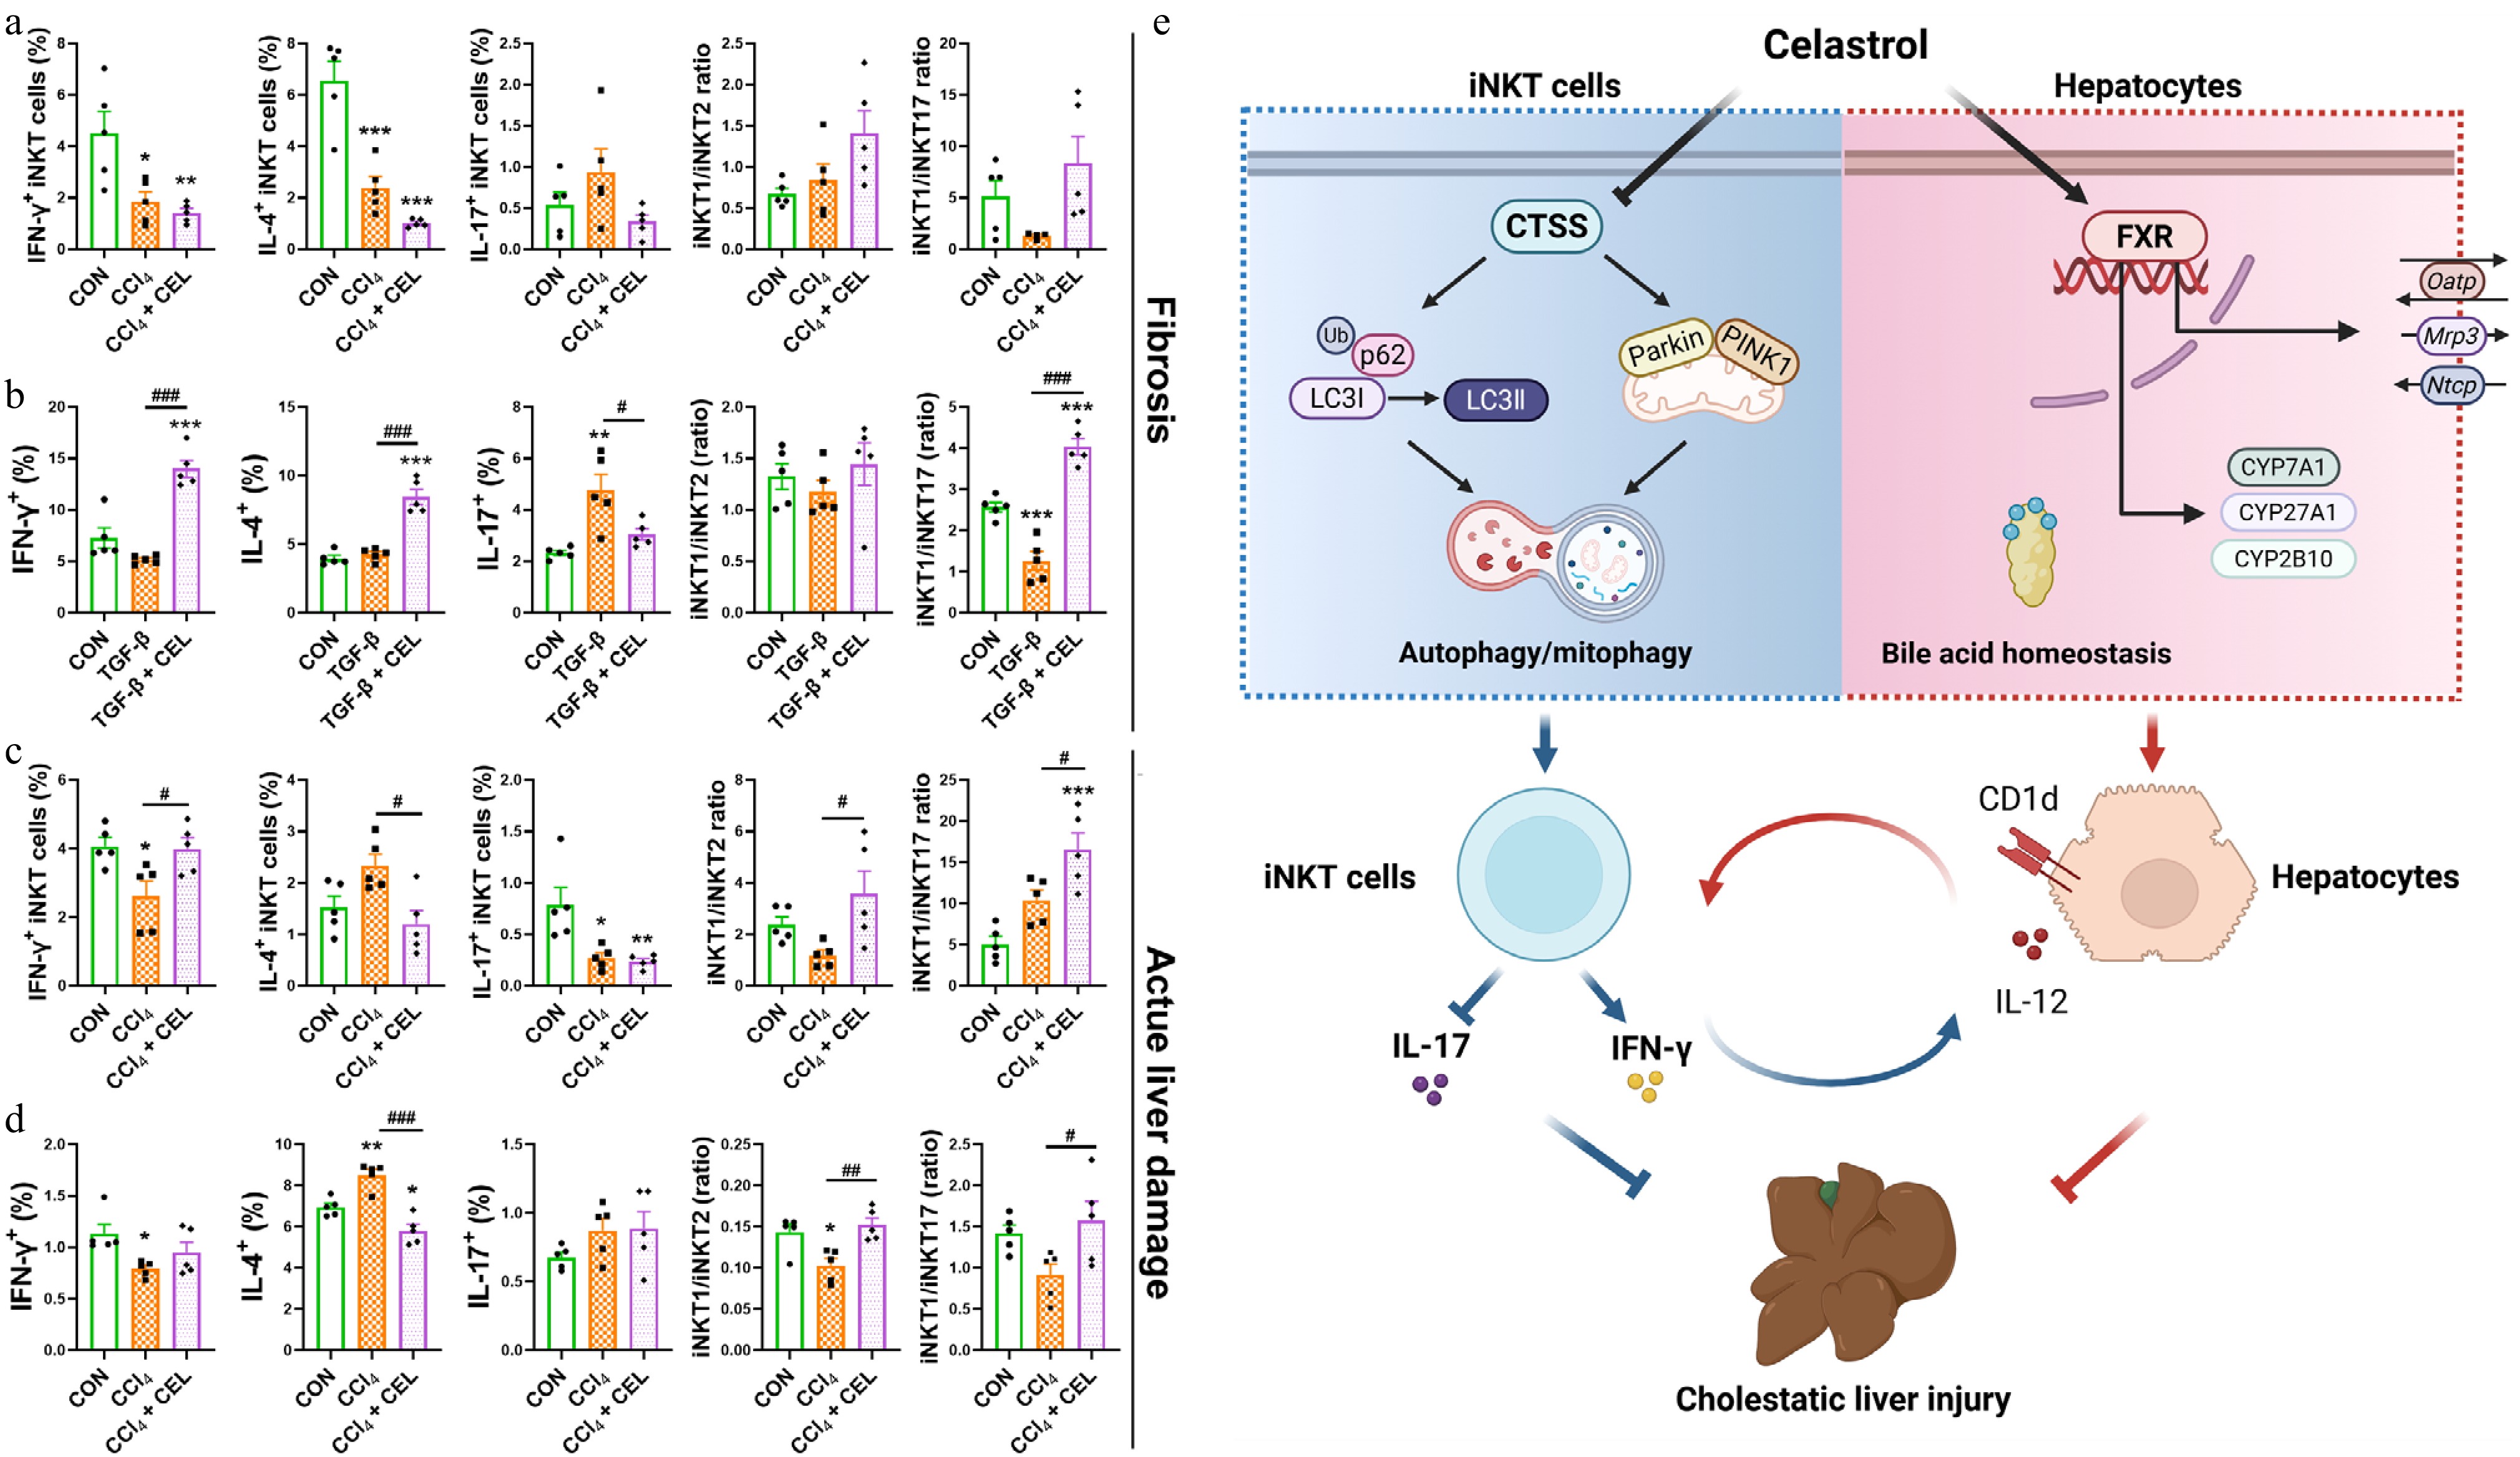
Figure 8.
Celastrol promotes an iNKT1 subtype bias in CCl4-induced liver fibrosis and liver injury models. (a) The percentages of activated (CD69+) iNKT cells, iNKT1, 2, 17 cell subsets, and iNKT1/iNKT2, iNKT1/iNKT17 ratios in the fibrosis model, and (b) in iNKT cells from the co-culture systems. (c) Corresponding iNKT cell profiles in the acute liver injury model and (d) in iNKT cells from the co-culture systems. (e) Graphical abstract. Data are presented as mean ± SEM, n = 5, * P < 0.05, ** P < 0.01, *** P < 0.001 vs control group; # P < 0.05, ## P < 0.01, ### P < 0.001 vs CCl4 or TGF-β group.
Figures
(8)
Tables
(0)