-
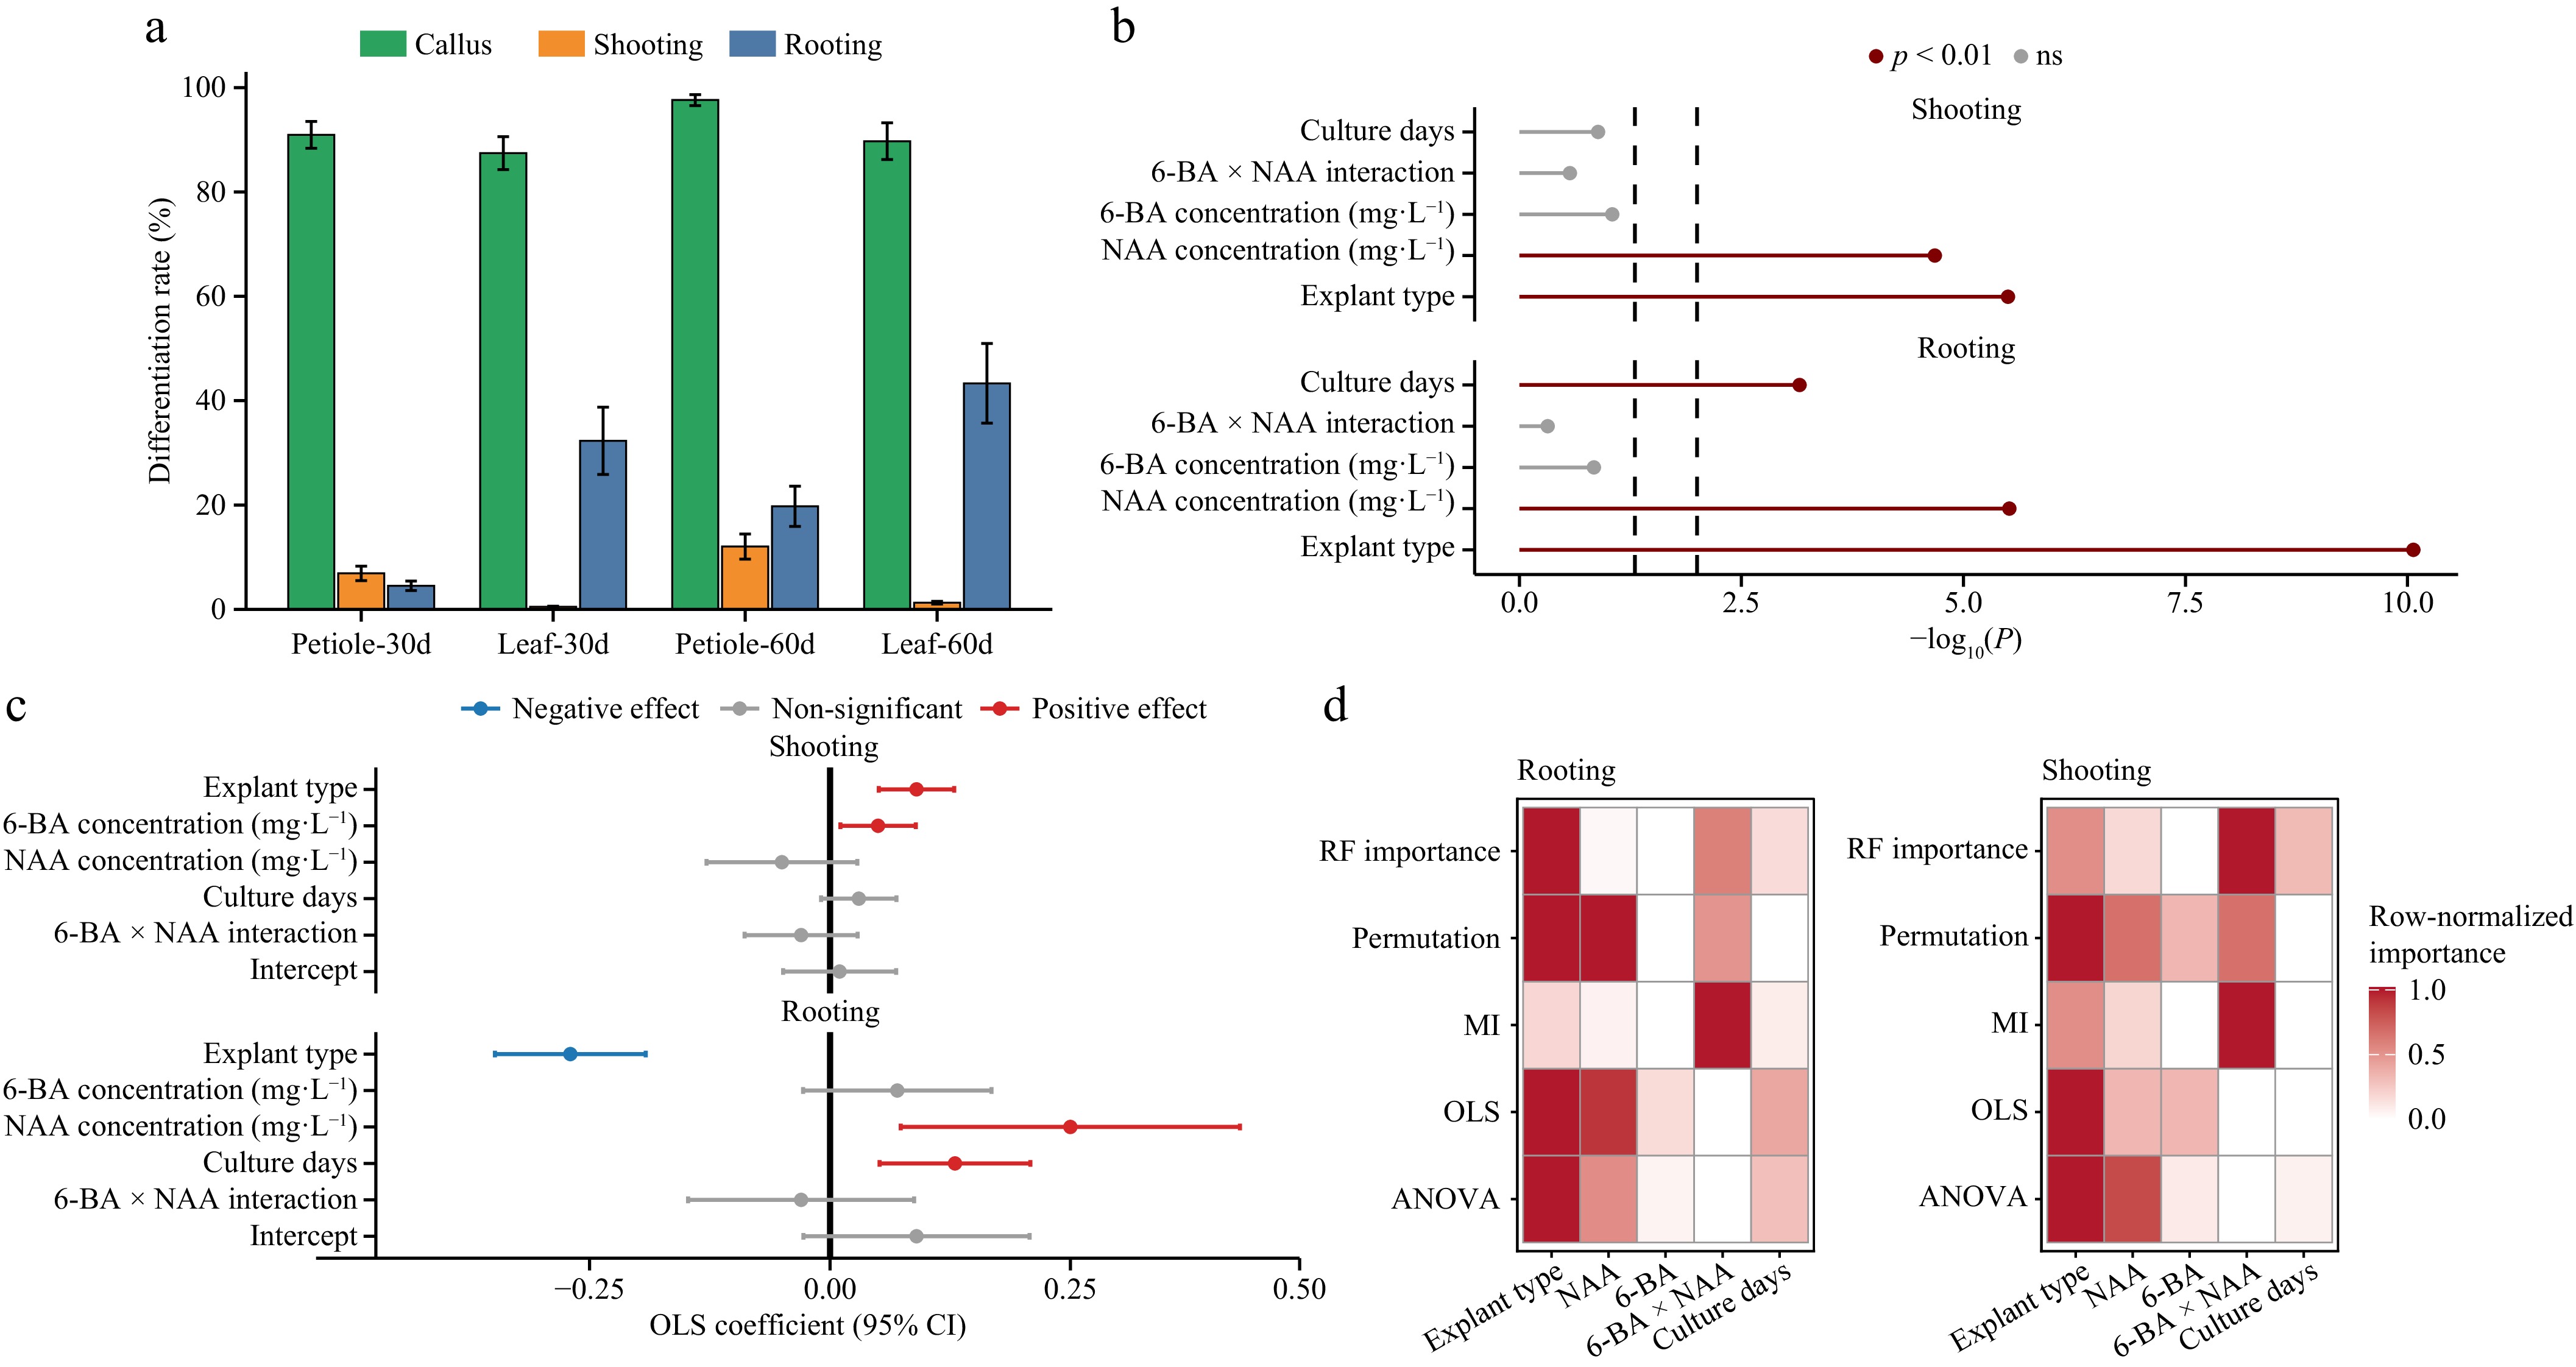
Figure 2.
Statistical effects of explant type and hormone combinations on differentiation rates. (a) Mean (± SE) differentiation rates of leaf and petiole explants cultured for 30 and 60 d. Callus induction (green), shoot formation (orange), and rooting (blue) are shown. (b) Forest plot of two-way ANOVA results. The x-axis represents −log10(P), and dashed vertical lines indicate significance thresholds. Colors correspond to p < 0.01 and nonsignificant results (ns). (c) Ordinary least squares (OLS) regression coefficients with 95% confidence intervals. Positive effects are shown in red, negative effects in blue, and nonsignificant effects in gray. The solid vertical line represents zero effect. (d) Consensus heatmap of variable importance across analytical methods (ANOVA, OLS, mutual information, permutation importance, and random forest). Columns represent the explanatory variables (explant type, NAA, 6-BA, 6-BA × NAA interaction, and culture duration). Color intensity indicates the row-normalized relative importance (0–1), with darker shades representing higher importance. All analyses were performed on three biological replicates (n = 3). Detailed statistical results are provided in Supplementary Tables S3−S7, and the multimethod consensus ranking is summarized in Supplementary Table S8.
-
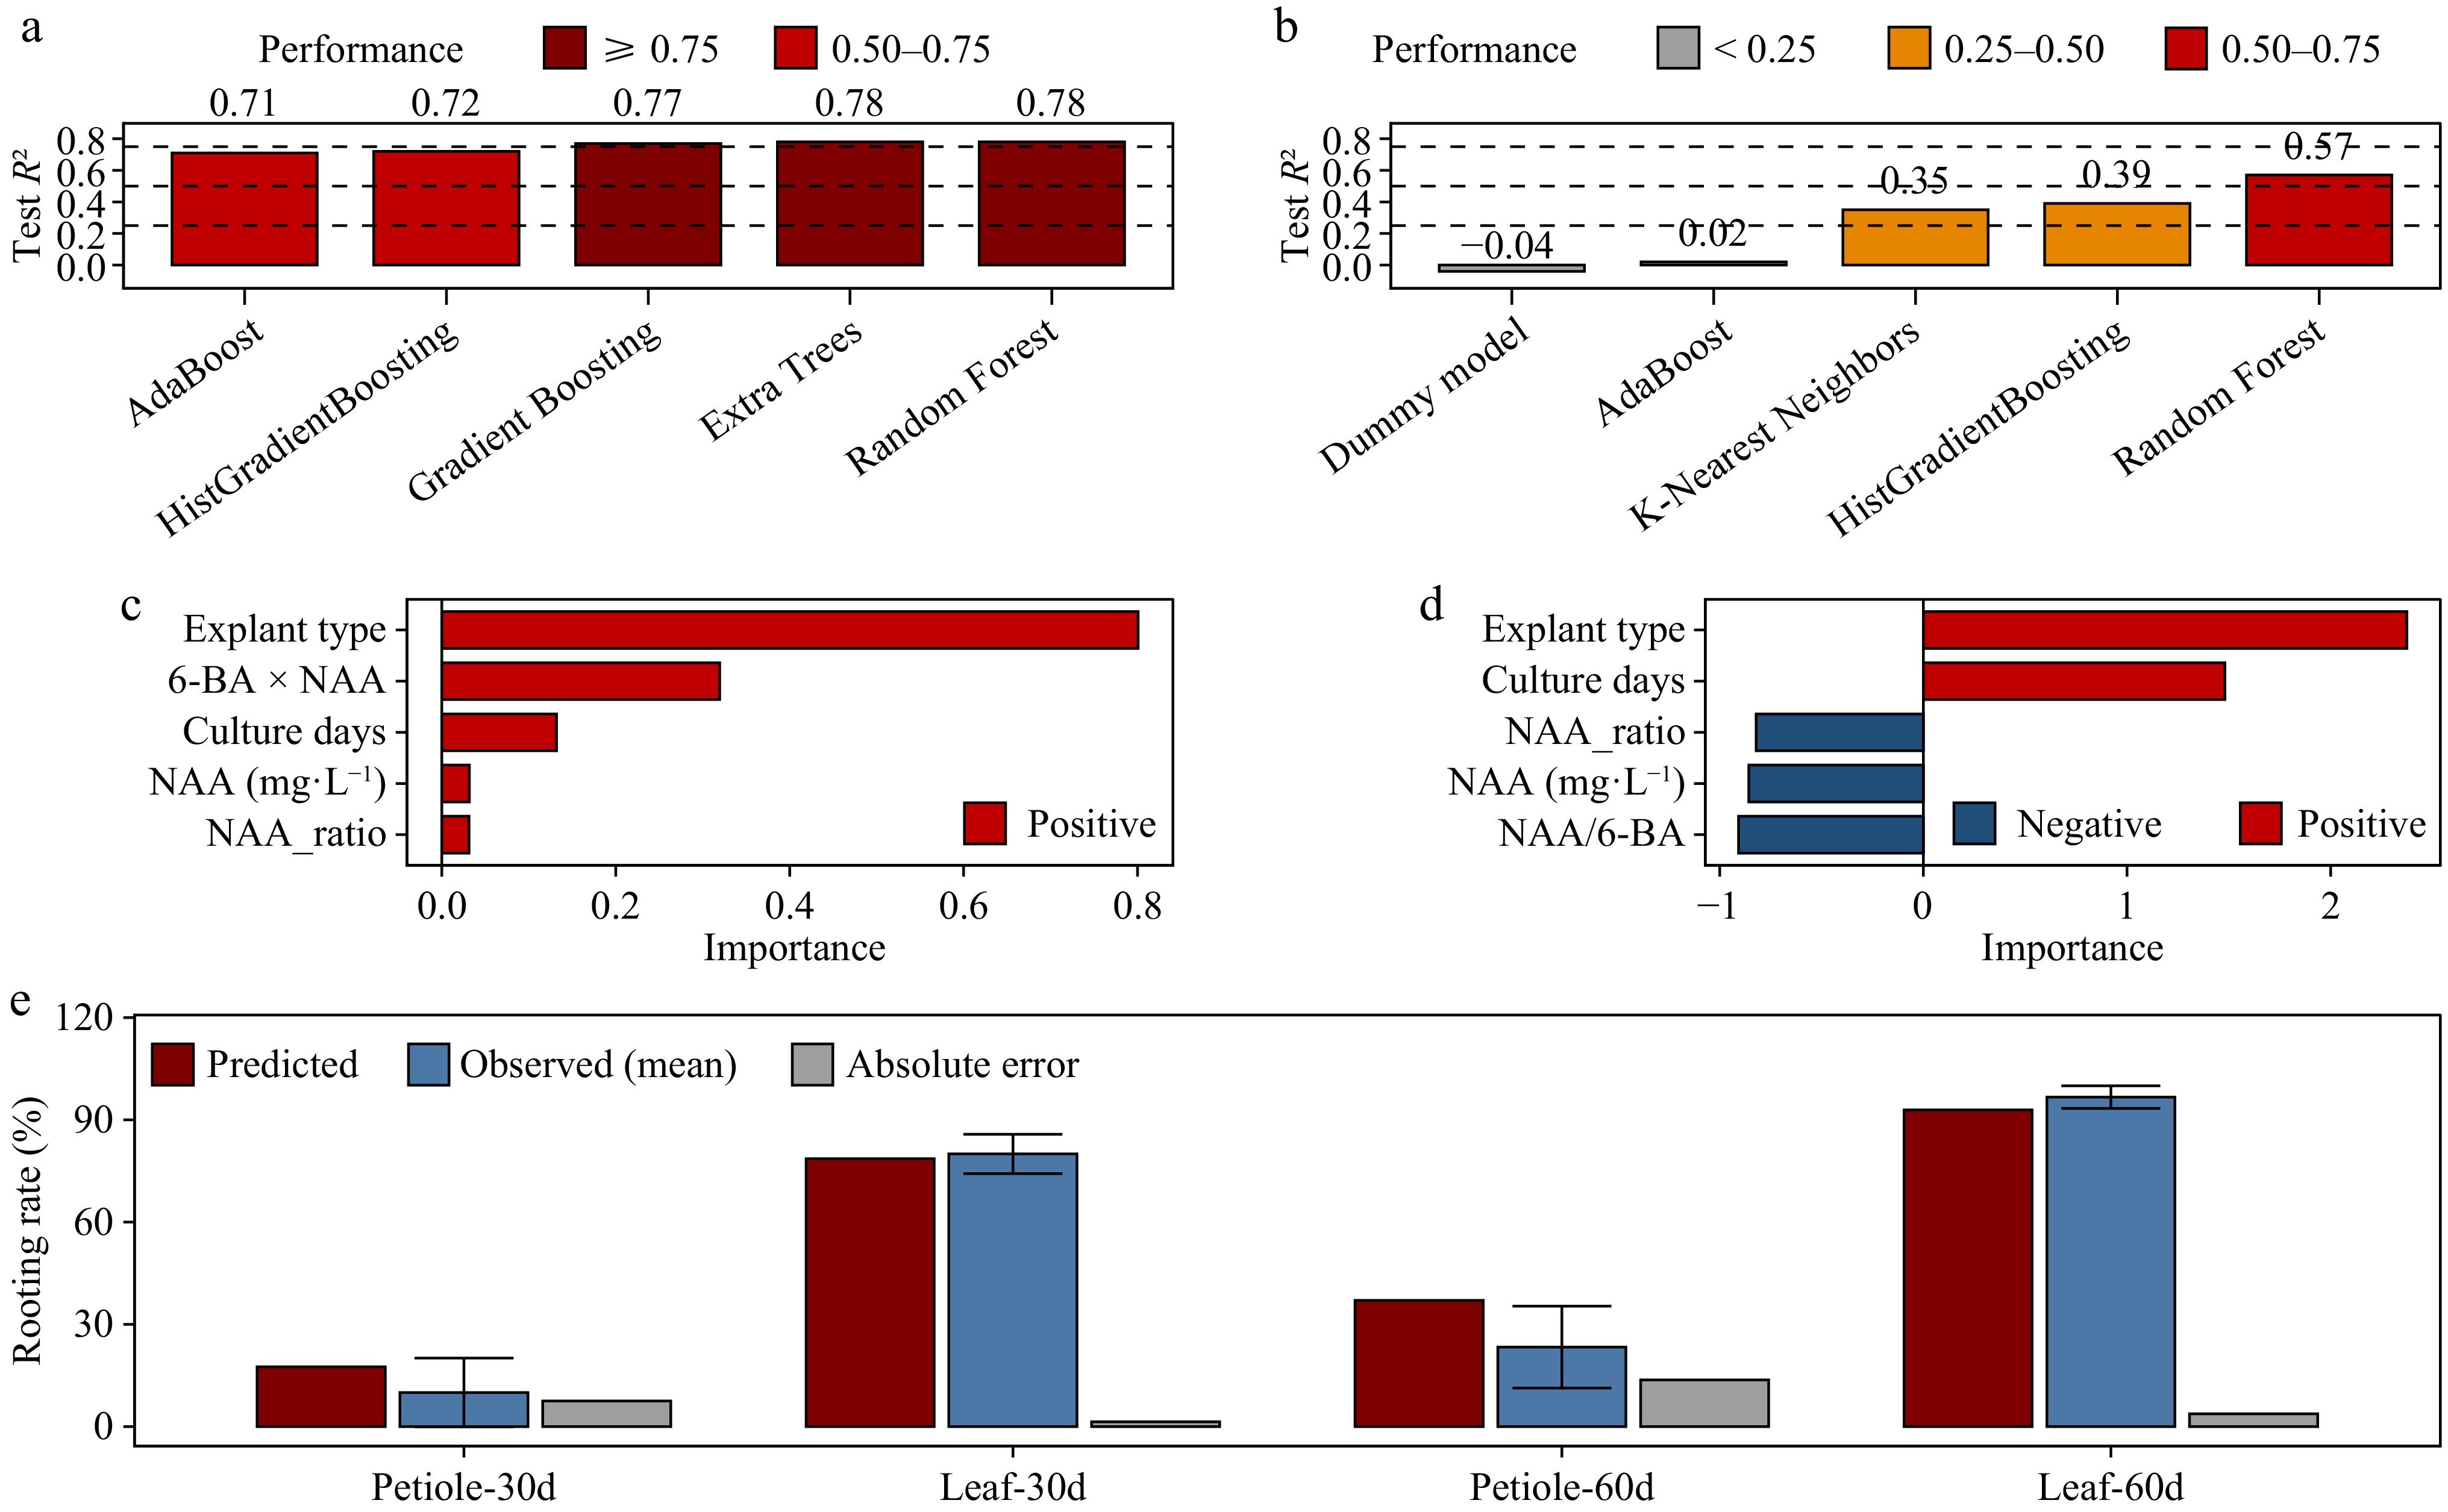
Figure 3.
Machine learning-based analysis of regeneration predictions and factor importance. (a) Test performance (R2) of optimized models for predicting rooting rates. Bars indicate the predictive performance on independent test sets, with colors representing performance categories. Dashed horizontal lines indicate model classification thresholds. (b) Test performance (R2) of optimized models for predicting shooting rates. Model types are shown on the x-axis, and the test R2 on the y-axis; colors indicate performance categories. (c) Top five features contributing to rooting rate predictions in the optimized random forest model. Bar length indicates relative importance; red bars denote positive contributions. (d) Top five features contributing to shooting rate predictions in the optimized random forest model. Red and blue bars indicate positive and negative contributions, respectively; bar length represents the relative effect size. (e) Comparison of predicted and observed rooting rates for model-ranked conditions within the tested experimental space. Red bars indicate predicted values, blue bars indicate observed means, and gray bars indicate absolute prediction errors. Error bars denote the SE of observed values. Treatment groups correspond to explant type and culture duration. For leaf explants, the highest-ranked rooting condition identified by the model corresponded to the best-performing treatment observed experimentally. For petiole explants, the displayed comparisons are based on the experimentally tested hormone combinations closest to the model-ranked conditions and therefore do not represent a prospective validation of untested predictions. All models were trained and evaluated on three biological replicates (n = 3). Detailed performance metrics, feature importance analyses, and predicted vs observed comparisons are provided in Supplementary Tables S8−S14.
Figures
(2)
Tables
(0)