-
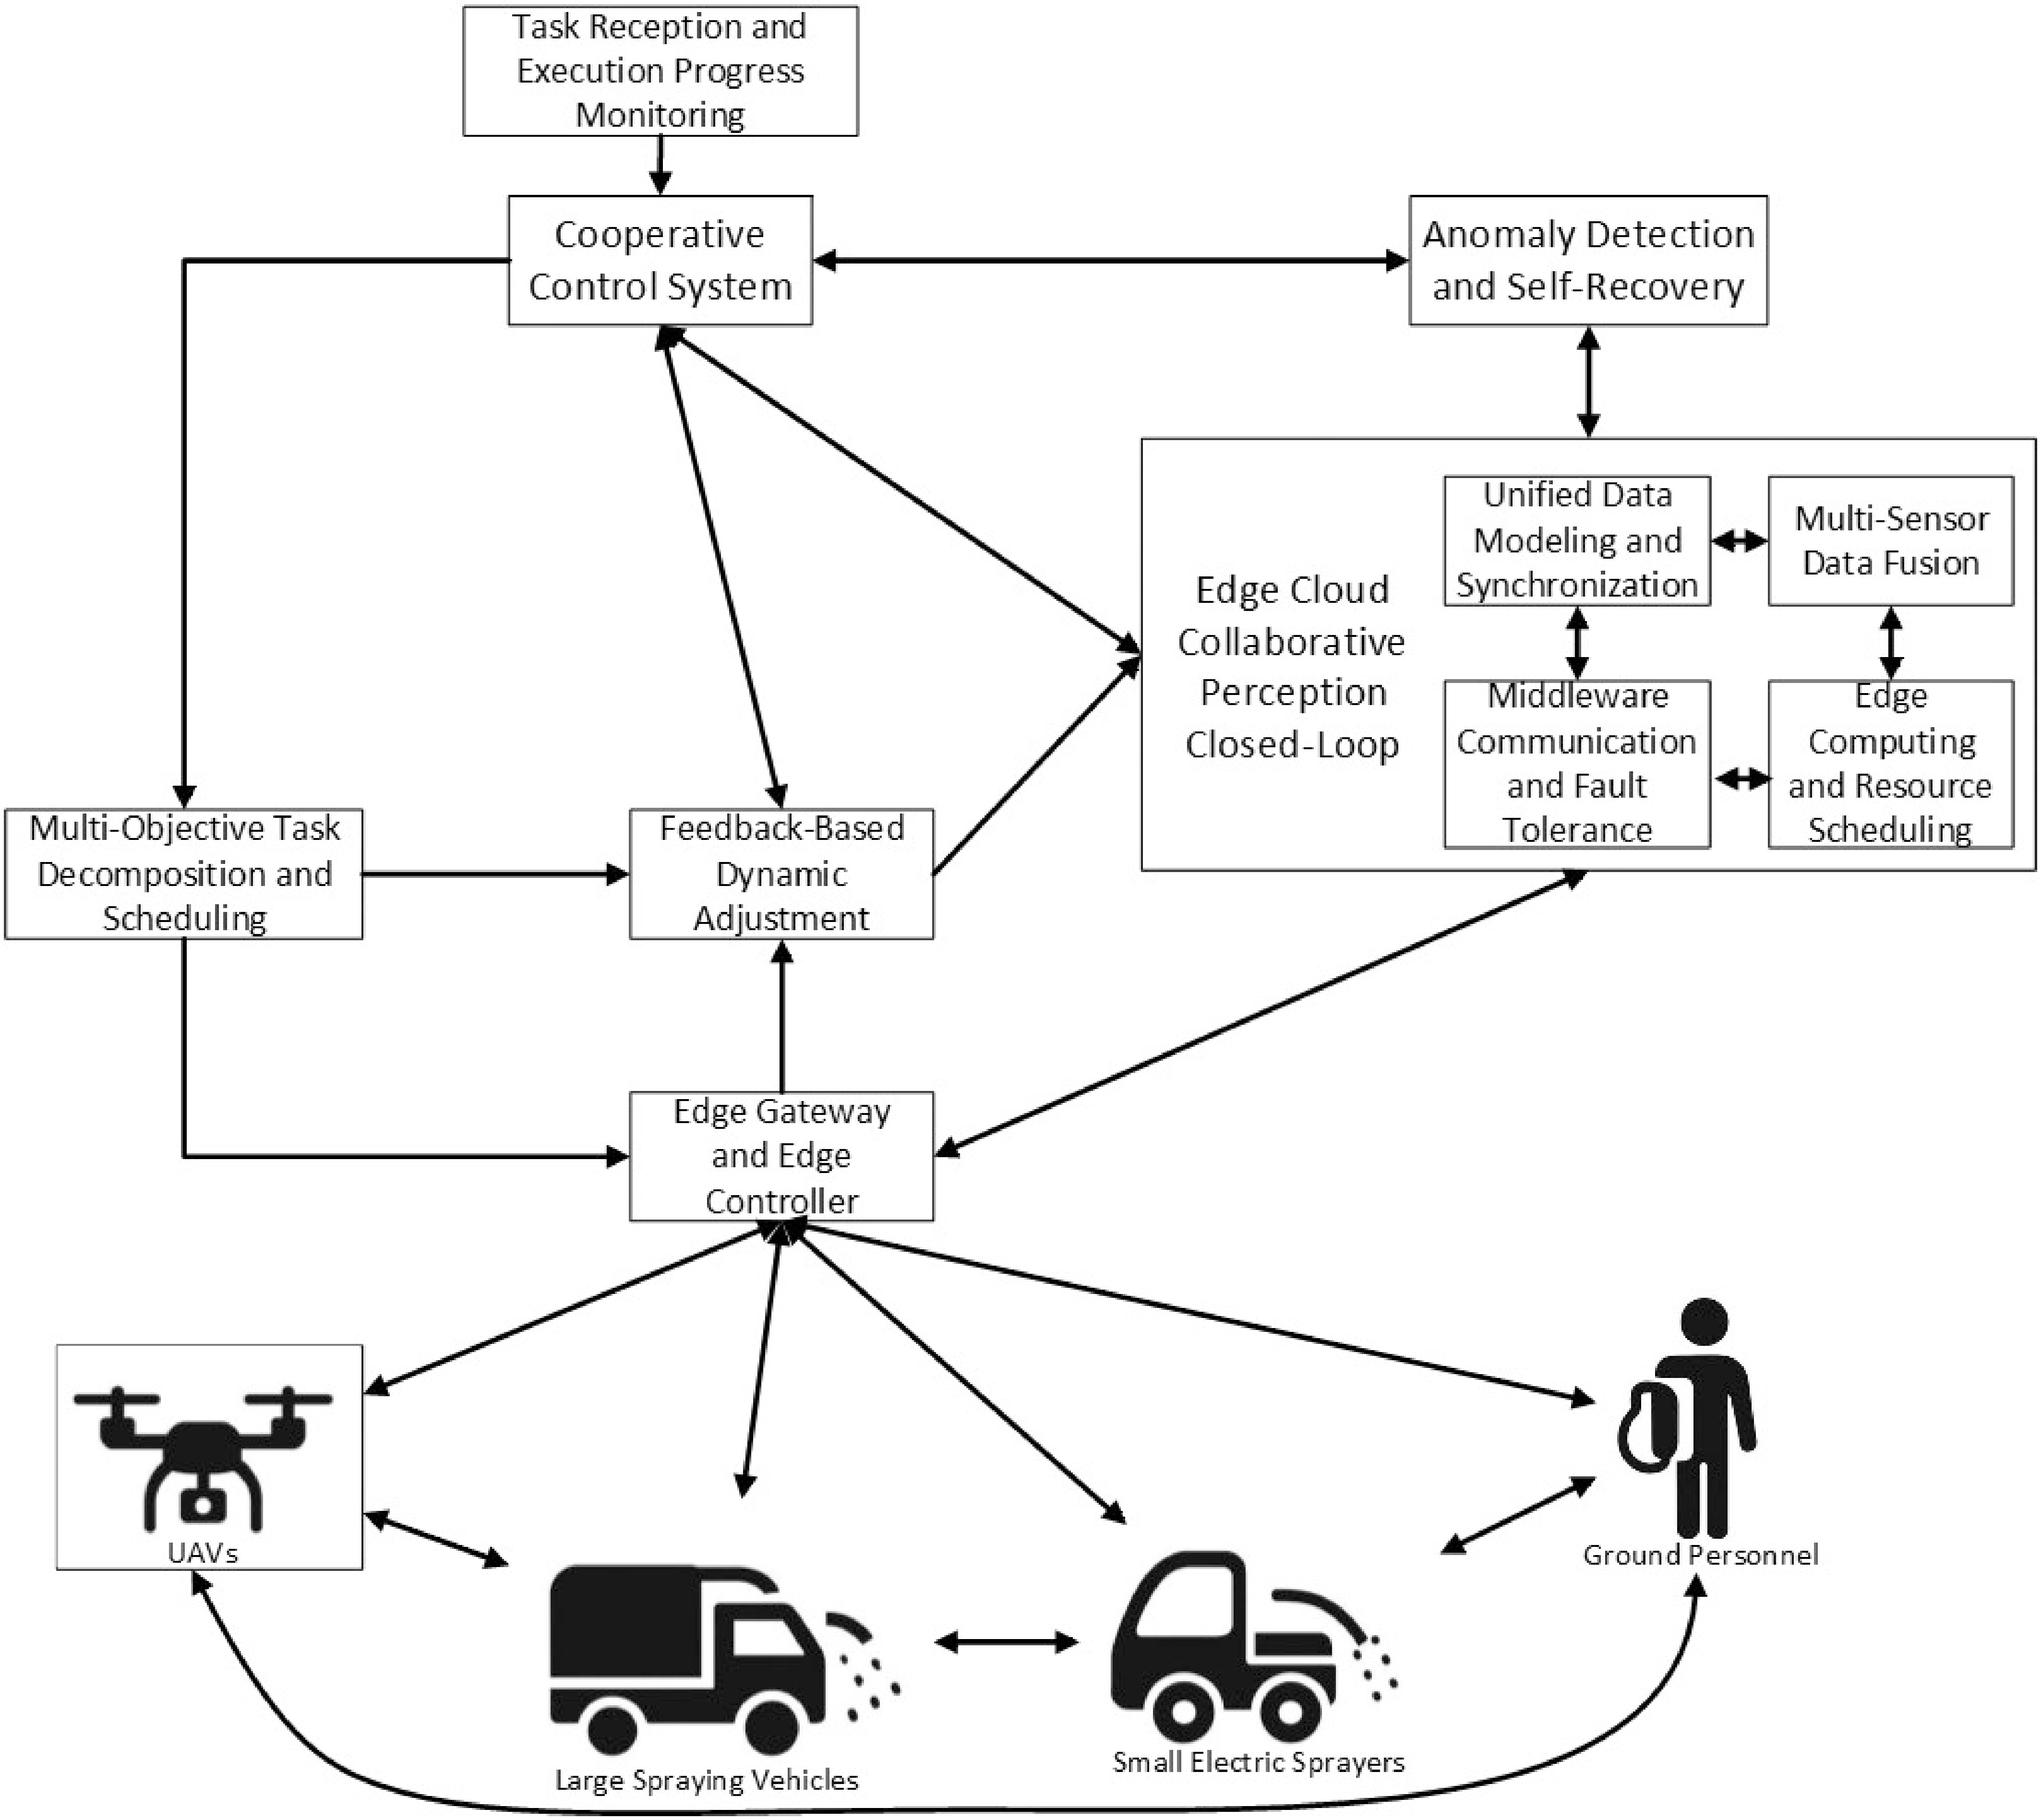
Figure 1.
Architecture diagram of a multi-agent cooperative control system.
-
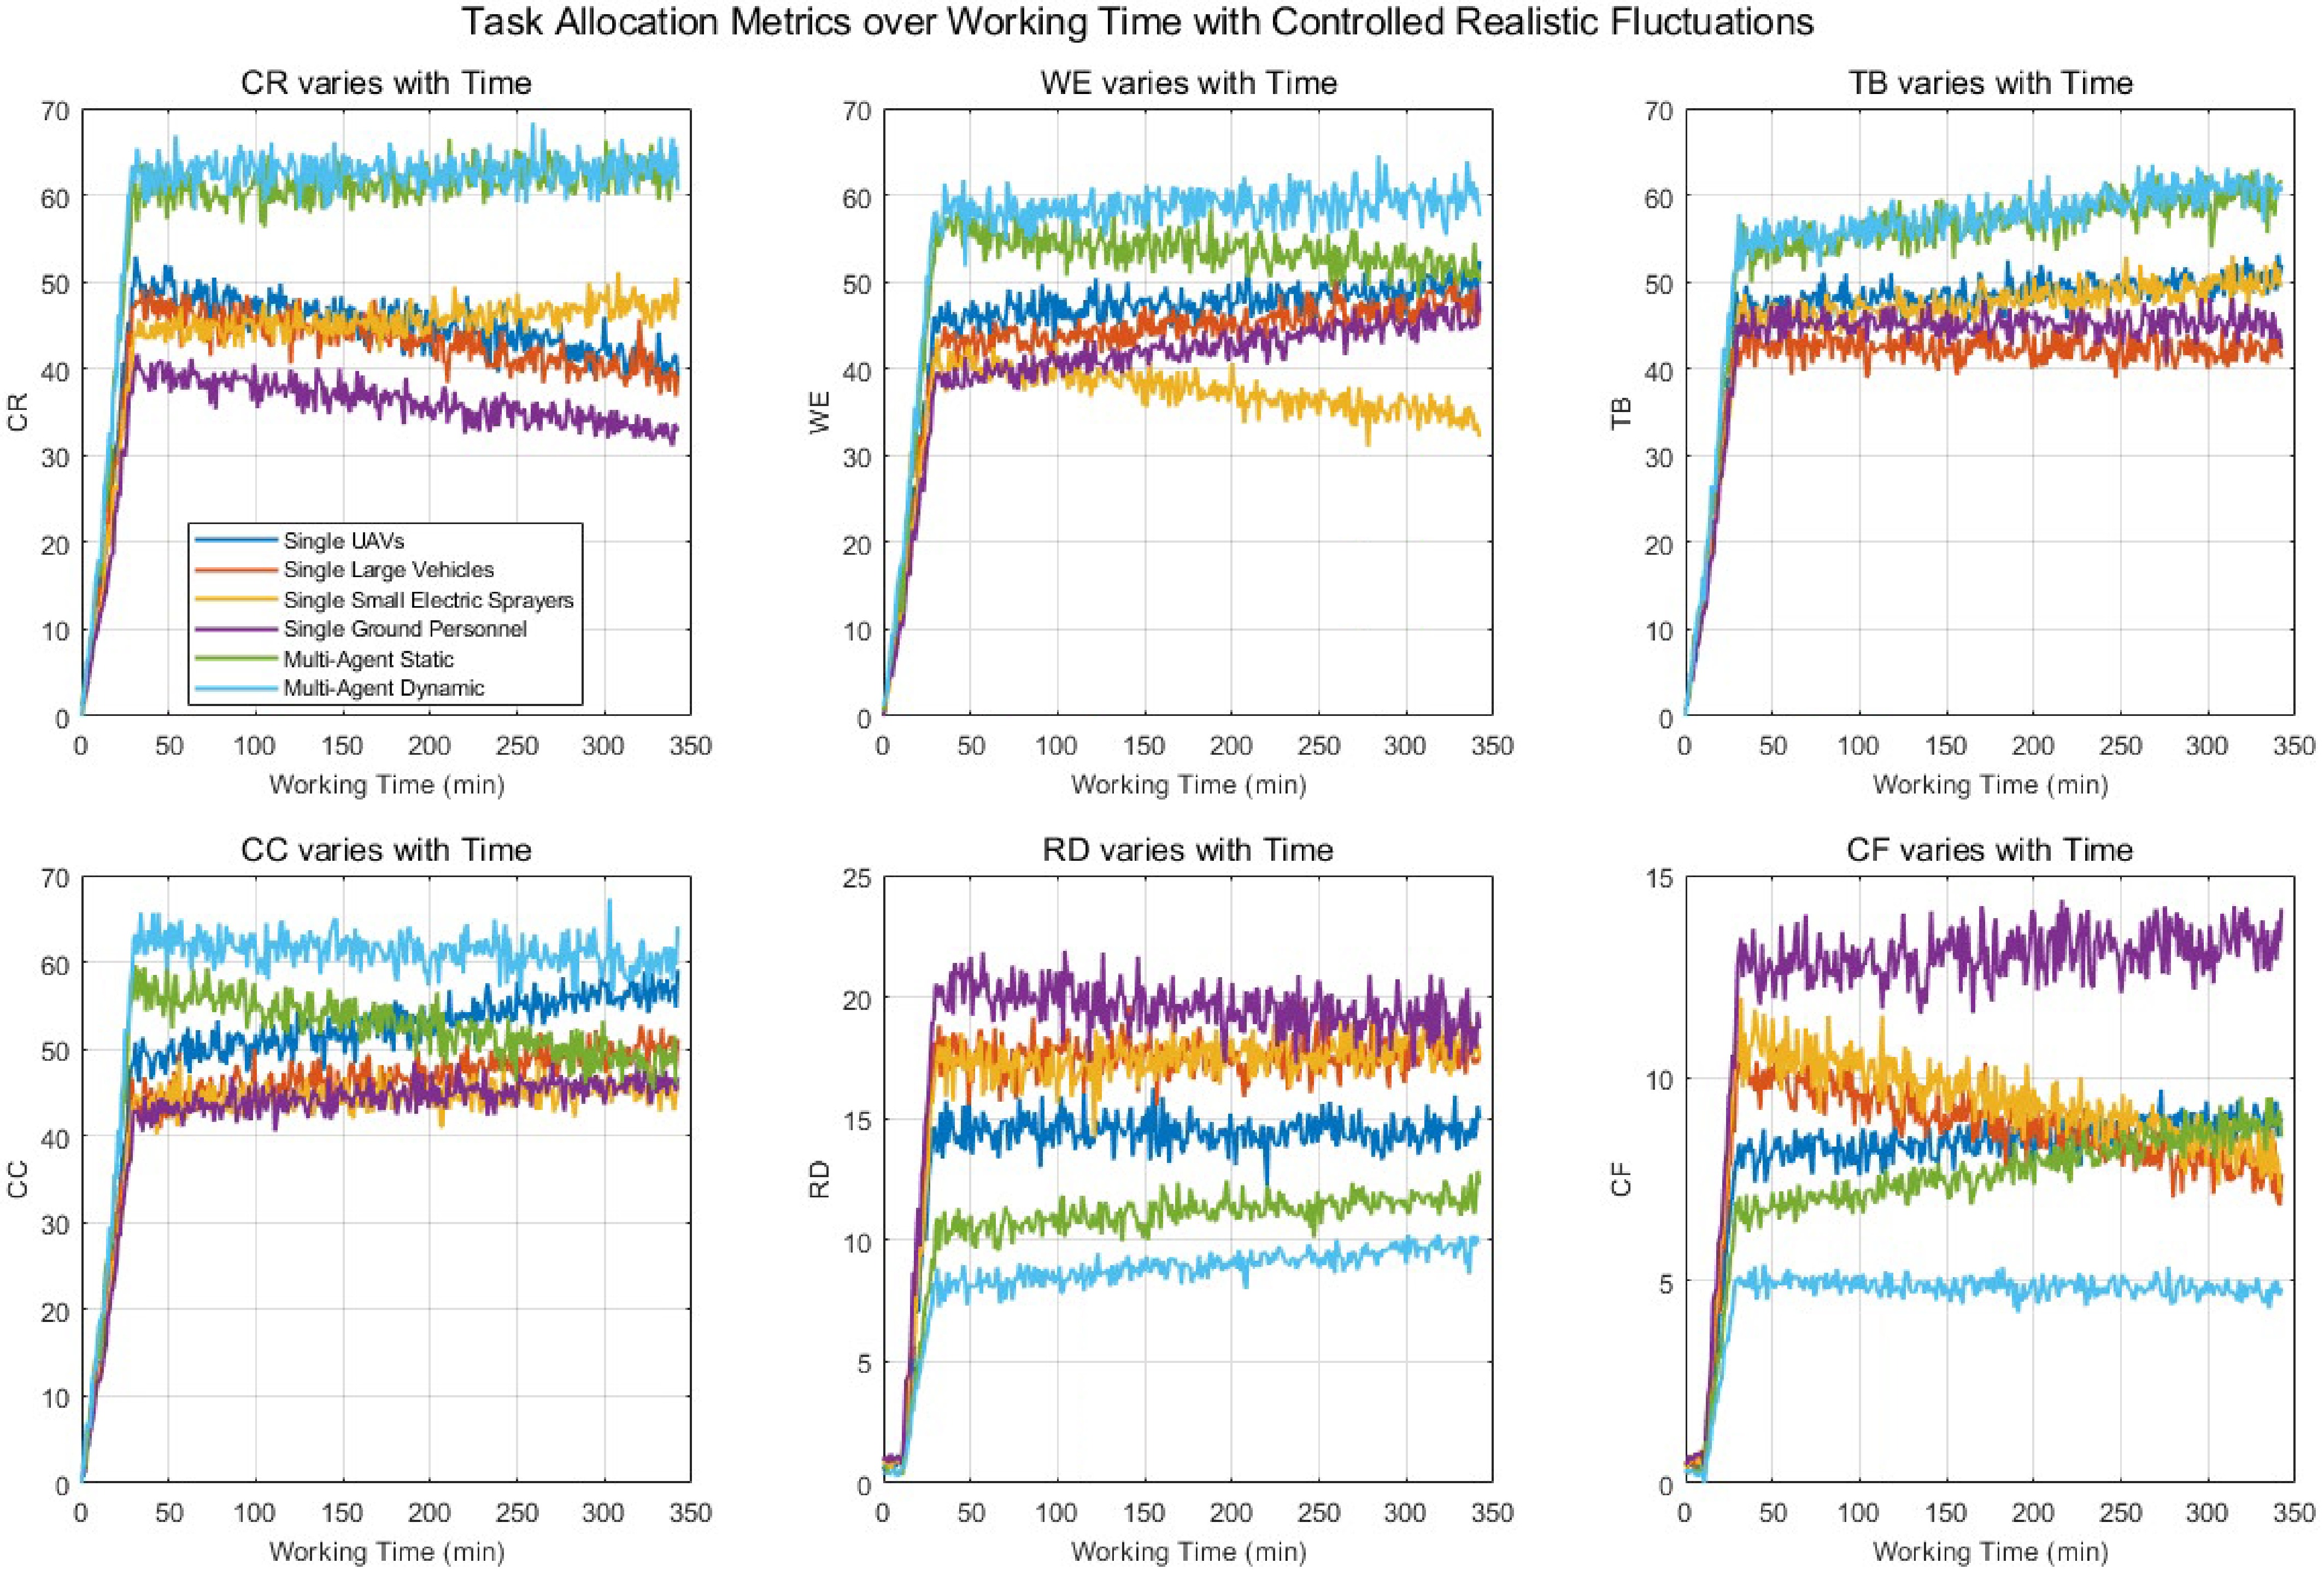
Figure 2.
Task allocation metrics over working time with controlled realistic fluctuations.
-
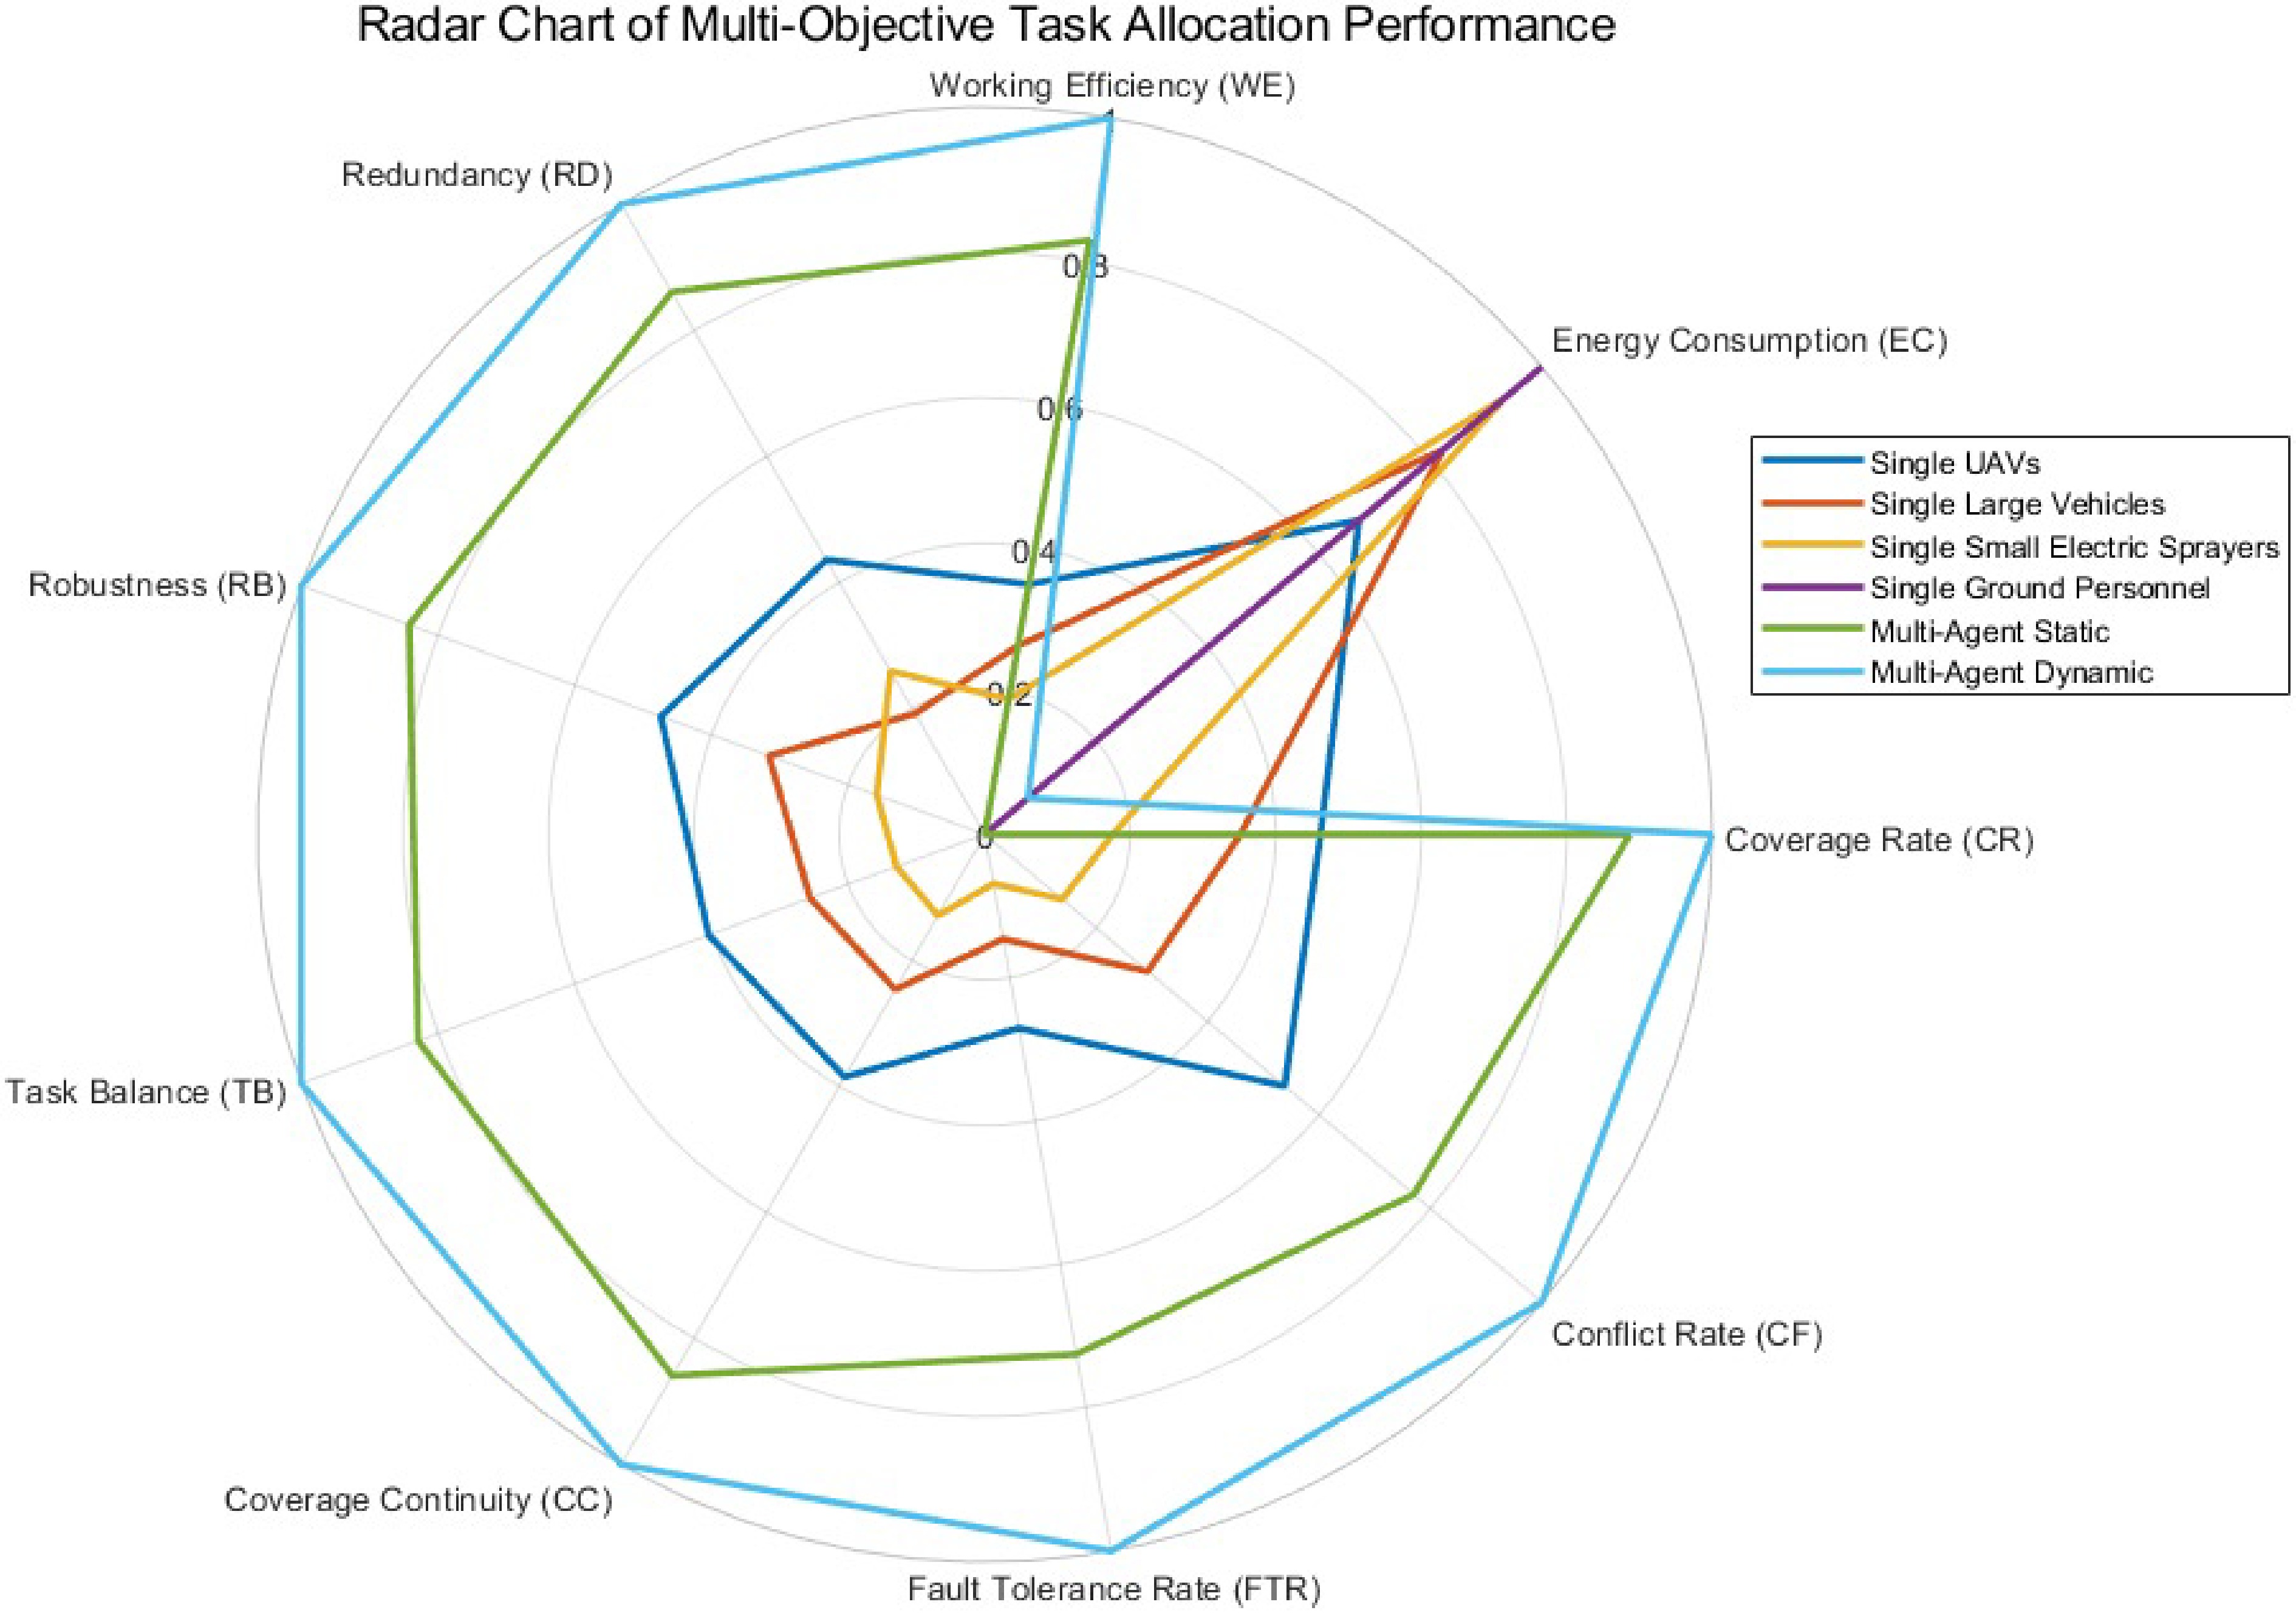
Figure 3.
Radar chart of multi-objective task allocation performance.
-
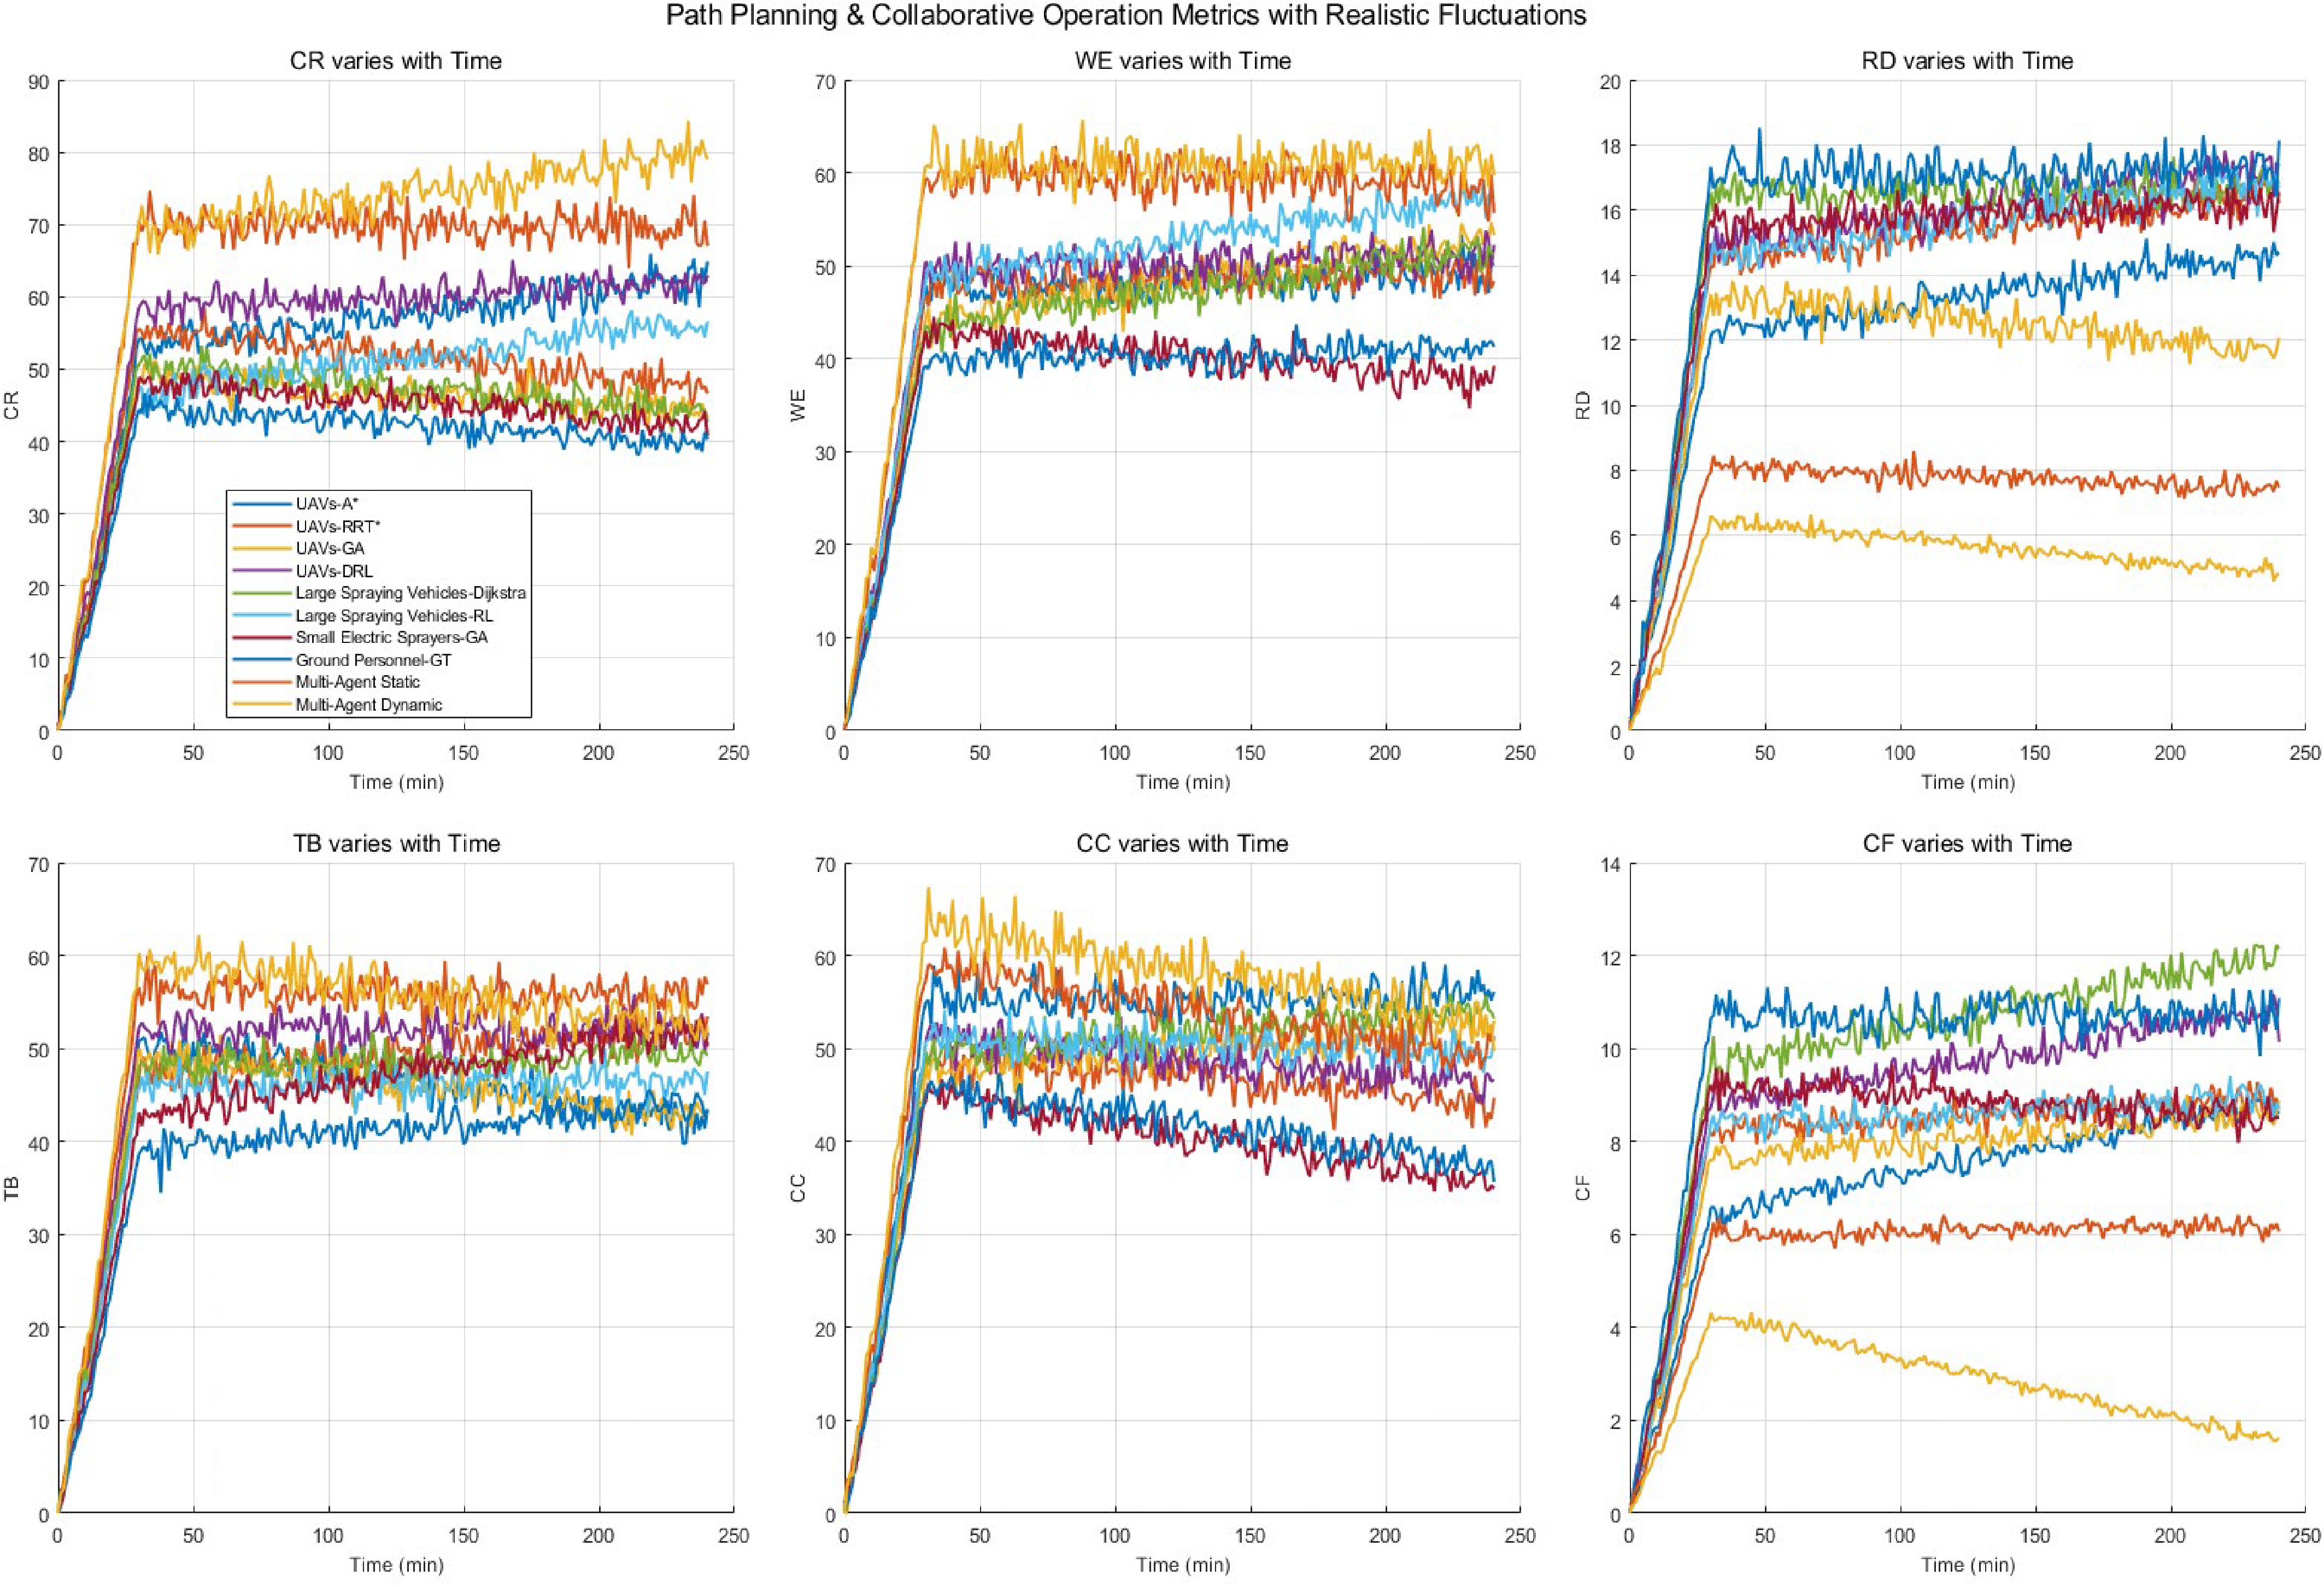
Figure 4.
Path planning and collaborative operation metrics with realistic fluctuations.
-
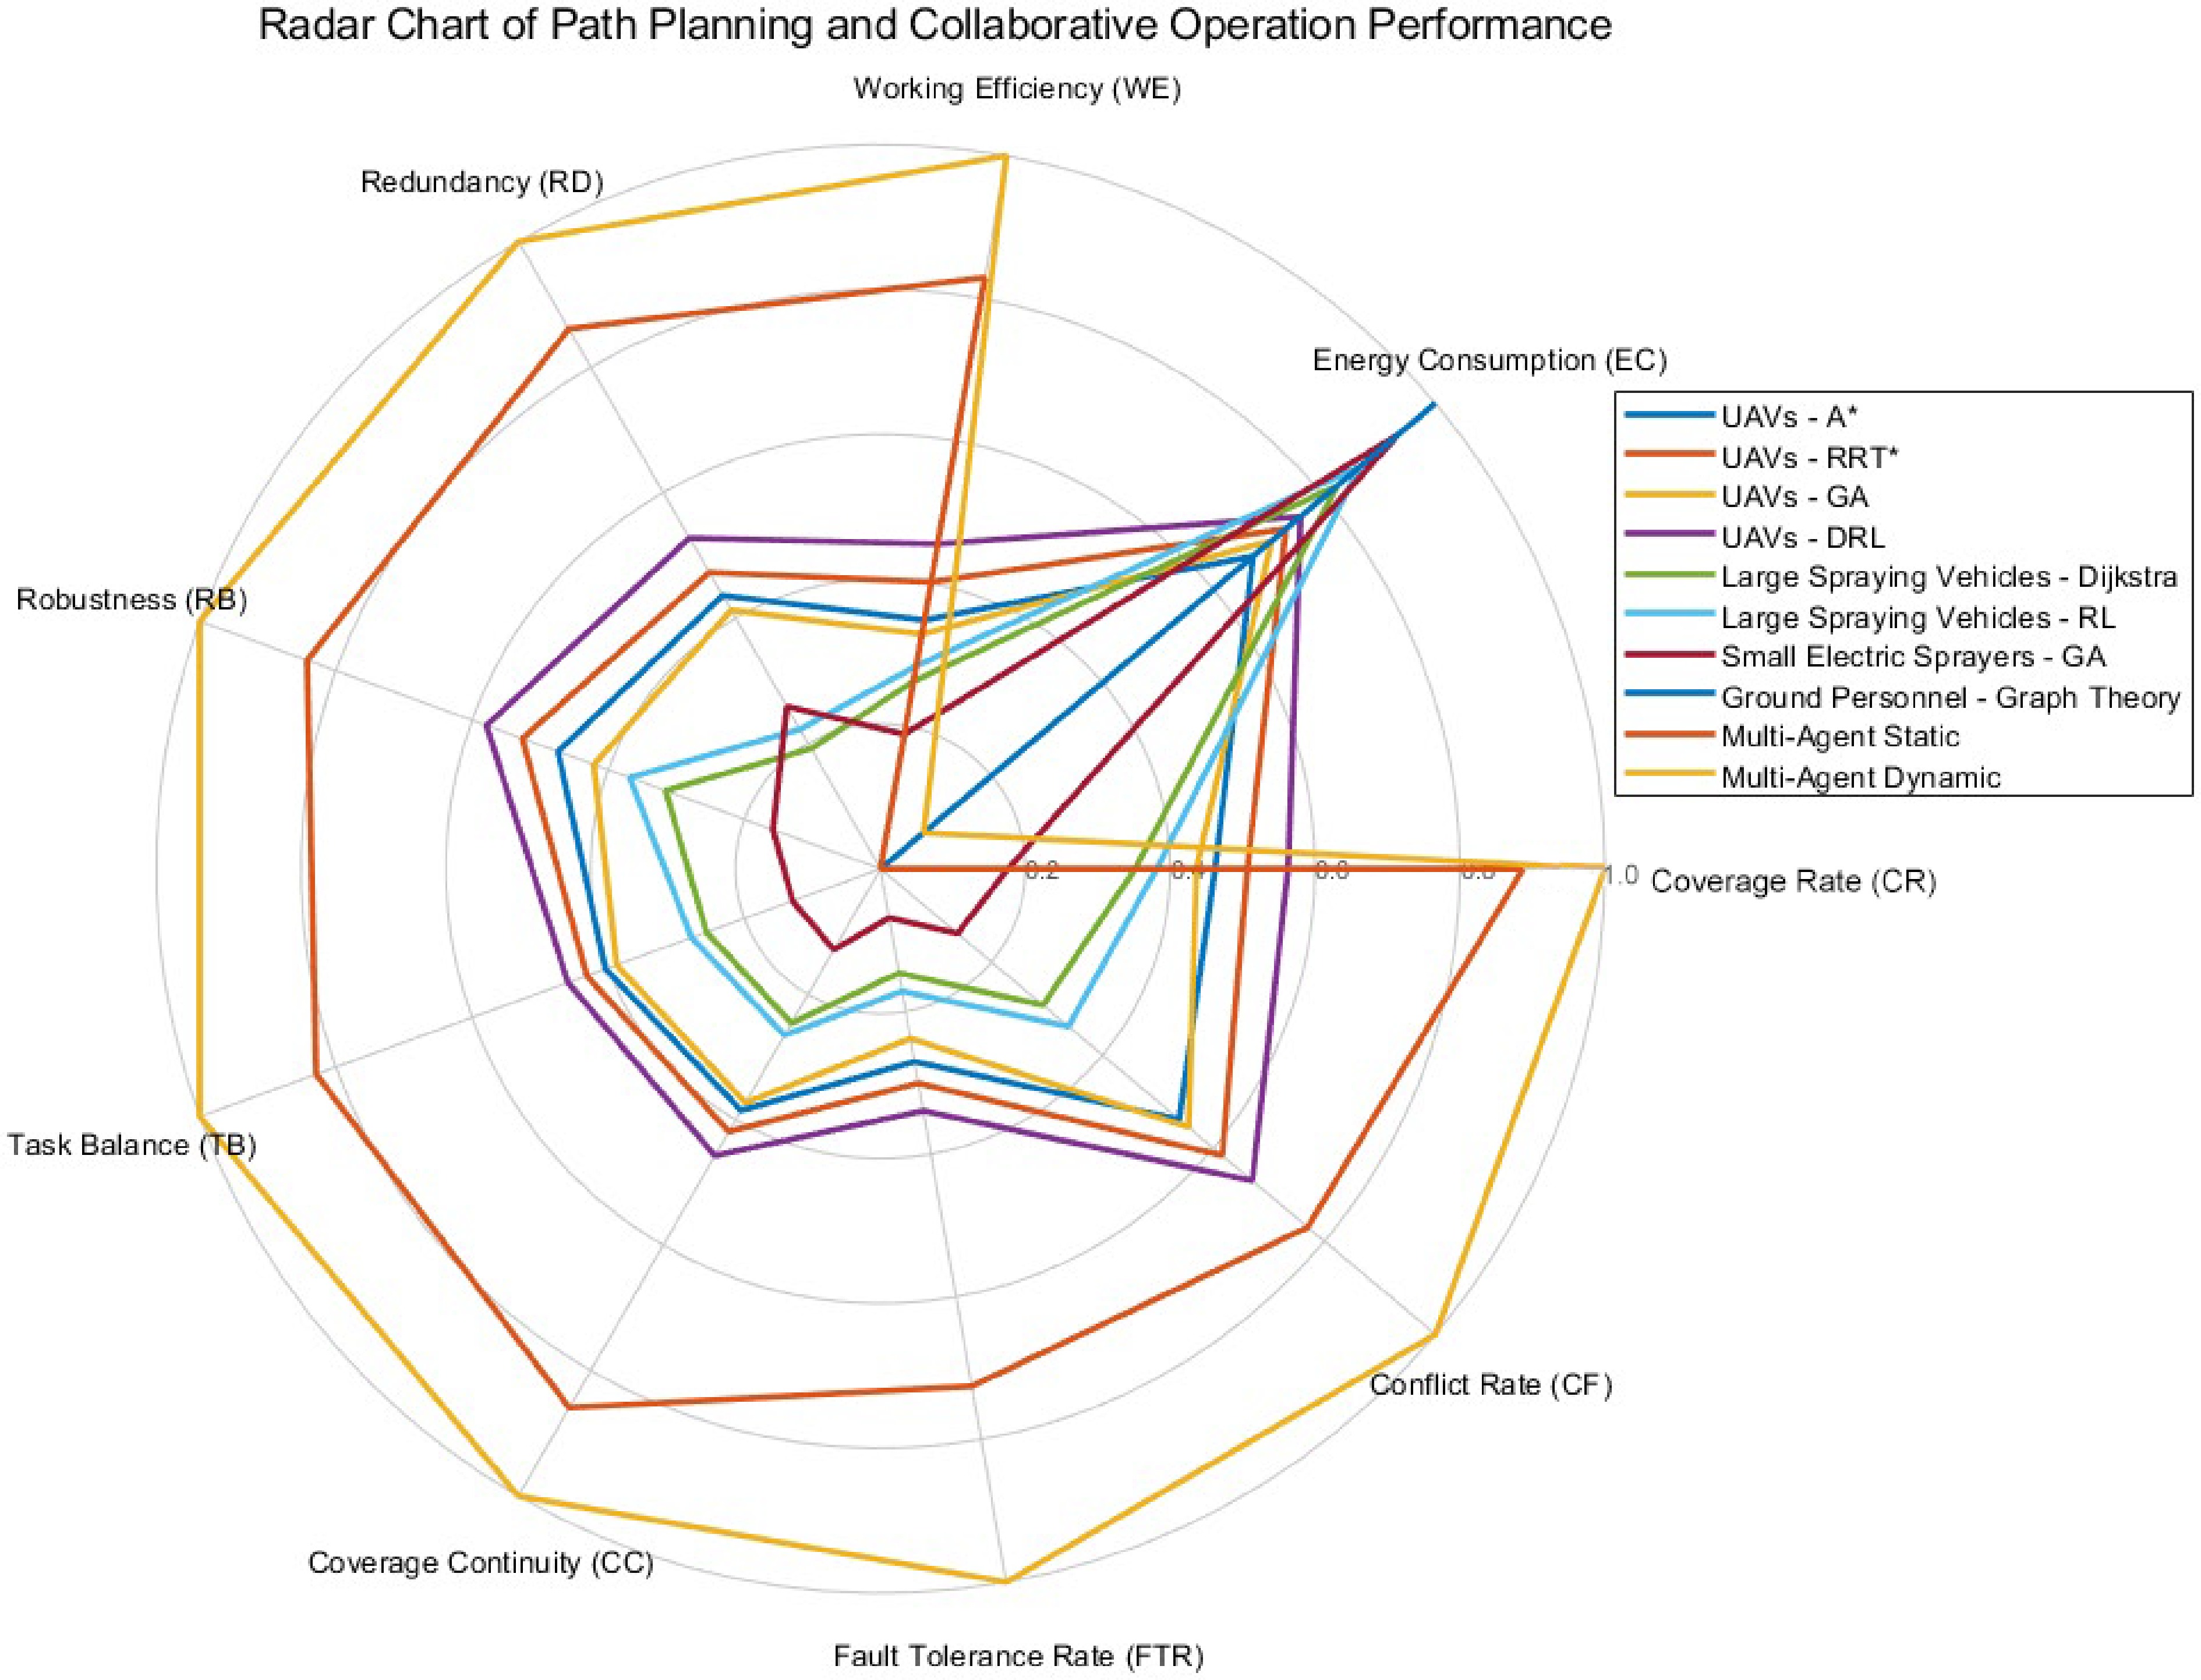
Figure 5.
Radar chart of path planning and collaborative operation performance.
-
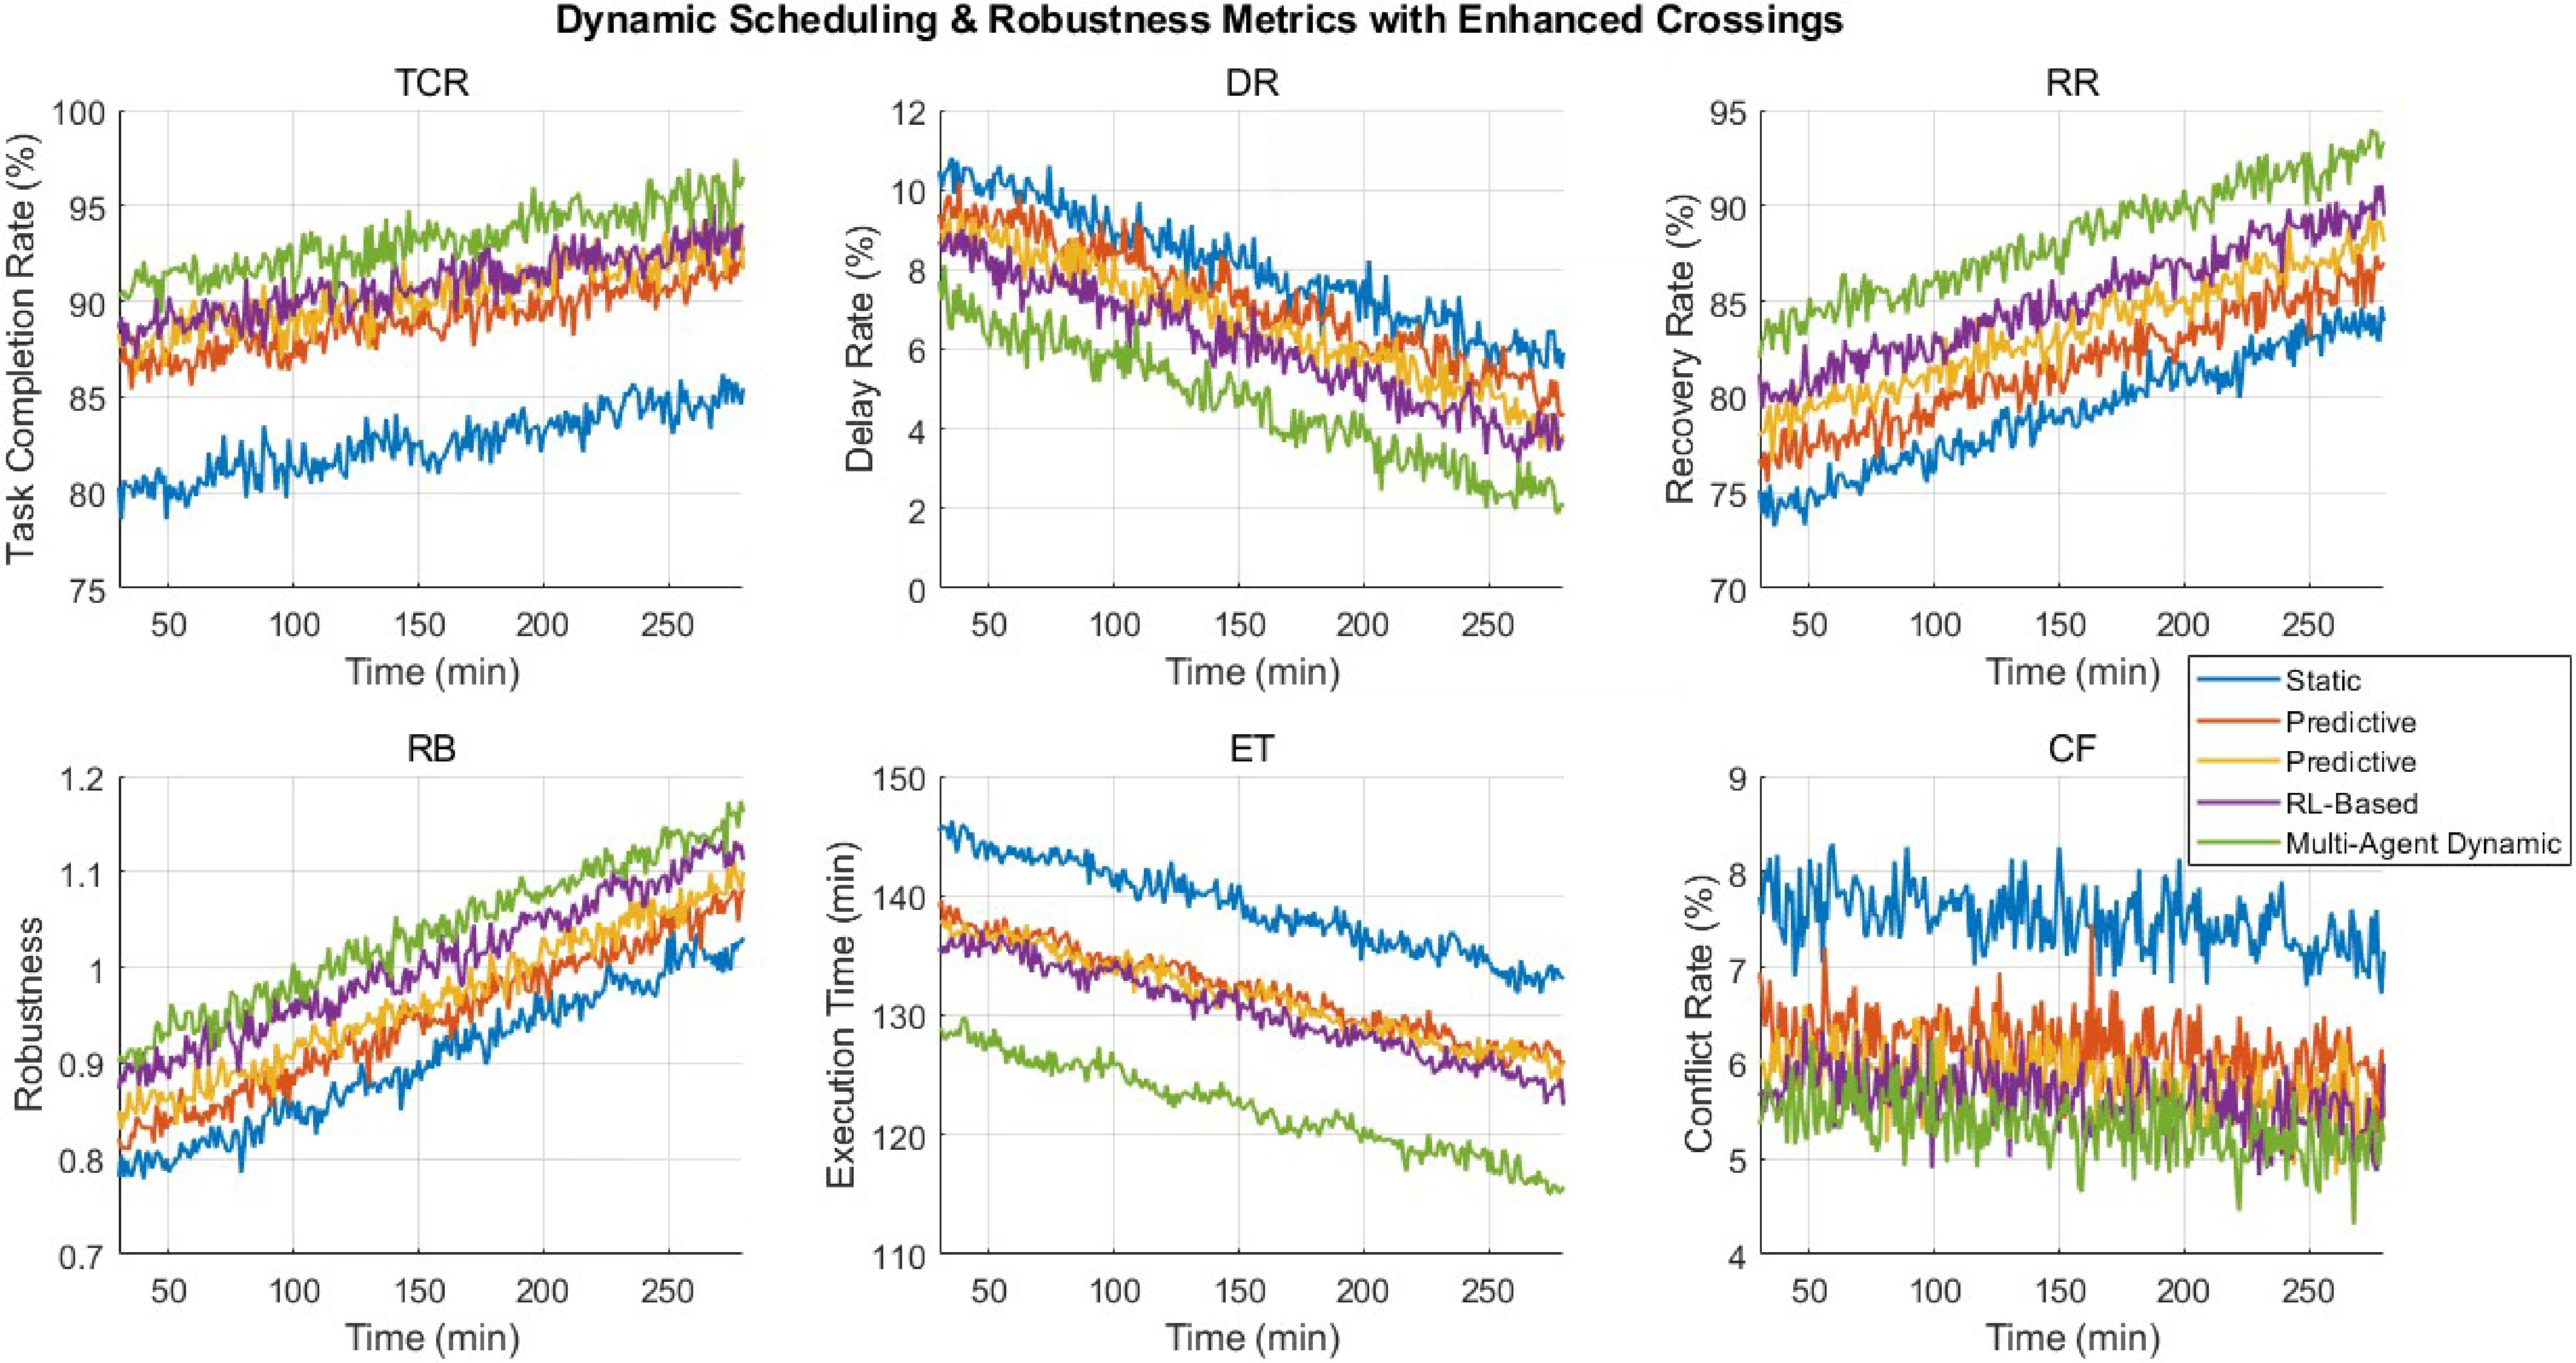
Figure 6.
Dynamic scheduling and robustness metrics with enhanced crossings.
-
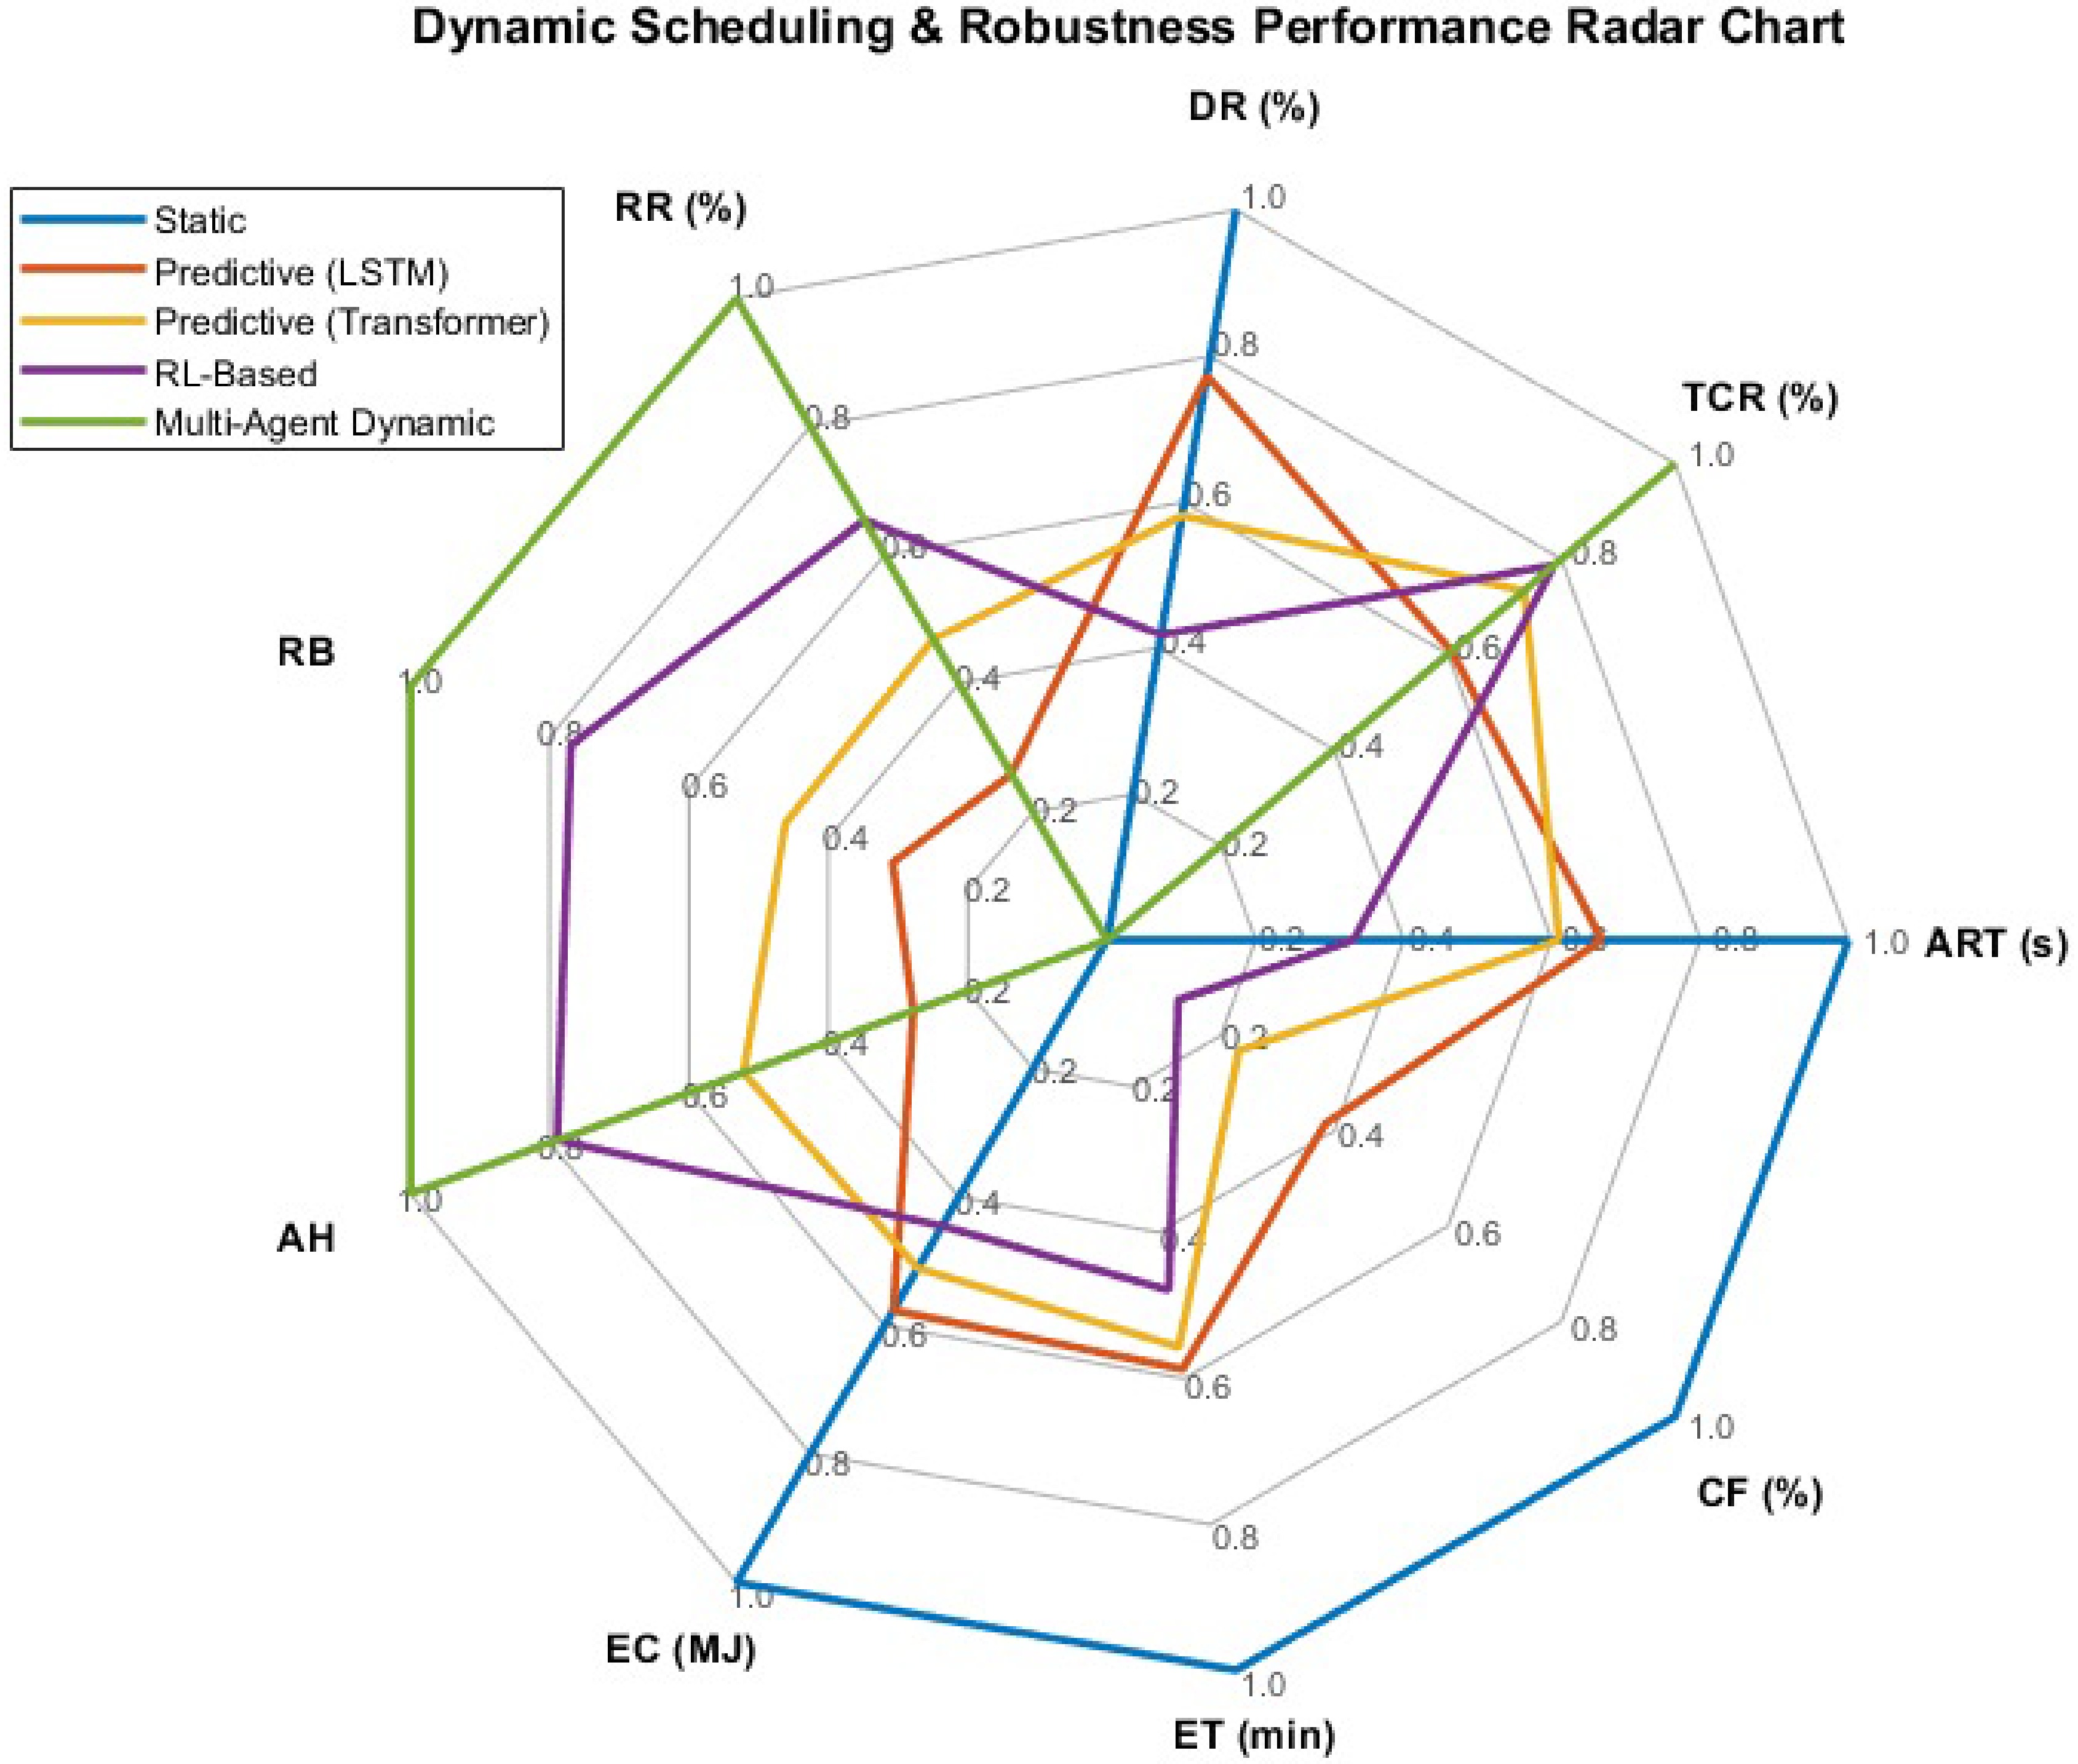
Figure 7.
Dynamic scheduling and robustness performance radar chart.
-
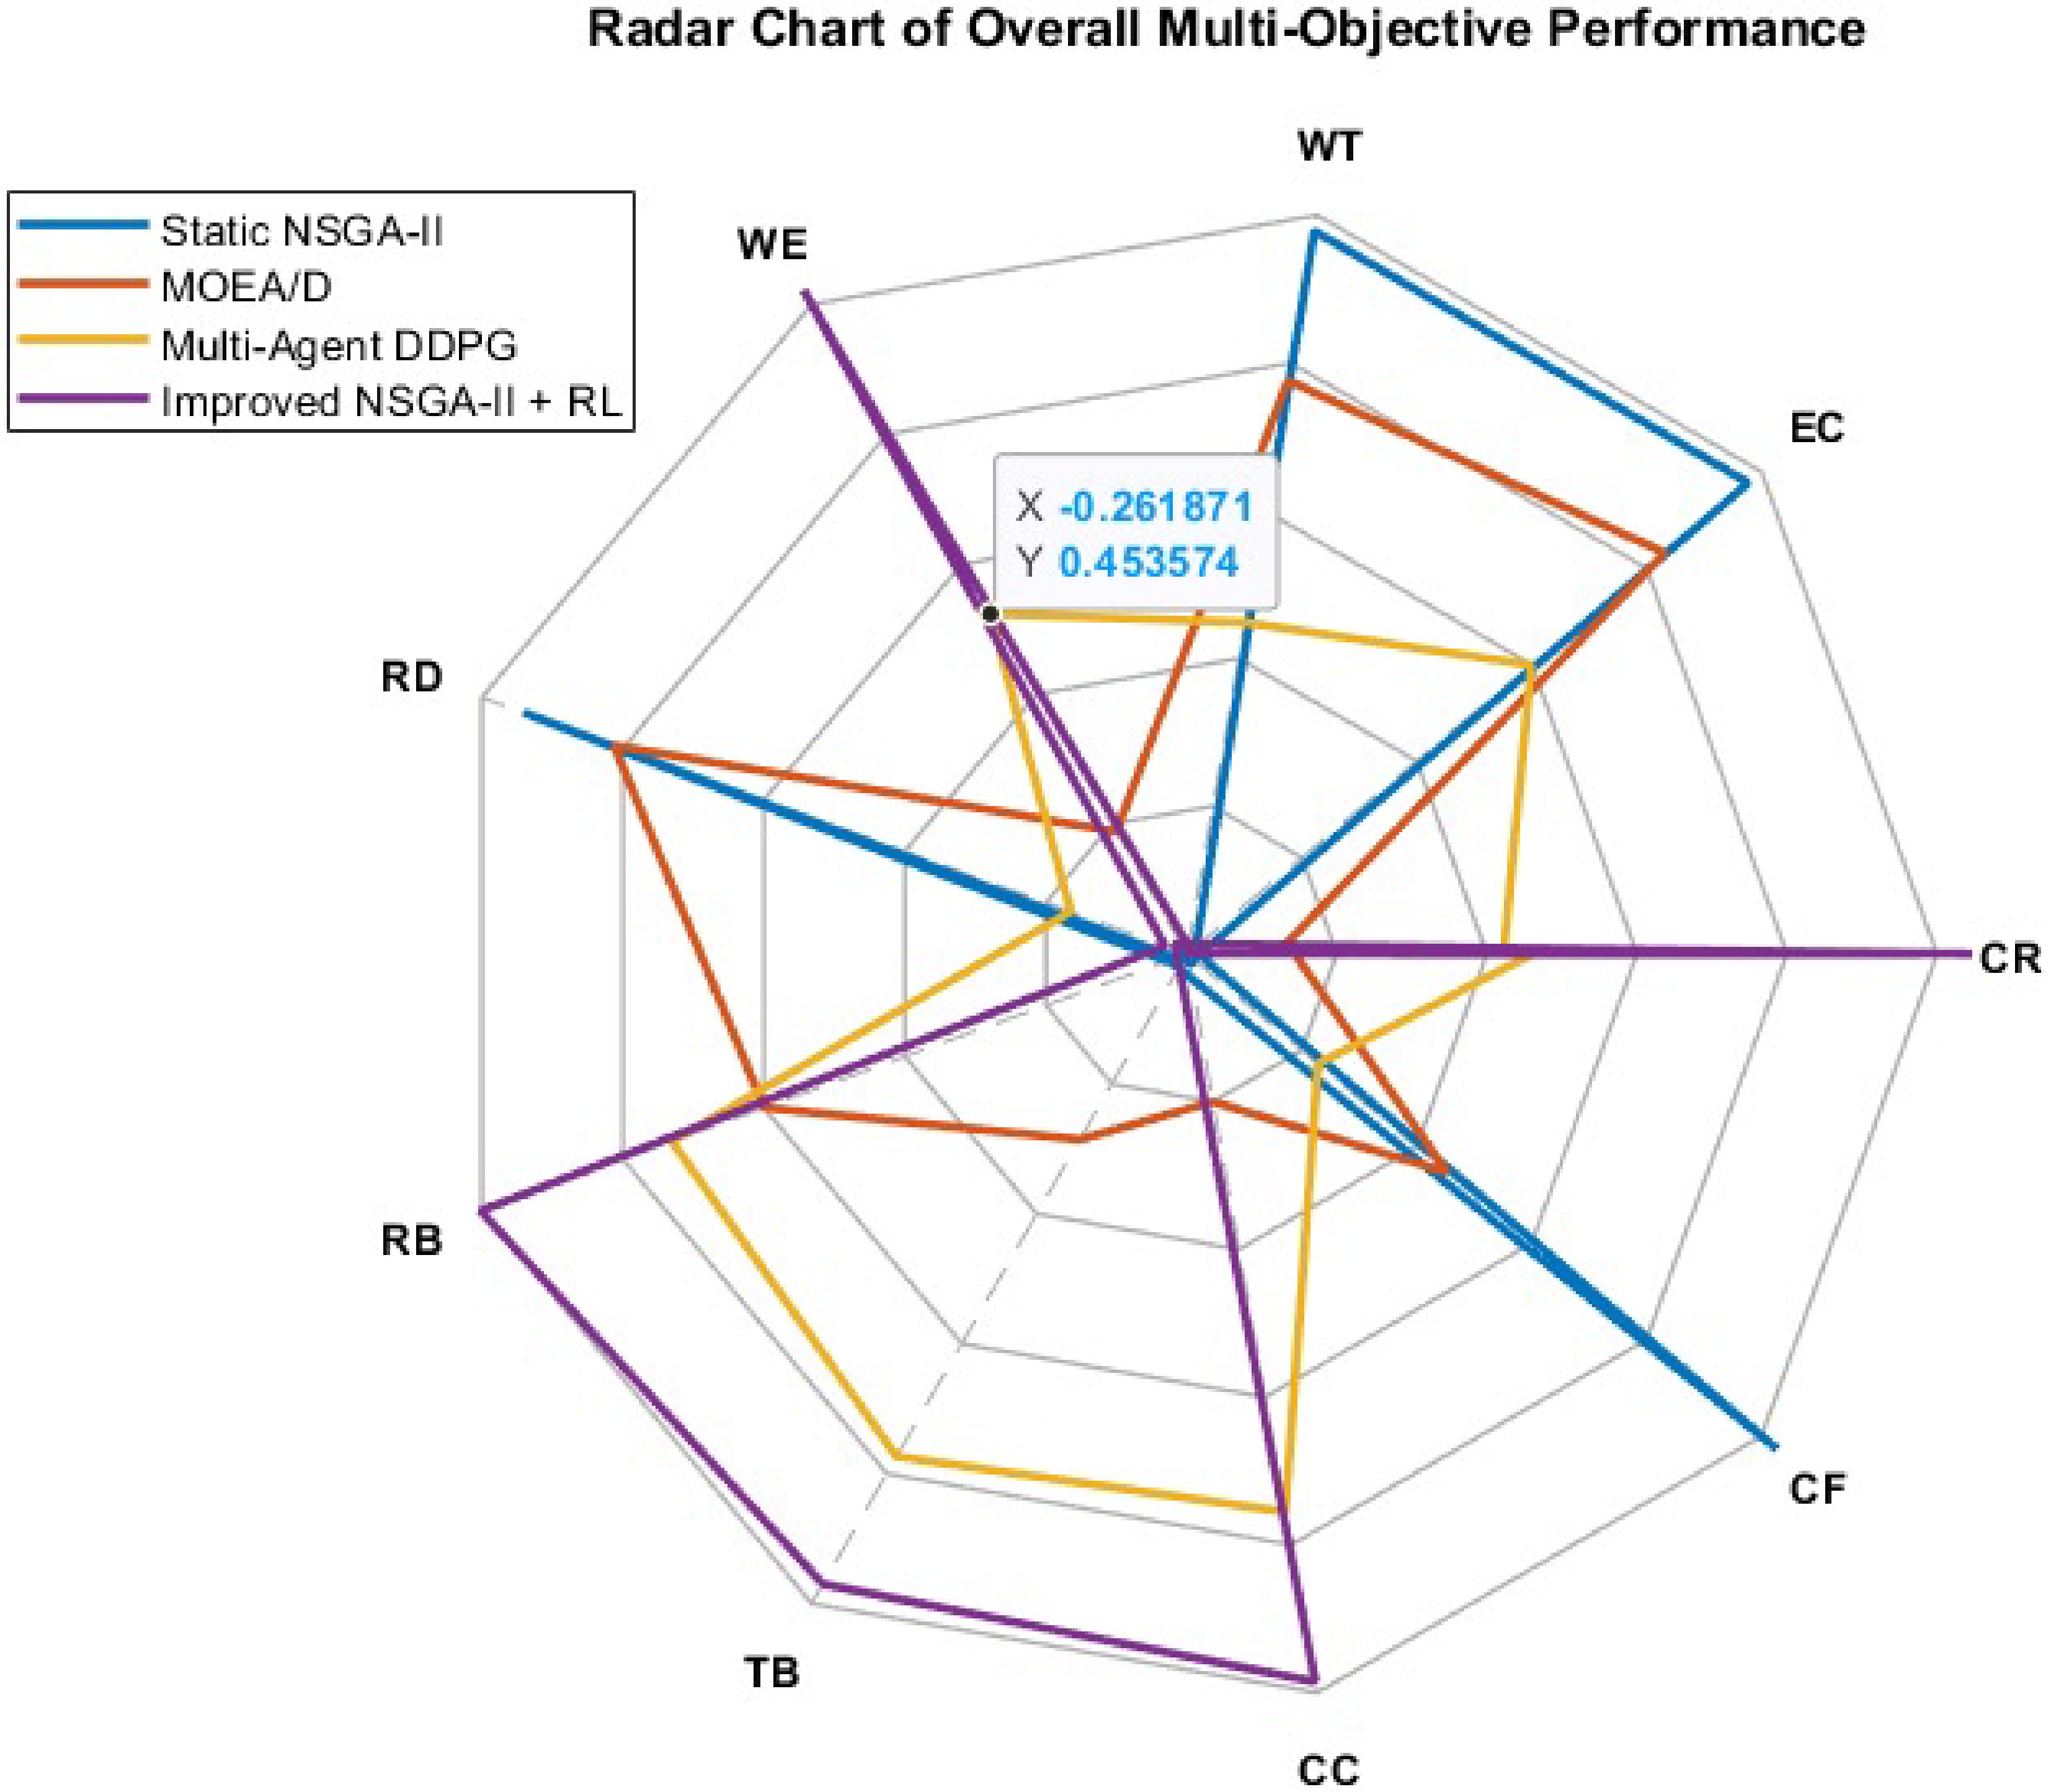
Figure 8.
Radar chart of overall multi-objective performance.
-
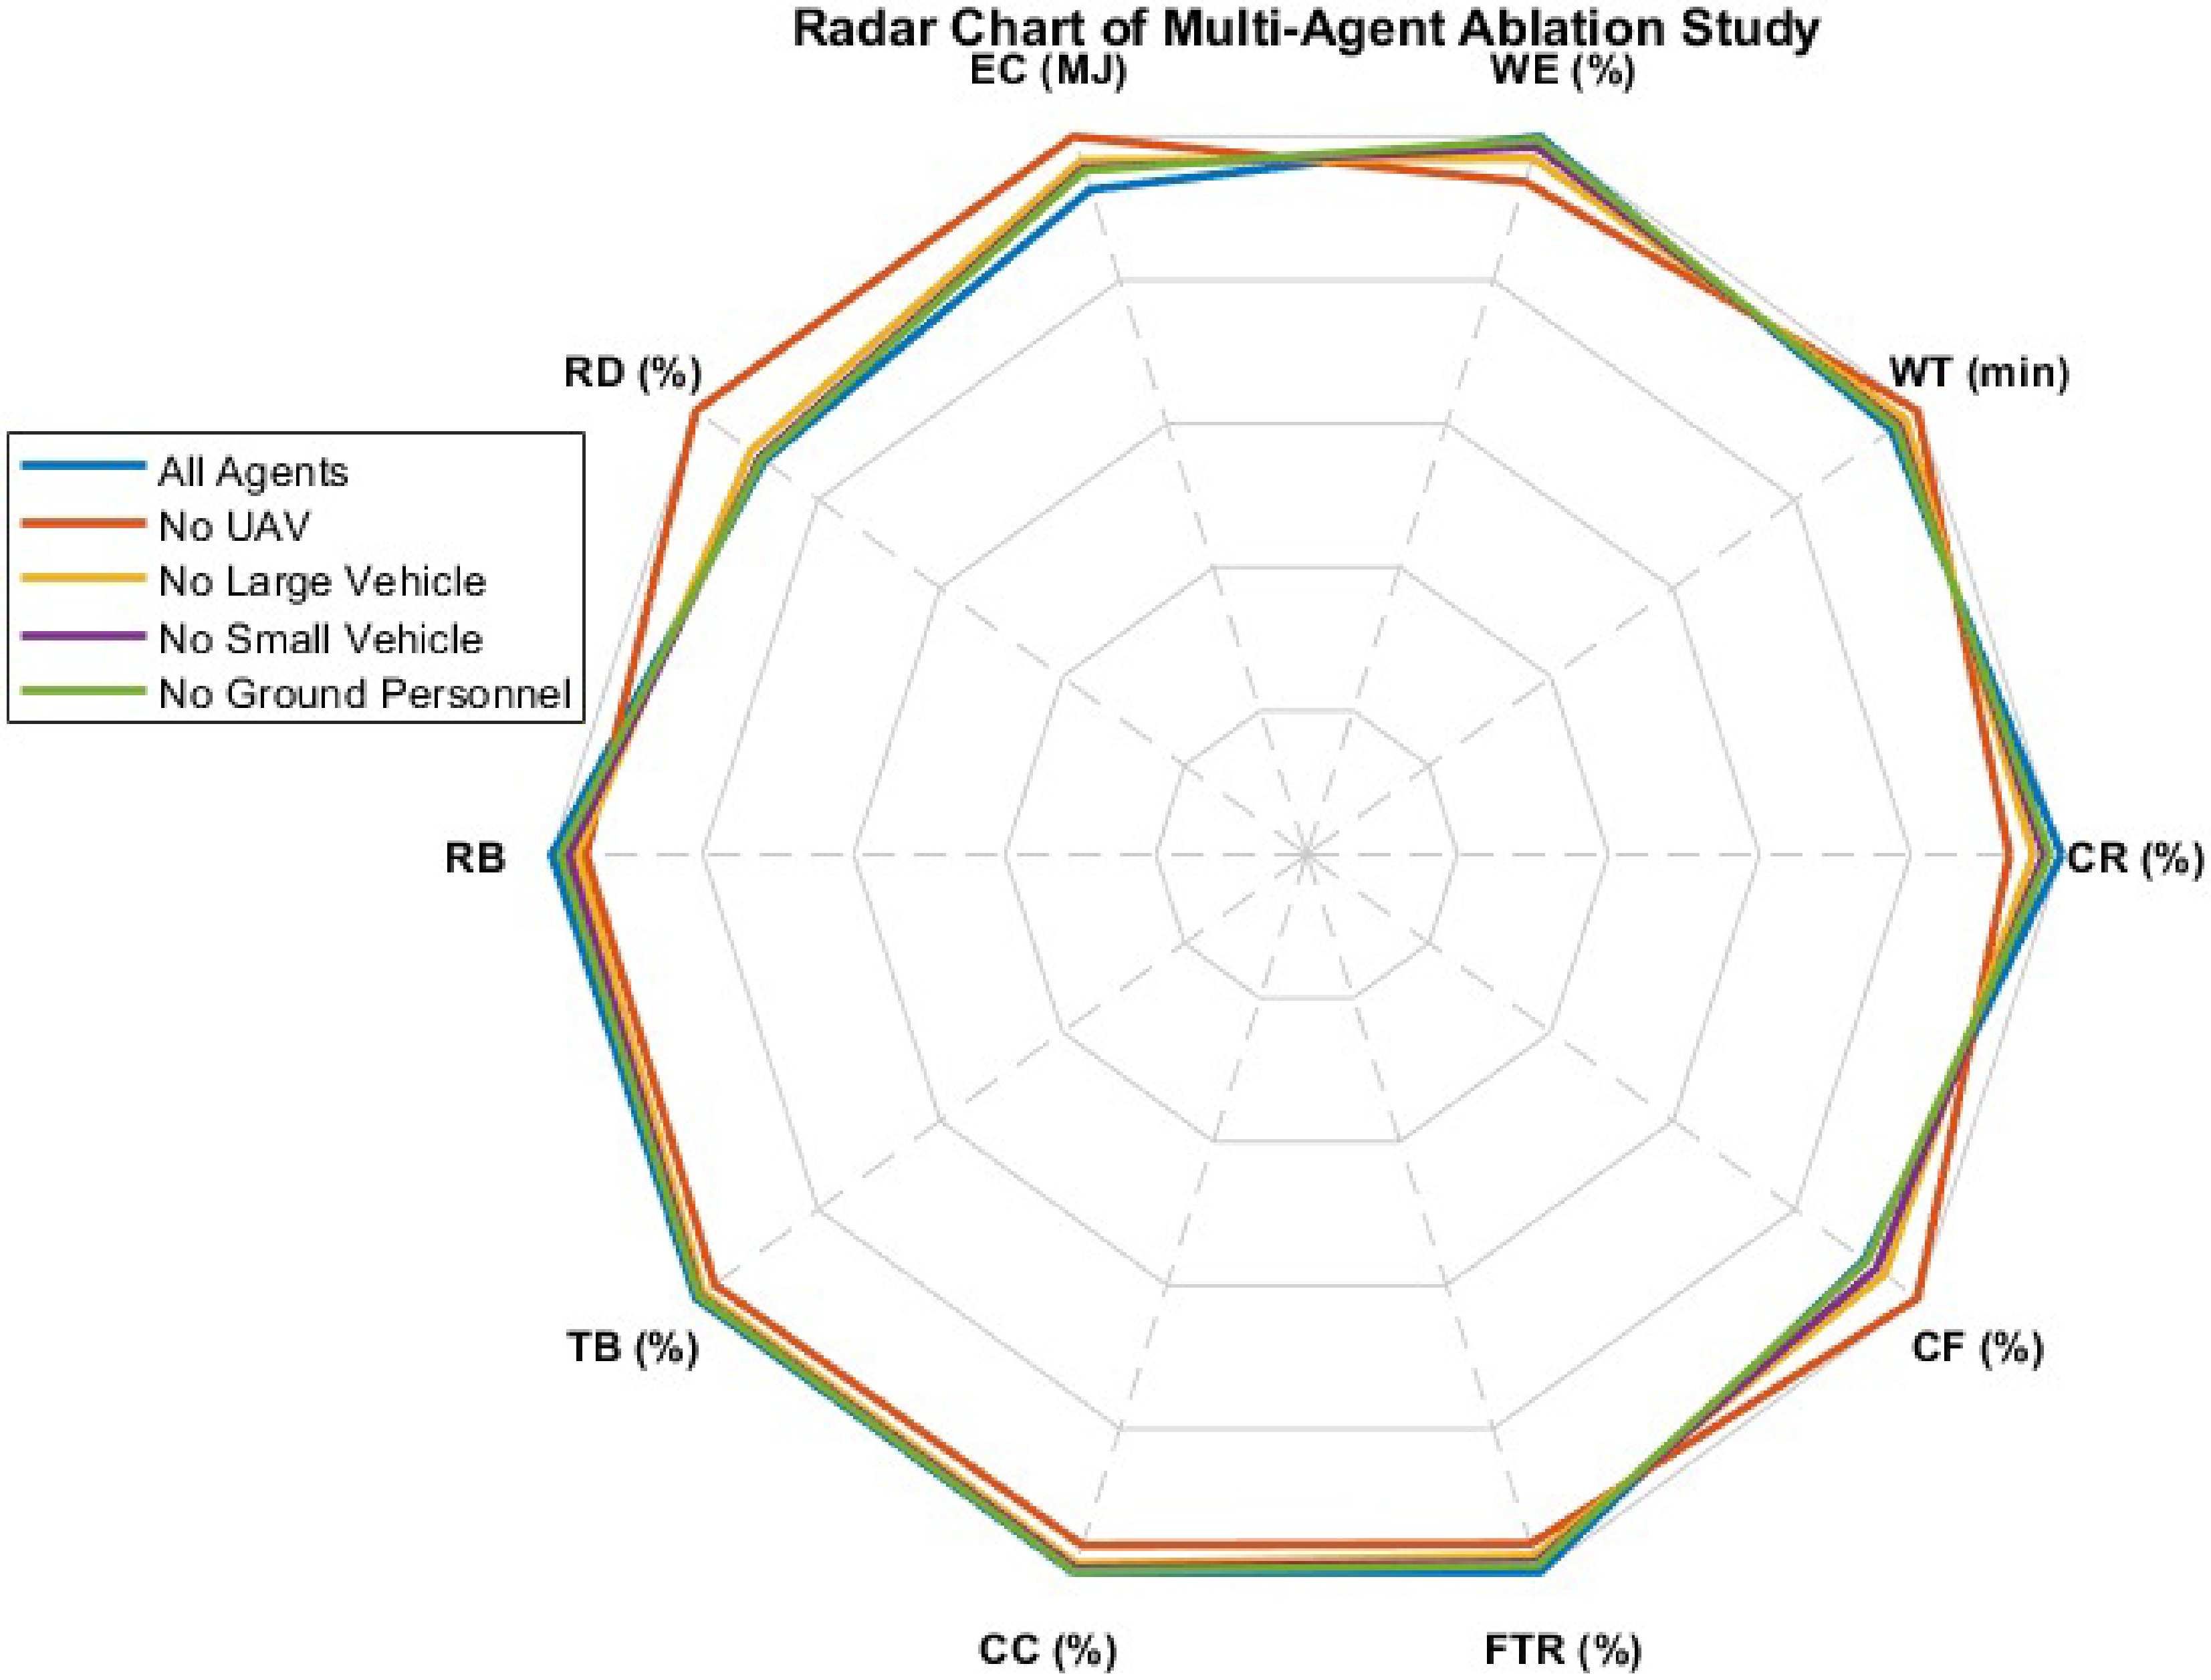
Figure 9.
Radar chart of agent ablation study.
-
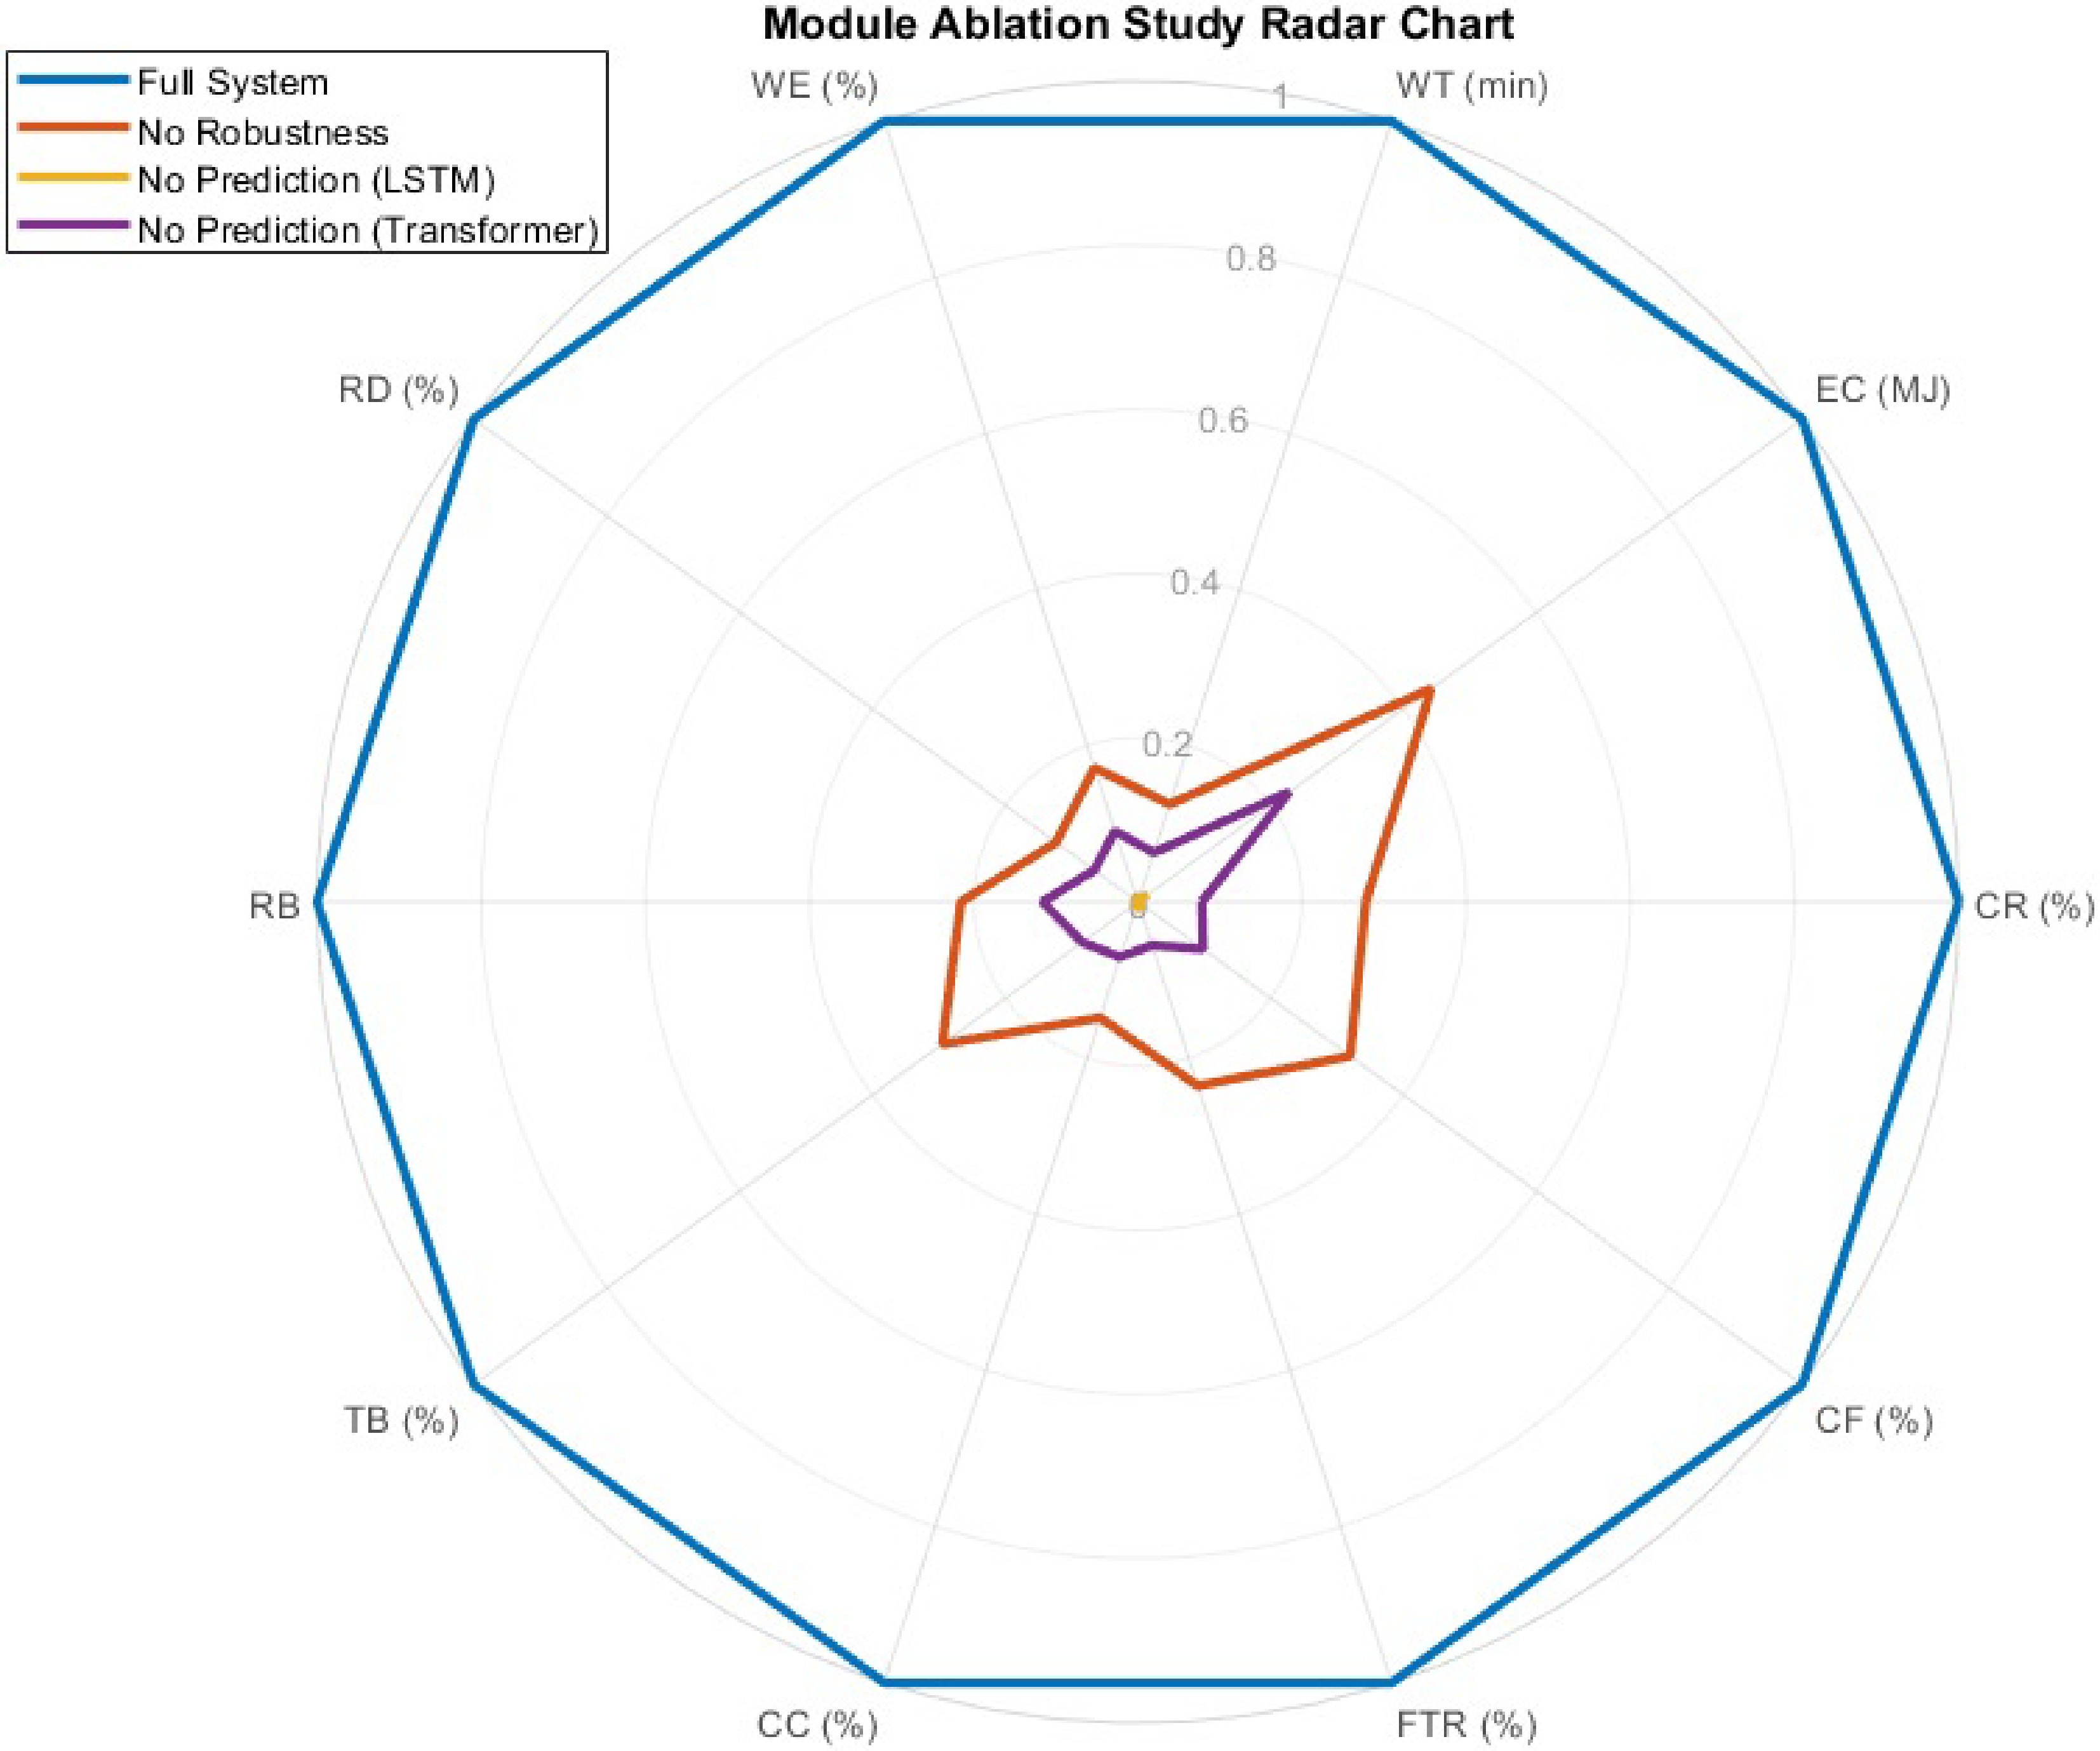
Figure 10.
Module ablation study radar chart.
-
Assignment strategy CR (%) WE (%) EC (MJ) RD (%) RB TB (%) CC (%) FTR (%) CF (%) Single agent UAV 72.45 65.12 120.34 15.22 0.81 67.5 70.12 62.34 8.45 Single agent large spraying vehicle 68.34 62.45 115.78 18.15 0.78 64.81 66.5 59.12 10.22 Single agent small electric sprayers 61.78 60.12 112.45 17.34 0.75 62.50 63.45 57.12 11.33 Single agent ground personnel 55.21 54.23 110.45 20.45 0.72 60.15 60.11 55.34 12.33 Multi-agent collaboration (static) 88.34 80.12 140.56 10.12 0.88 75.23 82.45 74.12 6.78 Multi-agent collaboration (dynamic) 92.56 85.45 138.23 8.45 0.91 78.34 86.12 81.23 5.12 Table 1.
Comparison of multi-objective task allocation performance under multi-agent and dynamic assignment strategies.
-
Assignment strategy/algorithm CR (%) EC (MJ) WE (%) RD (%) RB TB (%) CC (%) FTR (%) CF (%) Path length (m) UAV - A* 74.12 125.34 66.78 14.56 0.82 68.45 71.12 63.34 8.78 1,450 UAV - RRT* 75.34 122.56 68.12 13.89 0.84 69.78 72.45 64.12 8.12 1,423 UAV - GA 72.45 120.78 65.12 15.22 0.81 67.5 70.12 62.34 8.45 1,478 UAV - DRL 78.23 118.34 70.45 12.78 0.85 71.23 73.45 65.12 7.89 1,402 Large spraying vehicle - Dijkstra 69.12 115.78 63.45 17.34 0.78 65.12 66.78 59.45 10.22 1,600 Large spraying vehicle - RL 70.45 113.45 64.78 16.89 0.8 66.45 67.23 60.12 9.78 1,575 Small electric sprayers - GA 61.78 112.45 60.12 17.34 0.75 62.5 63.45 57.12 11.33 1,520 Ground personnel - Graph Theory 55.21 110.45 54.23 20.45 0.72 60.15 60.1 55.34 12.33 1,680 Multi-agent static 88.34 140.56 80.12 10.12 0.88 75.23 82.45 74.12 6.78 1,300 Multi-agent dynamic 92.56 138.23 85.45 8.45 0.91 78.34 86.12 81.23 5.12 1,285 Table 2.
Comparison of path planning and collaborative operation performance under different algorithms and multi-agent strategies.
-
Strategy ART (s) TCR (%) DR (%) RR (%) RB AH EC (MJ) ET (min) CF (%) Static 10.45 80.12 10.56 74.23 0.78 68.34 138.45 145.2 7.78 Predictive (LSTM) 9.12 86.45 9.78 76.56 0.82 71.12 134.12 138.3 6.45 Predictive (transformer) 8.89 87.78 9.12 78.45 0.84 73.56 133.45 137.8 6.12 RL-based 7.78 88.34 8.56 80.12 0.88 76.23 132.78 136.5 5.89 Multi-agent dynamic 6.45 90.56 7.12 83.23 0.91 78.34 128.23 128.5 5.62 Table 3.
Dynamic scheduling and robustness performance under different strategies.
-
Method CR (%) EC (MJ) WT (min) WE (%) RD (%) RB TB (%) CC (%) FTR (%) CF (%) Static NSGA-II 84.23 142.45 145.28 72.56 15.12 0.78 68.12 70.45 74.23 8.78 MOEA/D 85.12 140.78 142.34 73.45 14.78 0.84 69.34 71.12 76.12 8.12 Multi-agent DDPG 87.45 138.34 138.55 75.23 13.45 0.85 71.45 73.12 77.45 7.89 Improved NSGA-II + RL 91.56 132.23 132.51 77.45 13.12 0.88 72.34 74.02 78.23 7.62 Table 4.
Overall performance comparison of multi-agent task scheduling methods.
-
Ablation scenario CR (%) WT (min) WE (%) EC (MJ) RD (%) TB (%) CC (%) FTR (%) CF (%) No UAV 72.45 158.23 65.12 135.45 18.34 63.12 60.45 68.12 11.23 No large spraying vehicle 81.12 148.56 70.45 138.23 16.78 66.34 64.12 71.45 9.78 No small electric sprayers 83.45 145.78 72.34 136.78 15.45 68.23 66.12 73.12 8.89 No ground personnel 85.23 143.56 73.78 135.12 14.78 69.12 68.45 74.23 8.12 All agents present 91.56 132.51 77.45 132.23 13.12 72.34 74.02 78.23 7.62 Table 5.
Key performance metrics under different agent ablation conditions.
-
Module / scenario CR (%) EC (MJ) WT (min) WE (%) RD (%) RB TB (%) CC (%) FTR (%) CF (%) Full system 91.56 132.23 132.51 77.45 13.12 0.88 72.34 74.02 78.23 7.62 No robustness module 88.34 134.12 137.45 74.12 14.78 0.81 69.45 70.12 73.45 9.12 No prediction module (LSTM) 87.12 135.56 138.23 73.45 15.01 0.79 68.23 69.45 72.12 9.78 No prediction module (transformer) 87.45 134.78 137.89 73.78 14.89 0.80 68.56 69.78 72.45 9.56 Table 6.
Module ablation experiment results under different functional configurations.
Figures
(10)
Tables
(6)