-
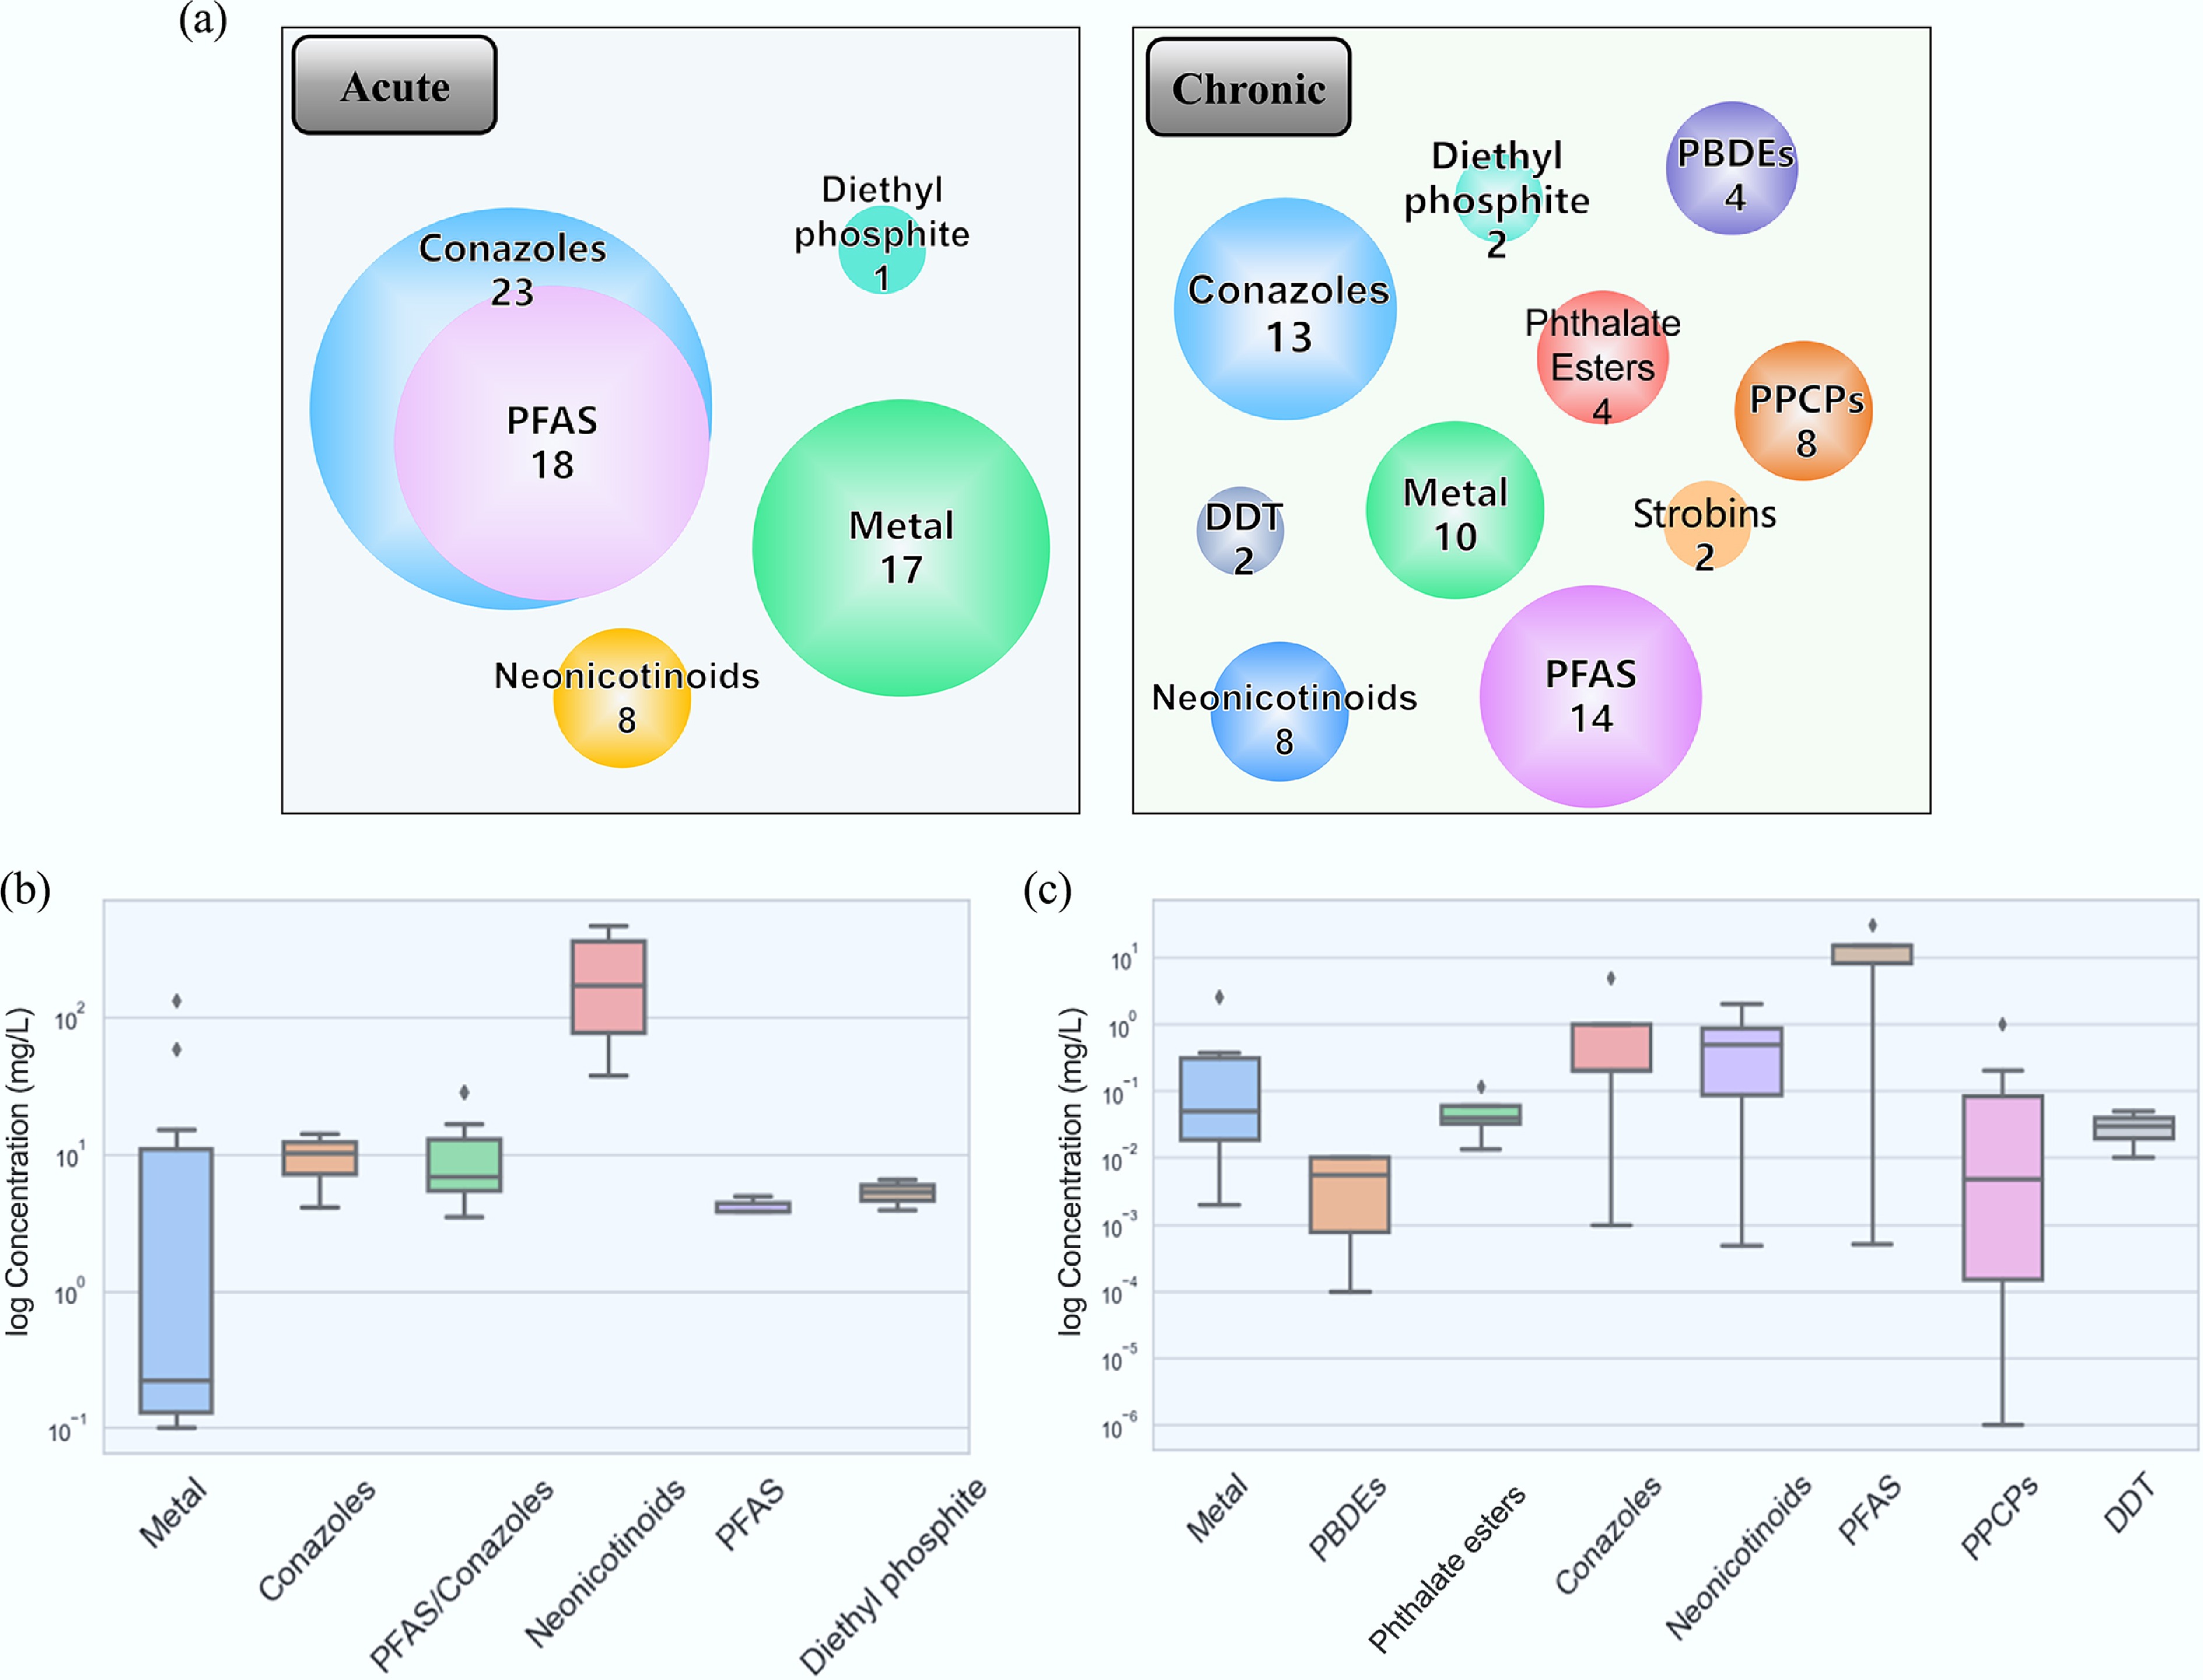
Figure 1.
Overview of the modeling data set. (a) Pollutant classifications in acute and chronic toxicity data sets. (b) Boxplot of acute toxicity for different pollutants. (c) Boxplot of chronic toxicity for different pollutants.
-

Figure 2.
Acute ML-QSAR model performance of different algorithms: (a) RF, (b) GLM, (c) SVM, (d) KNN, (e) Neural Network,and (f) GLMNET. The data points for the training set are plotted as blue dots. The data points for the test set are plotted as red dots. Train R2 represents R2, and test R2 represents Rex2. R2 and Rex2 values are rounded to two decimal places.
-
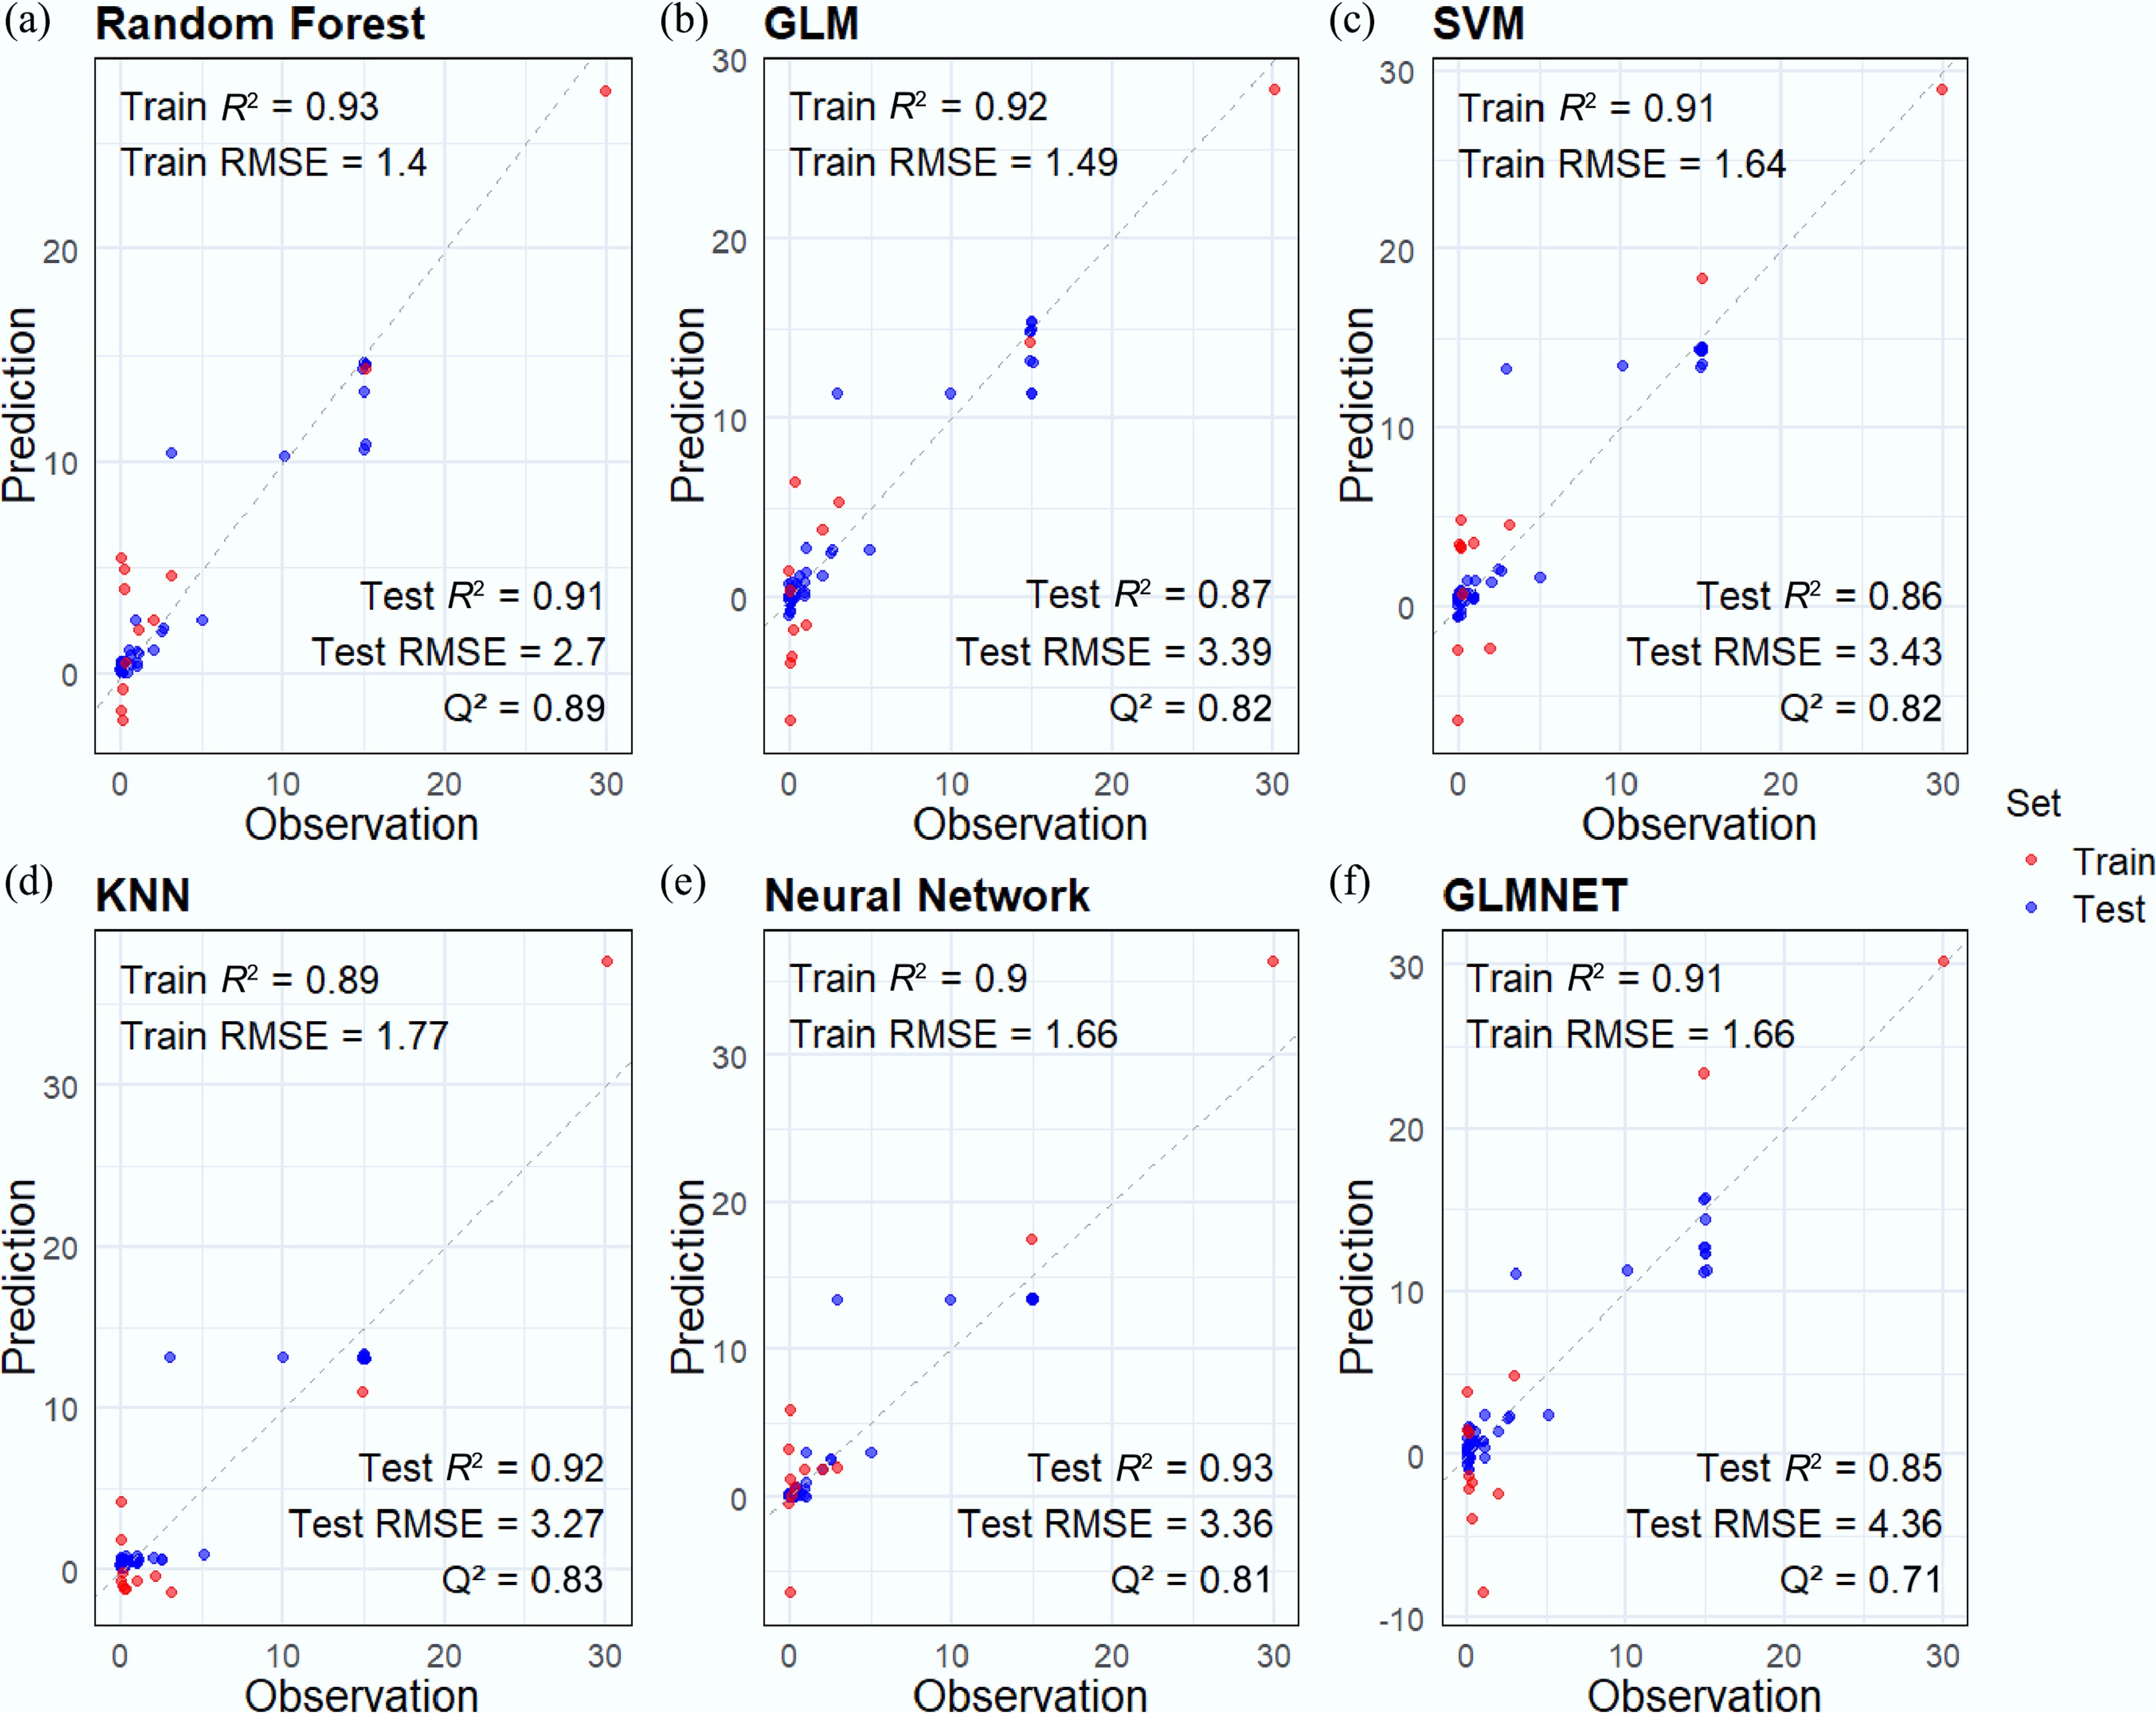
Figure 3.
Chronic ML-QSAR model performance of different algorithms: (a) RF, (b) GLM, (c) SVM, (d) KNN, (e) Neural Network, and (f) GLMNET. The data points for the training set are plotted as blue dots. The data points for the test set are plotted as red dots. Train R2 represents R2, and test R2 represents Rex2. R2 and Rex2 values are rounded to two decimal places.
-
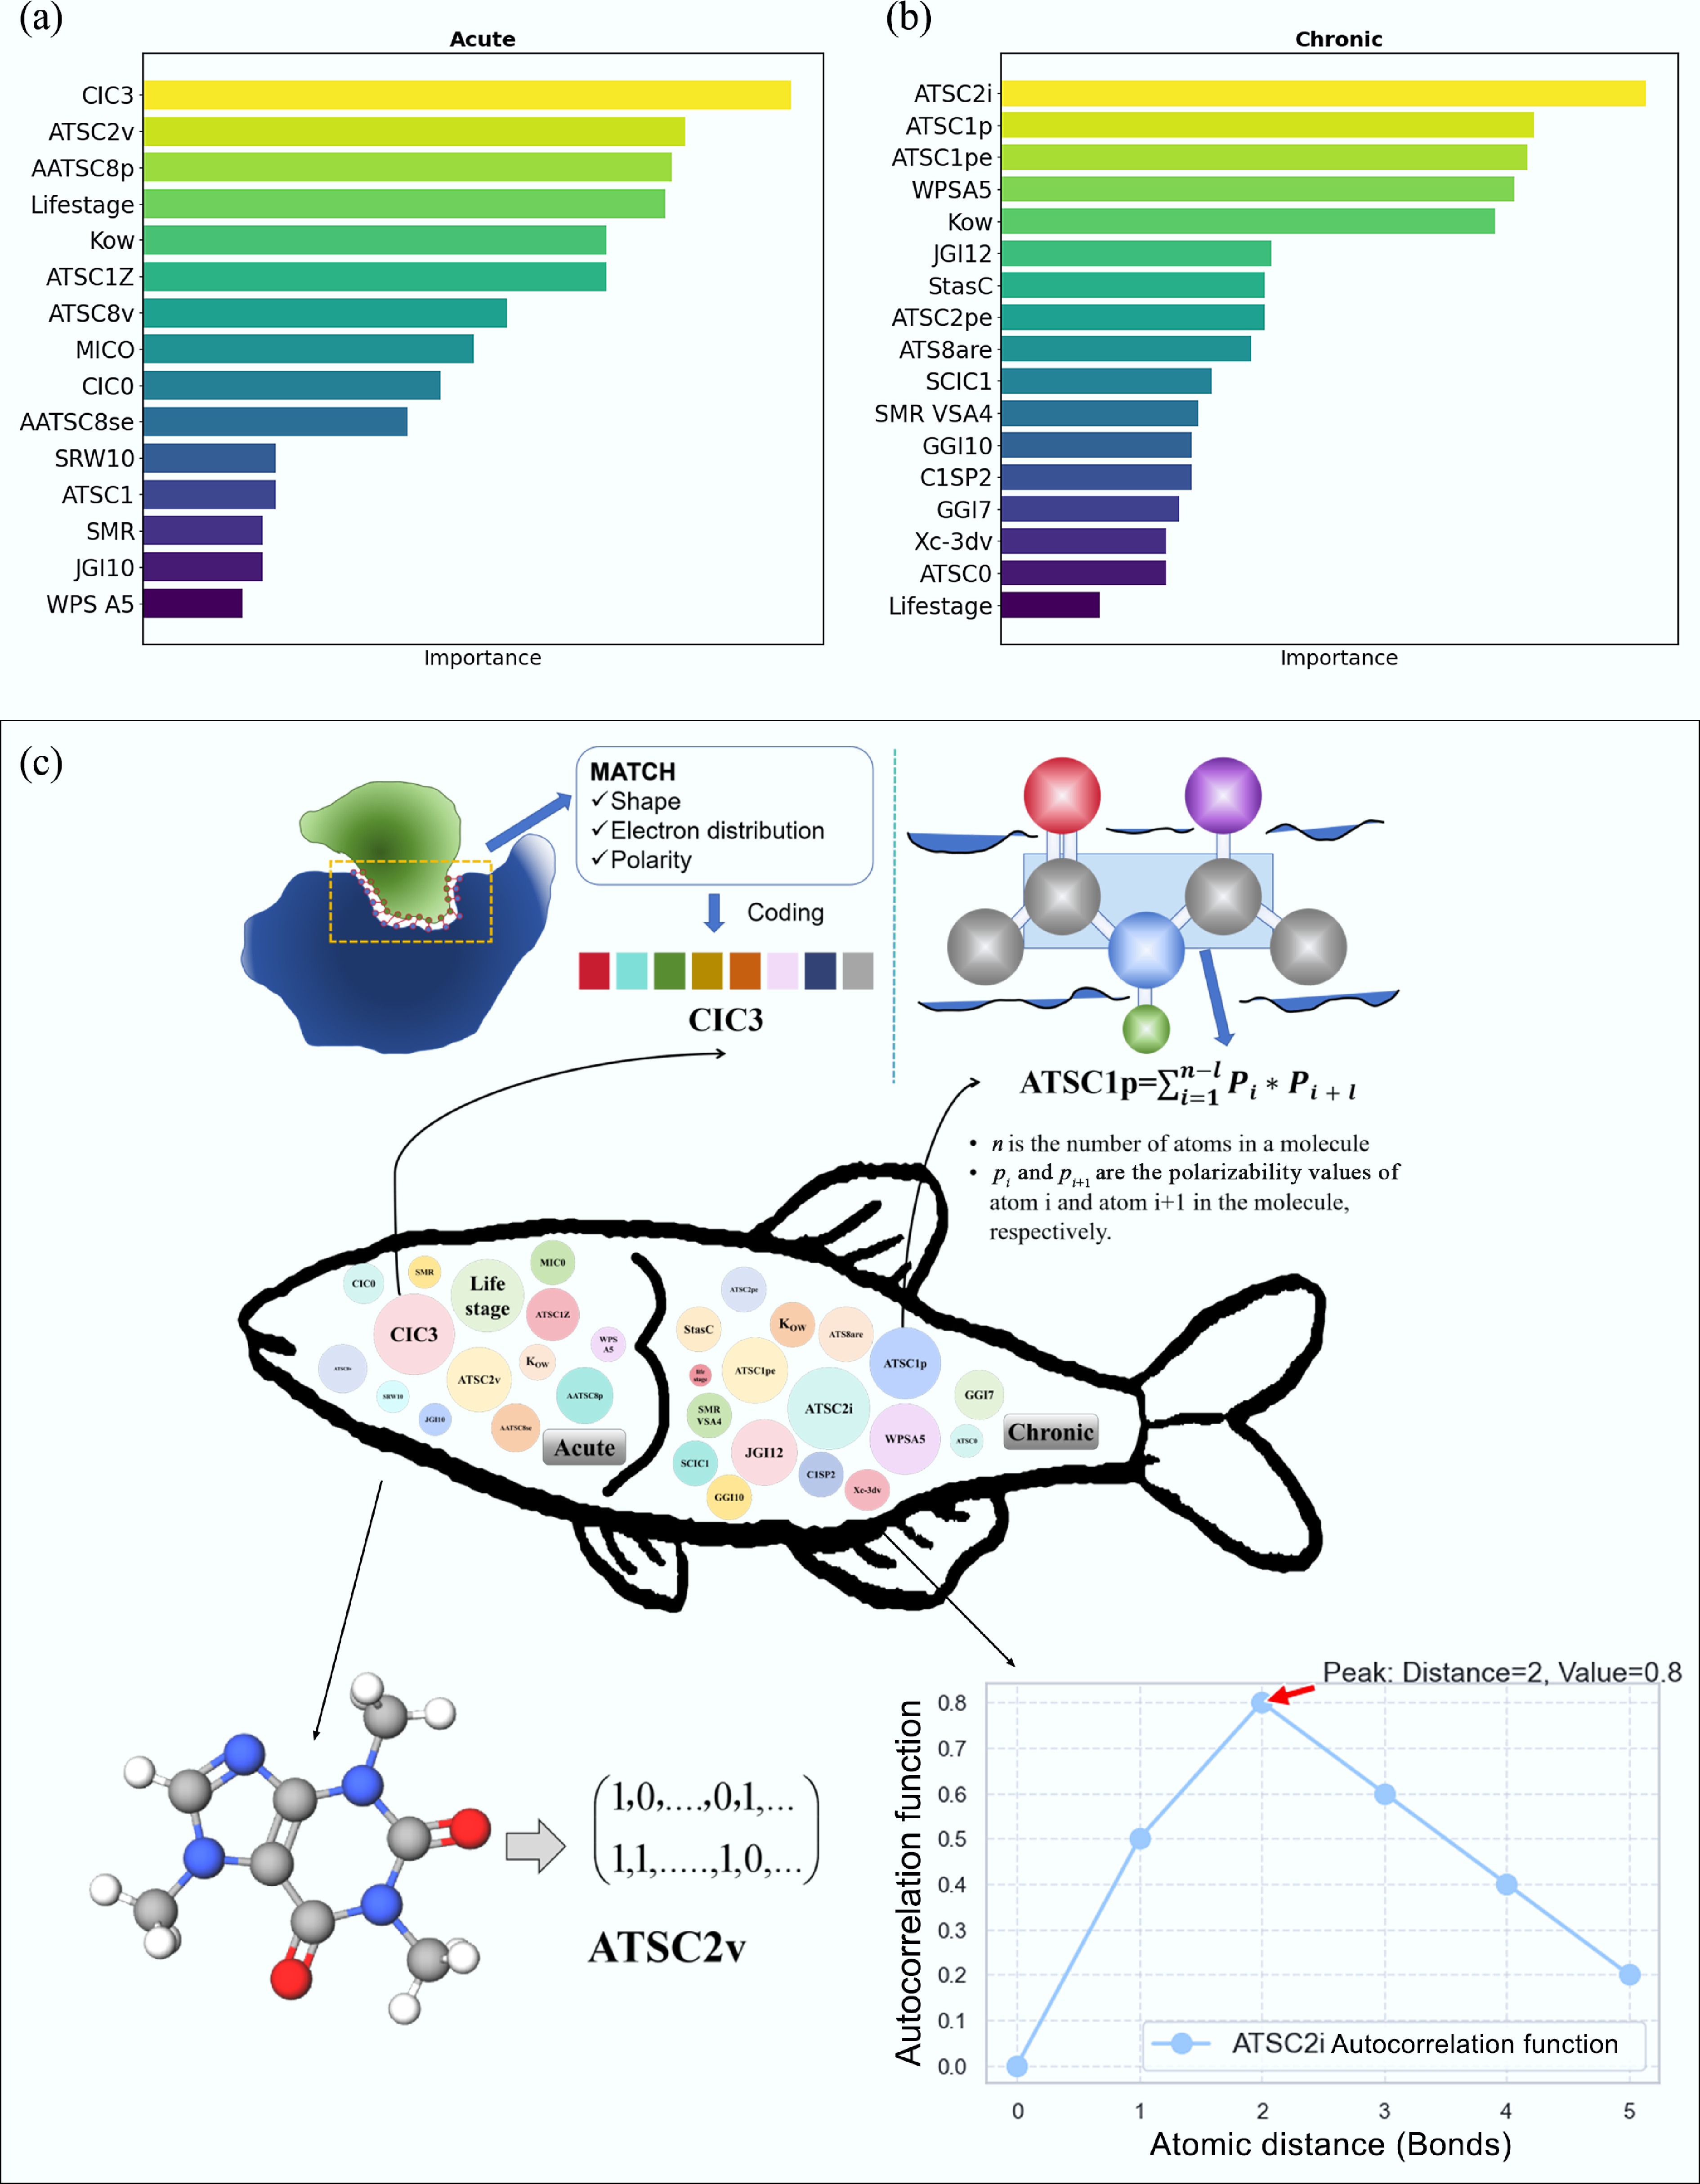
Figure 4.
Feature importance analysis of the model. Importance rank of different descriptors for ML-QSAR models: (a) acute, (b) chronic, and (c) descriptor explanations for CIC3, ATSC1P, ATSC2v, and ATSC2i.
-
Chemical Acute risk (RQ) Chronic risk (RQ) Life stage_1 Life stage_2 Life stage_3 Average Life stage_1 Life stage_2 Life stage_3 Average PFBA 2.64E-07 2.65E-07 2.41E-07 2.57E-07 1.98E-06 1.98E-06 1.98E-06 1.98E-06 PFPeA 2.23E-09 2.23E-09 1.99E-09 2.15E-09 1.59E-08 1.59E-08 1.59E-08 1.59E-08 PFHxA 4.26E-09 4.28E-09 3.55E-09 4.00E-09 3.17E-08 3.17E-08 3.17E-08 3.17E-08 PFHpA 6.60E-09 6.63E-09 5.35E-09 6.13E-09 3.74E-08 3.73E-08 3.73E-08 3.74E-08 PFOA 9.40E-05 9.43E-05 6.03E-05 7.93E-05 3.93E-04 3.93E-04 3.93E-04 3.93E-04 PFNA 1.24E-09 1.25E-09 8.04E-10 1.05E-09 3.84E-09 3.84E-09 3.84E-09 3.84E-09 PFDA 9.94E-10 9.97E-10 6.43E-10 8.42E-10 3.06E-09 3.06E-09 3.06E-09 3.06E-09 PFDoDA 3.23E-09 3.23E-09 2.09E-09 2.73E-09 9.95E-09 9.95E-09 9.95E-09 9.95E-09 PFBS 9.93E-10 9.95E-10 6.43E-10 8.41E-10 3.07E-09 3.07E-09 3.07E-09 3.07E-09 PFHxS 2.23E-10 2.19E-10 1.60E-10 1.96E-10 7.19E-09 7.19E-09 7.19E-09 7.19E-09 PFOS 6.23E-08 6.25E-08 4.02E-08 5.27E-08 2.58E-07 2.58E-07 2.58E-07 2.58E-07 PFDS 6.78E-10 6.78E-10 4.99E-10 6.06E-10 1.91E-08 1.90E-08 1.90E-08 1.90E-08 Table 1.
Acute and chronic ecological risk entropy associated with 12 pollutants impacting G. rarus in different life stages in its habitat
Figures
(4)
Tables
(1)