-
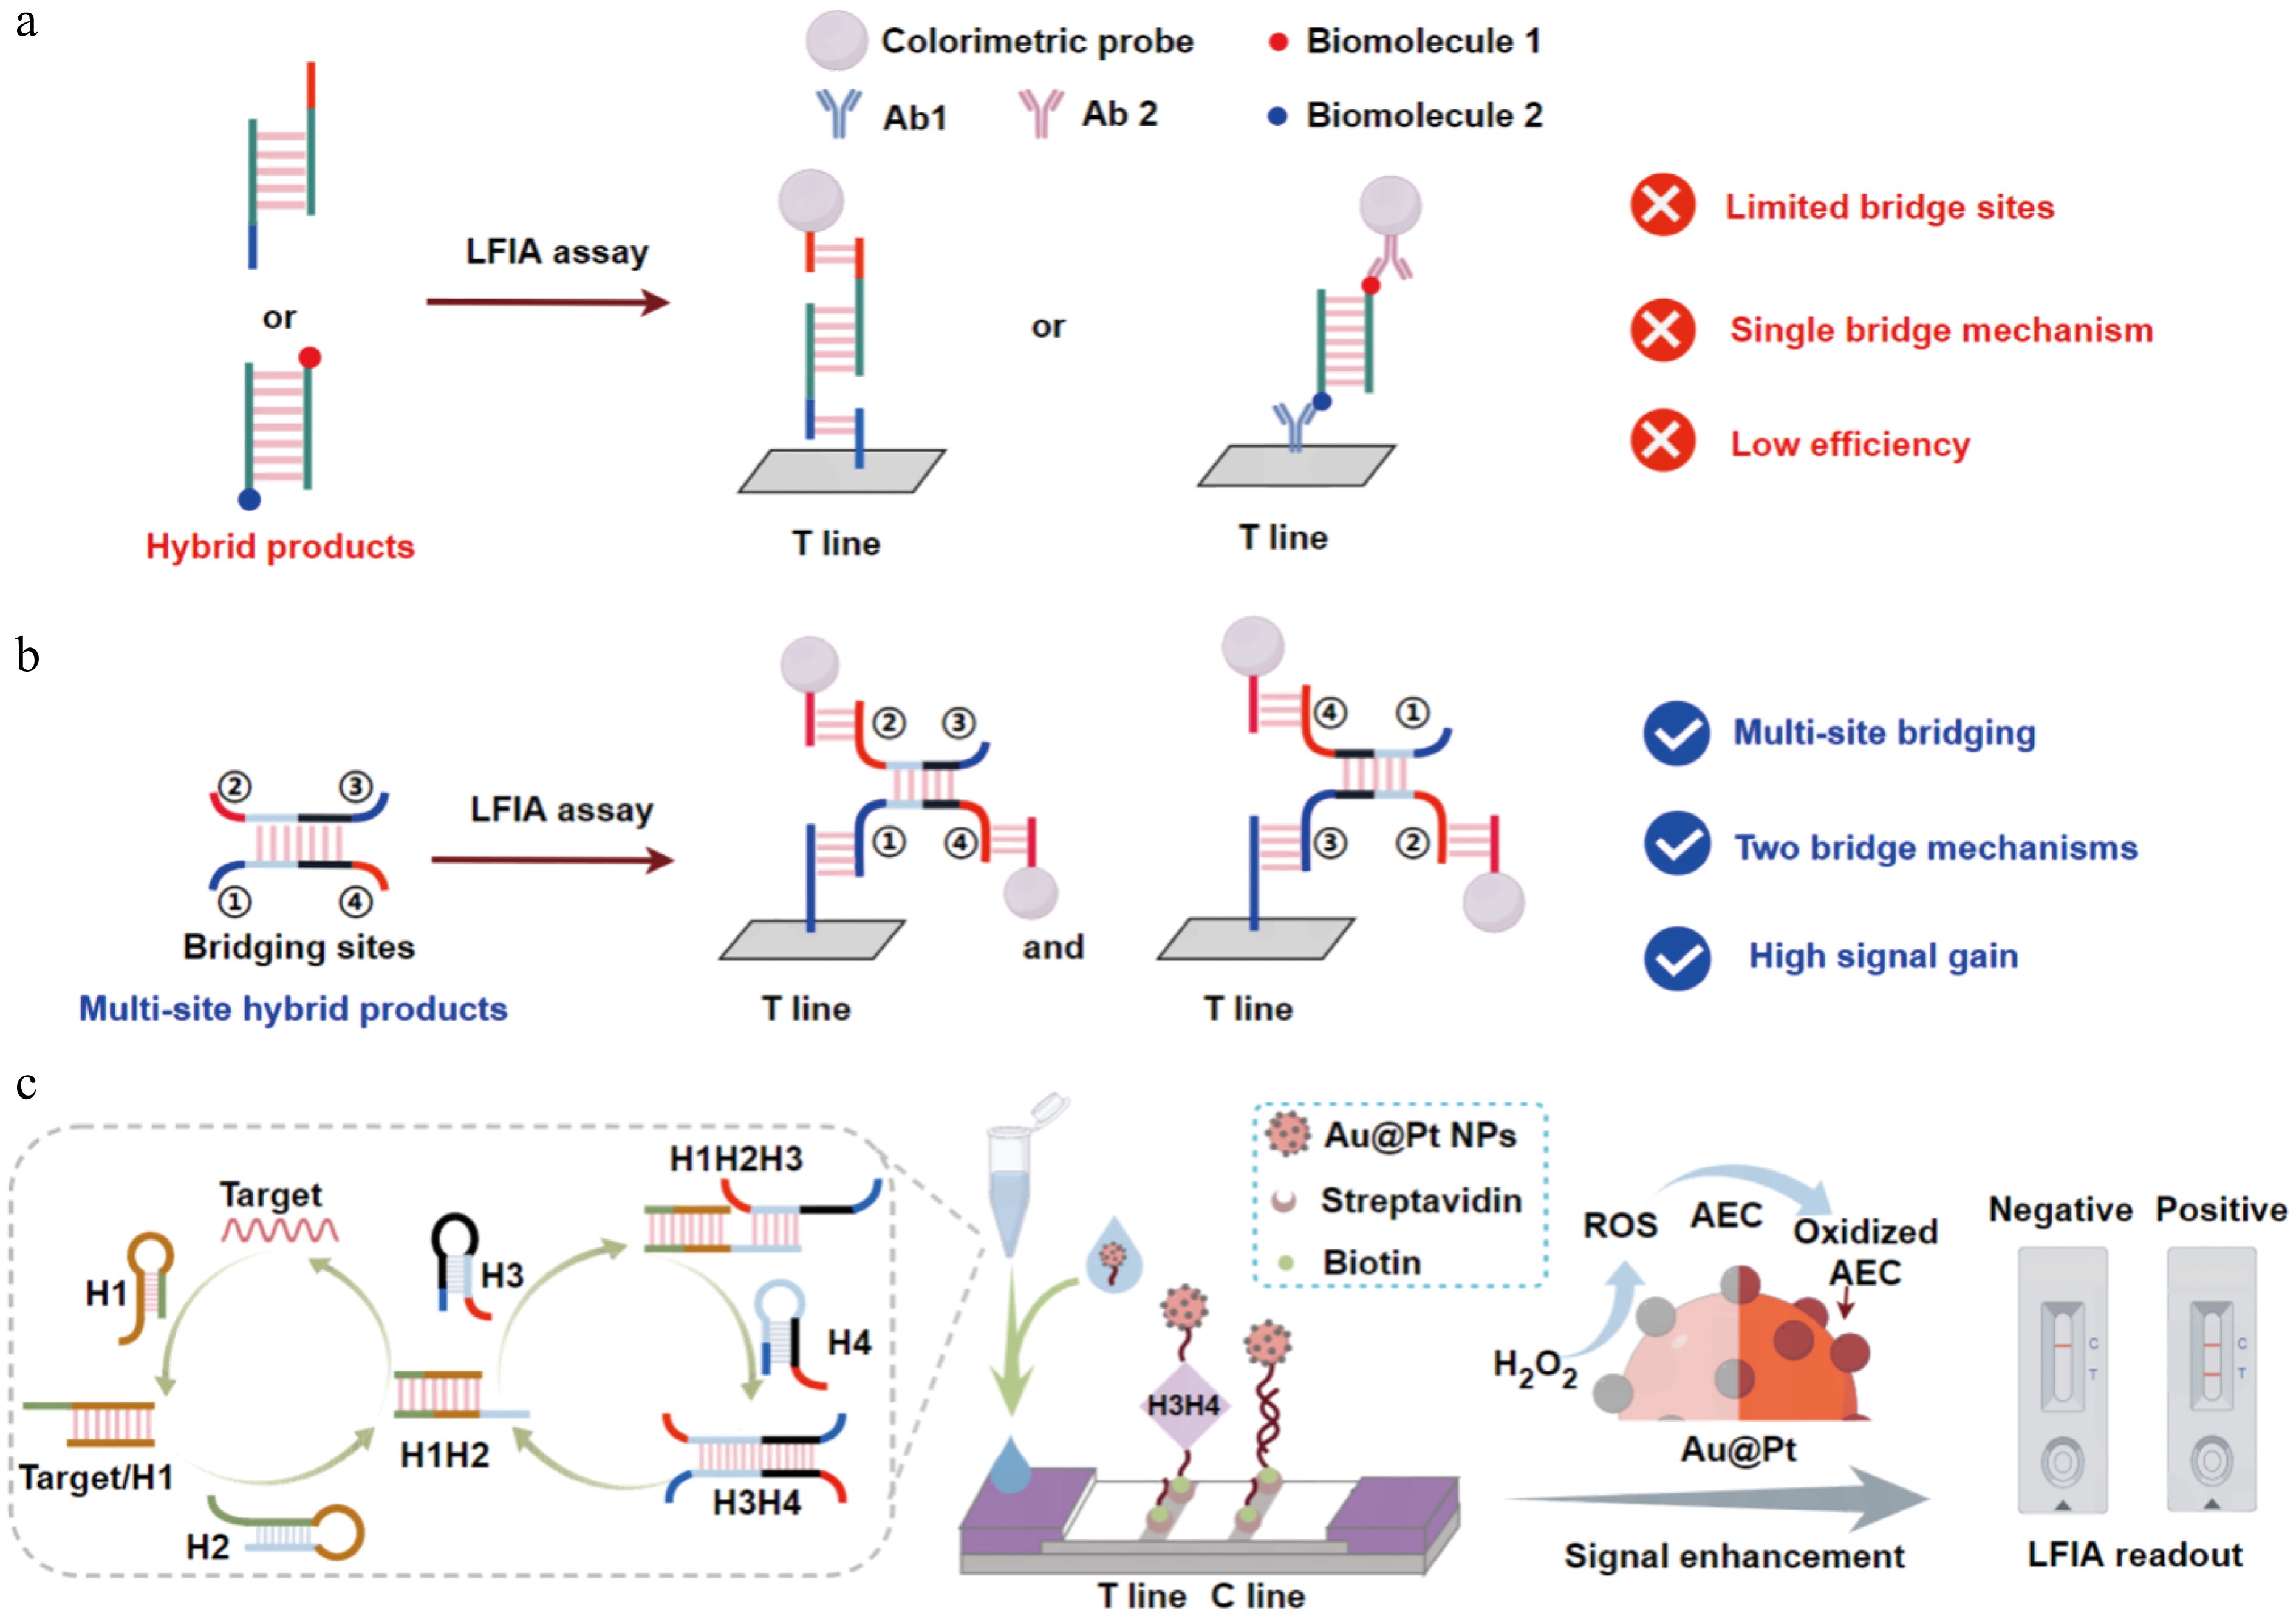
Figure 1.
Detection system of mbLFIA. (a) Hybridization products of the previous bioenzyme-free nucleic acid amplification used in the LFIA-integrated system. (b) Multisite bridging structure used in the LFIA-integrated system. When sites ② and ④ of the structure bind the colorimetric probe, it can bridge the capture probe via site ① or site ③. (c) The mbLFIA was used for the detection of mosquito-borne viruses. After two cycles of CHA amplification, signal enhancement was further accomplished via Au@Pt NPs catalyzing the oxidation and deposition of AEC.
-
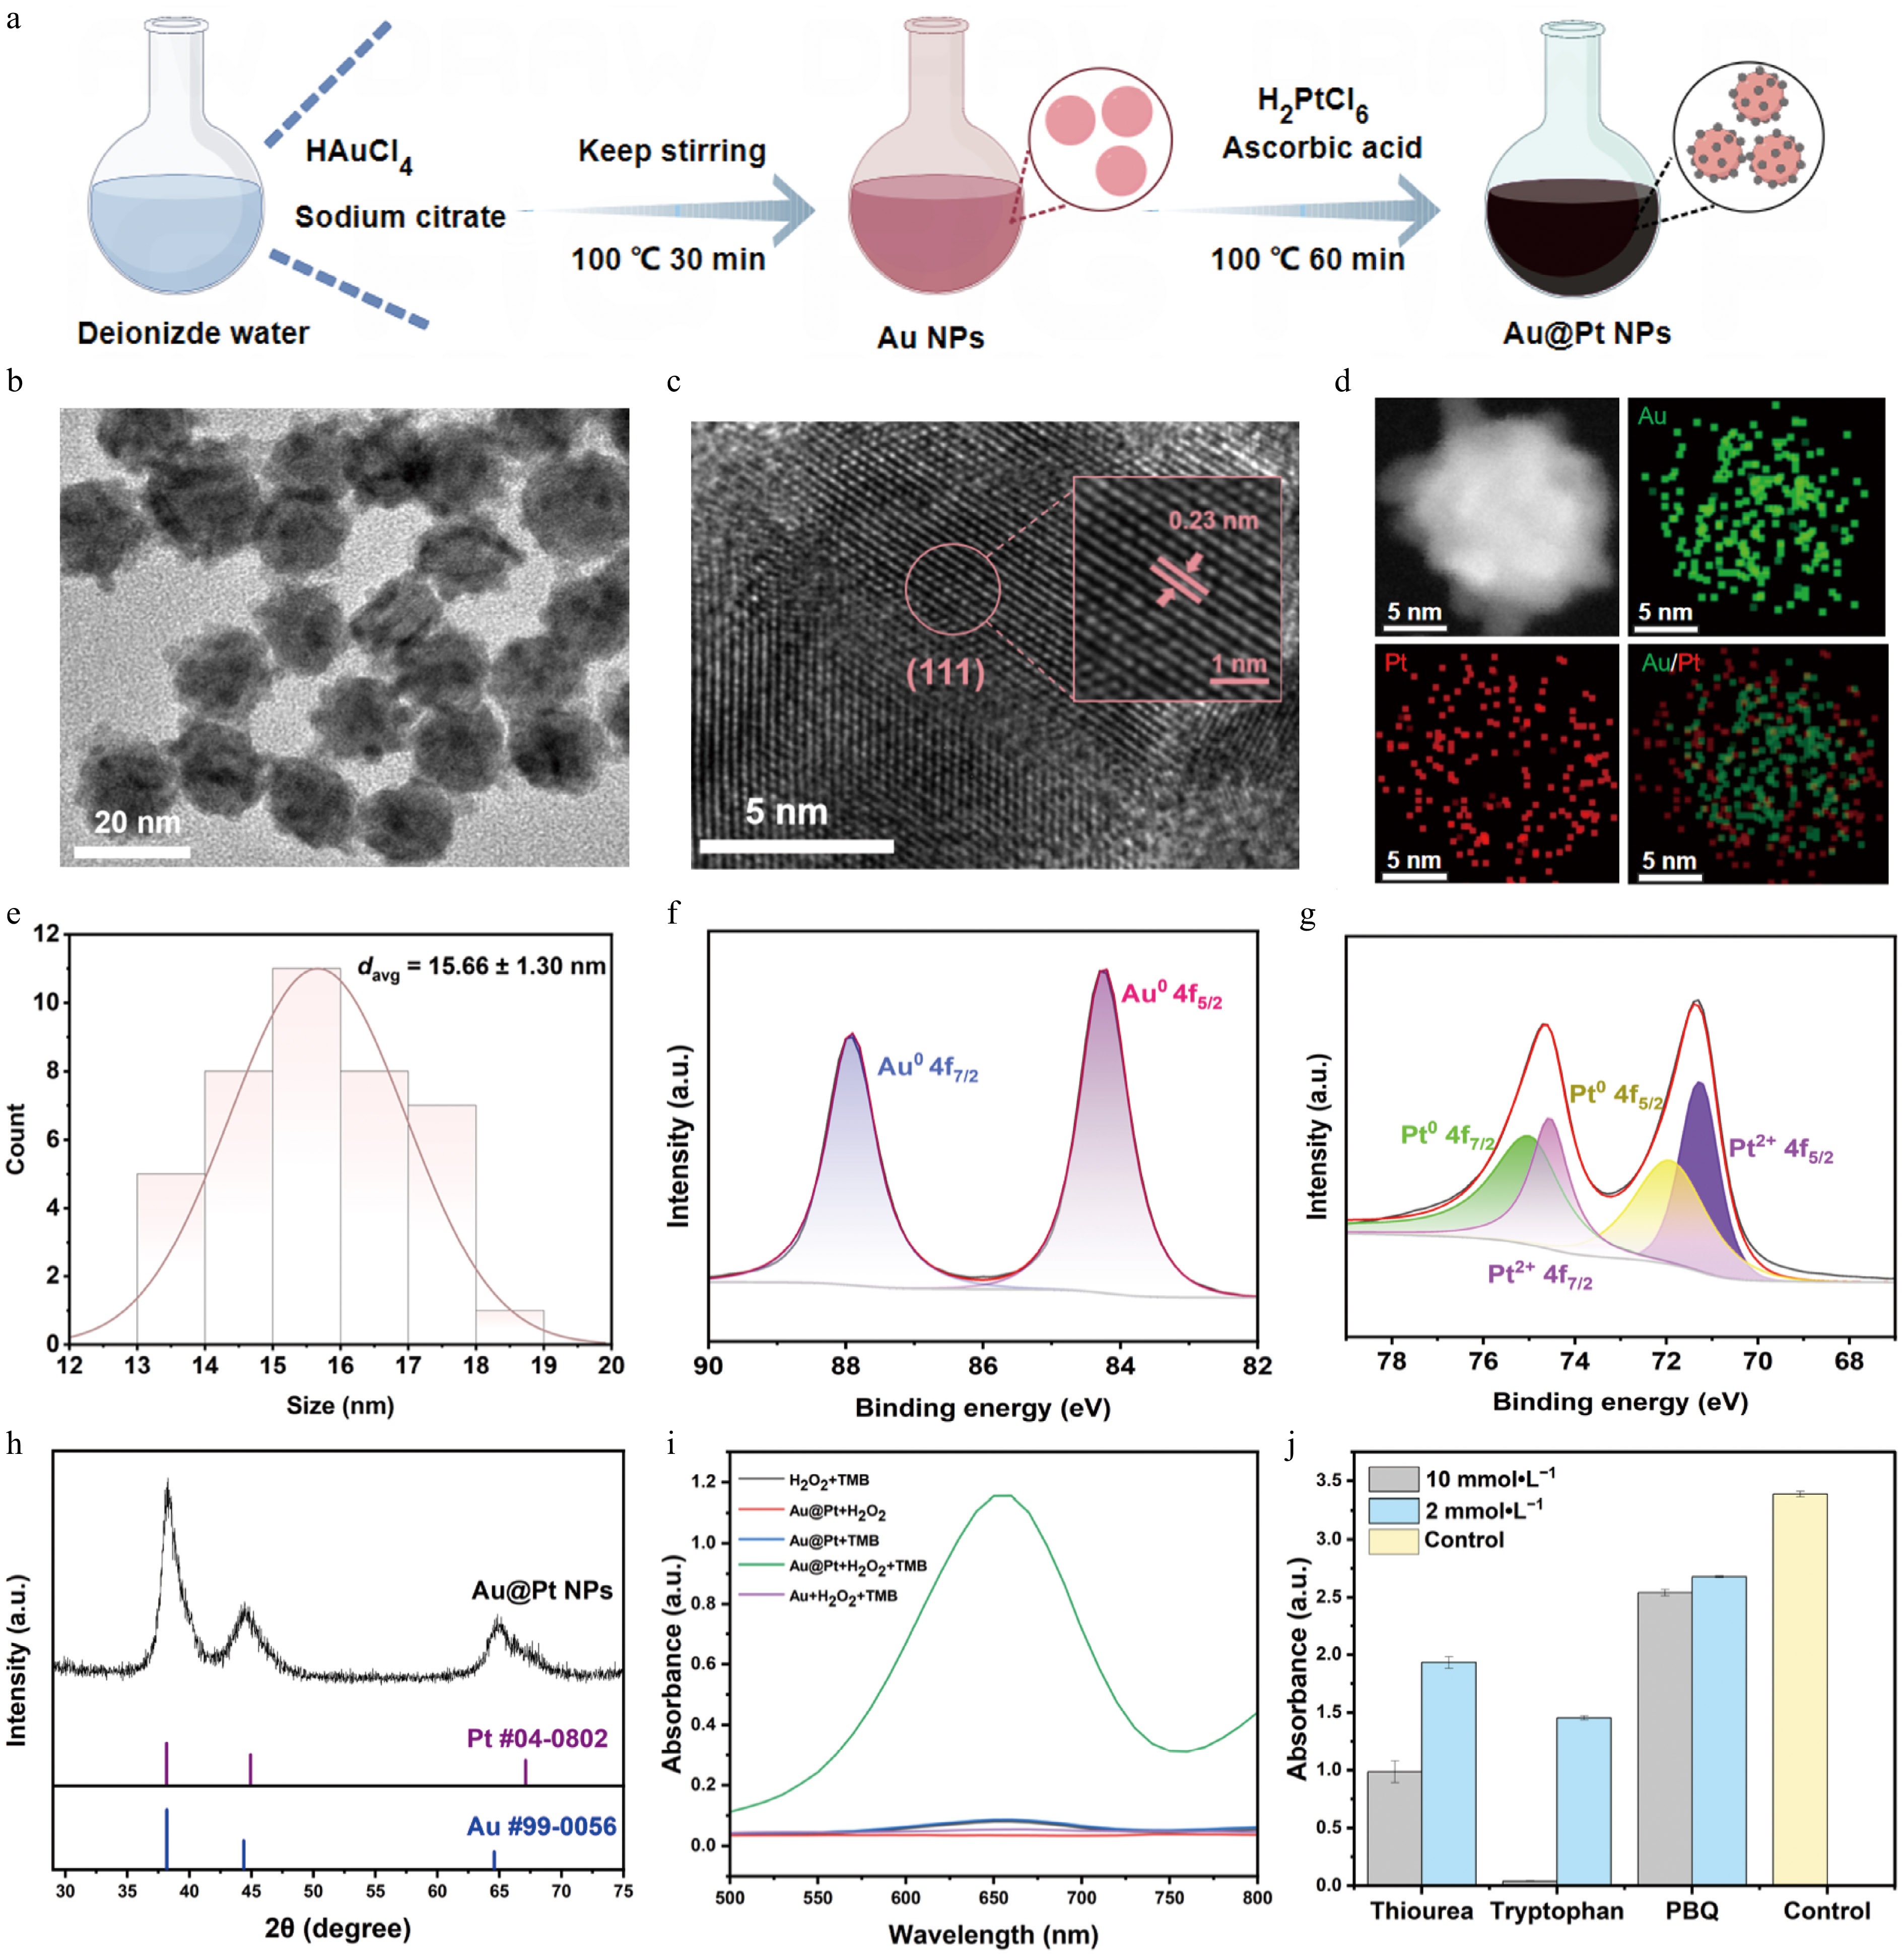
Figure 2.
Synthesis of Au@Pt NPs, preparation of Au@Pt-DNA probes and investigation of peroxidase-like activity. (a) The process of synthesizing Au@Pt NPs, involving the synthesis of Au NPs, followed by the reduction of Pt on the Au NPs' surface. (b) TEM image of Au@Pt NPs; the scale bar is 20 nm. (c) TEM lattice image of Au@Pt NPs, showing a lattice spacing of 0.23 nm; the scale bar is 5 nm. (d) EDX mapping of Au (green) and Pt (red), along with their merged mapping. (e) Particle size distribution histogram of Au@Pt NPs based on TEM analysis. (f) XPS spectra of Au 4f and (g) Pt 4f. (h) XRD pattern of Au@Pt NPs. (i) Visible absorption spectra of the mixed solutions containing Au@Pt NPs + TMB + H2O2, Au@Pt NPs + TMB, Au@Pt NPs + H2O2, TMB + H2O2, and Au NPs + TMB + H2O2. (j) Absorbance at 652 nm of the Au@Pt NPs + TMB + H2O2 catalytic system in the presence and absence of ROS scavengers. Note: Thiourea was used to scavenge •OH, tryptophan was chosen to scavenge 1O2, and p-benzoquinone (PBQ) was utilized to scavenge O2•−.
-
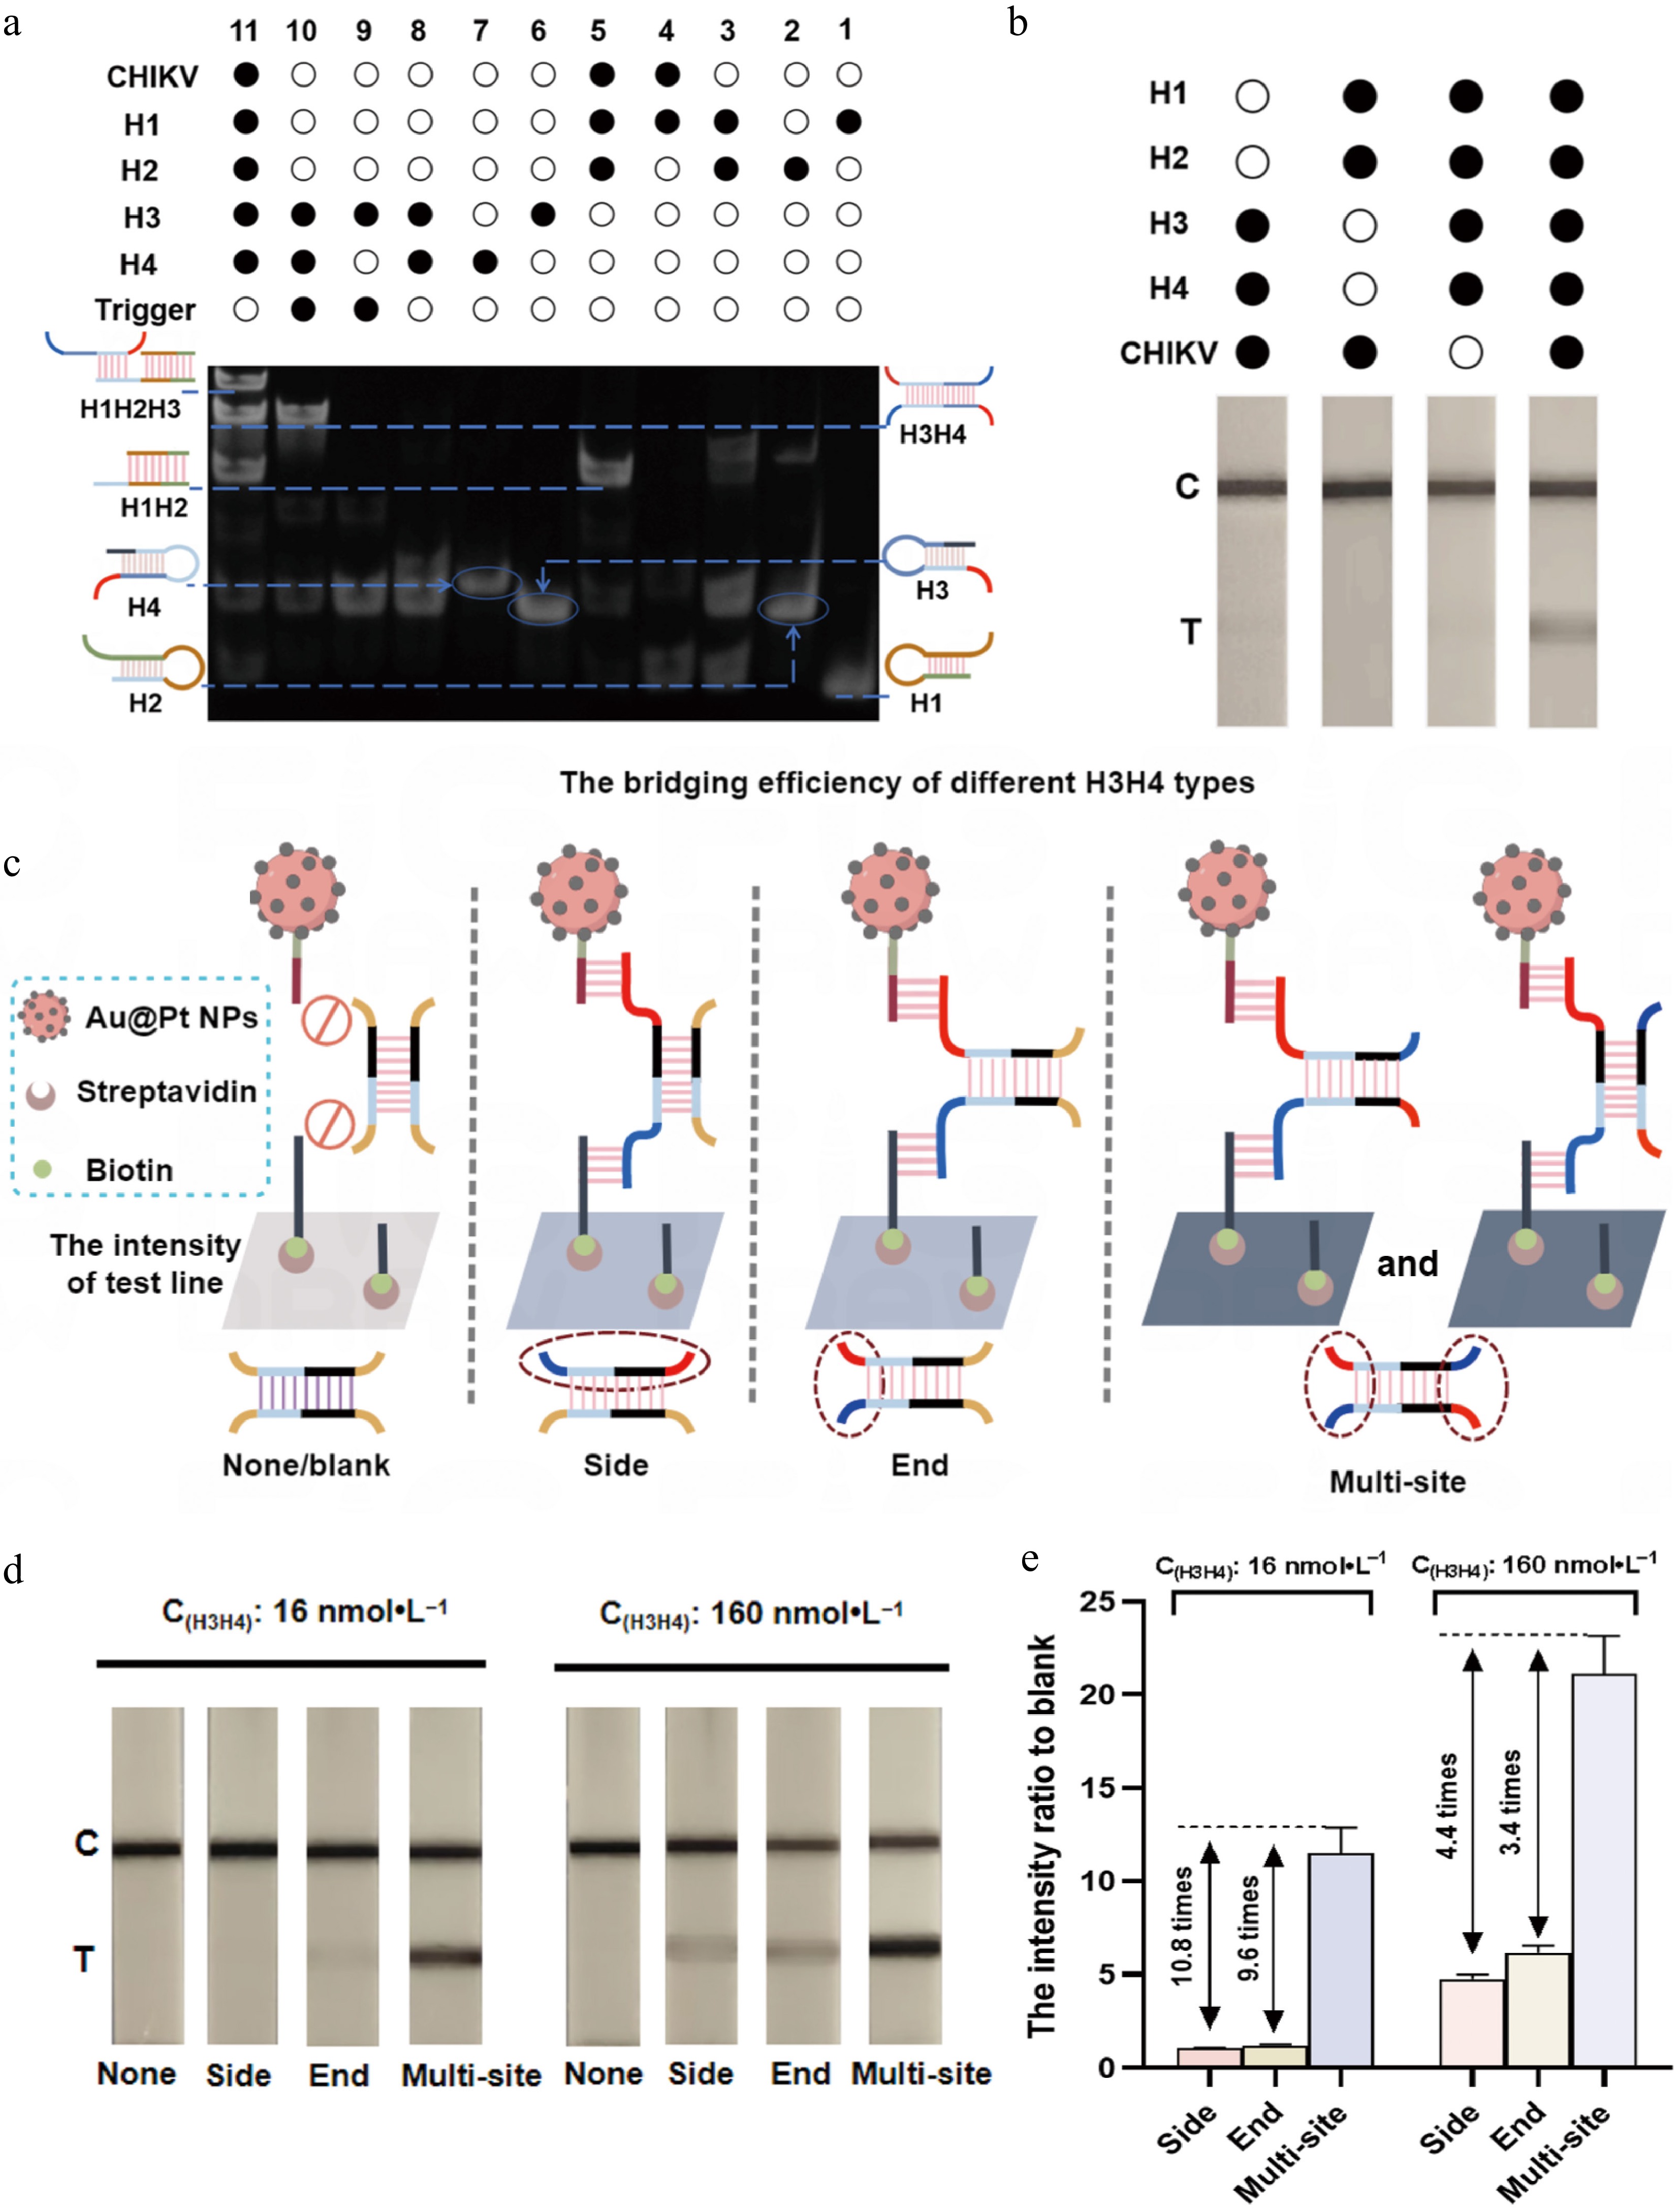
Figure 3.
Feasibility verification of mbLFIA. (a) Characterization of polyacrylamide gel electrophoresis for verifying the feasibility of the CHA assay. Lane 1, H1; Lane 2, H2; Lane 3, H1 + H2; Lane 4, CHIKV + H1; Lane 5, CHIKV + H1 + H2; Lane 6, H3; Lane 7, H4; Lane 8, H3 + H4; Lane 9, H3 + trigger; Lane 10, H3 + trigger + H4; Lane 11, CHIKV + H1 + H2 + H3 + H4. The concentration of DNA used in the gel electrophoresis was 200 nmol·L−1. (b) The mbLFIA's detection results in the presence or absence of H1, H2, H3, H4, and CHIKV. The concentrations of H1 and H2 were 25 nmol·L−1, the concentrations of H3 and H4 were 50 nmol·L−1, and the concentration of CHIKV was 100 pmol·L−1. (c) Schematic diagram for the bridging of Au@Pt-DNA probes on the T line by different types of H3H4 hybrids: 'None' has no site to bridge the Au@Pt-DNA probes; 'Side' can only bridge the Au@Pt-DNA probes via the sites on the same side; 'End' can only bridge the Au@Pt-DNA probes via the sites on single end; 'Multisite' can bridge Au@Pt-DNA probes via multiple sites on equivalent dual ends. The dashed boxes indicate the binding sites of the probes. (d) Colorimetric results on the test strip and (e) the T line's intensity ratio to blank for different types of H3H4 hybrids at concentrations of 16 and 160 nmol·L−1 (the intensity ratio versus the blank were calculated as the equation T line intensity of the variants H3H4/T line intensity of the blank).
-
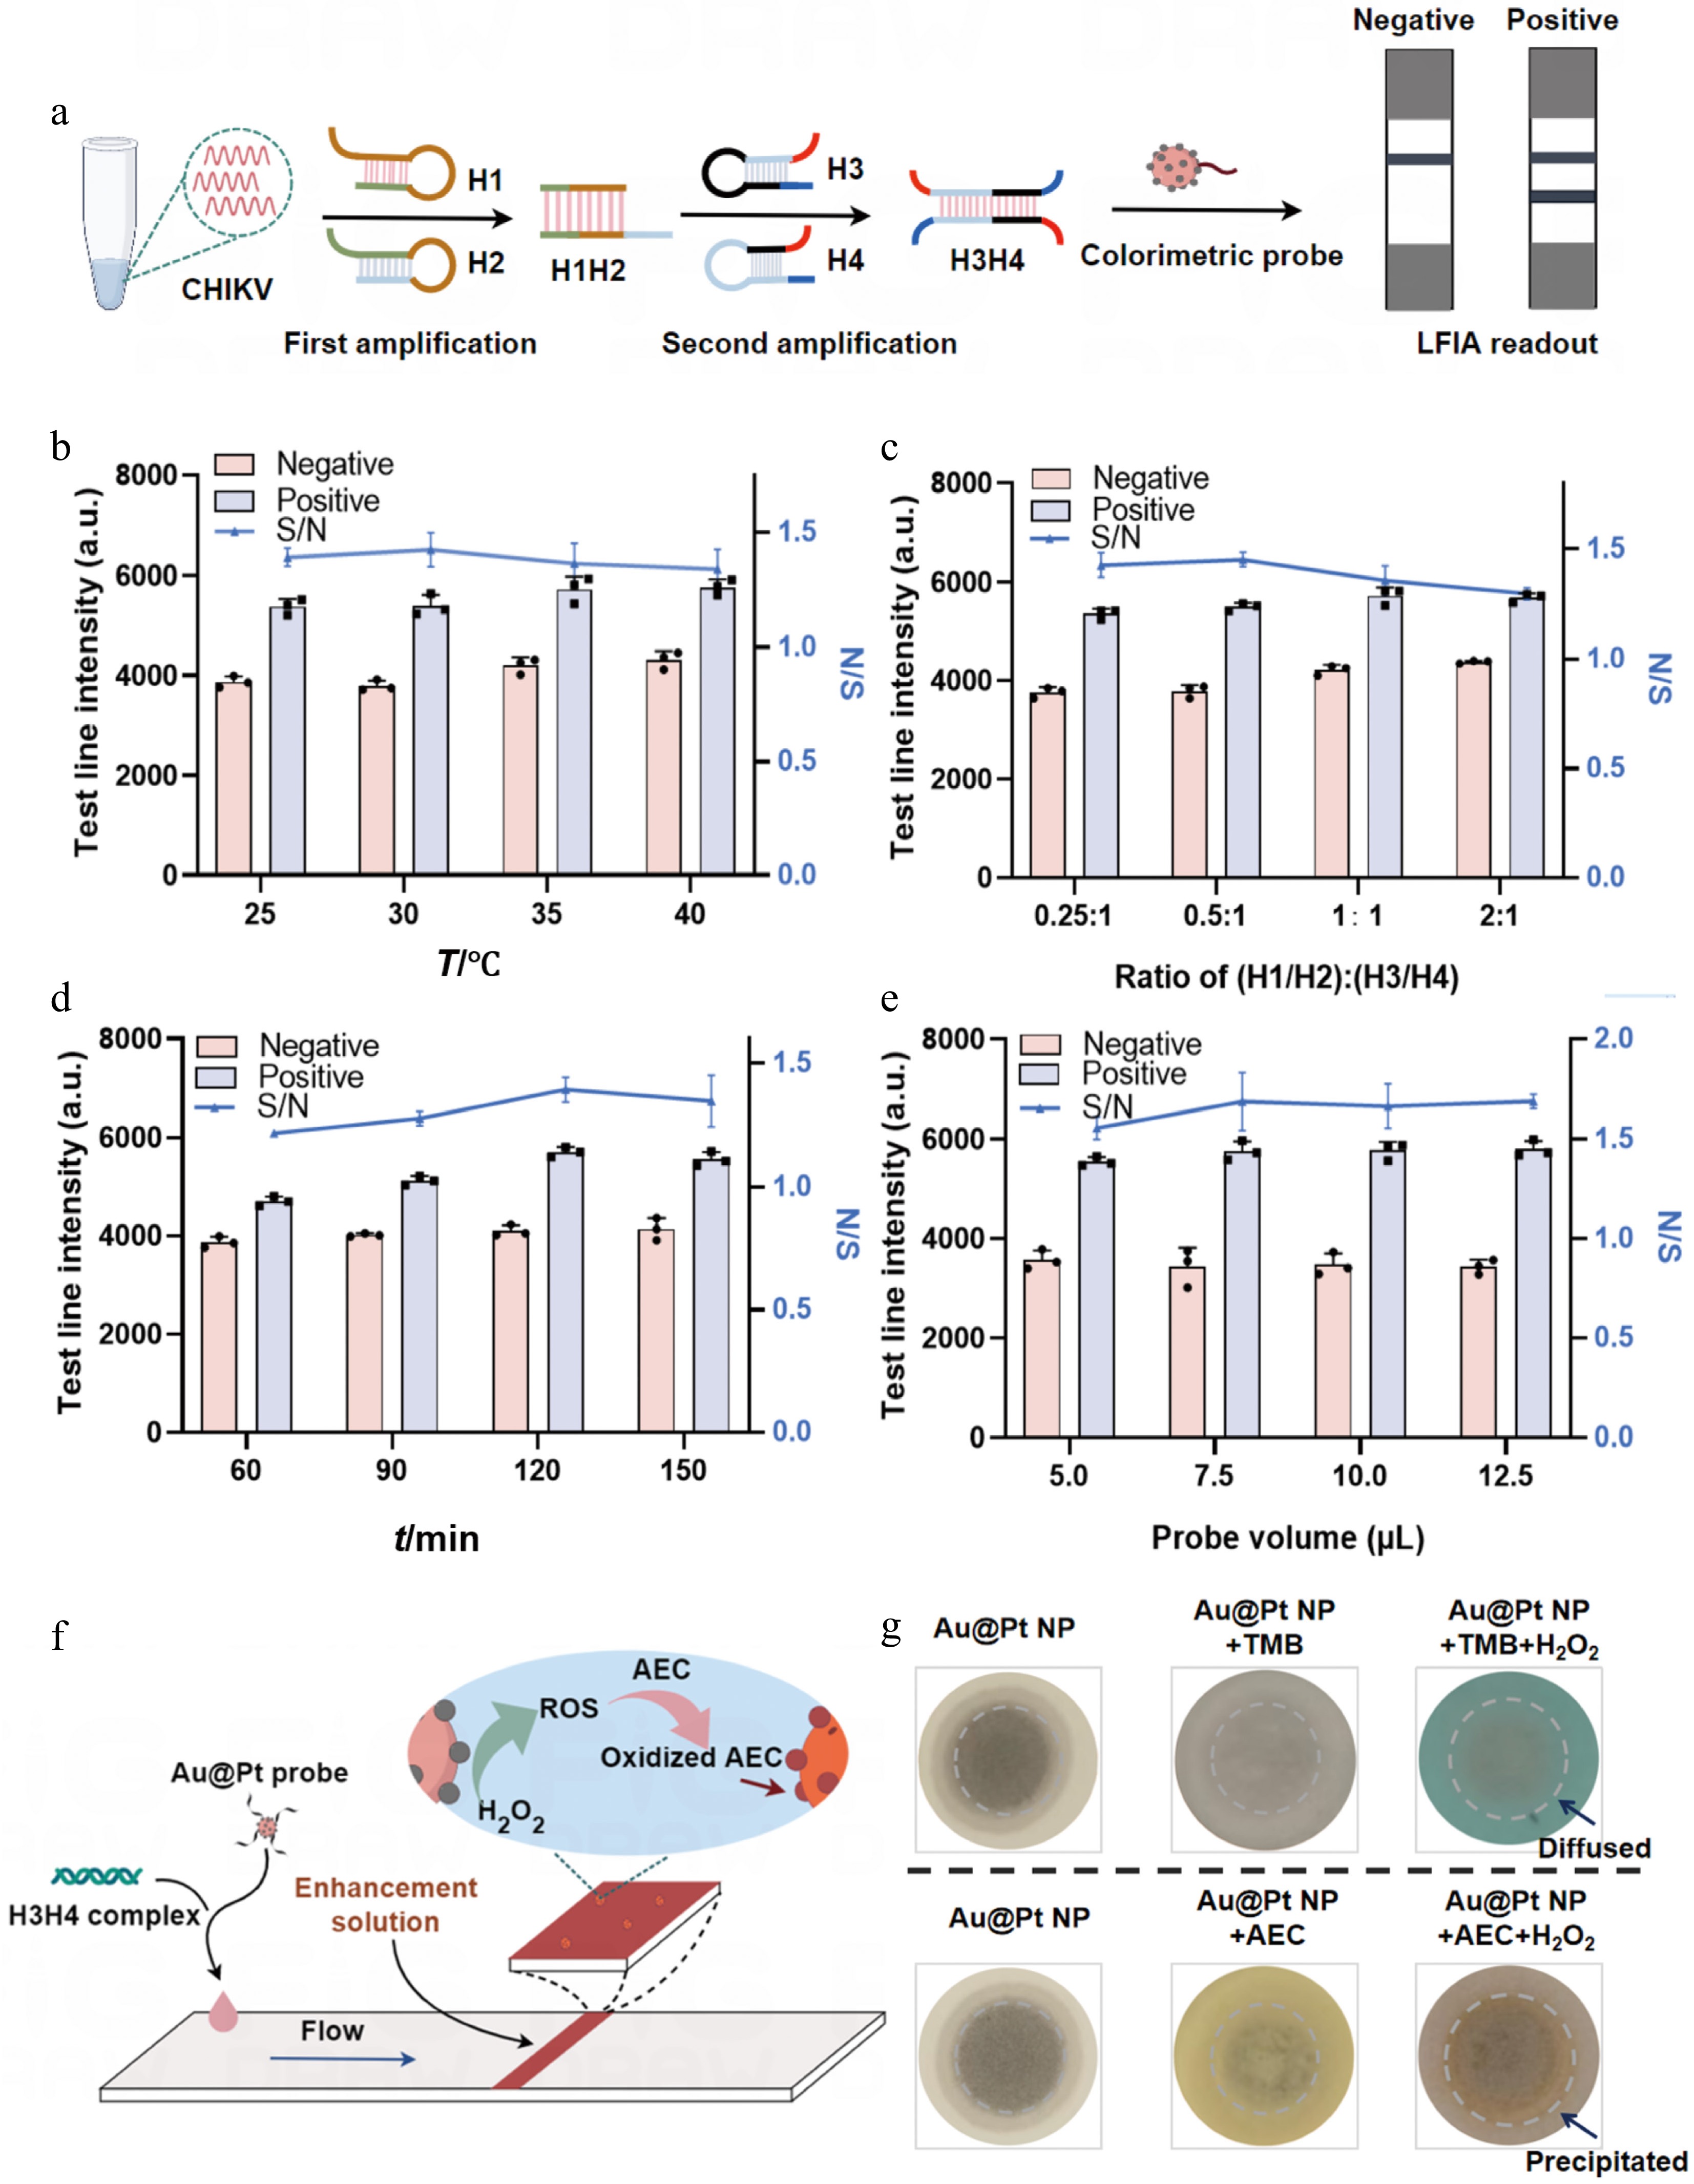
Figure 4.
Optimization of the mbLFIA conditions. (a) Optimization of the relevant reaction conditions using CHIKV as the target model. (b) Relative T line intensity of the positive and negative samples and their signal-to-noise ratios (S/N) under different temperatures, (c) different concentration ratios of H1H2 to H3H4, (d) different reaction times, and (e) different volumes of the Au@Pt-DNA probes. (f) Schematic diagram of the enzymatic signal enhancement strategy. (g) Effect comparison of TMB and AEC catalysis by Au@Pt NPs on NC membranes. In contrast to the diffusible product of TMB oxidation, the product of AEC oxidation catalyzed by Au@Pt NPs forms an insoluble in situ deposit.
-
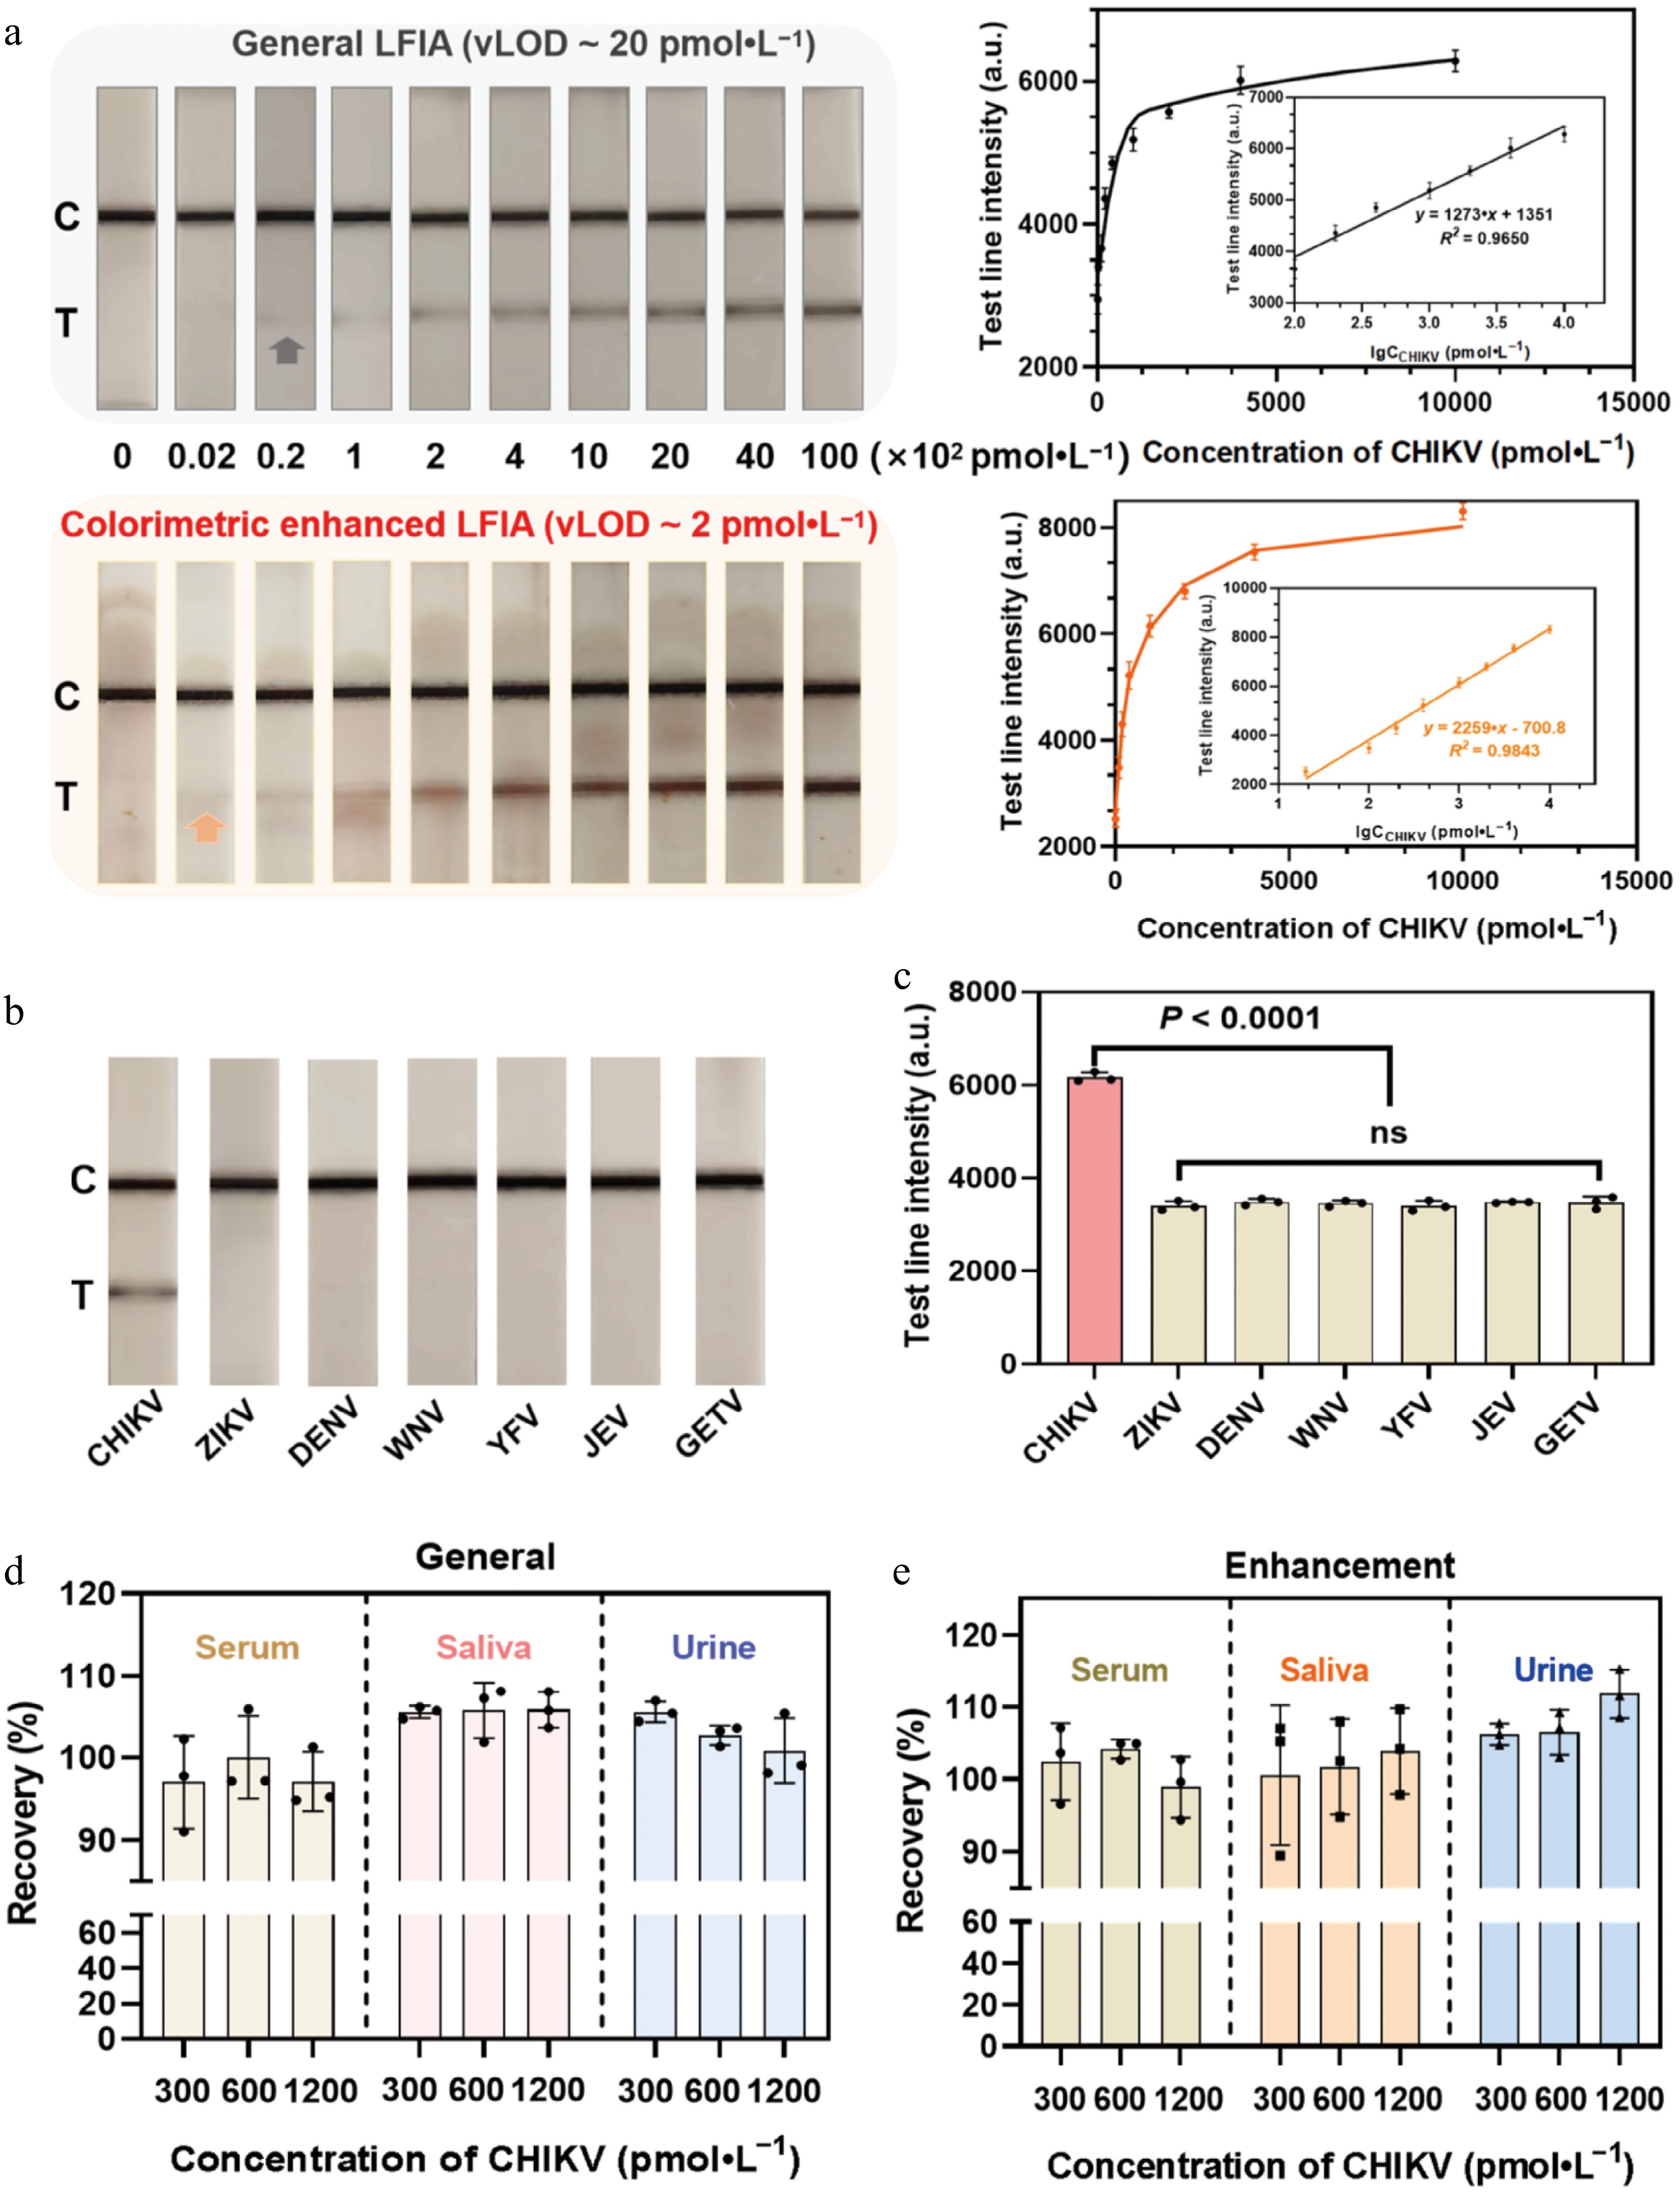
Figure 5.
Analytical performance of the mbLFIA for the detection of CHIKV. (a) Photographs of the test strips in response to different concentrations of CHIKV before and after AEC-based catalytic amplification. Calibration curves of the T line's intensity before and after AEC-based catalytic amplification. (b) Selectivity of different mosquito-borne viruses and (c) qualitative results of the mbLFIA. Dengue virus, DENV; Zika virus, ZIKV; Yellow fever virus, YFV; Japanese encephalitis virus, JEV; West Nile virus, WNV; Getah virus, GETV. Qualitative results of the test strips for the recovery of CHIKV from spiked samples in serum, saliva, and urine matrices by the mbLFIA test strips (d) before and (e) after AEC-based catalytic amplification.
-
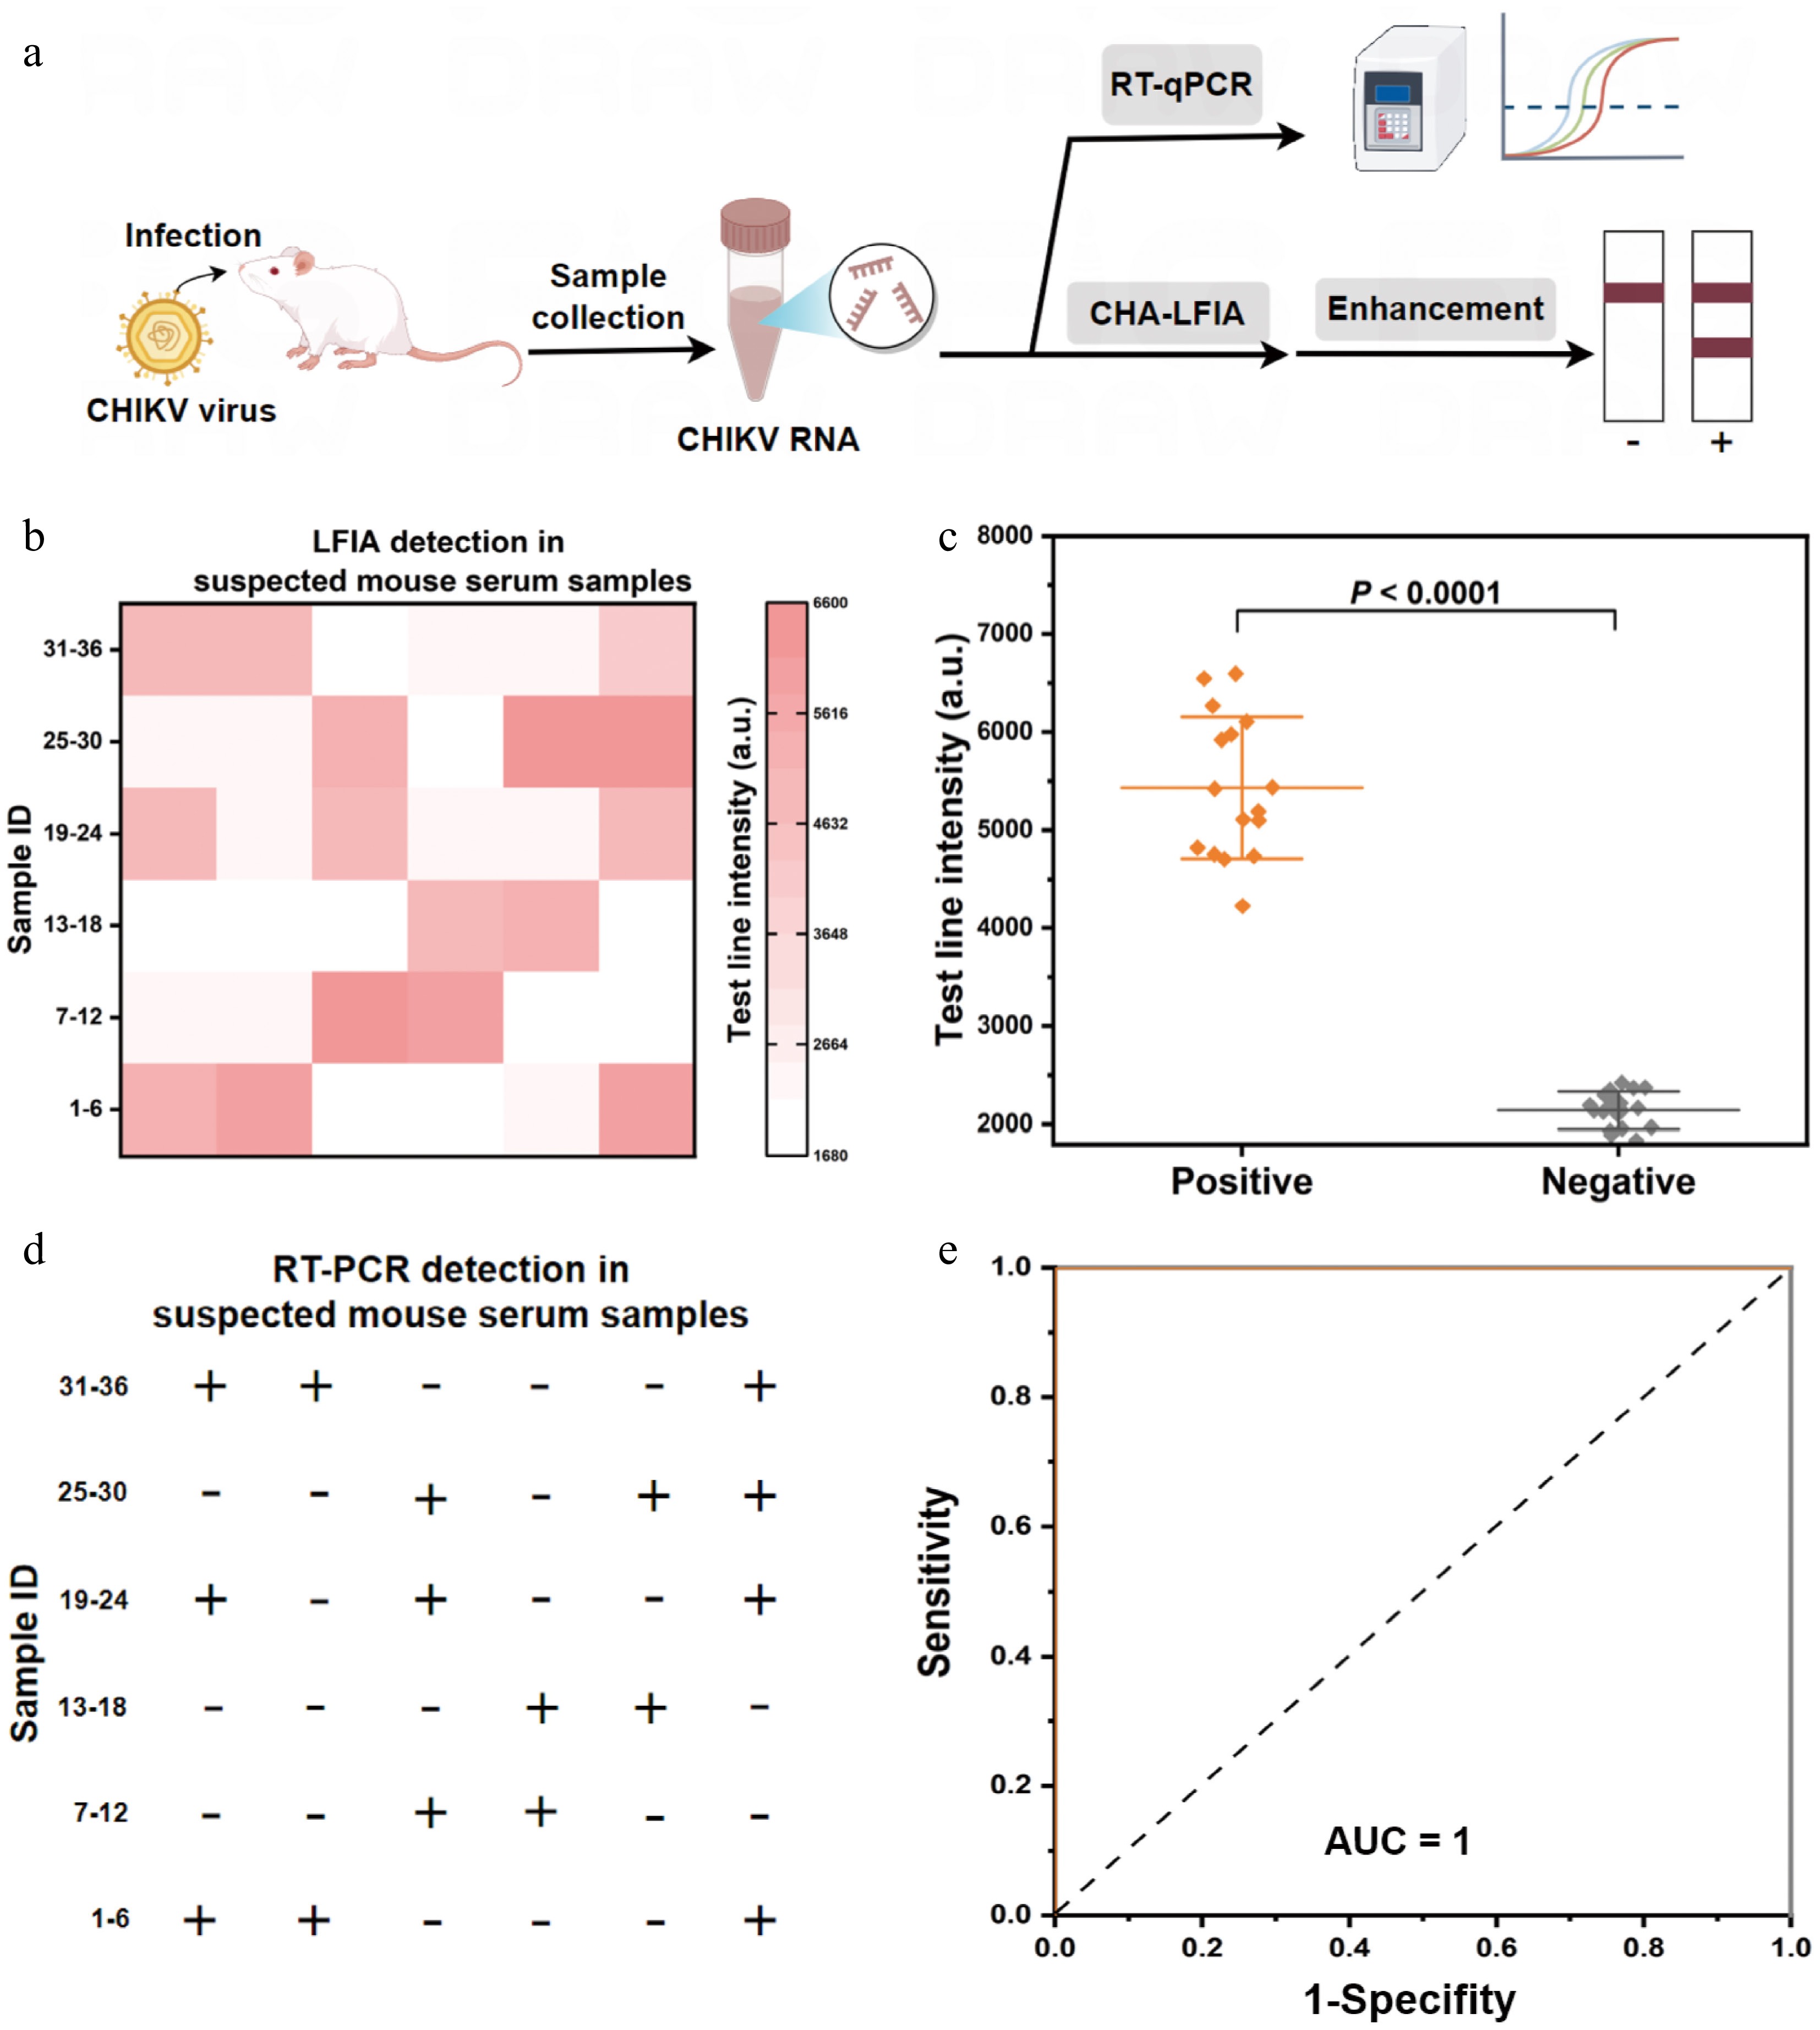
Figure 6.
Identification of CHIKV in suspicious mice serum samples. (a) Requirements of the steps needed to detect CHIKV in suspected mice serum samples by the mbLFIA and RT-qPCR techniques. (b) Heat map indicating the findings of detecting CHIKV in 36 suspected mice serum samples with the mbLFIA. The heat map shows the intensity of the T line of each sample. (c) Scatter plot of the T line's intensity values in 20 negative samples and 16 positive samples identified by the mbLFIA method (two-tailed Student's t-test; ***, P < 0.0001; data are presented as mean ± SD, n = 3). (d) The identification of infected CHIKV samples in 36 suspicious mice serum samples by RT-qPCR. The sign '+' indicates positive samples and '–' indicates negative samples. (e) Detection accuracy of the mbLFIA in sample applications using ROC curve analysis.
Figures
(6)
Tables
(0)