-
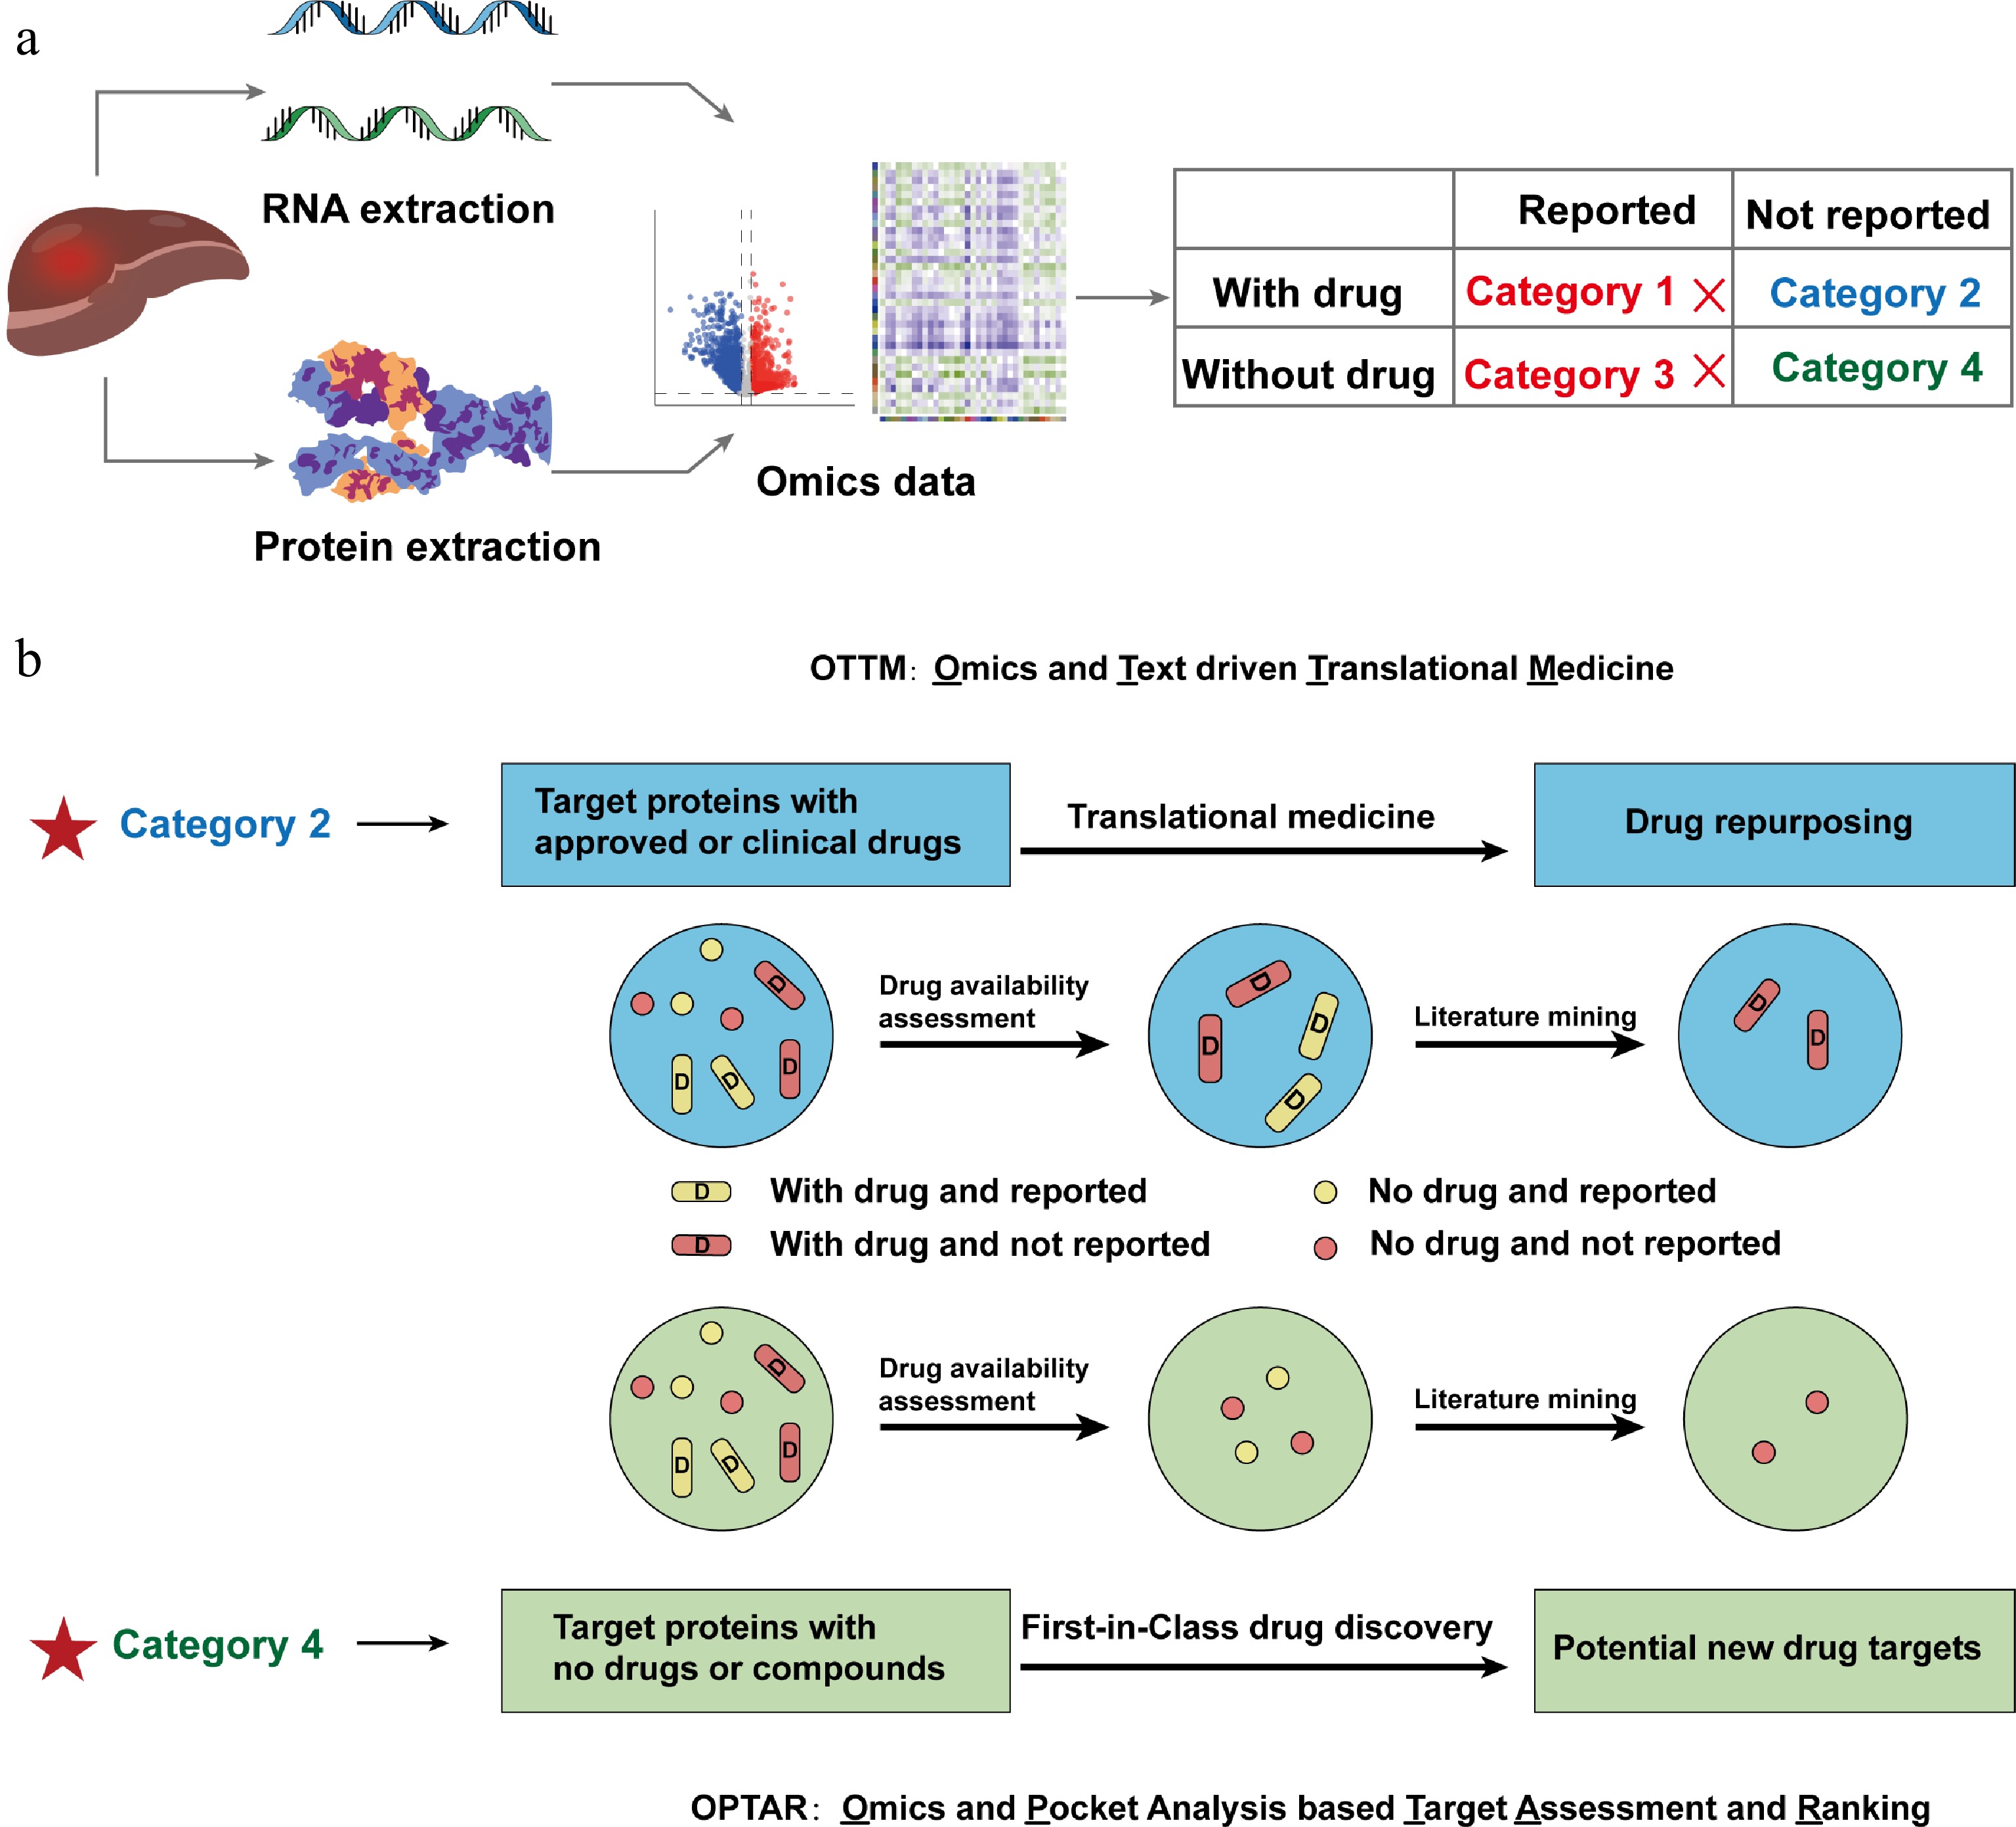
Figure 1.
Schematic diagram illustrating the development principle of a new computational tool OPTAR. (a) Proteins or genes from omics data are classified into four categories according to whether their target proteins have FDA-approved or clinically tested drugs, and whether they have been previously reported associated with the disease: Category 1, with approved or clinical drugs and have been previously reported associated with the disease; Category 2, with approved or clinical drugs and have not been reported associated with the disease; Category 3 lack approved or clinical drugs and the proteins have been previously reported associated with the disease; Category 4 lack approved or clinical drugs and have not been reported associated with the disease. (b) Comparison of the screening workflows of previously reported OTTM and OPTAR. Both tools are based on the classification system described above: OTTM first performs drug availability assessment to retain Categories 1 and 2, then employs literature mining to exclude Category 1, ultimately identifying Category 2 targets (existing drugs with potential new indications). OPTAR first performs drug availability assessment to retain Categories 3 and 4, then uses the same literature mining approach to exclude Category 3, ultimately identifying Category 4 targets (novel targets without existing drugs and no reported disease association).
-
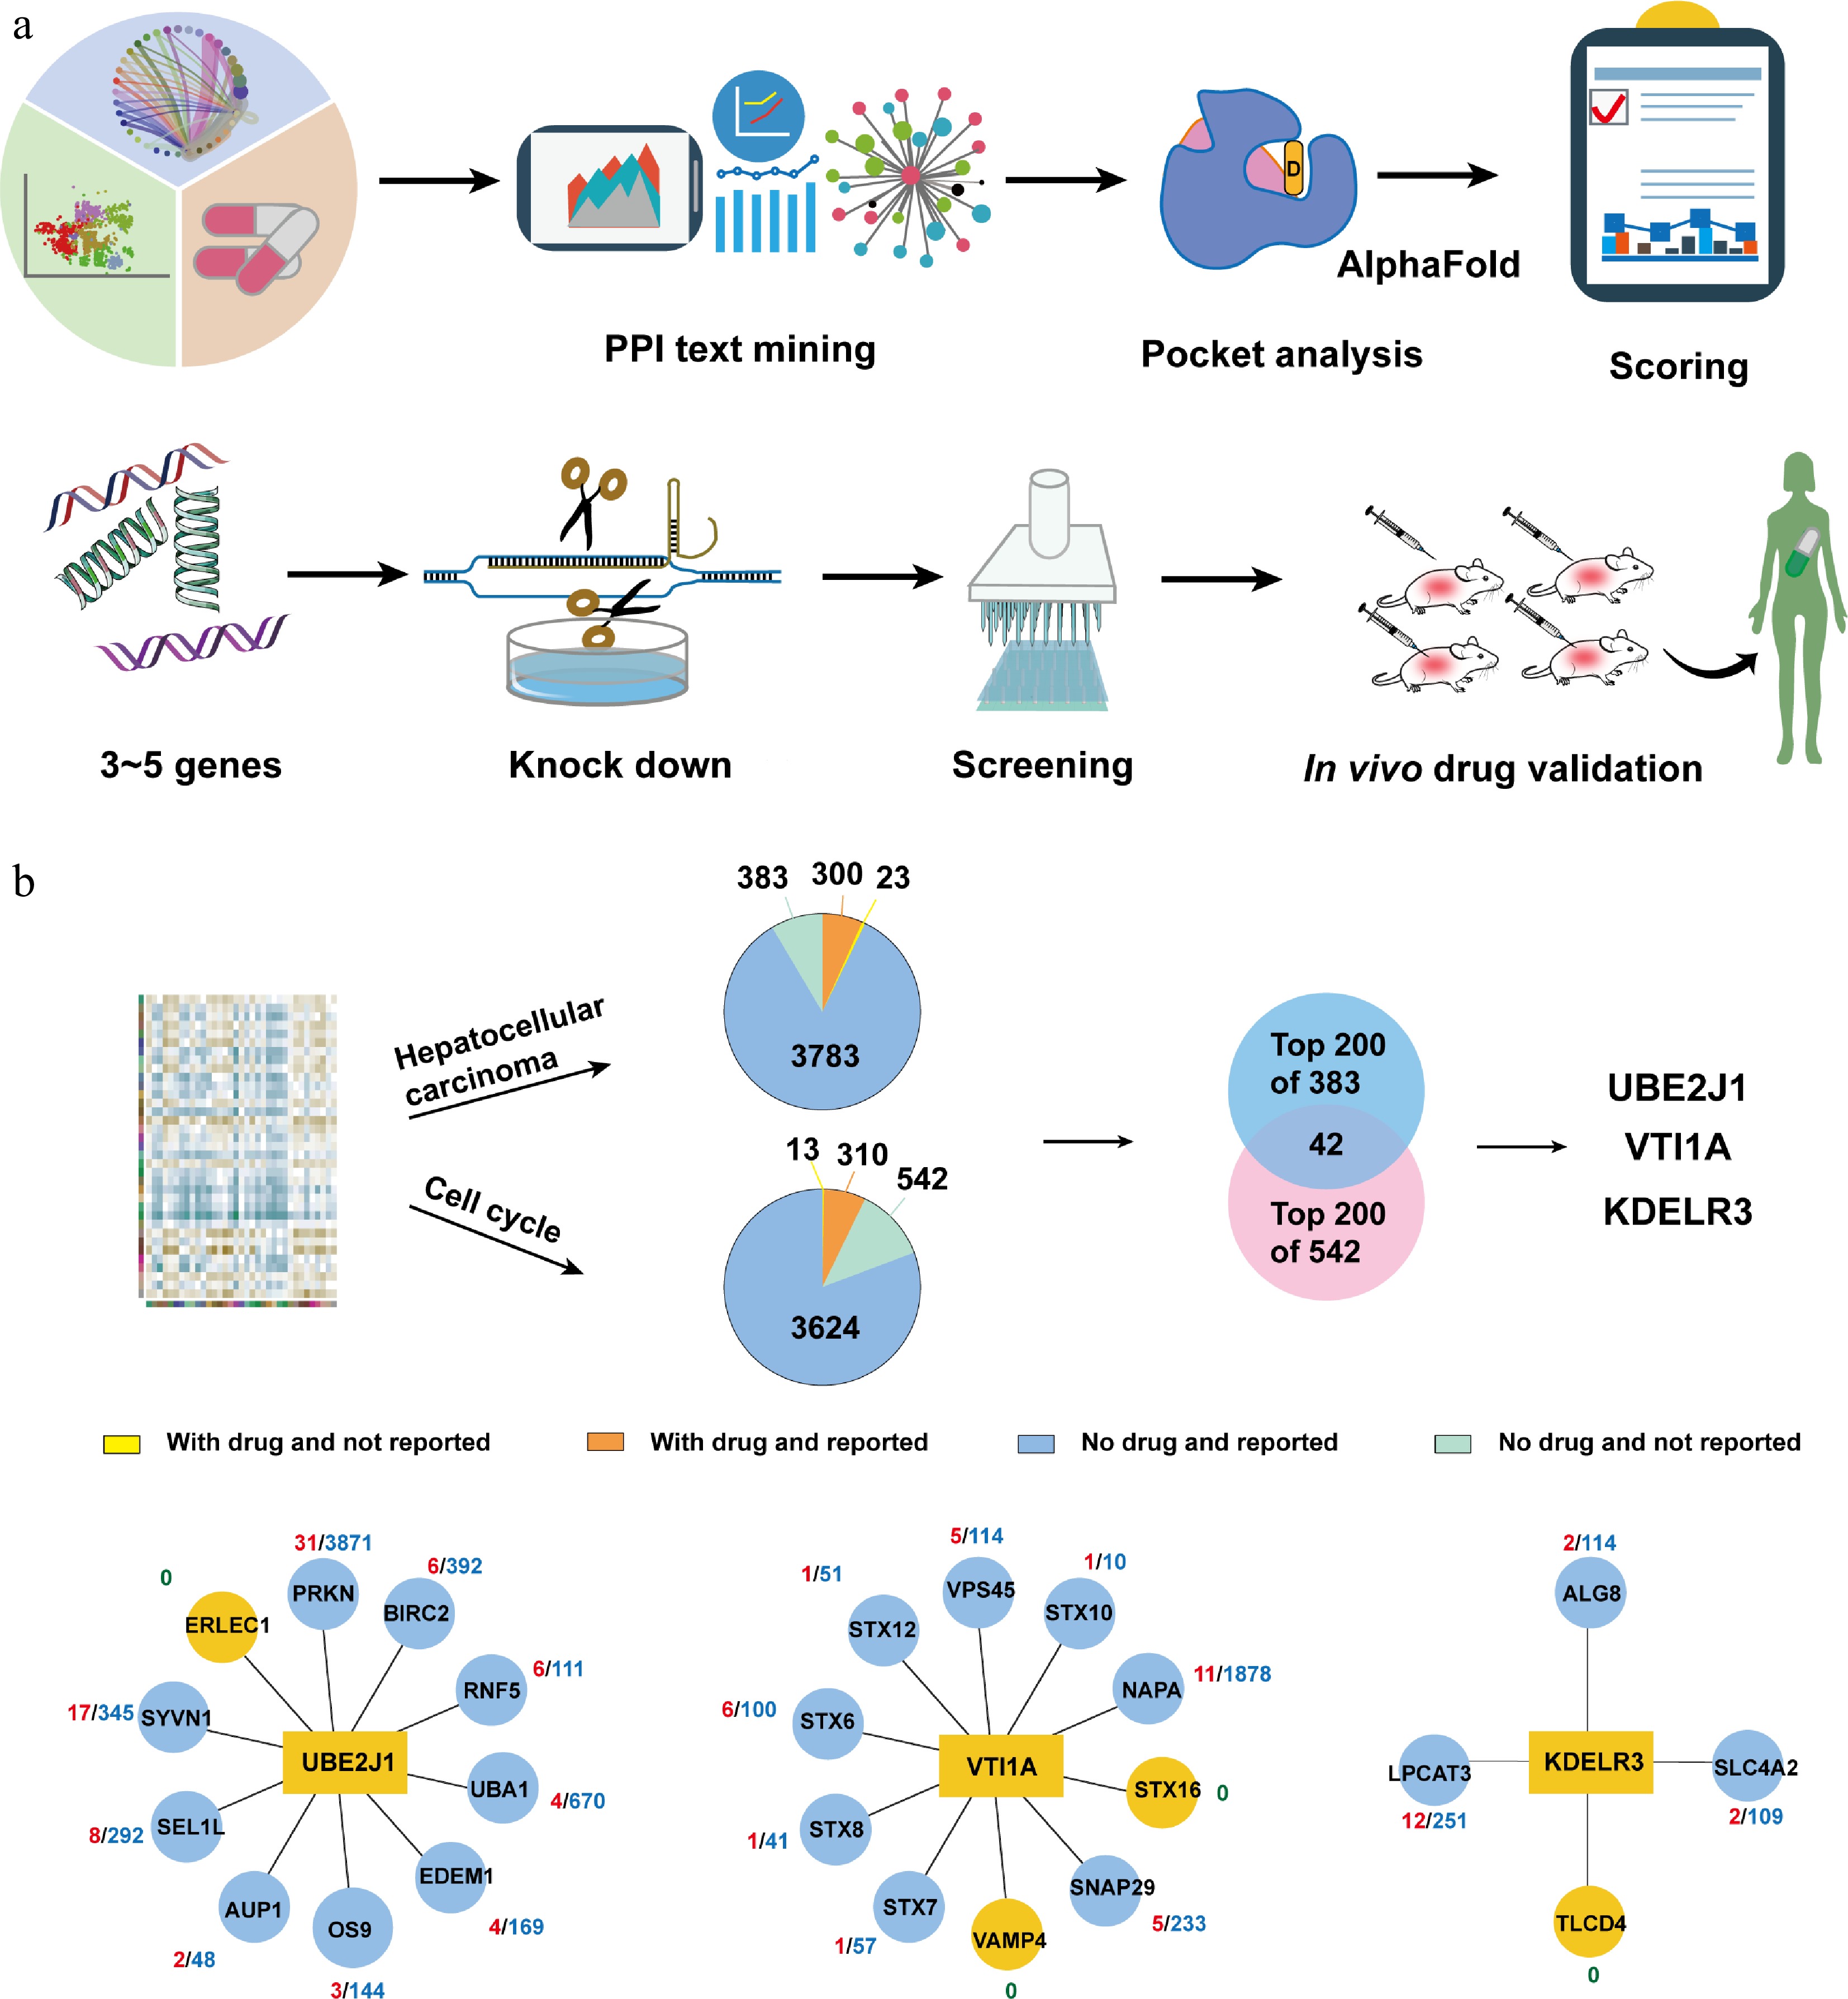
Figure 2.
Using OPTAR for potential target discovery of hepatocellular carcinoma. (a) Typical workflow of using OPTAR combined with experimental validation. Category 4 candidate targets undergo literature mining in interacting proteins to infer disease correlation. High-scoring targets are subjected to binding pocket assessment with AlphaFold-predicted structures using the pocket analysis module of OPTAR, followed by knockdown validation. After protein expression and high-throughput screening, active compounds were subjected to in vivo efficacy and safety evaluation. (b) Target discovery against hepatocellular carcinoma using OPTAR. Starting from the omics data previously used by OTTM, OPTAR generated two protein lists using 'hepatocellular carcinoma' and 'cell cycle' as keywords. Then 383 and 542 proteins without drugs or reported relevance to the disease were identified, respectively. The intersection of the top-ranking 200 proteins from each list contains 42 proteins. Finally, three candidate genes UBE2J1, VTI1A, and KDELR3 were selected for subsequent knockdown experiments, considering the results of pocket assessment and whether recombinant proteins are commercially available. Protein-protein interaction networks were plotted with reference to the STRING database.
-
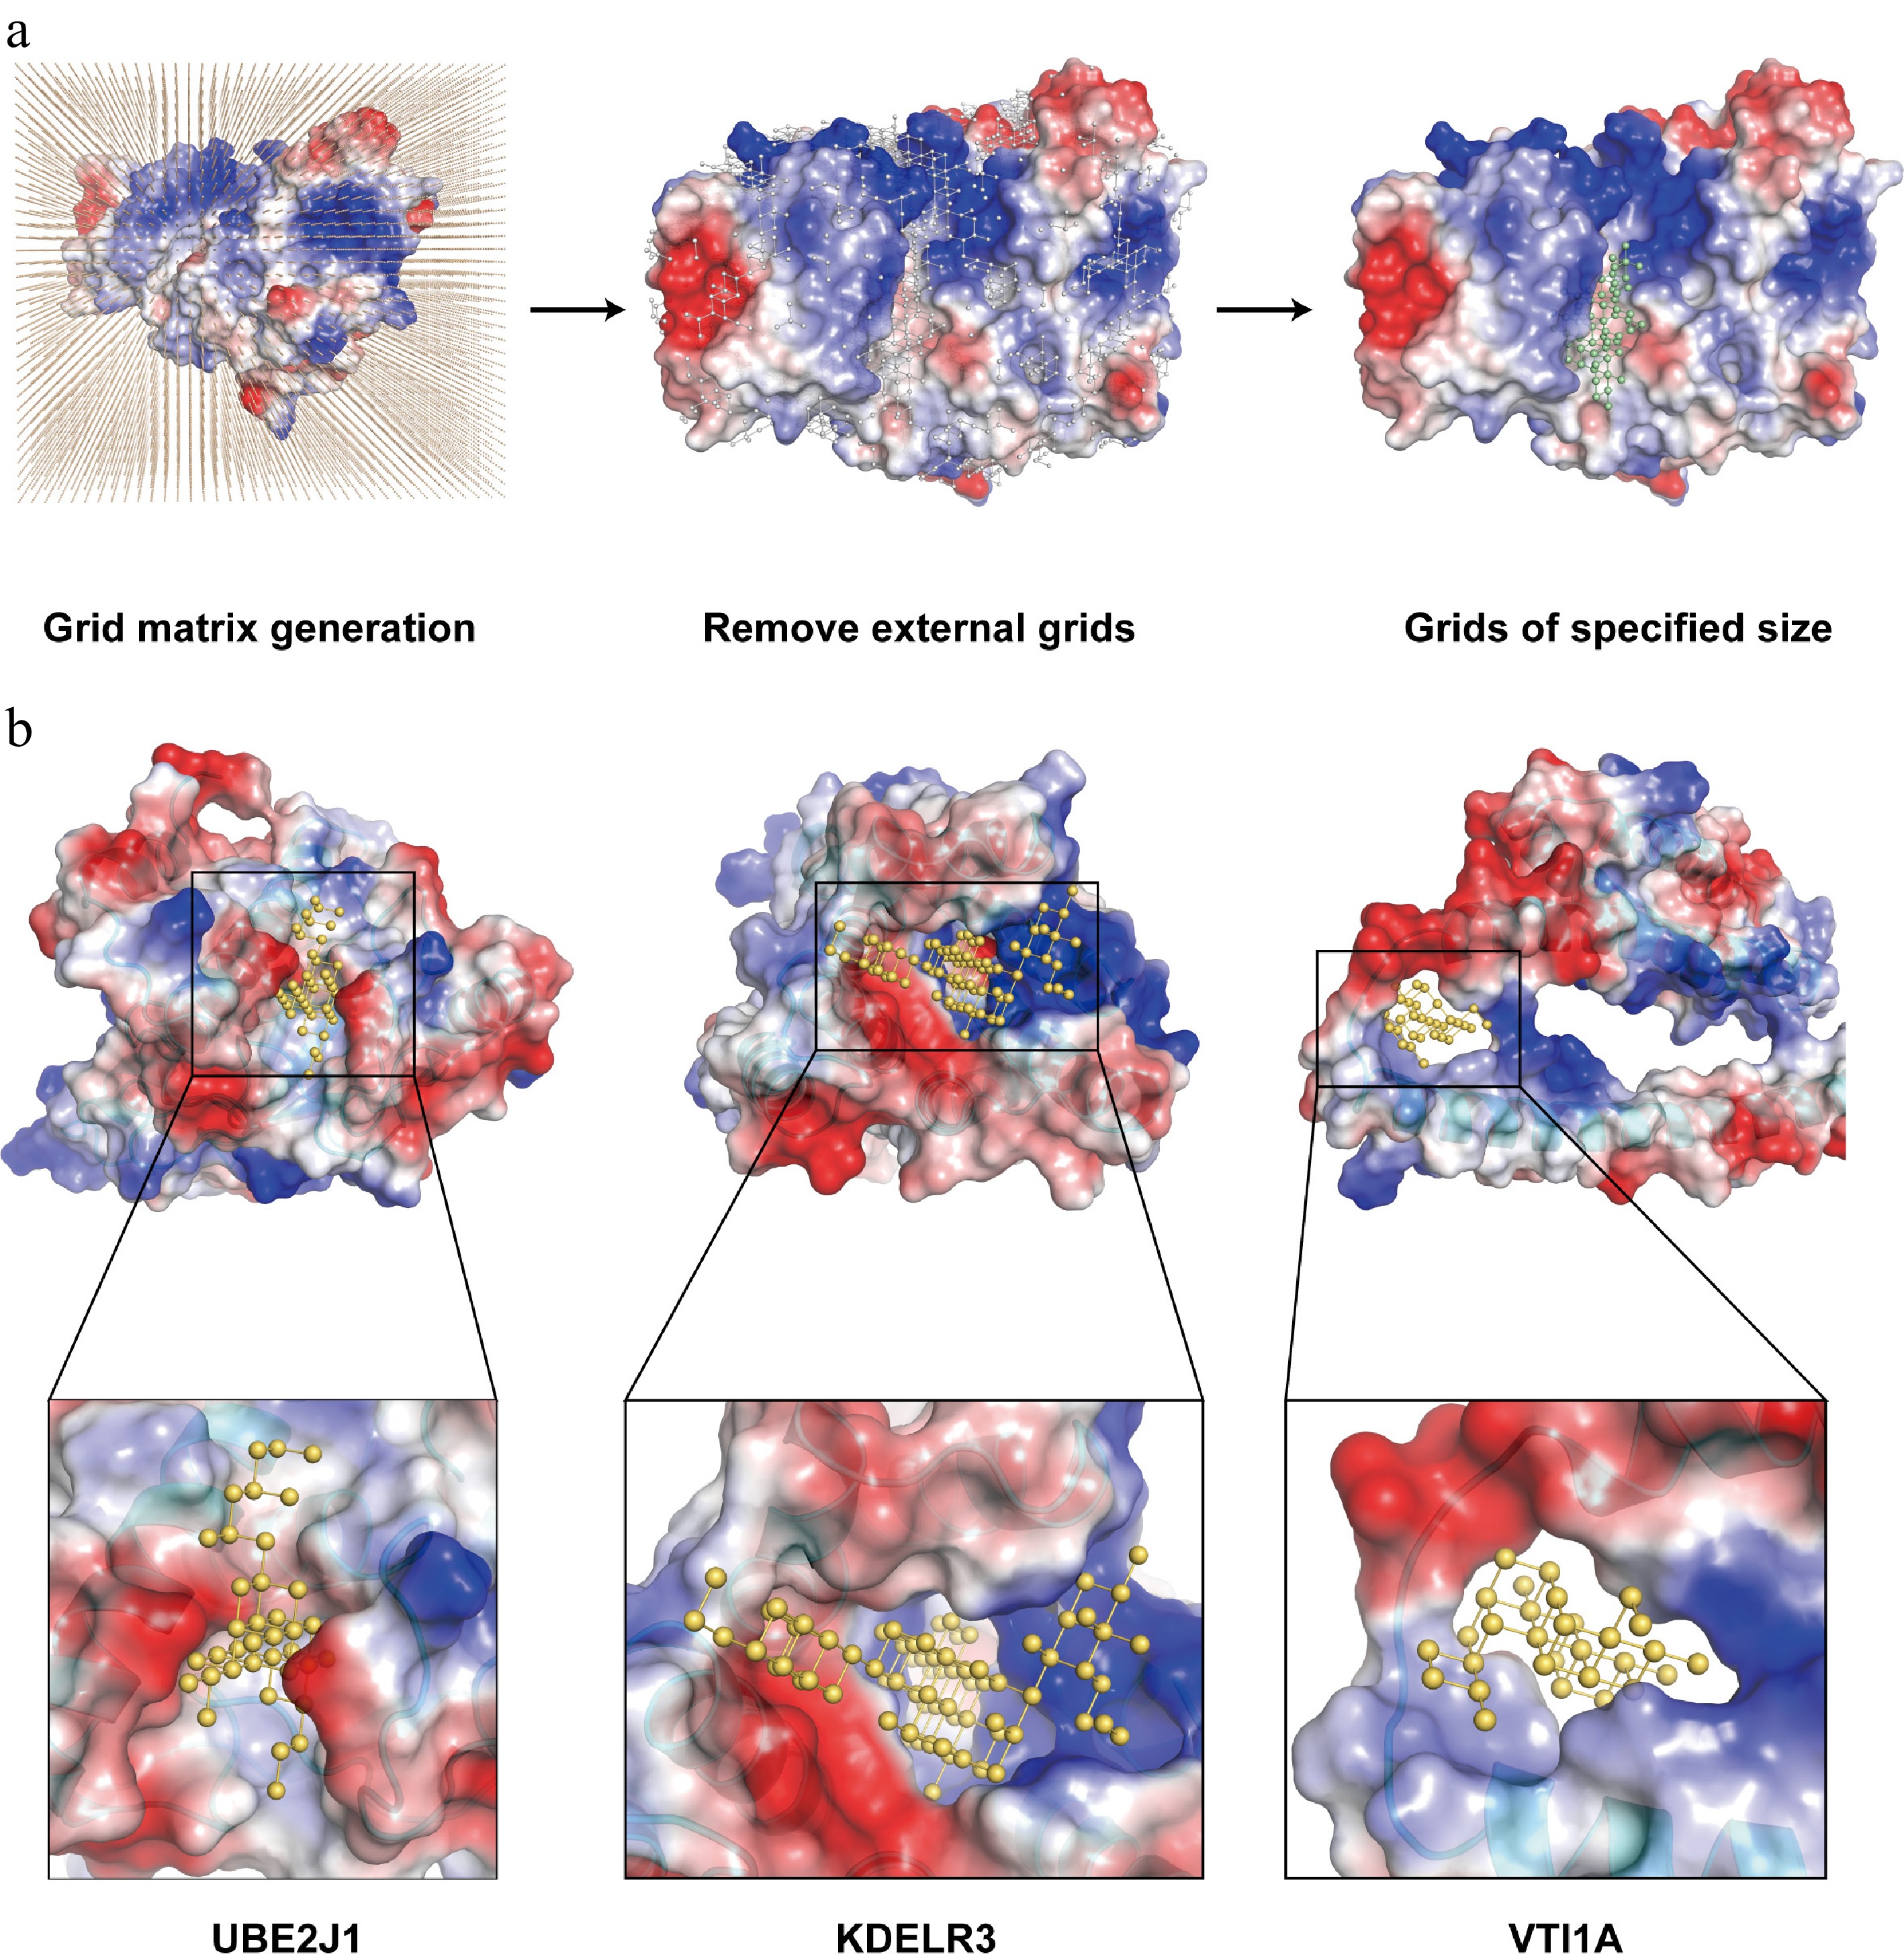
Figure 3.
Development of the binding pocket assessment module of OPTAR. (a) OPTAR utilizes AlphaFold-predicted three-dimensional structures of candidate proteins to identify suitable binding pockets for small-molecular compounds through three stages: placing protein structures in a three-dimensional grid matrix, removing grid points outside the protein, and removing discontinuous grid areas. Finally, only continuous grid regions of expected size for ideal drug binding were retained. Representation of compound-binding pockets identified by OPTAR for (b) UBE2J1, (c) KDELR3, and (d) VTI1A. Protein surface is colored according to electrostatic potential distribution (red indicates negative potential, blue indicates positive potential, and white indicates neutral). Predicted small-molecule binding sites are shown as yellow ball-and-stick models. Zoomed views illustrate the expected size and shape of potential active compounds.
-
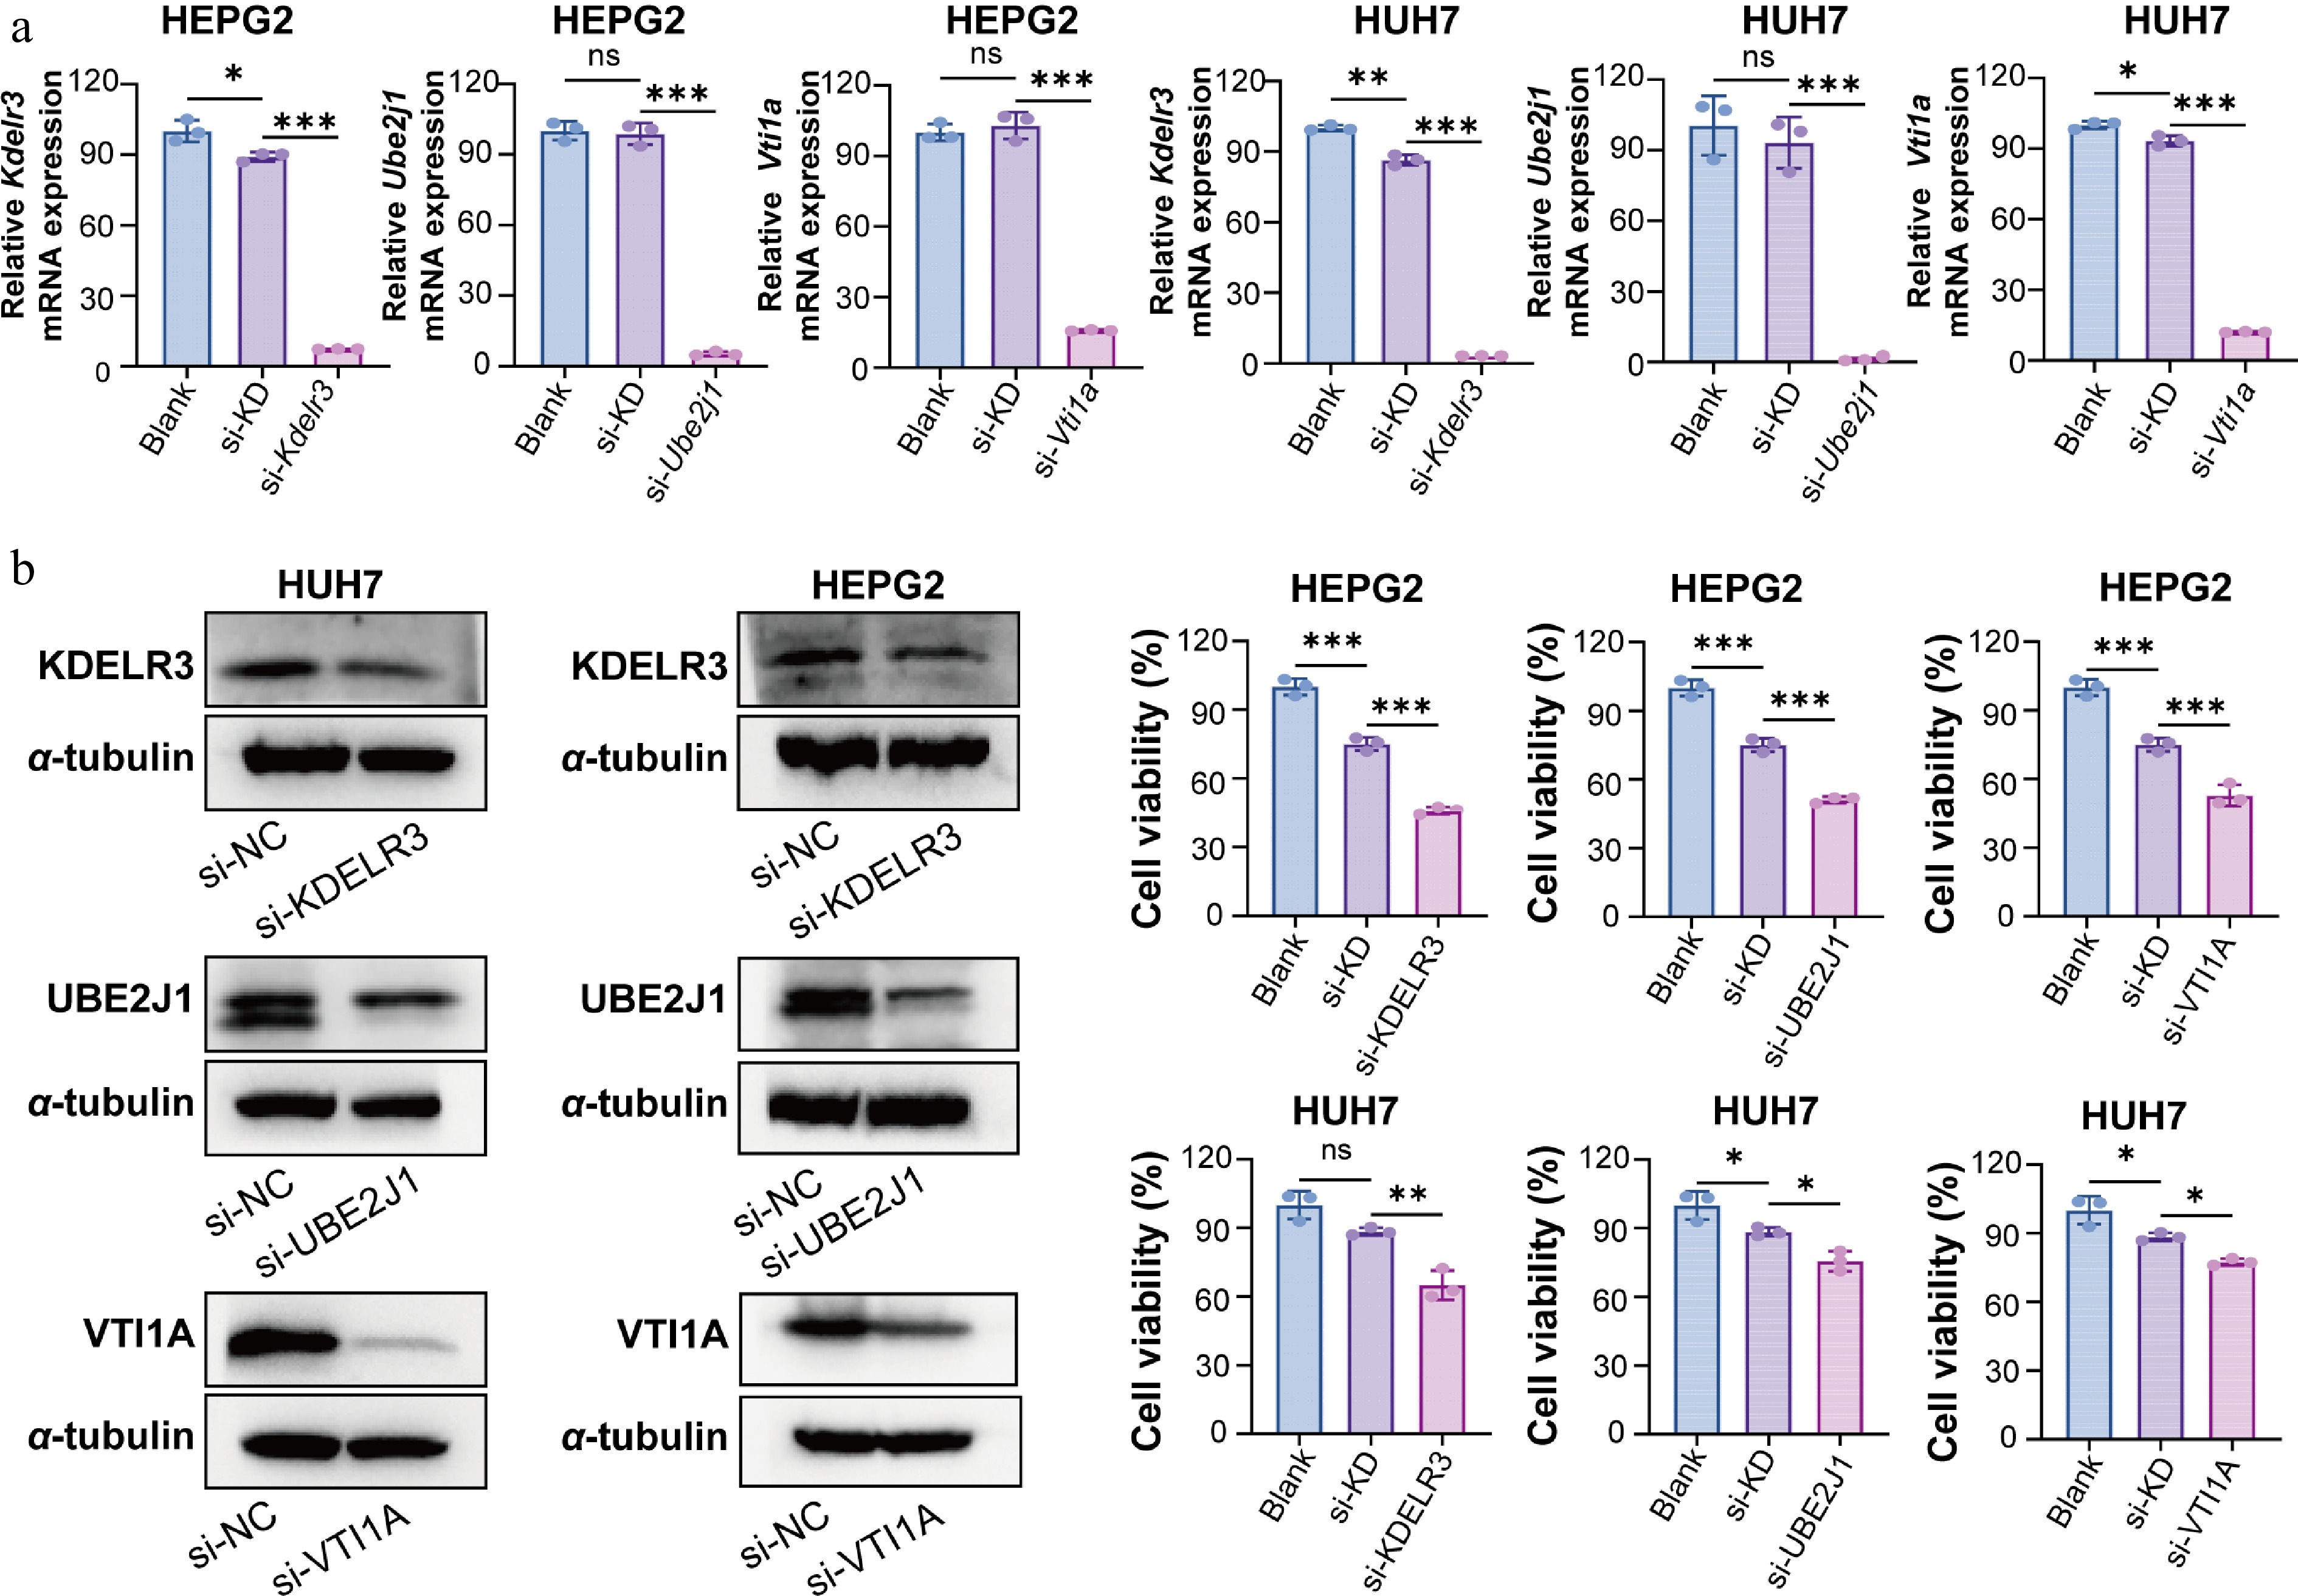
Figure 4.
Validation of knockdown efficiency of UBE2J1, KDELR3, and VTI1A and their effects on HCC cell viability. (a) RT-qPCR analysis was performed at 24 h post-transfection to evaluate knockdown efficiency at the mRNA level. Using GAPDH as an internal control, normalization was performed using 2−ΔΔCᴛ. (b) Western blot analysis was performed at 48 h post-transfection to verify the protein-level silencing of KDELR3, UBE2J1, and VTI1A in HepG2 and Huh7 cells. α-tubulin was used as the loading control. (c) Cell viability was assessed by CCK-8 assay at 48 h post-transfection. Knockdown of KDELR3, UBE2J1, and VTI1A significantly reduced the viability of HCC cells compared with the control group. Data are presented as mean ± SD (n = 3). Statistical significance is indicated as: ns, not significant; * P < 0.05; ** P < 0.01; *** P < 0.001.
-
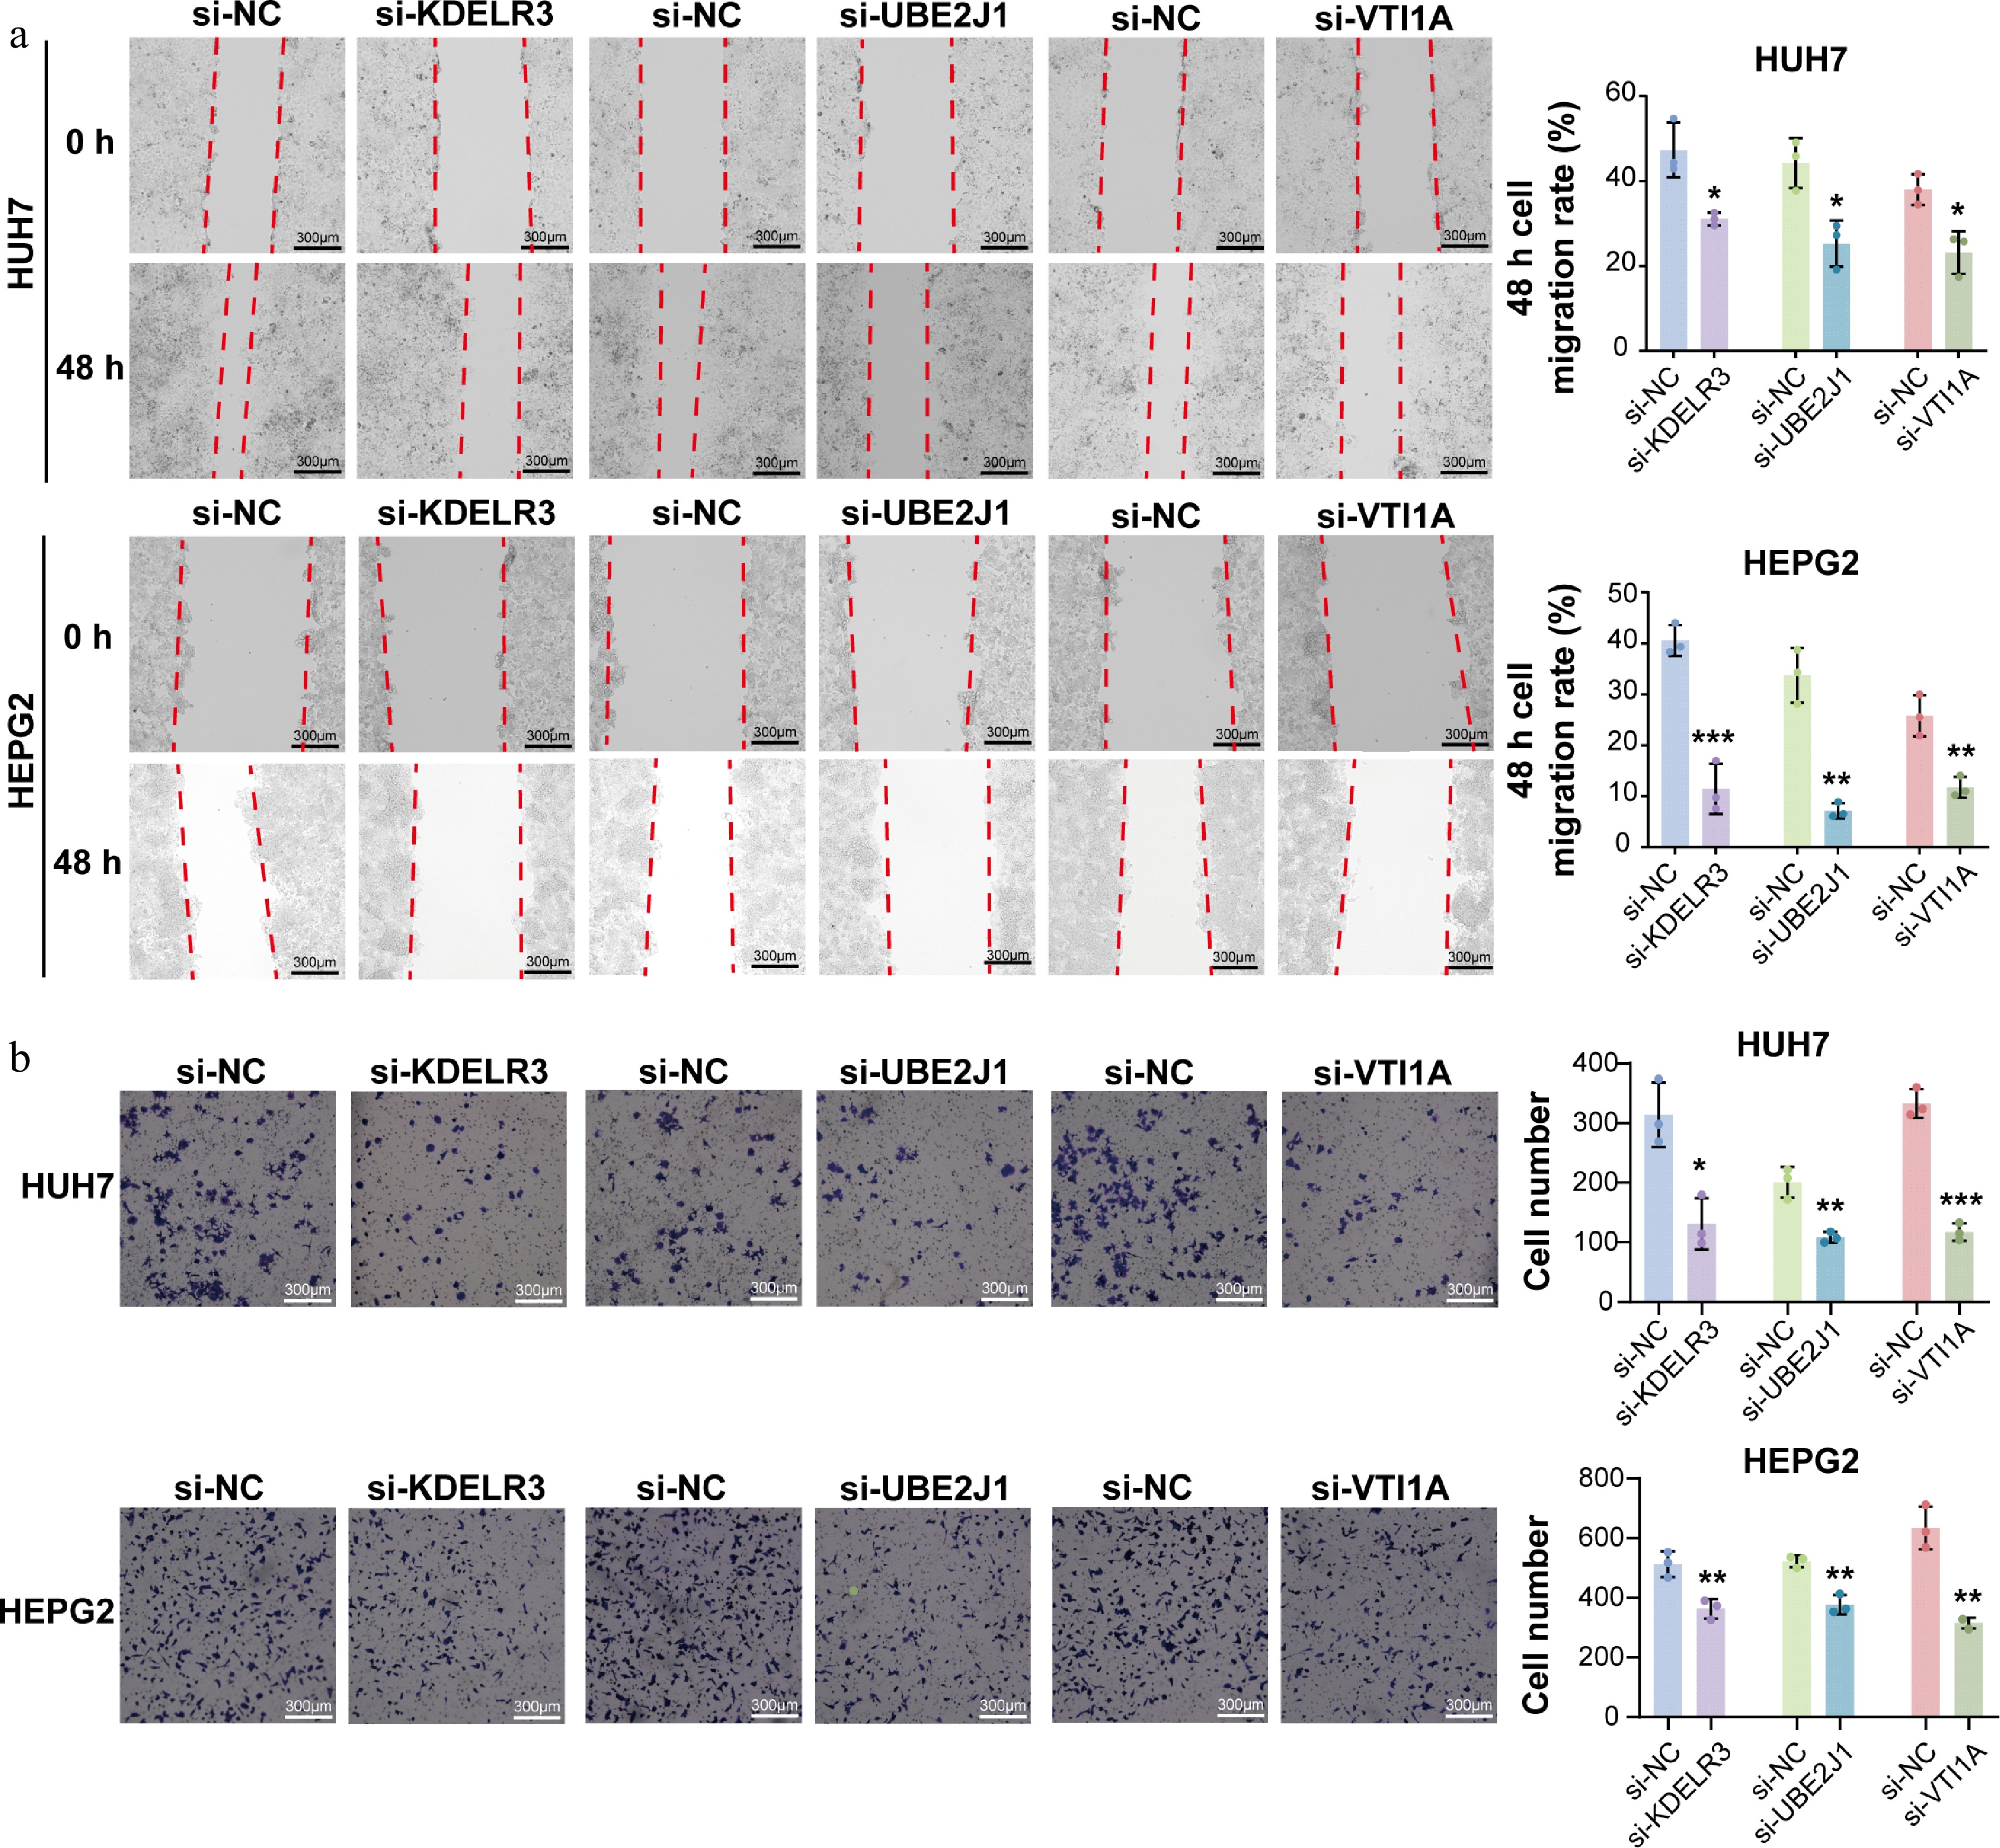
Figure 5.
Knockdown of UBE2J1, KDELR3, and VTI1A suppresses migration and invasion of HCC cells. (a) Wound-healing assays were performed in HepG2 and Huh7 cells transfected with siRNAs targeting KDELR3, UBE2J1, or VTI1A. Knockdown of each target gene markedly inhibited the migratory ability of both cell lines compared with the corresponding si-NC group. (b) Transwell invasion assays were performed to evaluate the invasive capacity of HepG2 and Huh7 cells after gene silencing. Knockdown of KDELR3, UBE2J1, or VTI1A significantly reduced the invasive ability of both cell lines. Data are presented as mean ± SD (n = 3). Statistical significance is indicated as: ns, not significant; * P < 0.05; ** P < 0.01; *** P < 0.001.
-
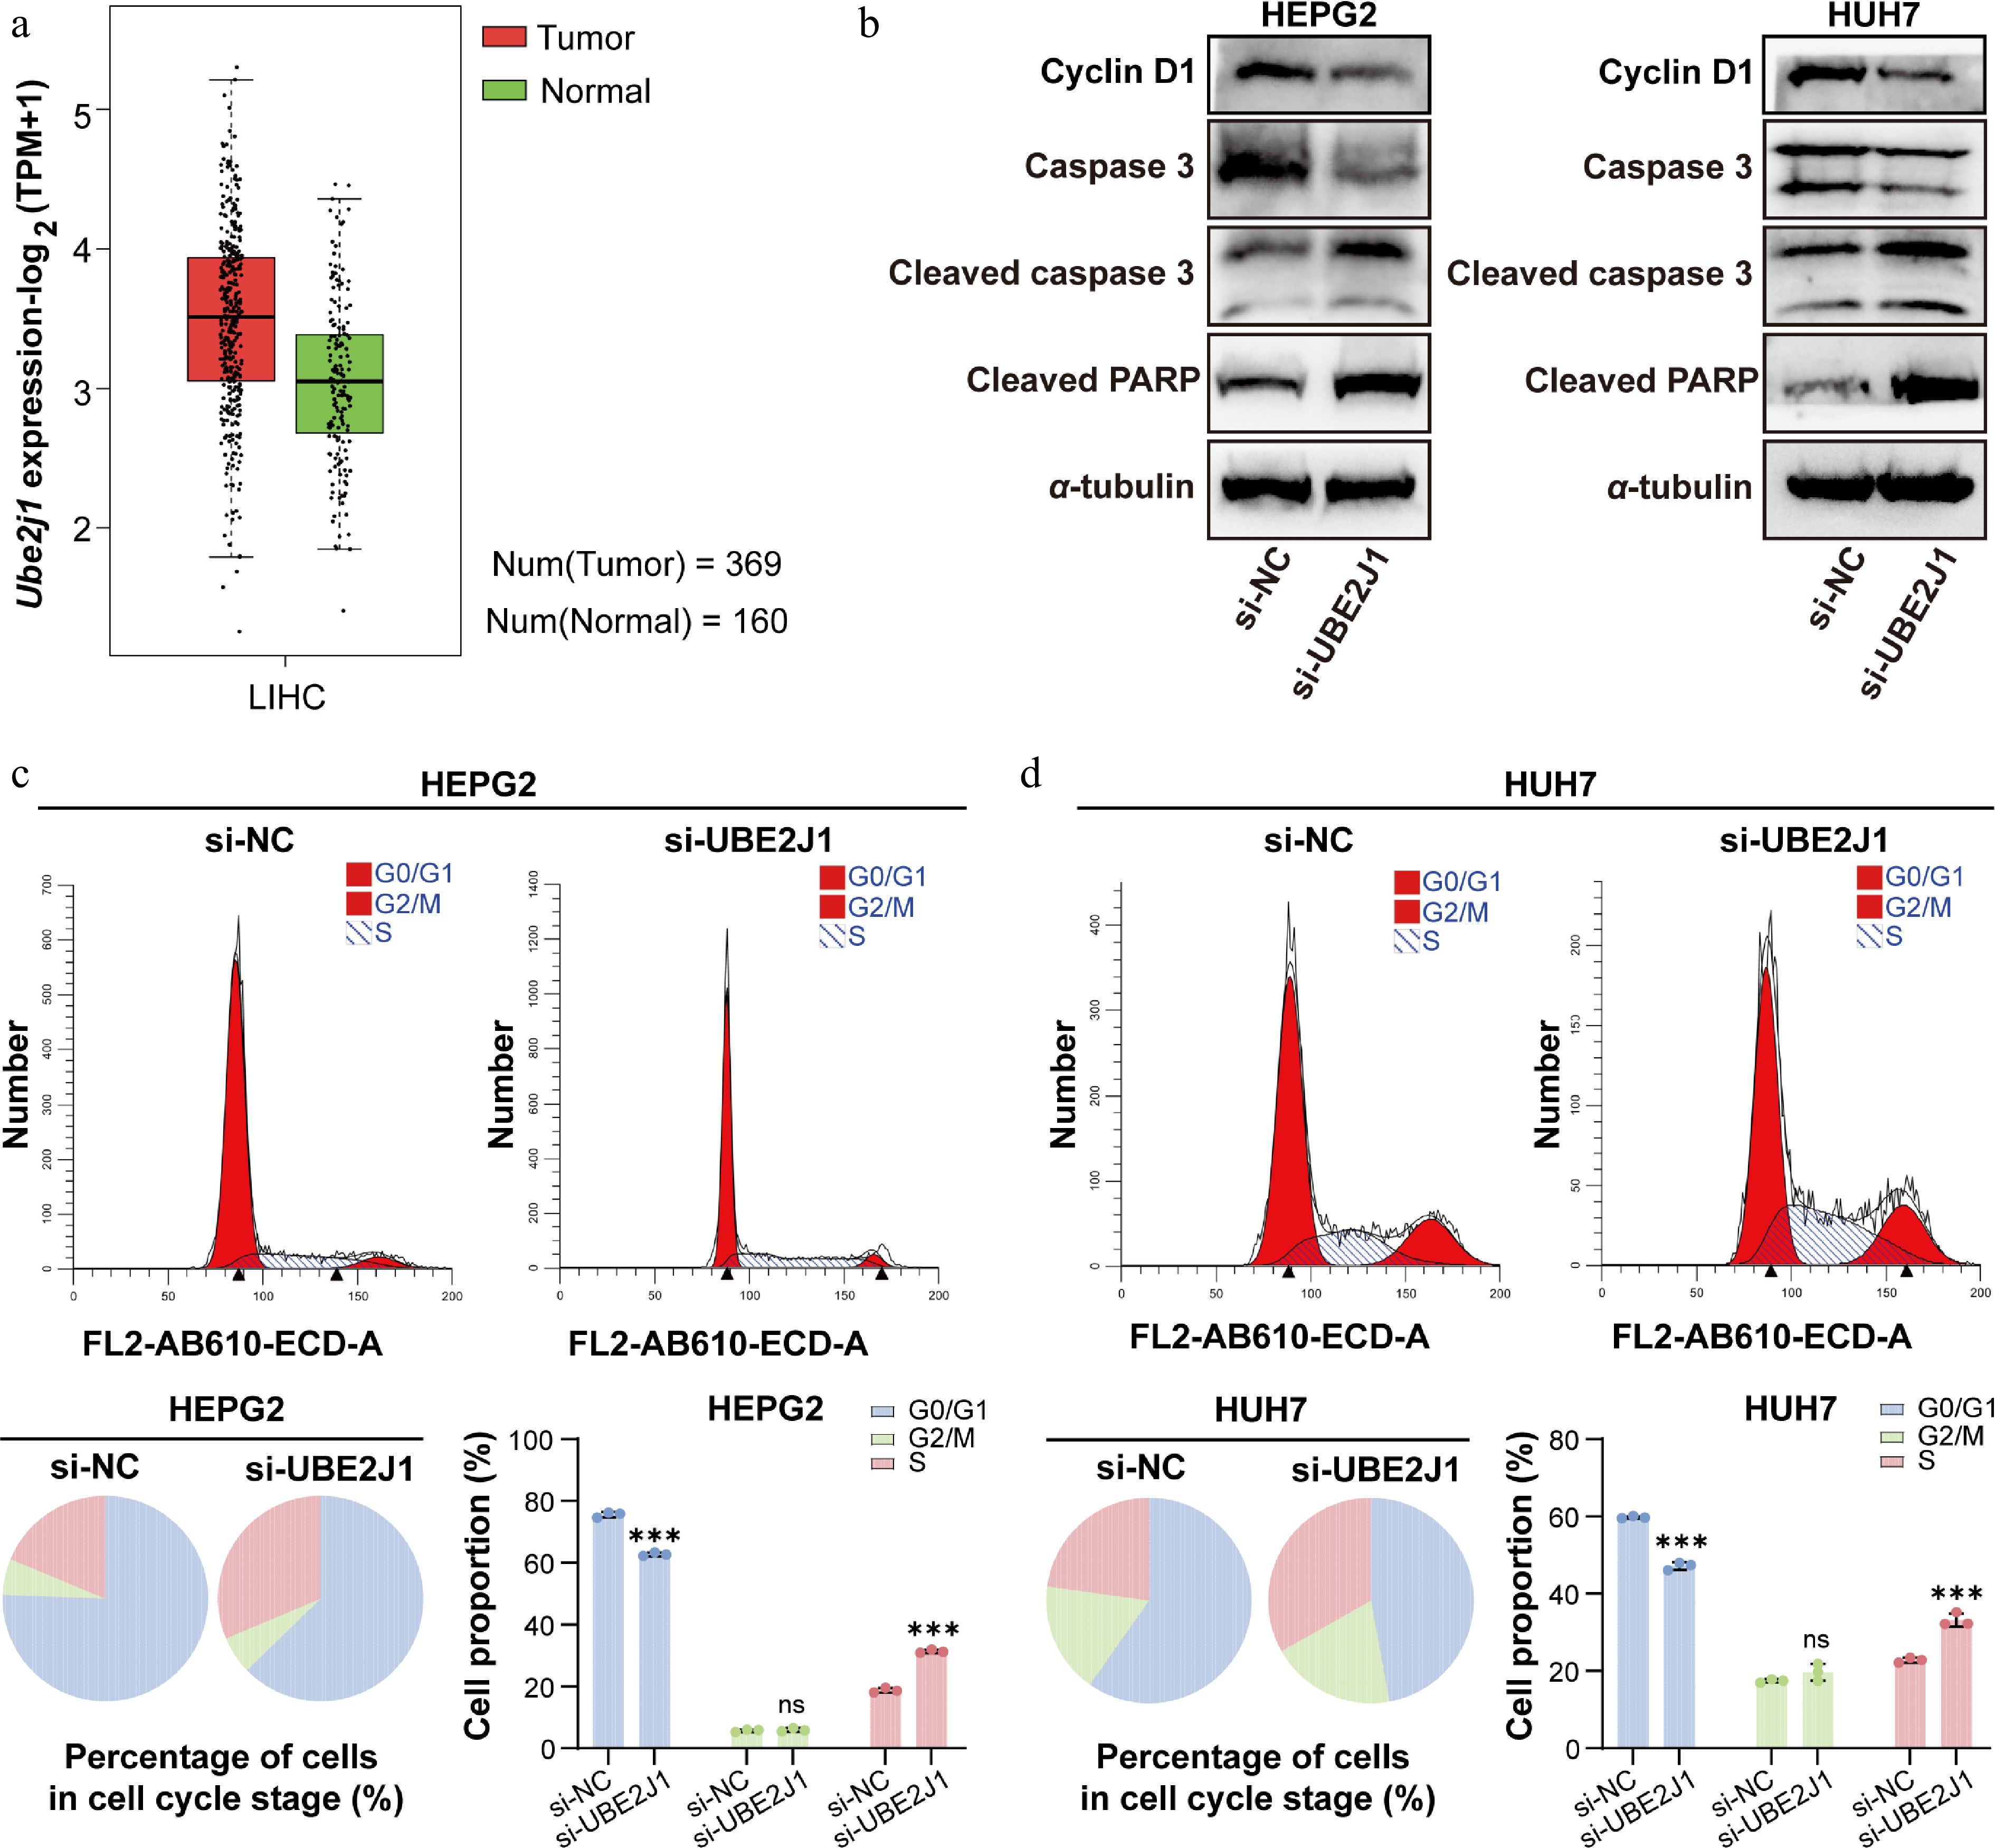
Figure 6.
Clinical relevance analysis of UBE2J1 expression, and the impact of UBE2J1 knockdown on HCC cells as assessed by Western blot and flow cytometry. (a) UBE2J1 expression in LIHC tumor and normal tissues based on public database analysis. (b) Western blot analysis of Cyclin D1, Caspase 3, Cleaved caspase 3, and Cleaved PARP in HepG2 and Huh7 cells transfected with si-NC or si-UBE2J1. α-tubulin was used as a loading control. Flow cytometric analysis of cell-cycle distribution in (c) HepG2, and (d) Huh7 cells after UBE2J1 silencing. Representative histograms, pie charts, and quantification of cells in G0/G1, S, and G2/M phases are shown. Data are presented as mean ± SD (n = 3). Statistical significance is indicated as: ns, not significant; *** P < 0.001.
-
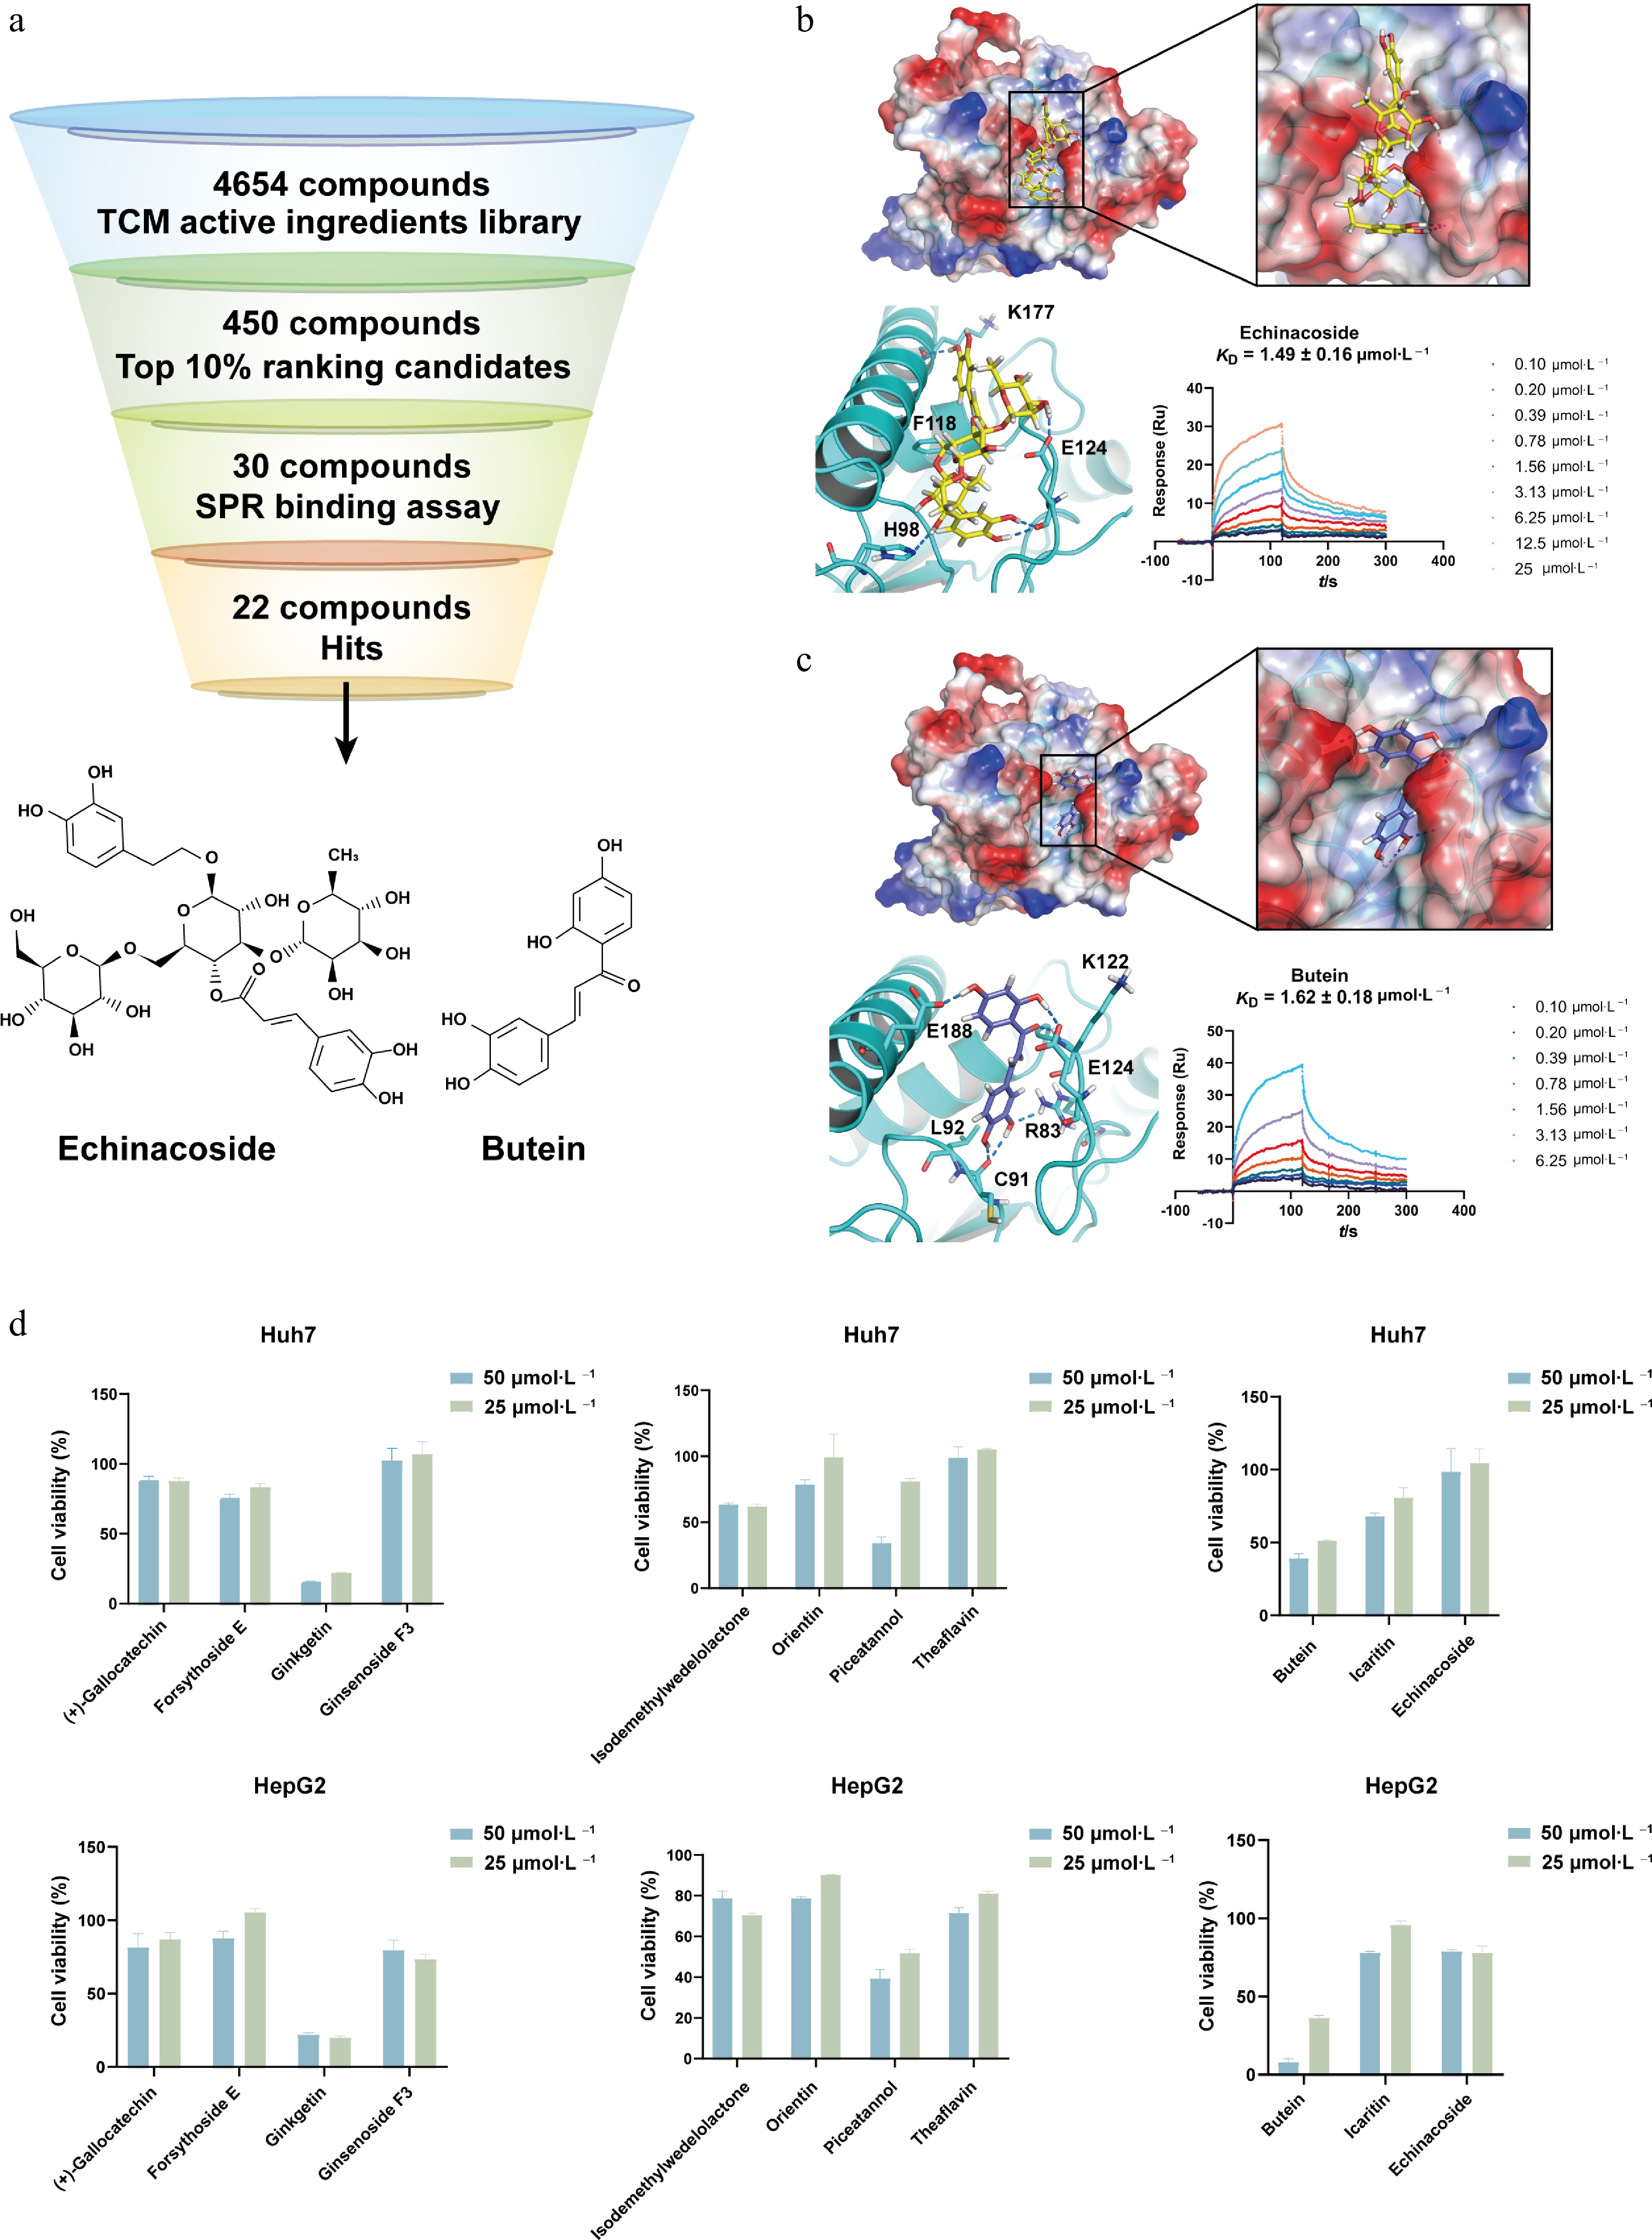
Figure 7.
Virtual screening and cellular activity assessment of UBE2J1-binding compounds. (a) Workflow for compounds virtual screening targeting UBE2J1. A total of 4,654 TCM compounds from a library were used for virtual screening. Top-ranking 10% candidates (about 450 compounds) were selected, and further screening by chemical structure diversity yielded 30 candidates for SPR binding detection. Finally, 22 compounds were identified as hits, exhibiting detectable direct binding to the UBE2J1 protein. The chemical structures of the compounds with the most potent binding affinities, Echinacoside and Butein, are shown below the workflow diagram. Molecular docking and SPR binding detection of Echinacoside and Butein. Electrostatic surface representations show the predicted binding pockets of UBE2J1 with (b) Echinacoside, and (c) Butein, respectively. Zoomed views illustrate predicted binding modes of Echinacoside and Butein, respectively. The measured KD values by SPR are 1.49 ± 0.16 μmol·L−1 for Echinacoside, and 1.62 ± 0.18 μmol·L−1 for Butein, respectively. (d) Measurement of the cell inhibition effect of UBE2J1 binding compound on the proliferation of Huh7 and HepG2 cells. The data are expressed as mean ± standard deviation (n = 3).
Figures
(7)
Tables
(0)