-
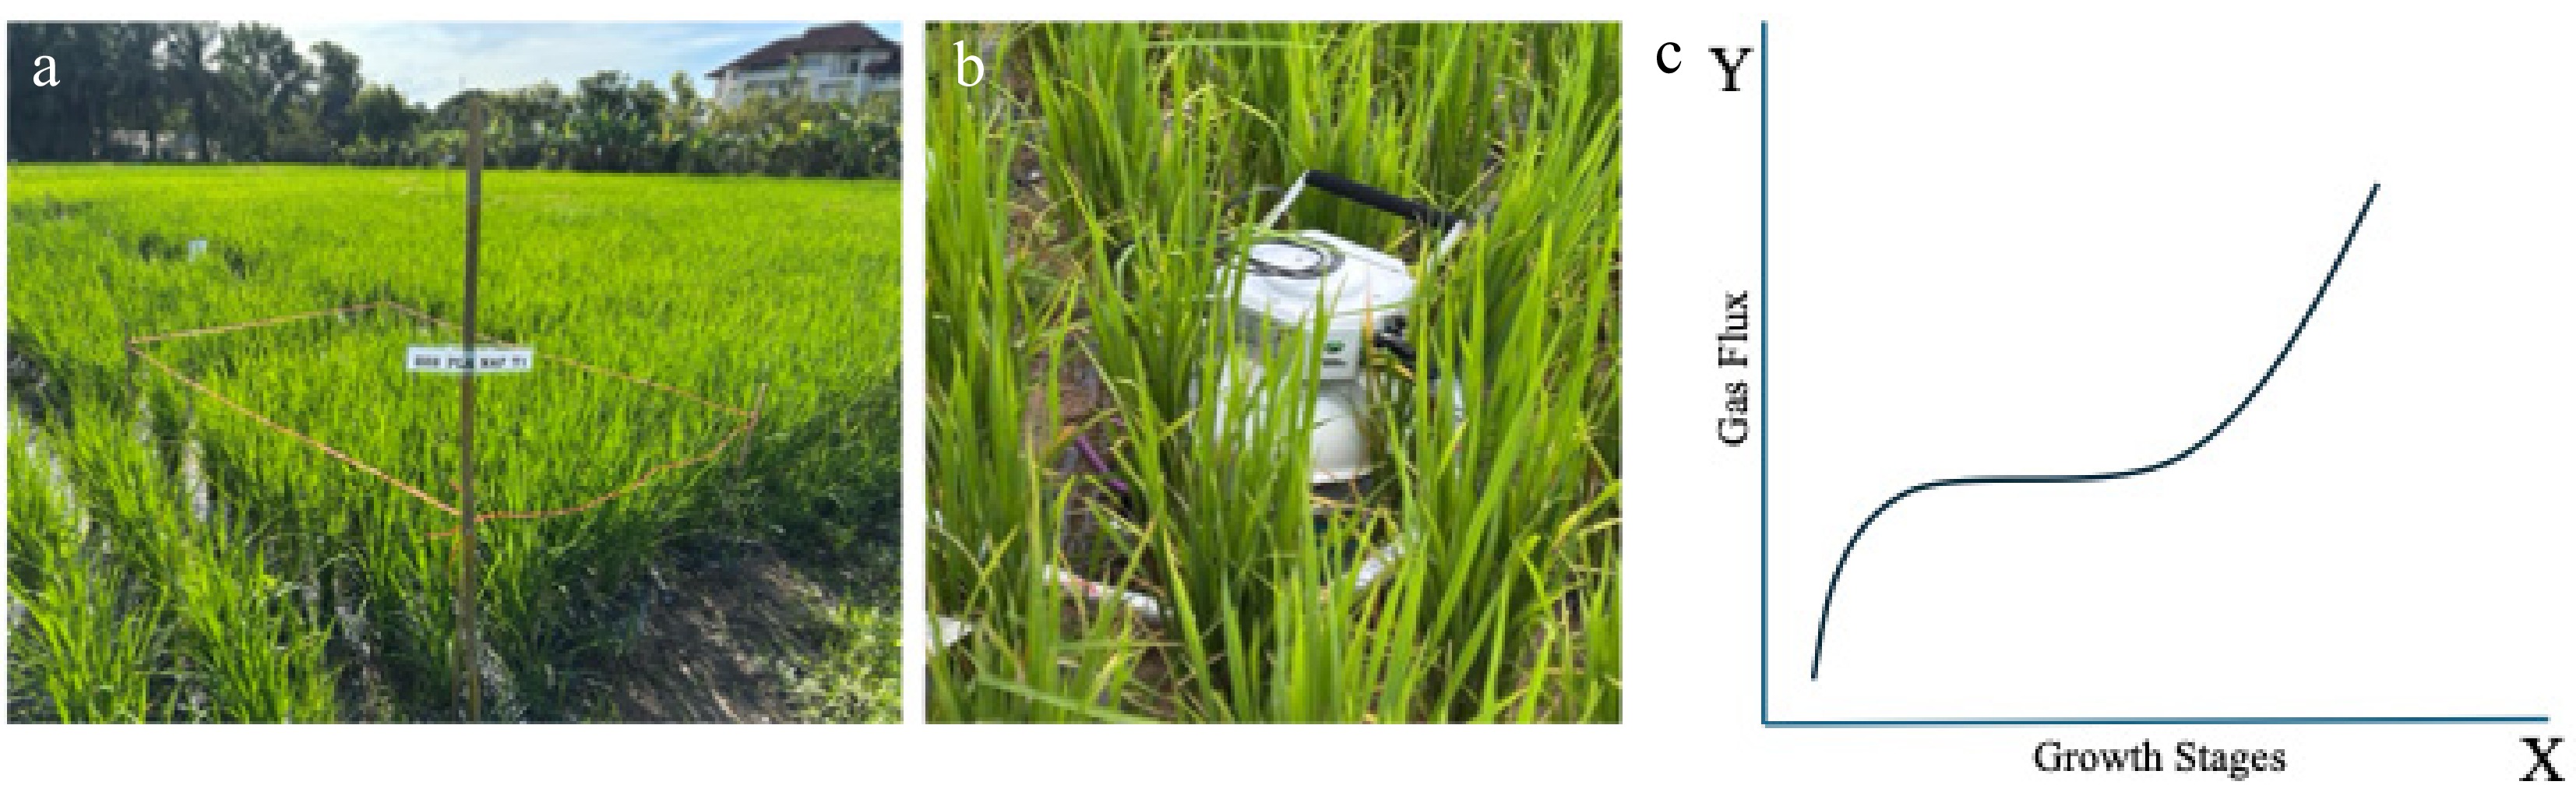
Figure 1.
Workflow illustrating greenhouse gas intensity (GHGI) data collection and calculation. (a) Experimental rice field showing plot layout used for greenhouse gas measurements, (b) static chamber system used for in situ measurement of CH4 and CO2 fluxes, and (c) temporal integration of stage-specific CH4 and CO2 fluxes.
-
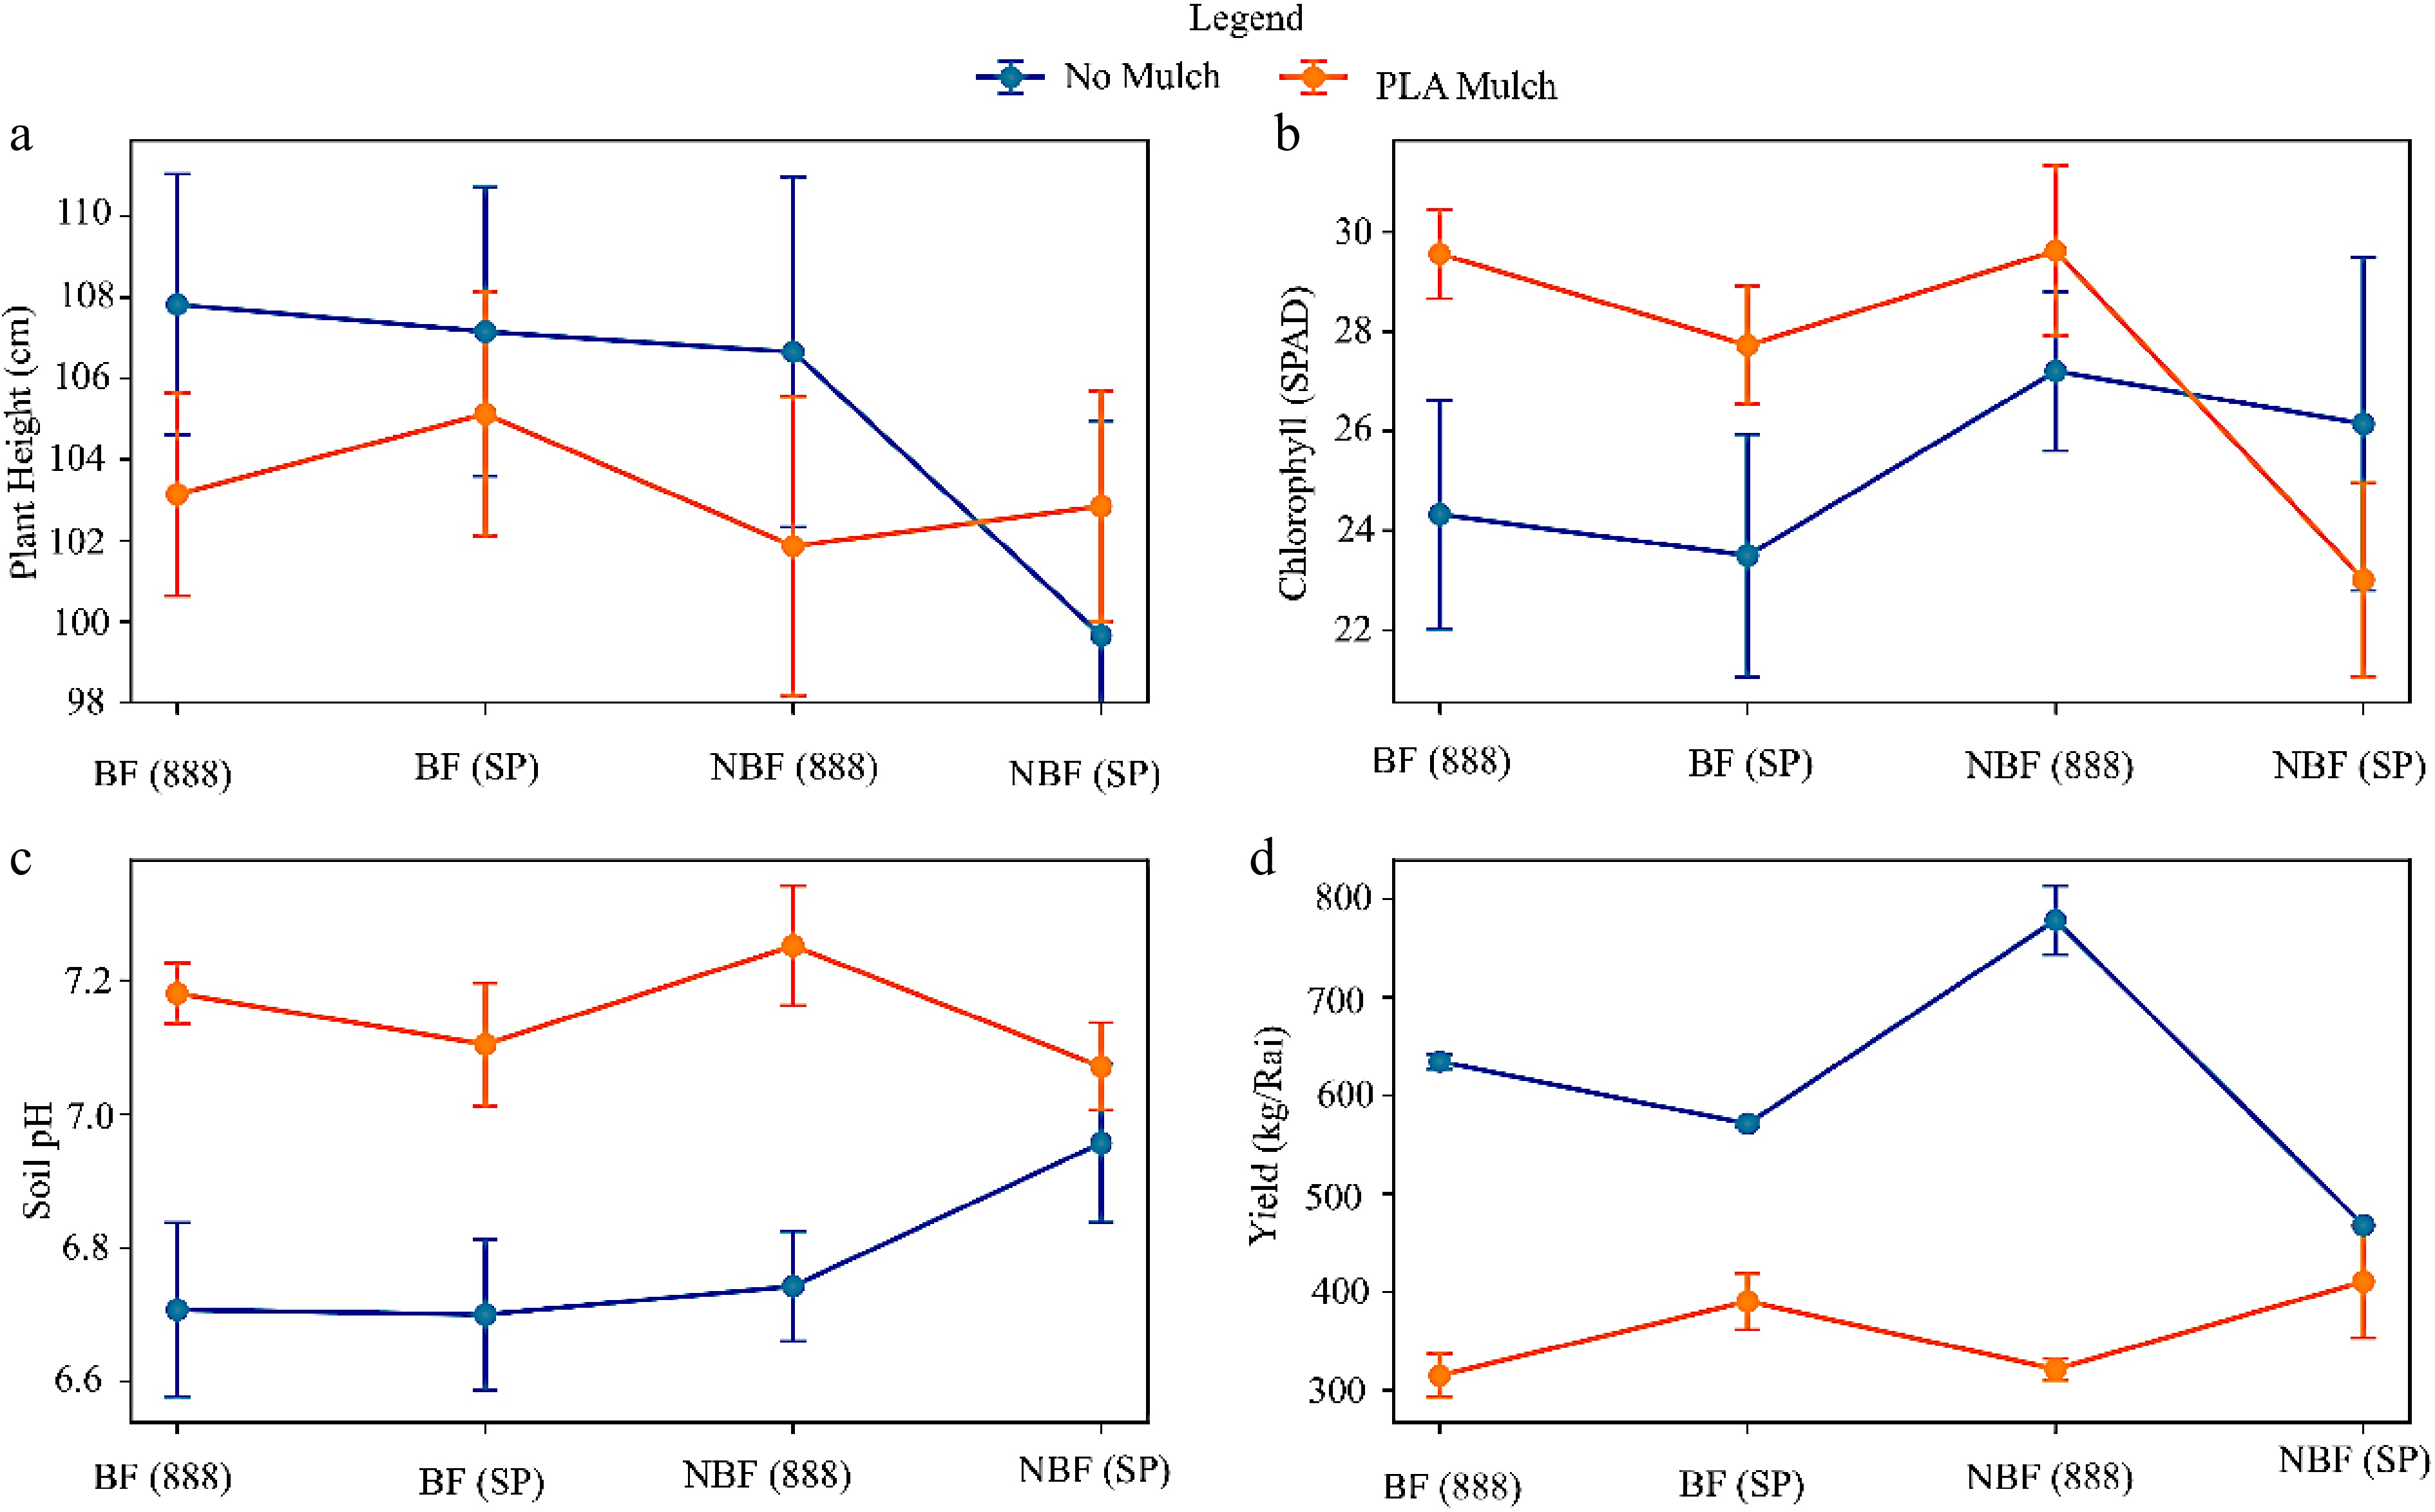
Figure 2.
Interaction plot. *** BF: Bio-fertilizer; NBF: No bio-fertilizer, (a) plant height, (b) chlorophyll (SPAD), (c) soil pH, and (d) yield.
-
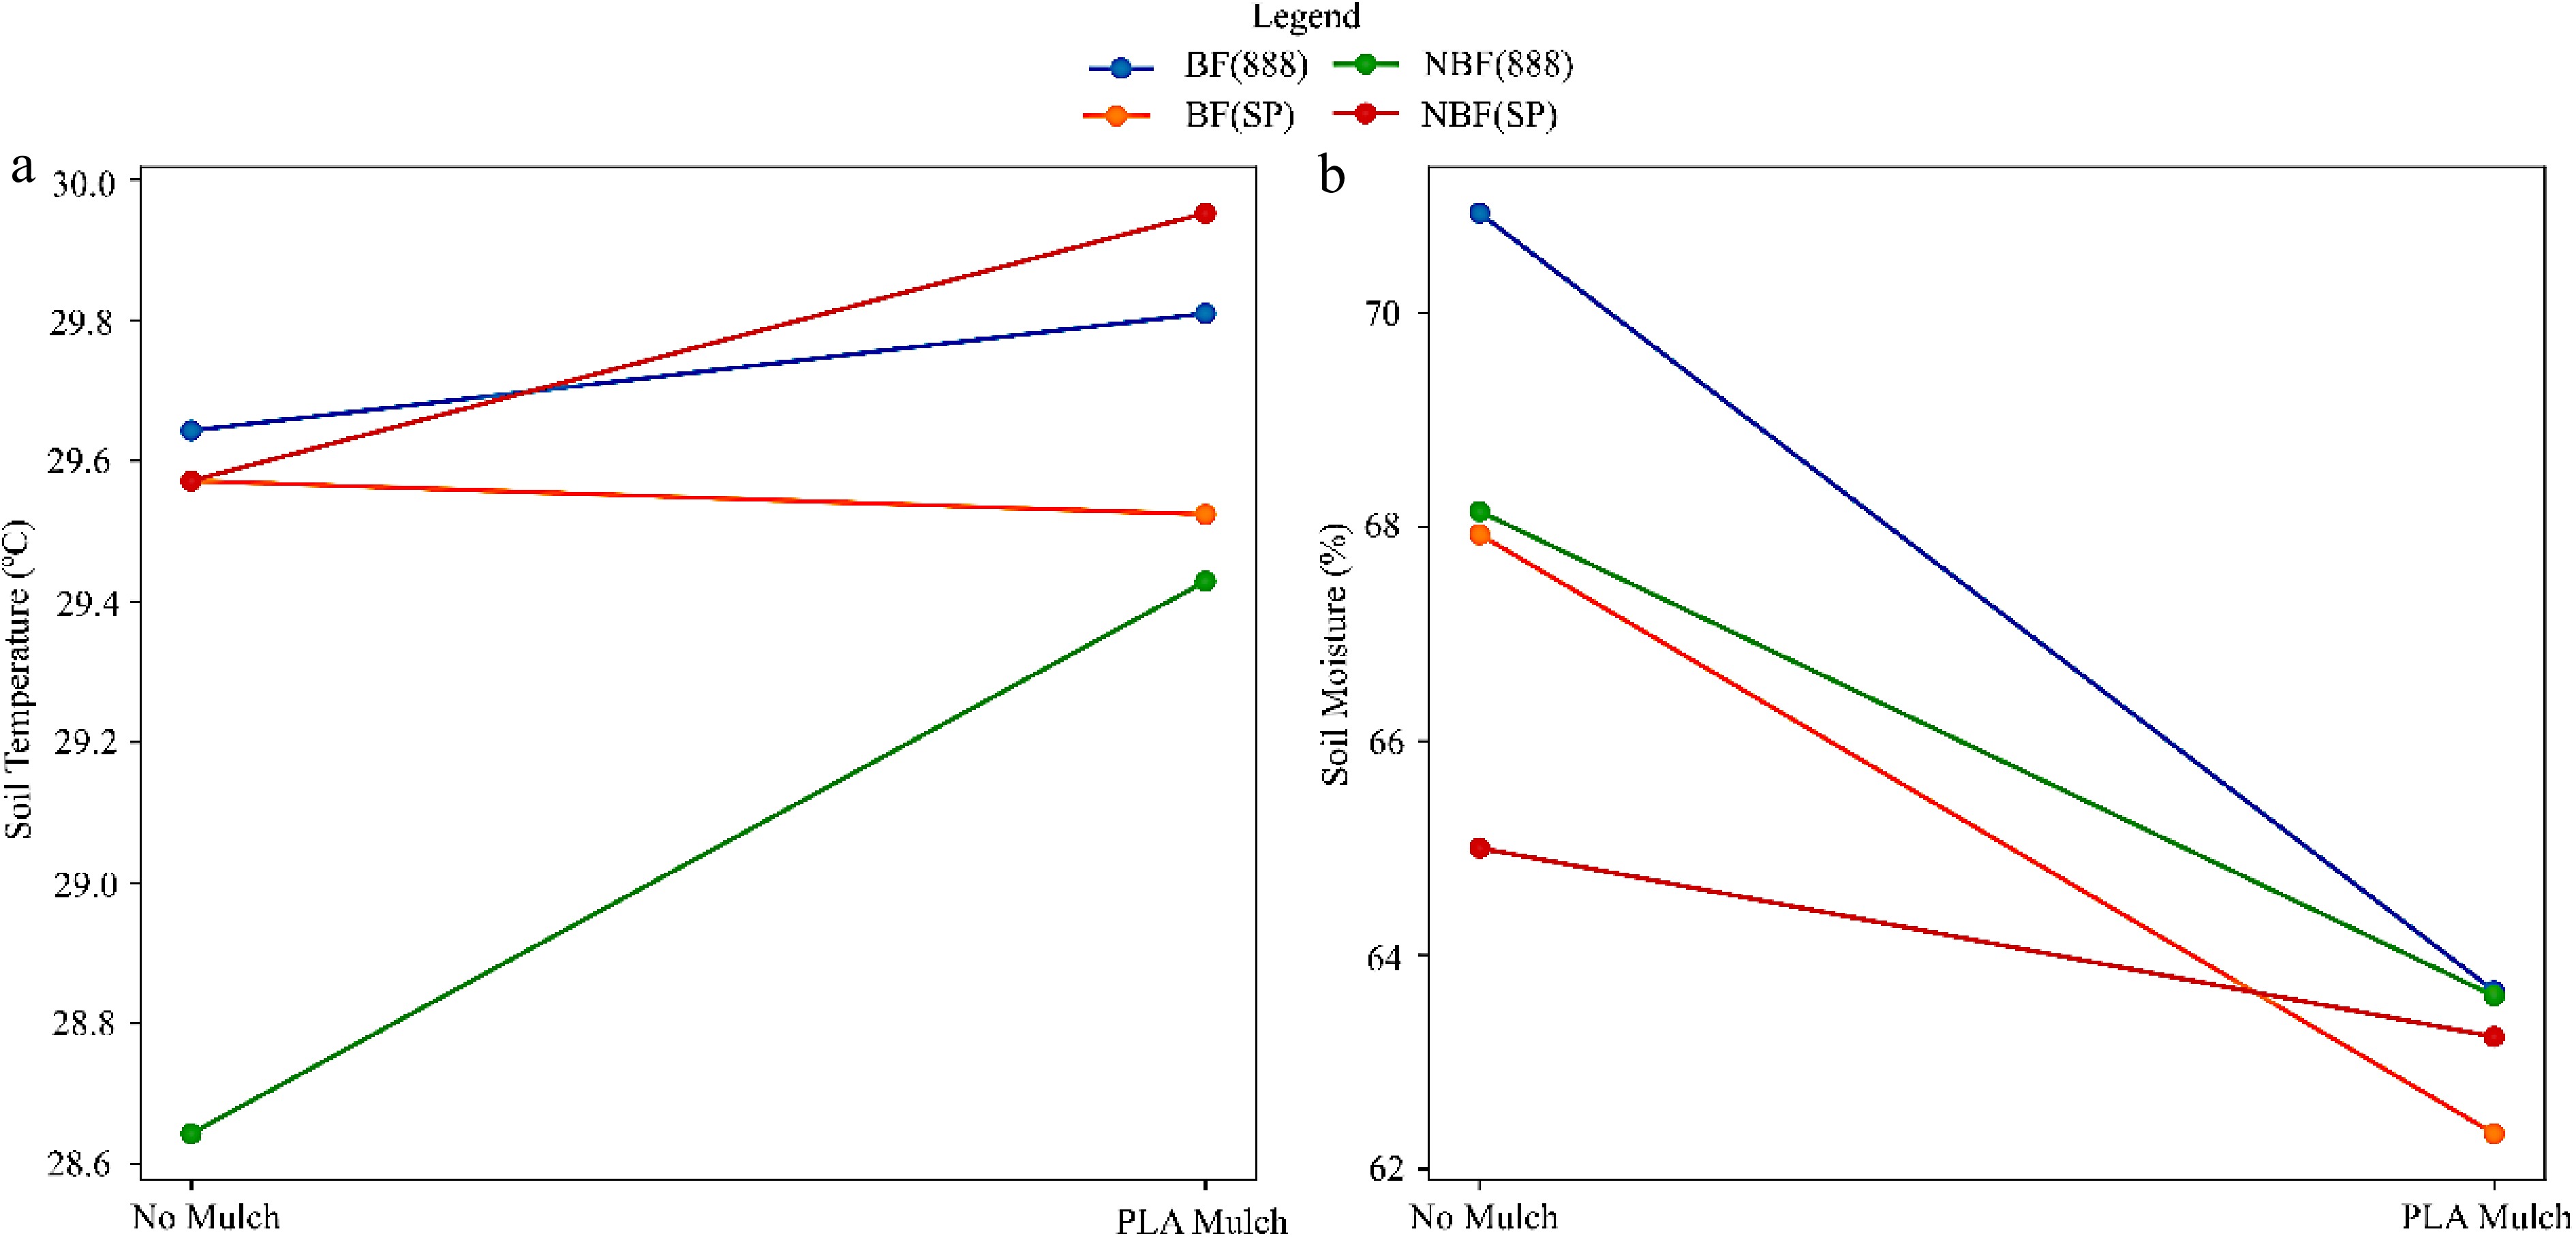
Figure 3.
Slope graph showing changes from No mulch to PLA mulch for (a) soil temperature and (b) moisture.
-
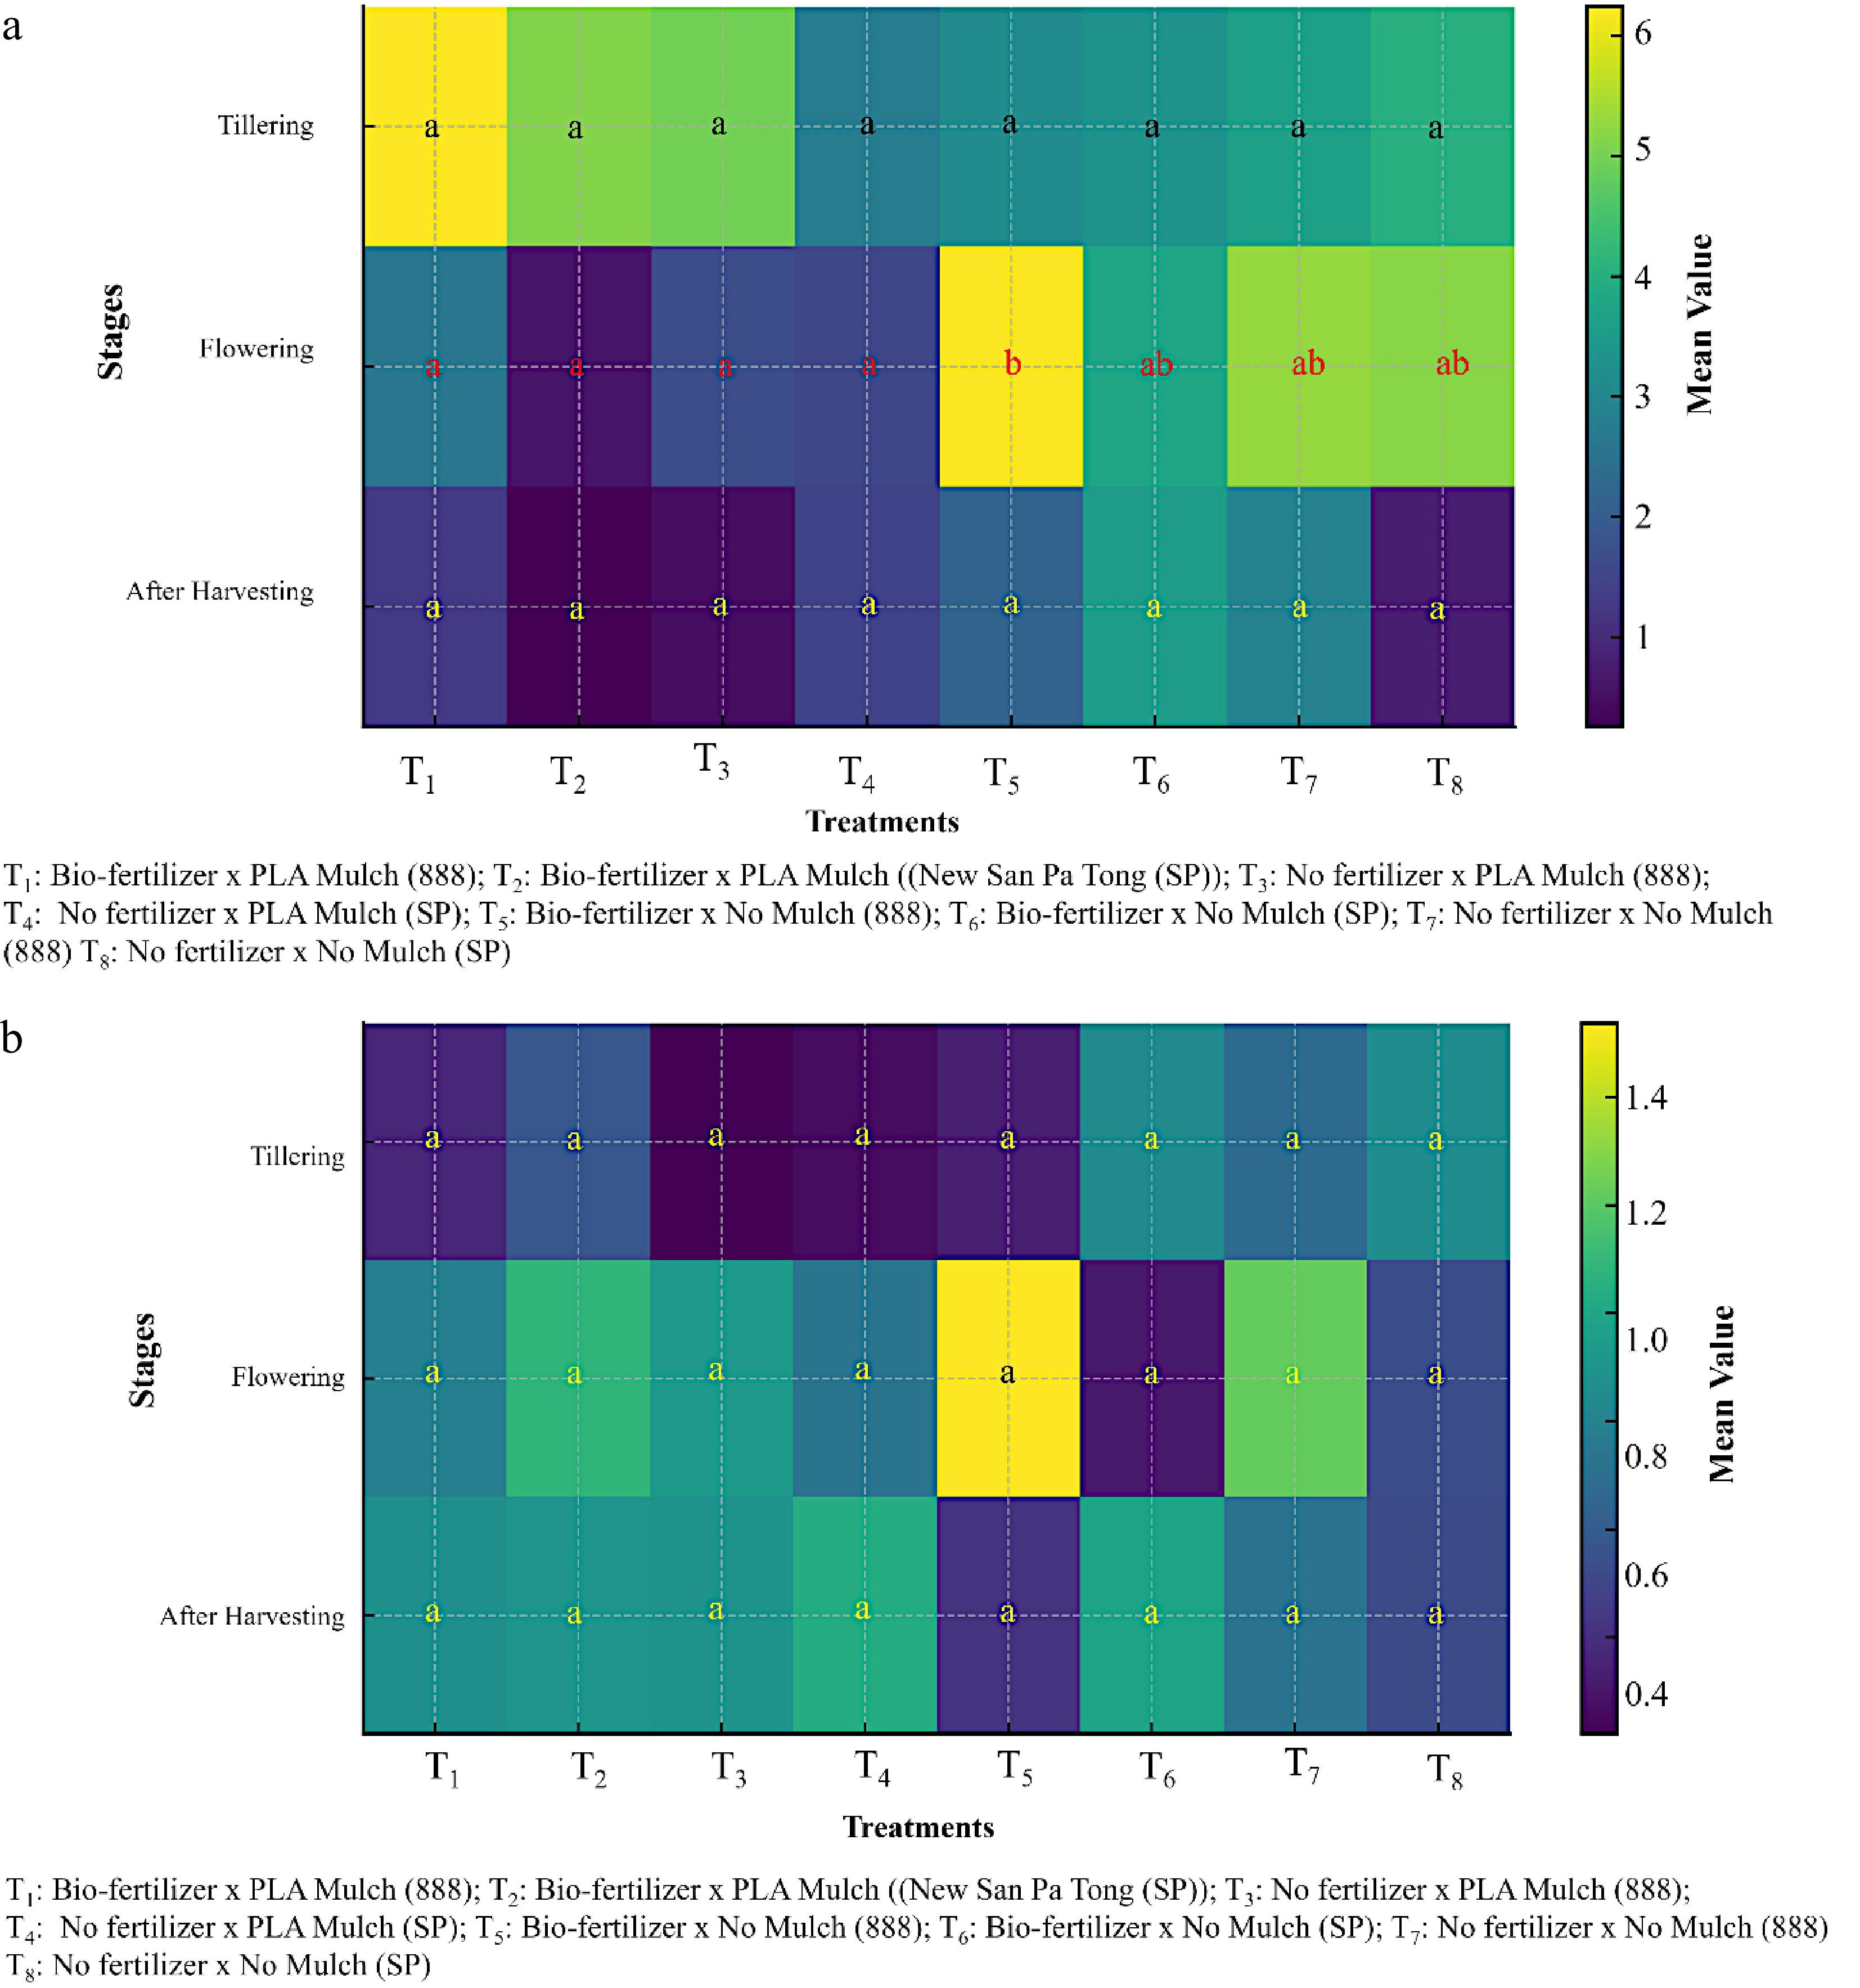
Figure 4.
(a) Illustrates methane (CH4) emission dynamics across treatments and growth stage, and (b) presents carbon dioxide (CO2) emissions, which displayed comparatively more uniform but still stage-related patterns across treatments.
-
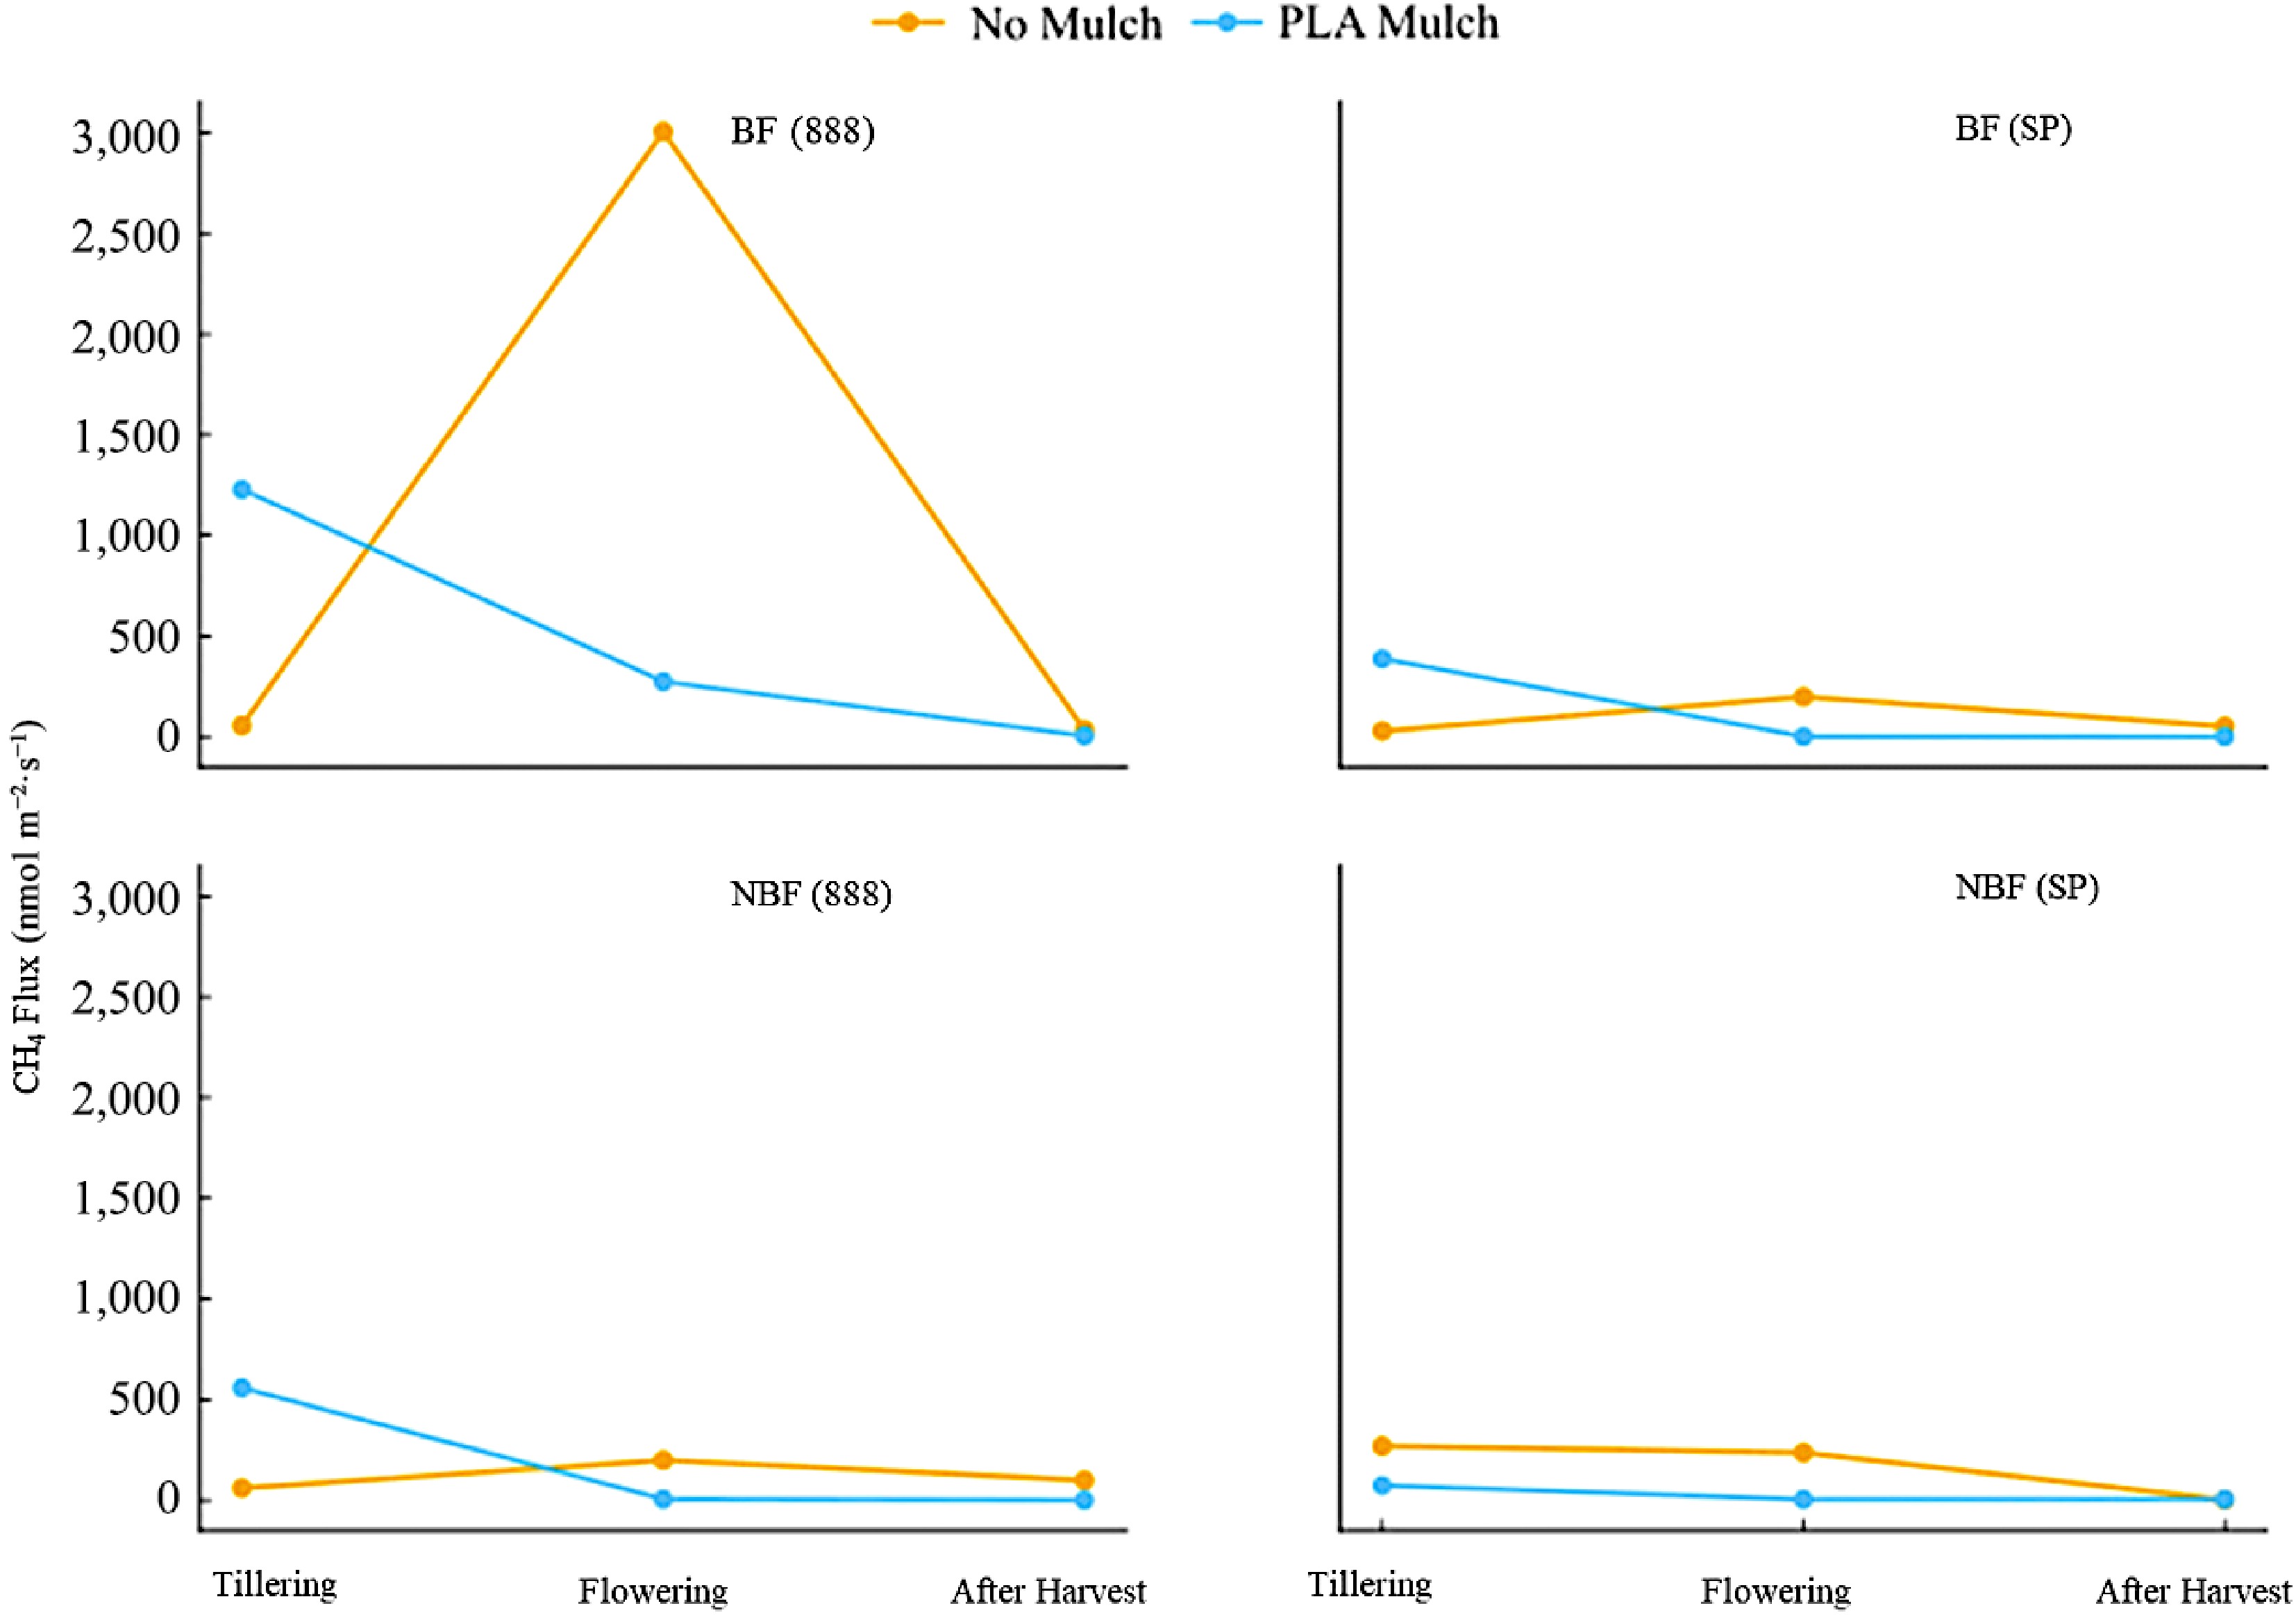
Figure 5.
Methane (CH4) emissions across growth stages under mulch treatments, faceted by fertilizer × variety.
-
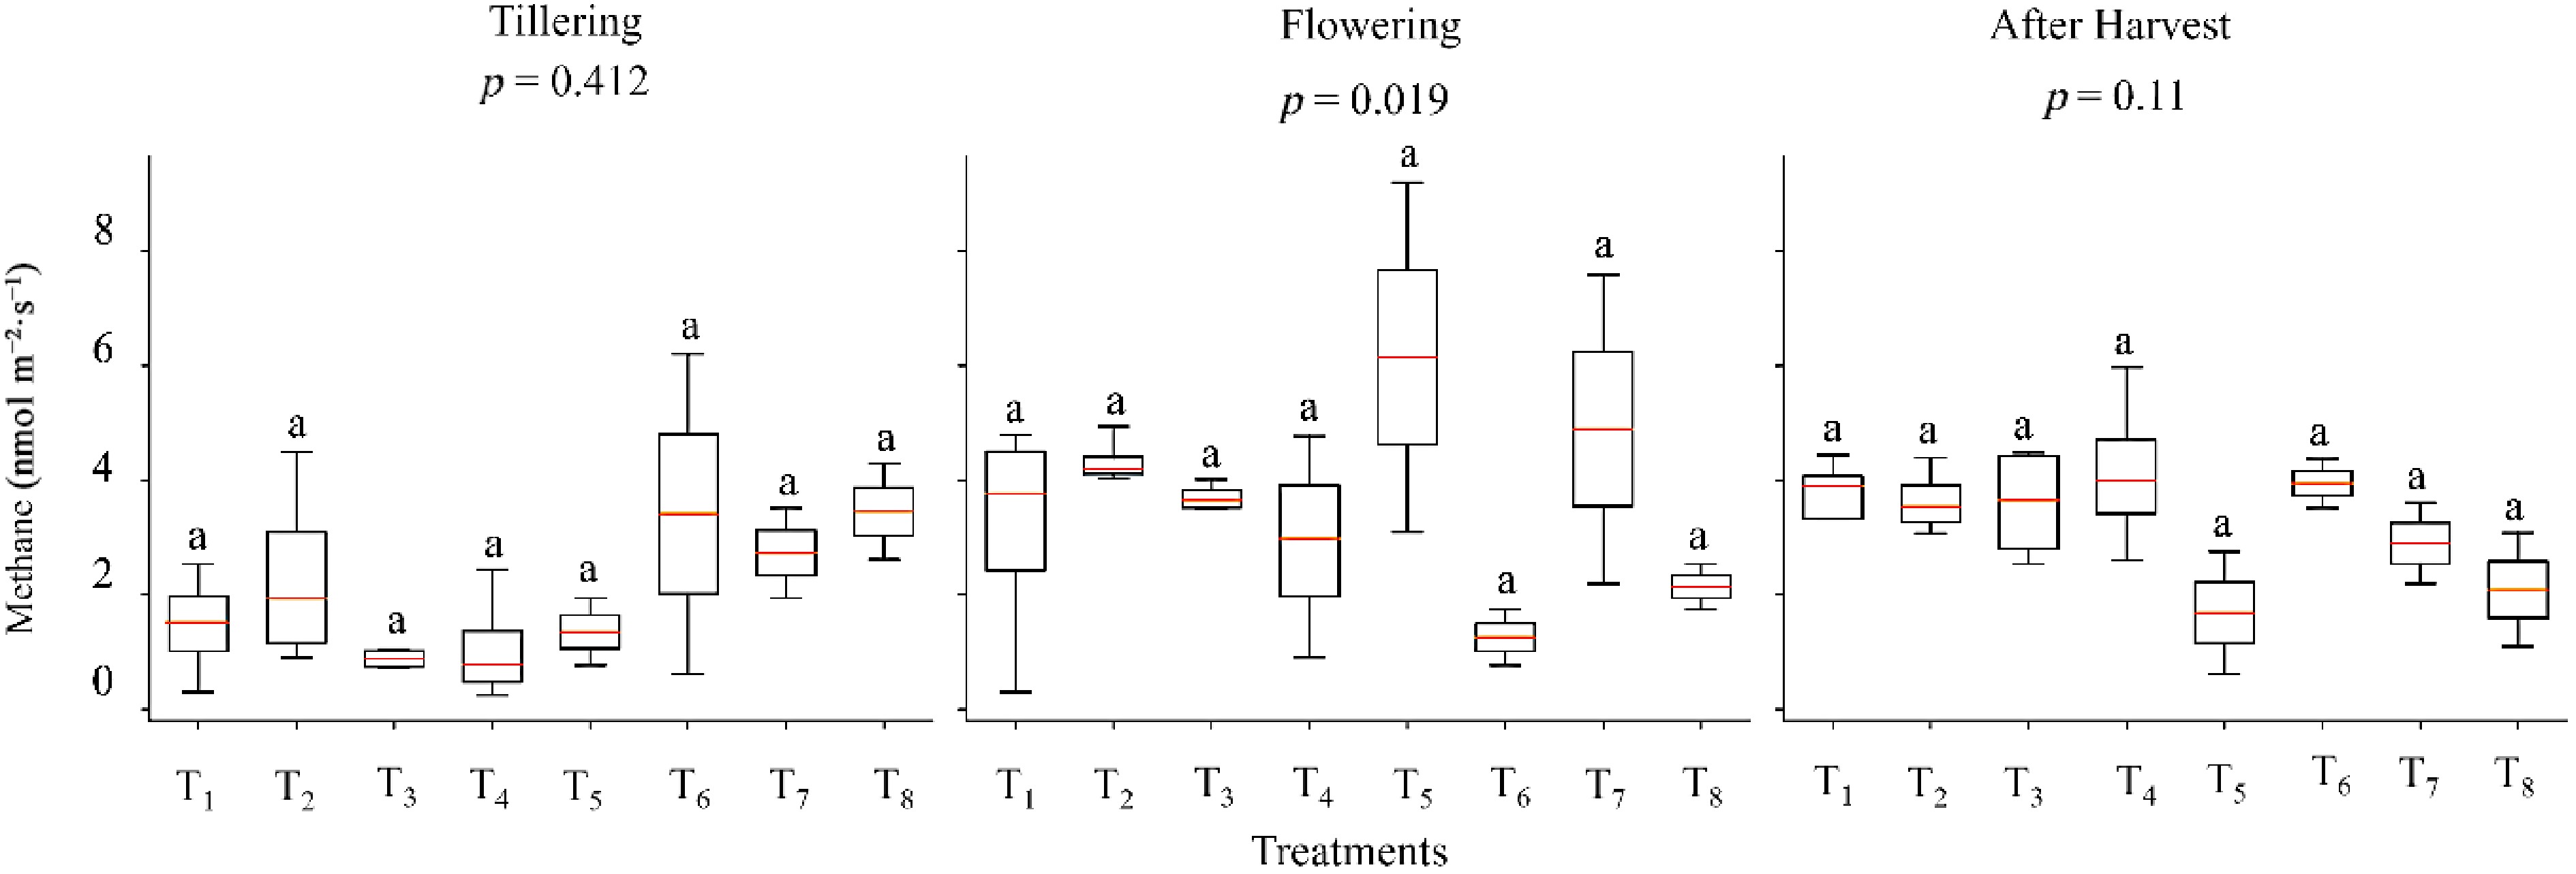
Figure 6.
CH4 emission distributions across growth stages × treatment combinations.
-
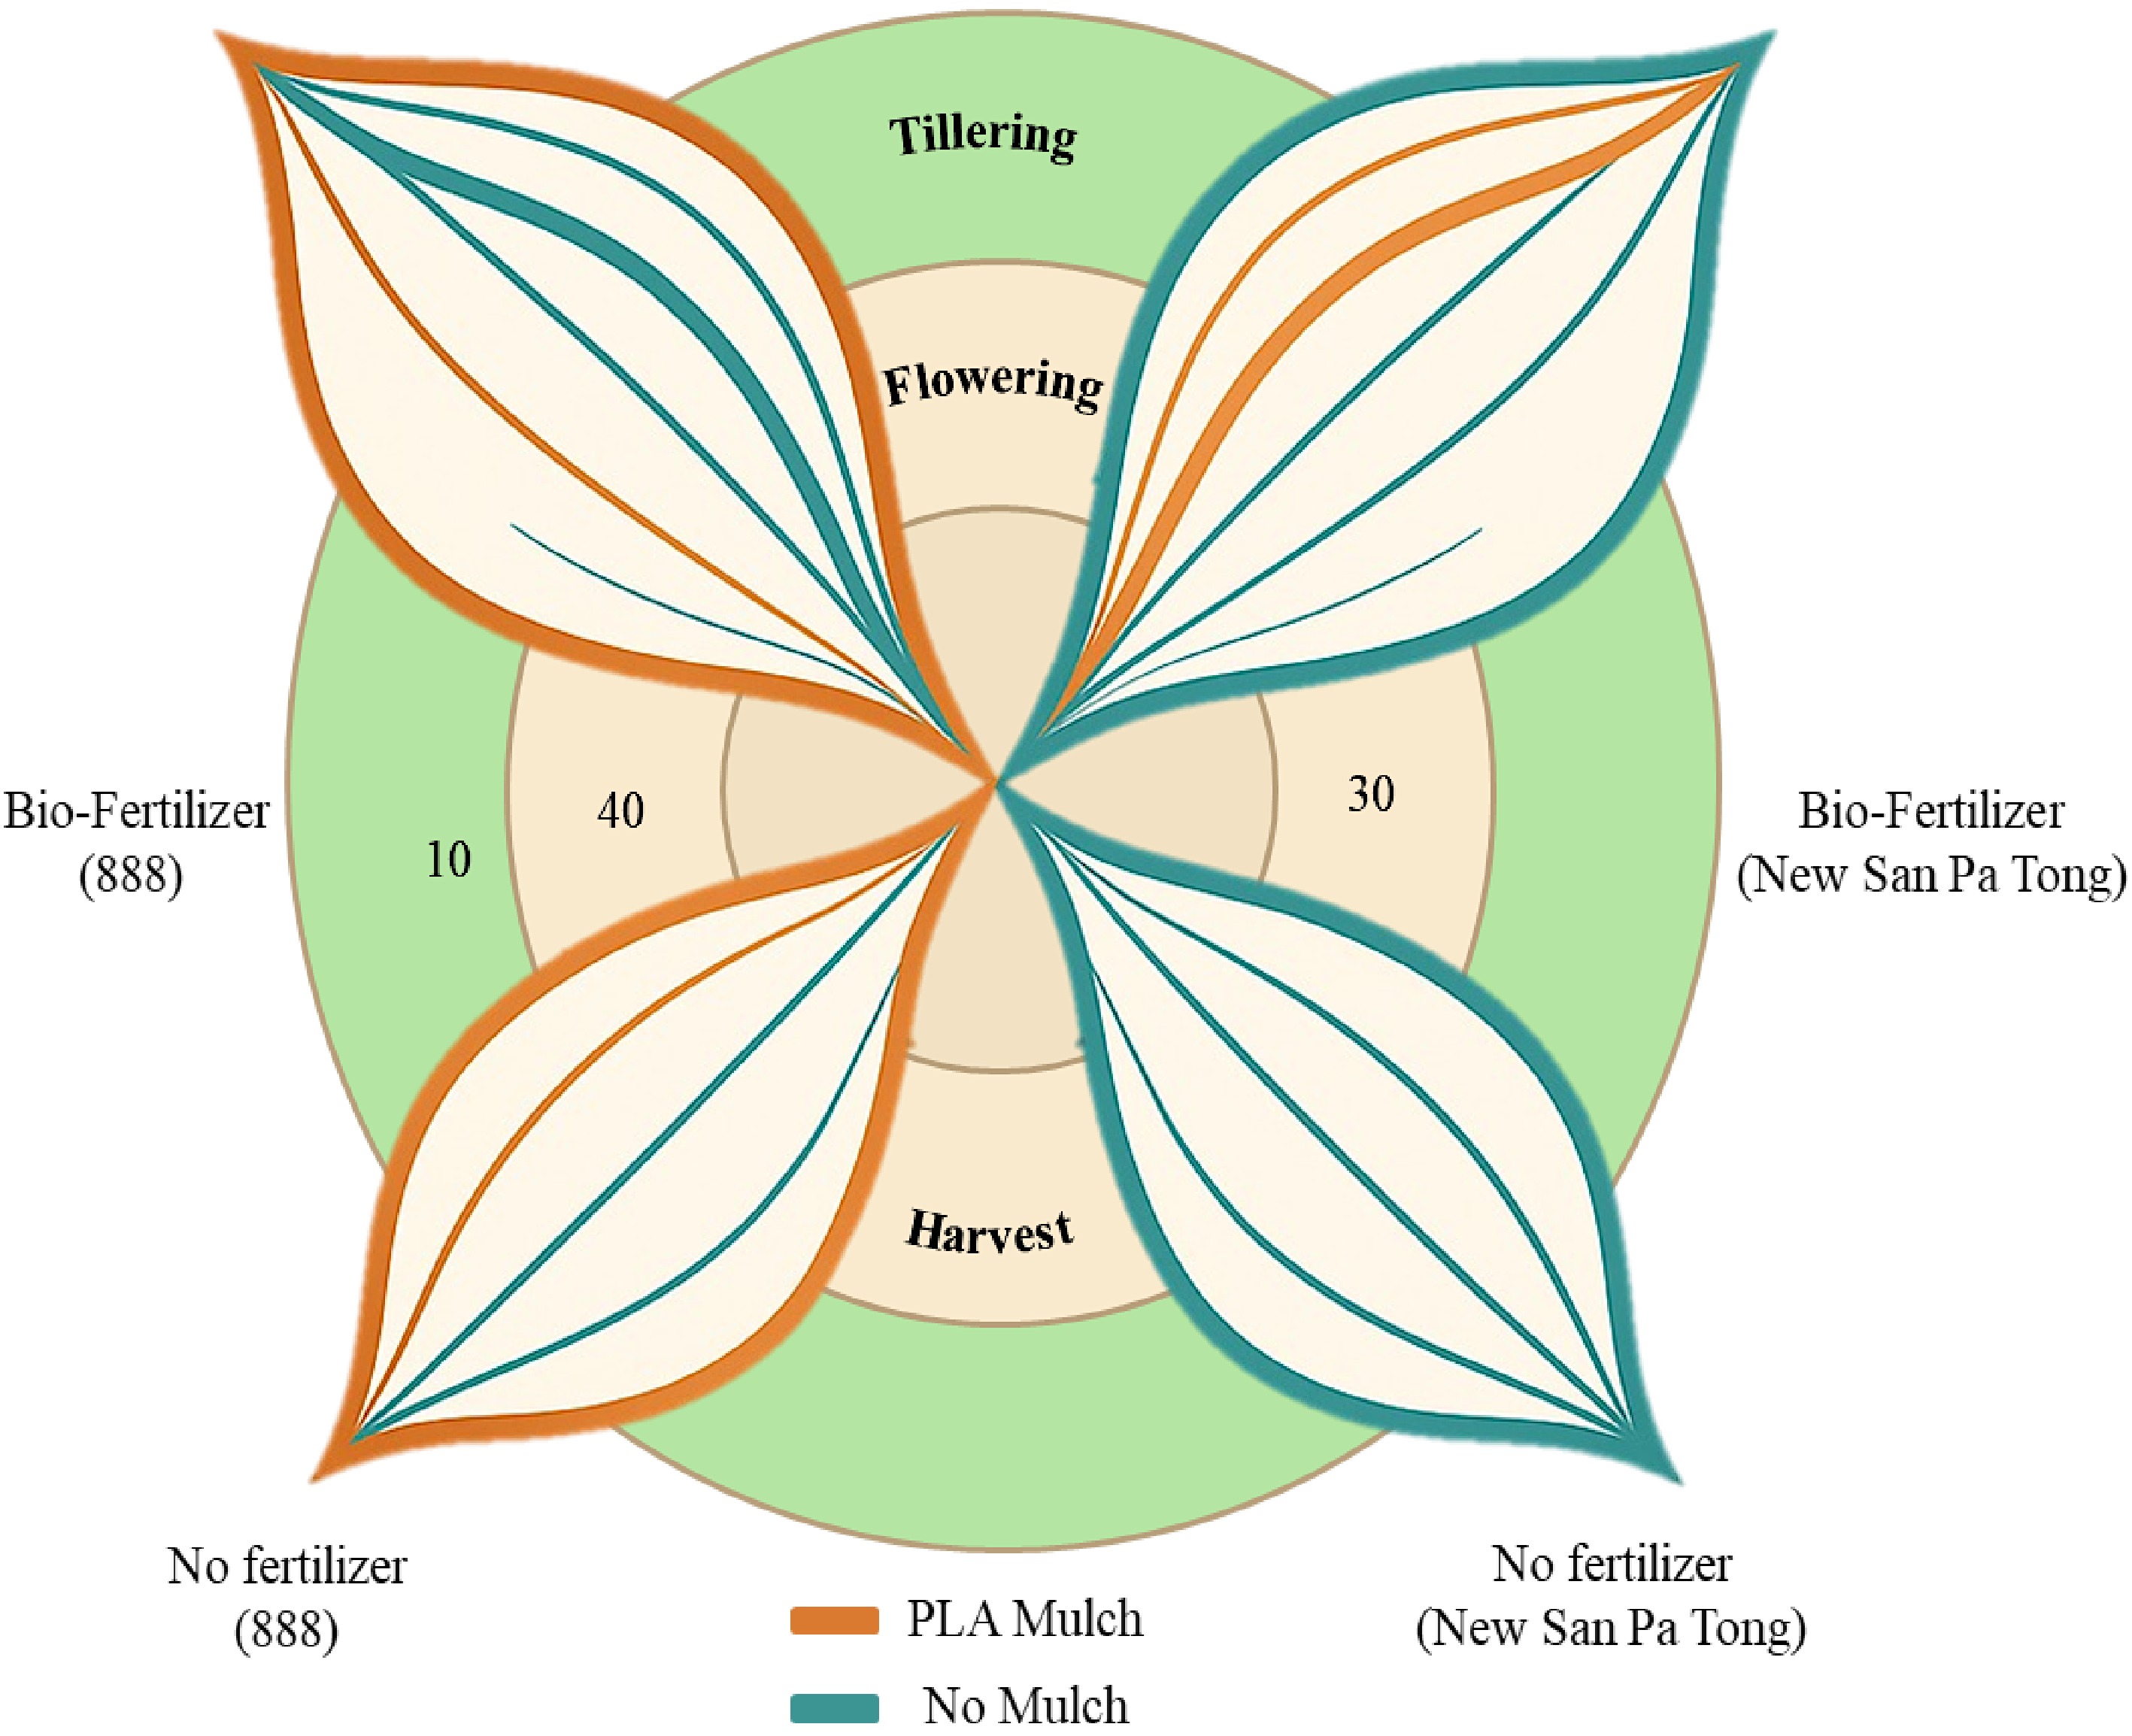
Figure 7.
Conceptual visualization of methane emission dynamics across rice growth stages under PLA mulch and No mulch conditions.
-
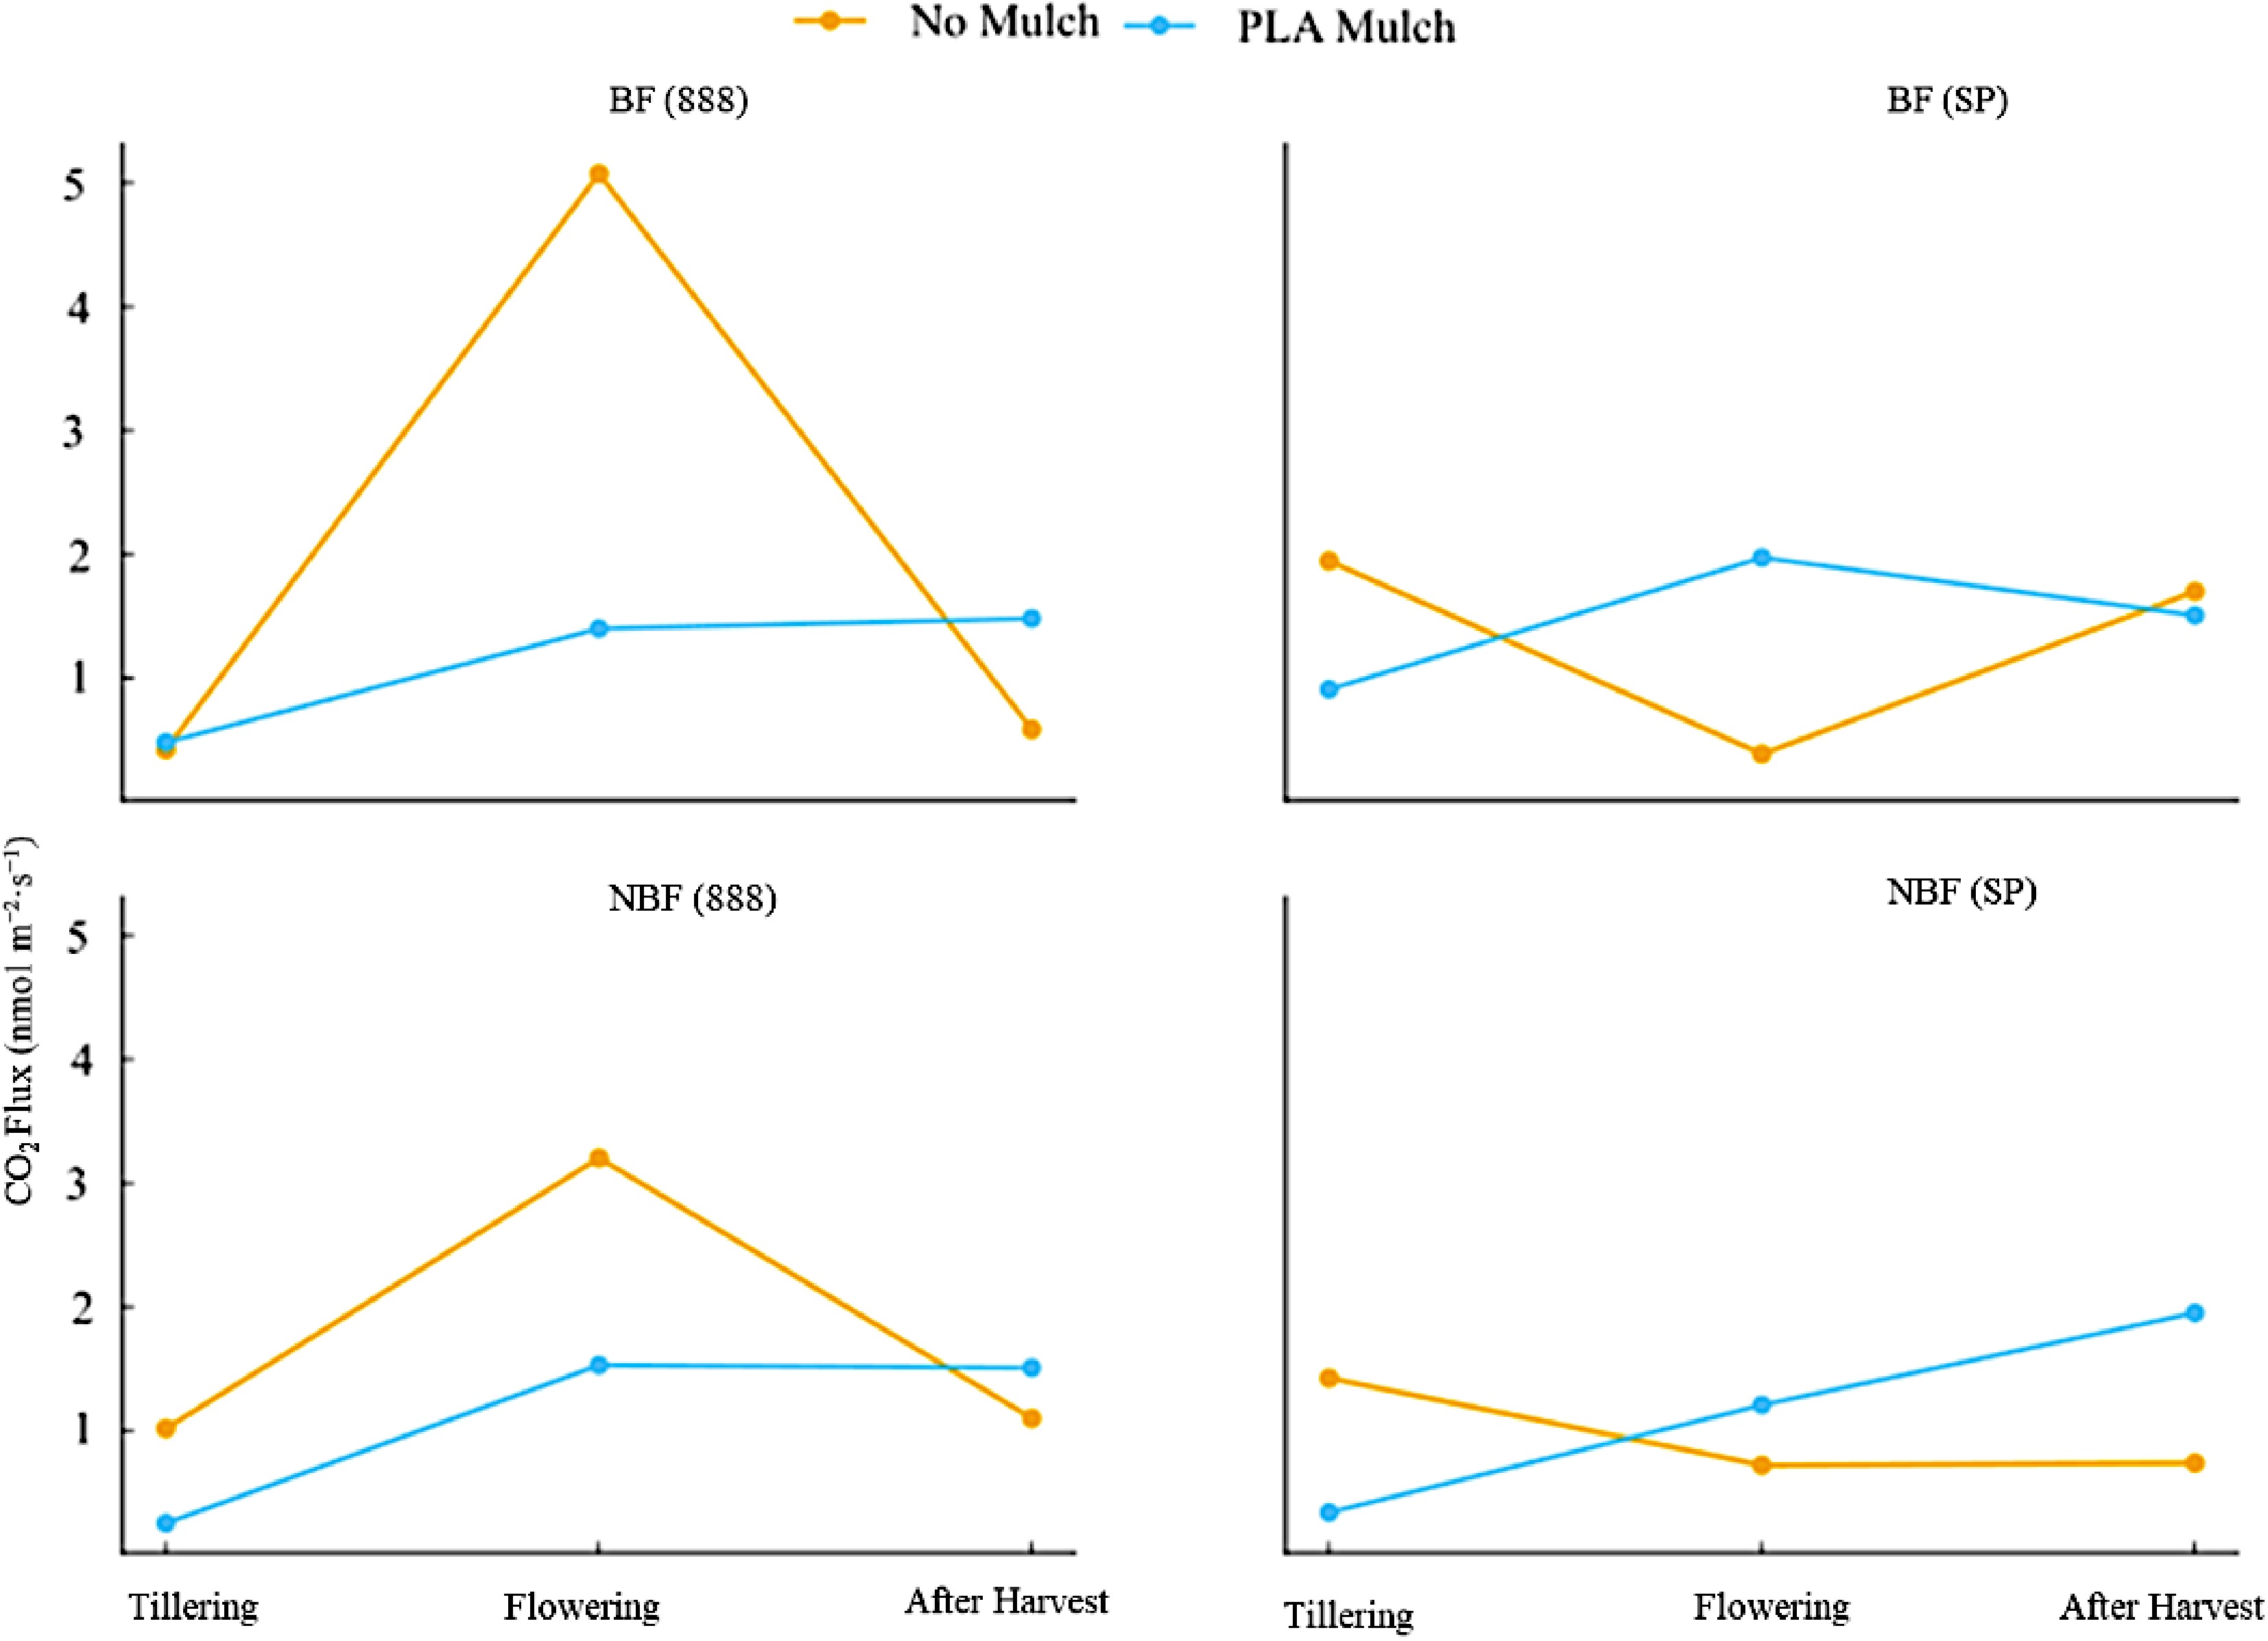
Figure 8.
Carbon dioxide (CO2) emissions across growth stages under mulch treatments, faceted by fertilizer × variety.
-
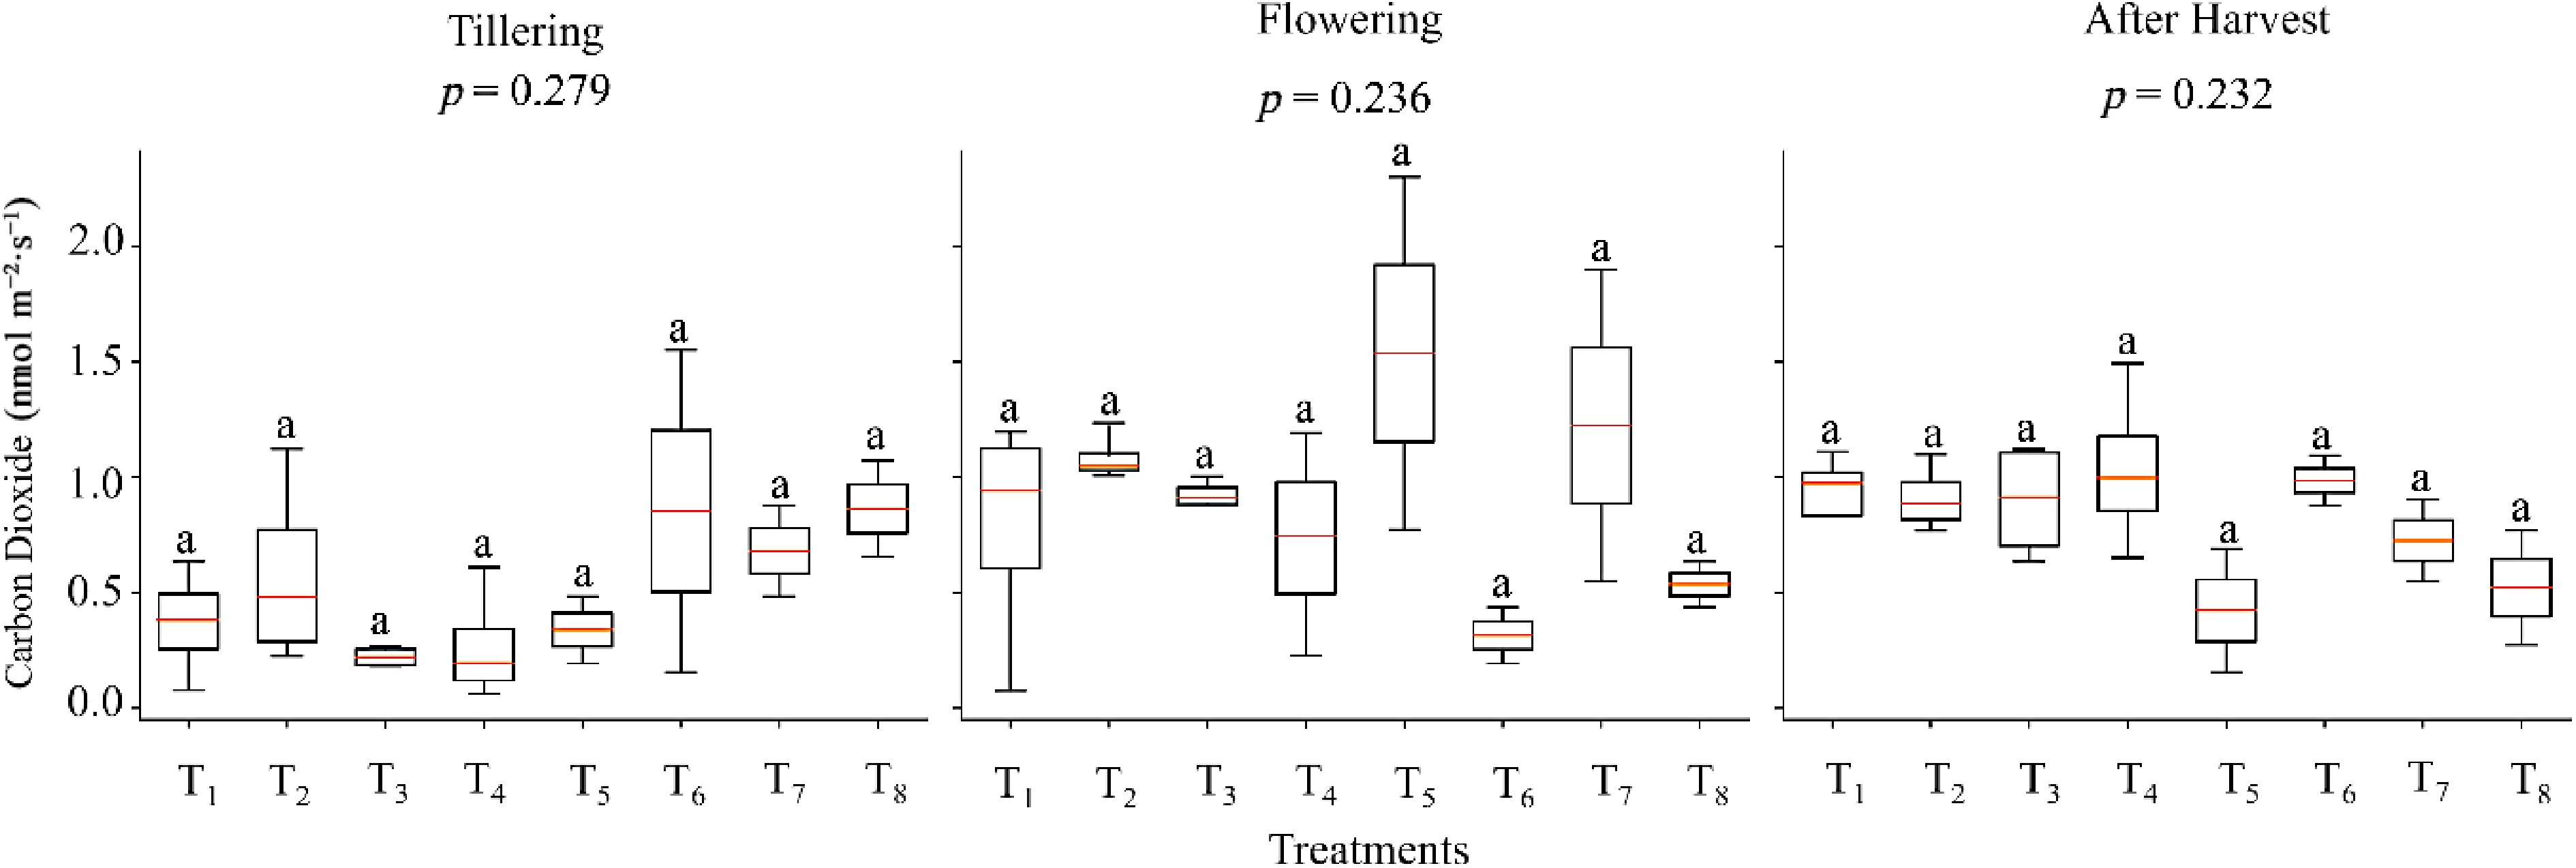
Figure 9.
CO2 emission distributions across growth stages × treatment combinations.
-
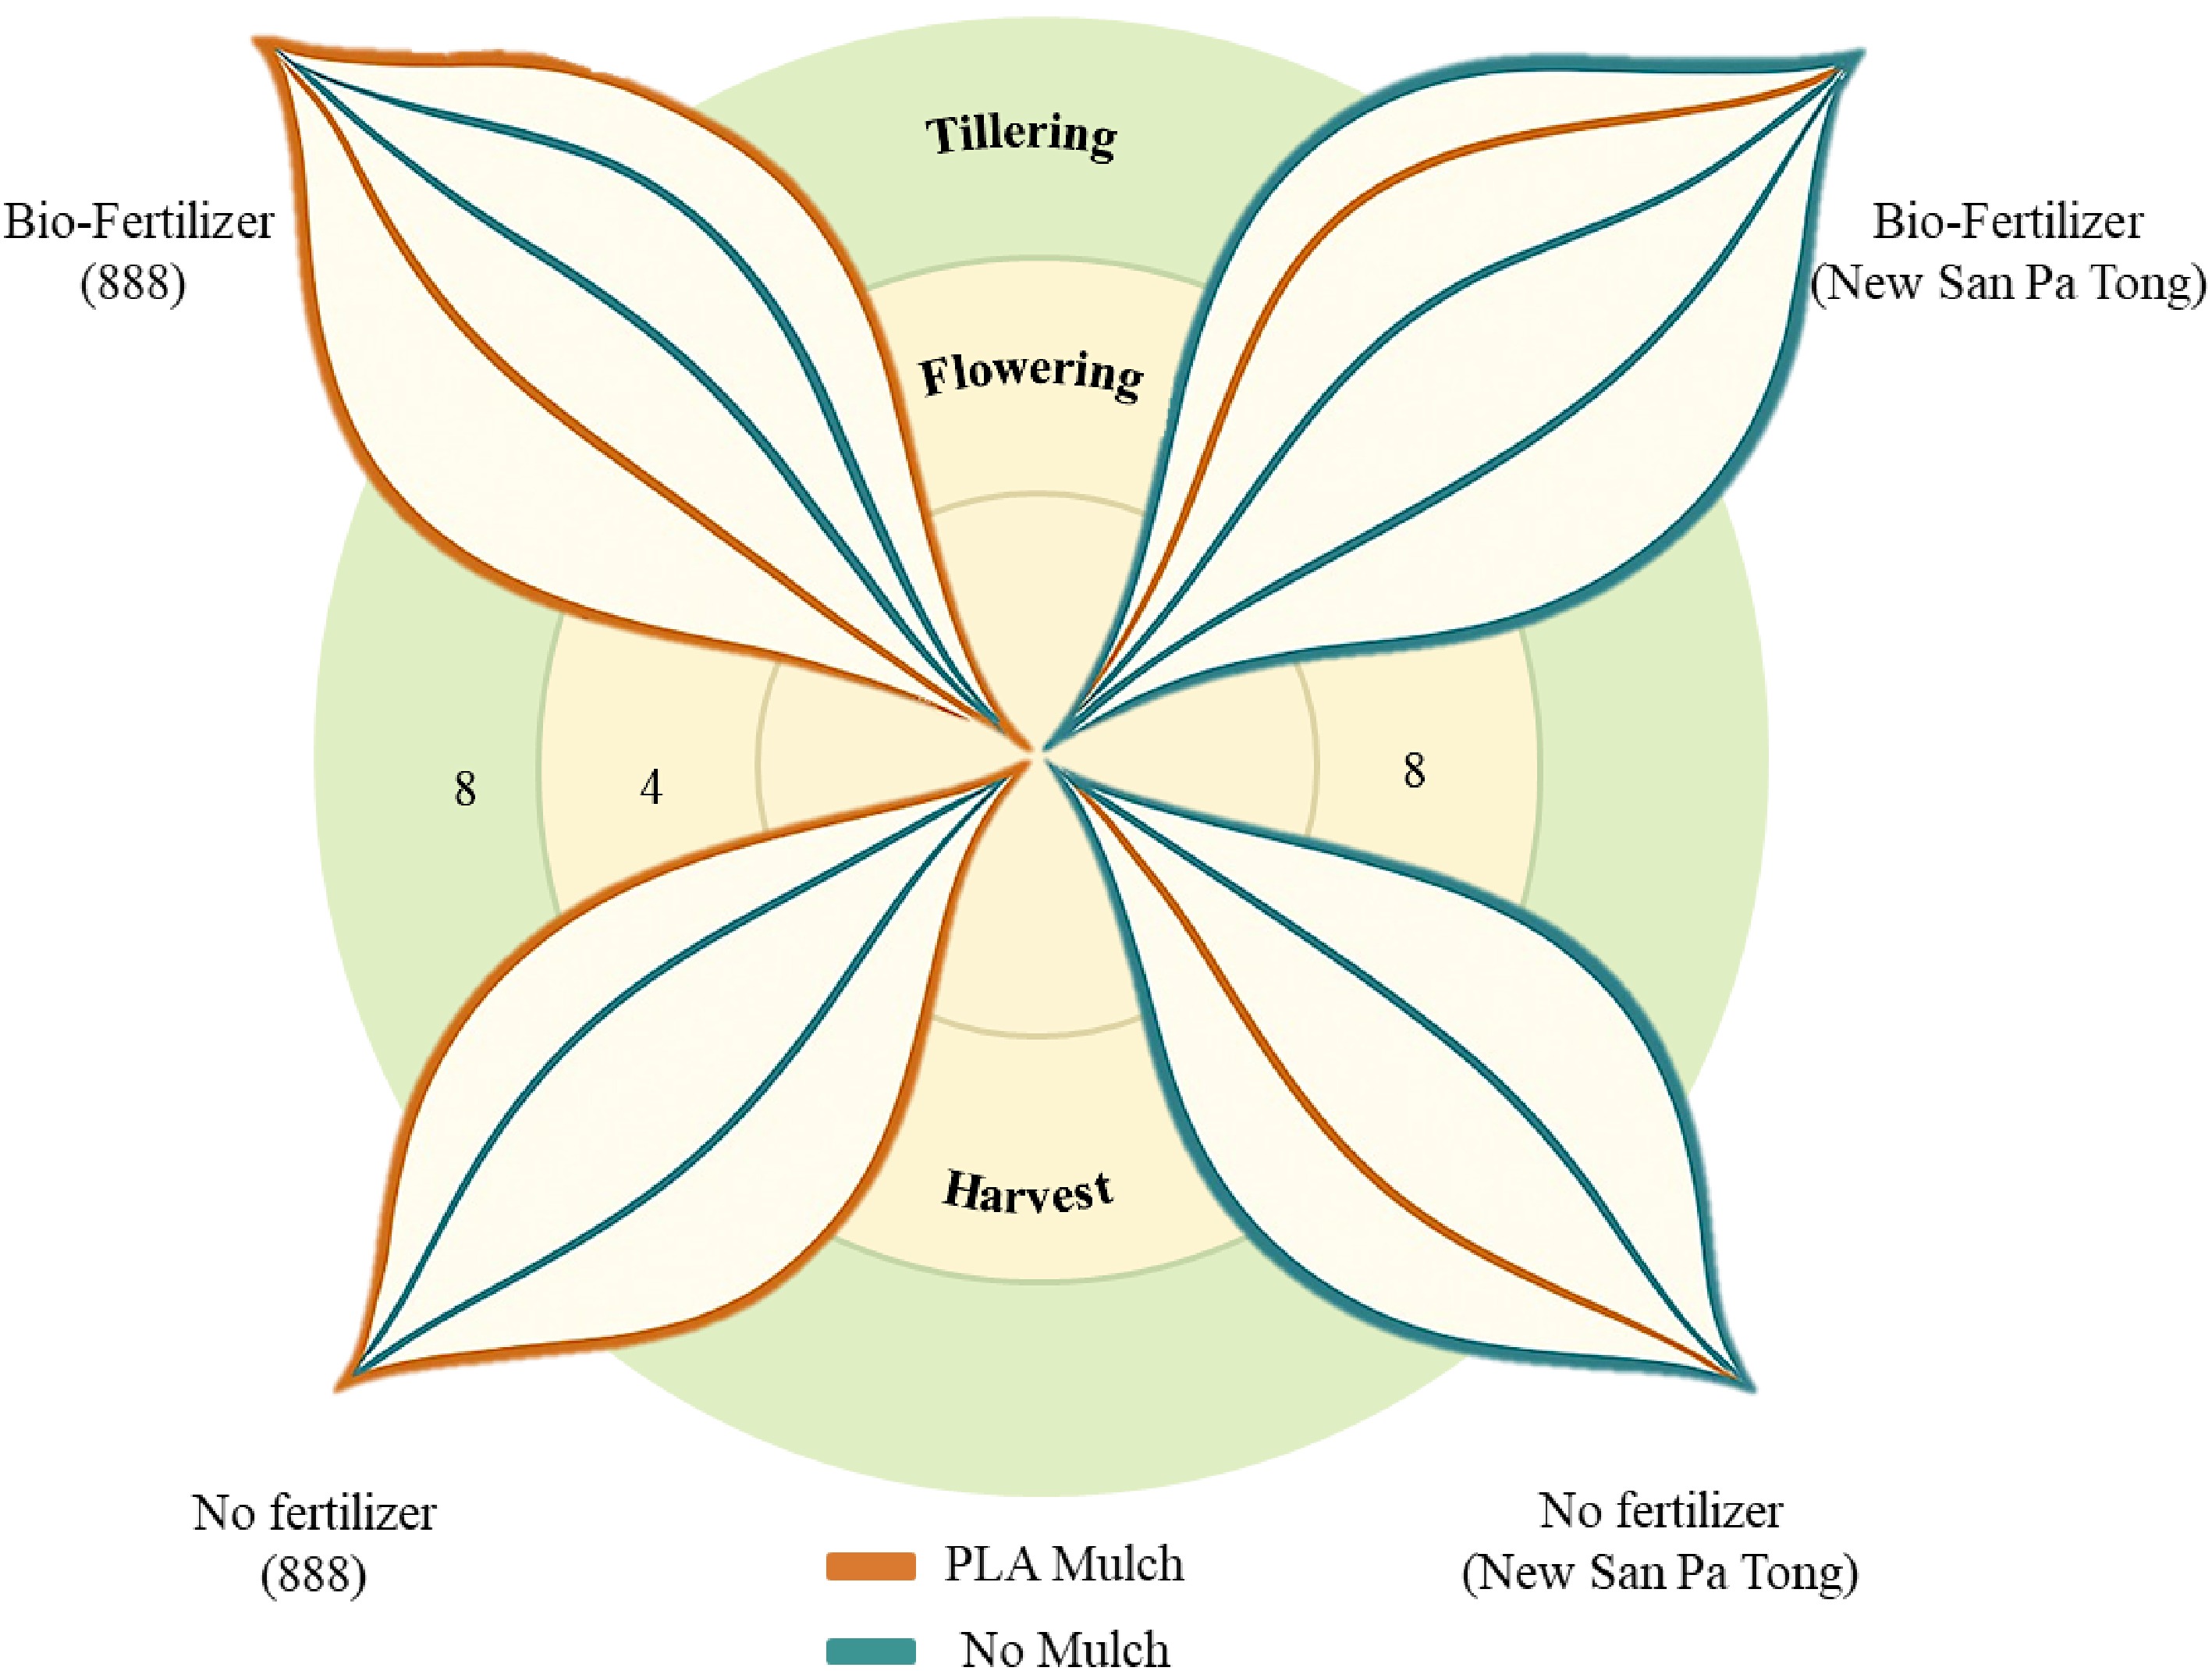
Figure 10.
Conceptual visualization of carbon dioxide (CO2) emission dynamics across rice growth stages under mulched and non-mulched conditions.
-
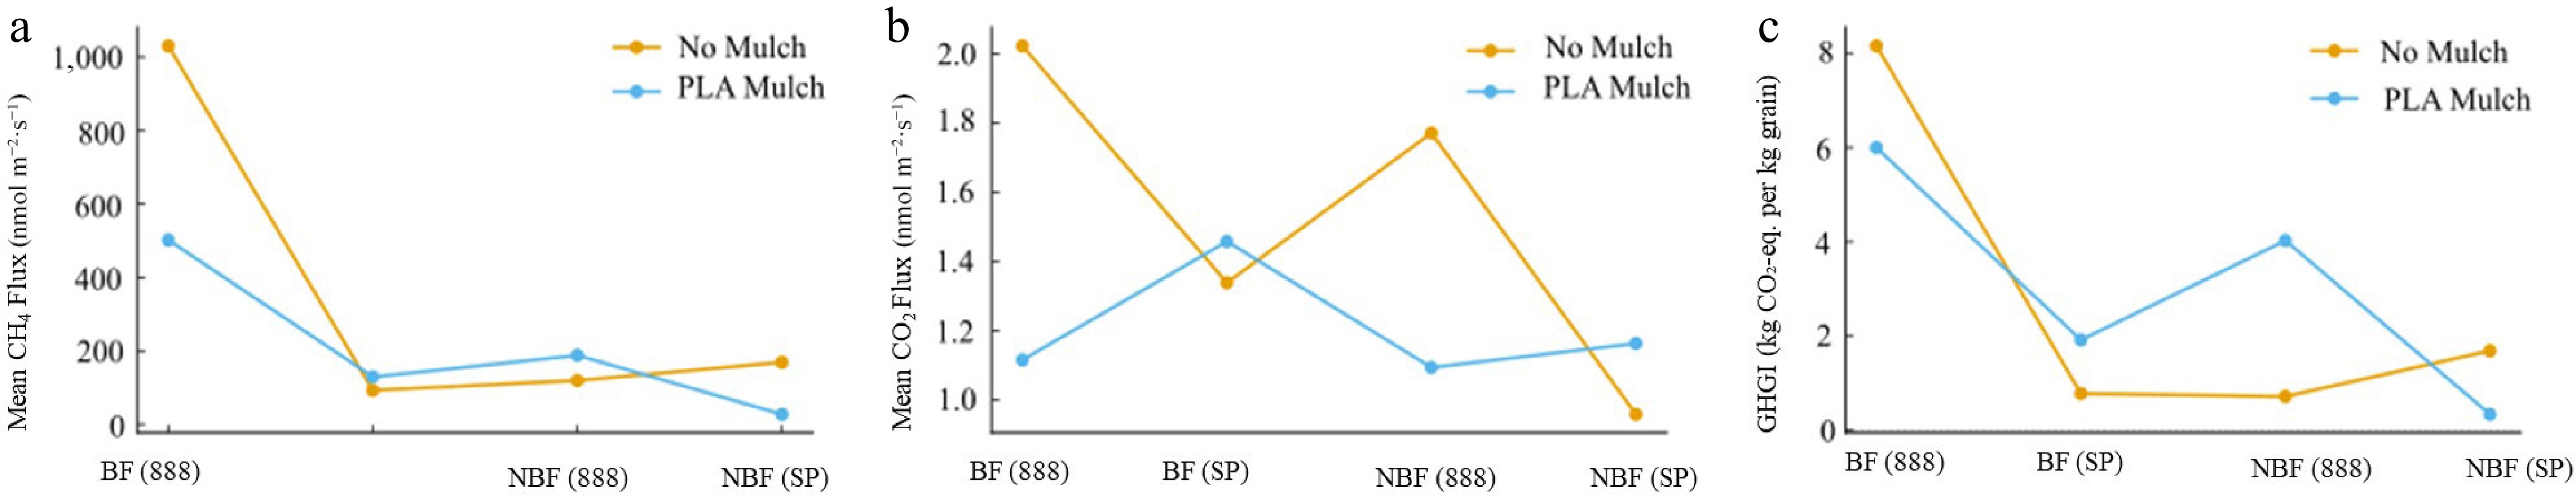
Figure 11.
Greenhouse gas intensity (GHGI) expressed as cumulative CH4 and CO2 emissions per unit grain yield, across mulch and fertilizer treatment combinations, (a) methane, (B) CO2, and (C) GHGI.
-
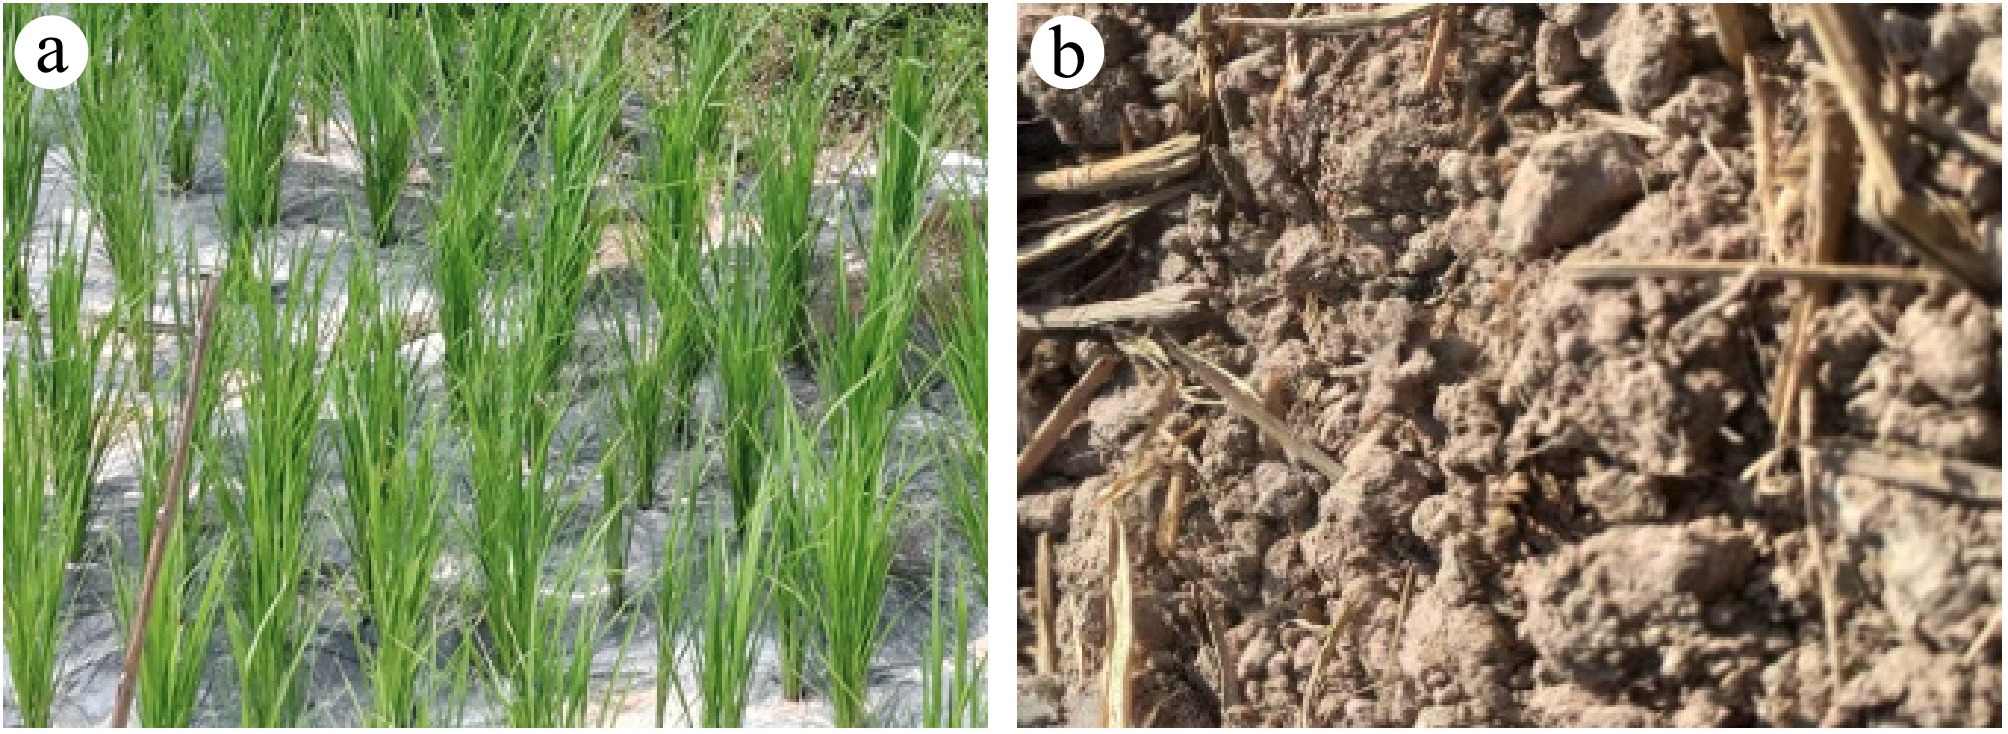
Figure 12.
Degradation of PLA Mulch (a) shows the PLA mulch during the initial application phase, and (b) are gradually degraded PLA mulch.
-
Treatments (T) Micro-Algal Bio- Fertilizer (888) PLA Mulch (T1) Micro-Algal Bio- Fertilizer (New San Pa Tong) PLA Mulch (T2) No Fertilizer (888) PLA Mulch (T3) No Fertilizer (New San Pa Tong) PLA Mulch (T4) Micro-Algal Bio- Fertilizer (888) No Mulch (T5) Micro-Algal Bio- Fertilizer (New San Pa Tong) No Mulch (T6) No Fertilizer (888) No Mulch (T7) (Control) No Fertilizer (New San Pa Tong) No Mulch (T8) (Control) Table 1.
Experimental setup.
-
Treatment Plant height (cm) Soil pH Soil moisture (%) Chlorophyll Bio- Fertilizer: PLA Mulch (888) (T1) 102.71 ± 12.07a 6.72 ± 0.31a 1.79 ± 0.78a 27.72 ± 5.4a Bio- Fertilizer: PLA Mulch (New San Pa Tong) (T2) 100.74 ± 12.83b 6.68 ± 0.28ab 1.82 ± 0.26a 29.62 ± 7.81b No Fertilizer: PLA Mulch (888) (T3) 105.98 ± 10.66c 6.54 ± 0.35b 0.79 ± 1.04b 23.01 ± 8.91c No Fertilizer: PLA Mulch (New San Pa Tong) (T4) 98.12 ± 11.45d 6.49 ± 0.40bc 1.89 ± 1.64a 24.32 ± 8.60d Bio- Fertilizer No Mulch (888) (T5) 96.87 ± 13.02e 6.38 ± 0.29c 1.34 ± 0.92c 23.49 ± 9.14e Bio- Fertilizer No Mulch (New San Pa Tong) (T6) 99.56 ± 12.11f 6.35 ± 0.33c 0.88 ± 0.68d 27.20 ± 5.99f No Fertilizer: No Mulch (888) (T7) (Control) 92.44 ± 10.38g 6.21 ± 0.37d 0.69 ± 0.06e 24.82 ± 8.32g No Fertilizer: No Mulch (New San Pa Tong) (T8) (Control) 90.81 ± 9.96h 6.19 ± 0.41d 0.93 ± 0.87d 24.82 ± 8.32g Different superscript letters within the same column indicate significant differences among treatments at p < 0.05. Table 2.
Analysis of variance (ANOVA) for the effects of treatments (T1–T8) on plant height, soil pH, soil moisture, and chlorophyll content.
-
Treatment Methane
(nmol m−2·s−1)Carbon dioxide
(nmol m−2·s−1)Bio- Fertilizer: PLA Mulch (888) (T1) 32.77 ± 18.41a 1.12 ± 0.80a Bio- Fertilizer: PLA Mulch (New San Pa Tong) (T2) 1,081.62 ± 412.55b 1.46 ± 0.68b No Fertilizer: PLA Mulch (888) (T3) 4.54 ± 2.11c 1.09 ± 0.71c No Fertilizer: PLA Mulch (New San Pa Tong) (T4) 41.32 ± 20.77a 1.16 ± 1.02d Bio- Fertilizer No Mulch (888) (T5) 58.41 ± 33.66d 2.02 ± 3.43e Bio- Fertilizer No Mulch (New San Pa Tong) (T6) 29.86 ± 14.22a 1.34 ± 1.37f No Fertilizer: No Mulch (888) (T7) (Control) 17.45 ± 8.91e 1.77 ± 1.95g No Fertilizer: No Mulch (New San Pa Tong) (T8) (Control) 12.64 ± 6.38e 0.96 ± 0.56h Different superscript letters within the same column indicate significant differences among treatments at p < 0.05. Table 3.
Analysis of variance (ANOVA) of treatment effects (T1–T8) on methane and carbon dioxide emissions.
-
Treatments (T) Cumulative CH4 emission (Mean ± SE) Micro-Agal Bio- Fertilizer (888) PLA Mulch (T1) 1,506.0 ± 482.6 Micro-Agal Bio- Fertilizer (New San Pa Tong) PLA Mulch (T2) 388.2 ± 161.8 No Fertilizer (888) PLA Mulch (T3) 563.8 ± 438.7 No Fertilizer (New San Pa Tong) PLA Mulch (T4) 81.7 ± 55.9 Micro-Agal Bio- Fertilizer (888) No Mulch (T5) 3,093.1 ± 2,944.4 Micro-Agal Bio- Fertilizer (New San Pa Tong) No Mulch (T6) 278.0 ± 144.8 No Fertilizer (888) No Mulch (T7) (Control) 358.6 ± 144.9 No Fertilizer (New San Pa Tong) No Mulch (T8) (Control) 507.6 ± 422.1 Table 4.
Cumulative CH4 emission across growth stages.
-
Treatments (T) Cumulative CO2 emission (Mean ± SE) Micro-Agal Bio- Fertilizer (888) PLA Mulch (T1) 3.35 ± 0.86 Micro-Agal Bio- Fertilizer (New San Pa Tong) PLA Mulch (T2) 4.37 ± 0.60 No Fertilizer (888) PLA Mulch (T3) 3.28 ± 0.36 No Fertilizer (New San Pa Tong) PLA Mulch (T4) 3.49 ± 0.59 Micro-Agal Bio- Fertilizer (888) No Mulch (T5) 6.07 ± 4.12 Micro-Agal Bio- Fertilizer (New San Pa Tong) No Mulch (T6) 4.02 ± 1.65 No Fertilizer (888) No Mulch (T7) (Control) 5.32 ± 3.23 No Fertilizer (New San Pa Tong) No Mulch (T8) (Control) 2.88 ± 0.09 Table 5.
Cumulative CO2 emissions across growth stages.
Figures
(12)
Tables
(5)