-
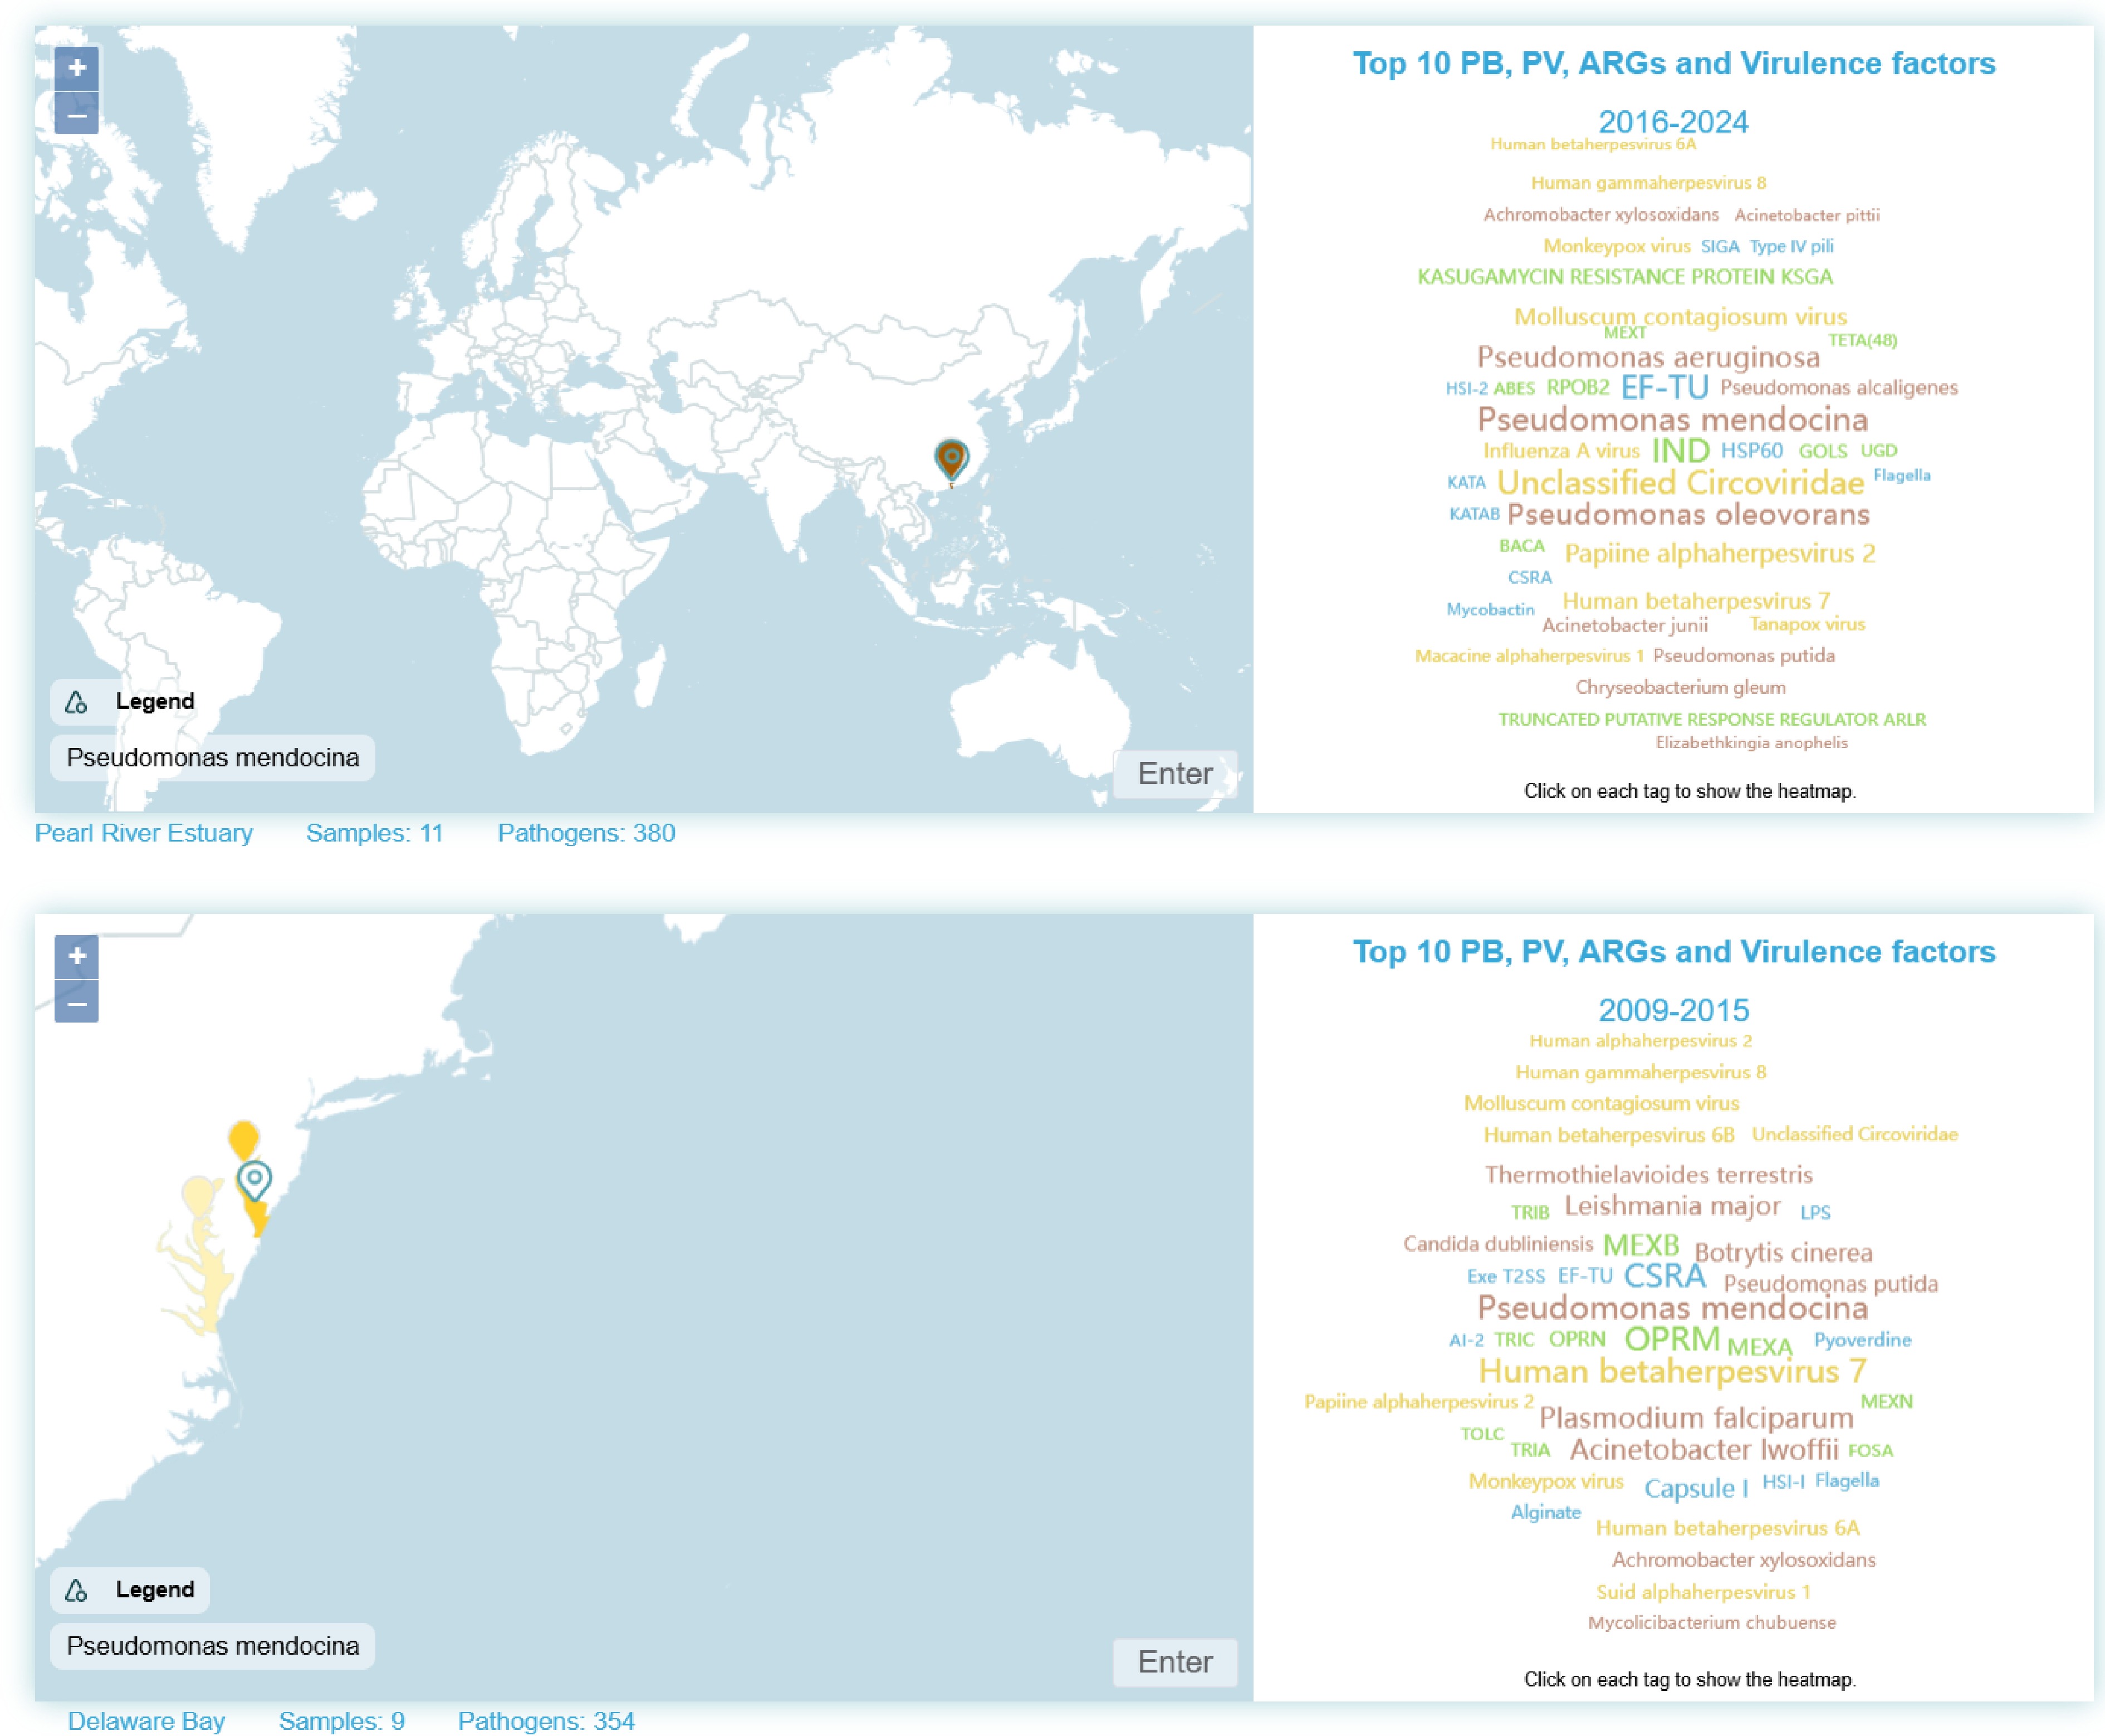
Figure 1.
A screenshot showing the website's homepage maps and word clouds. Upon clicking a specific BRF entry, the map on the left displays its abundance distribution across six coastal regions worldwide within the specified year range, represented by different colors.
-
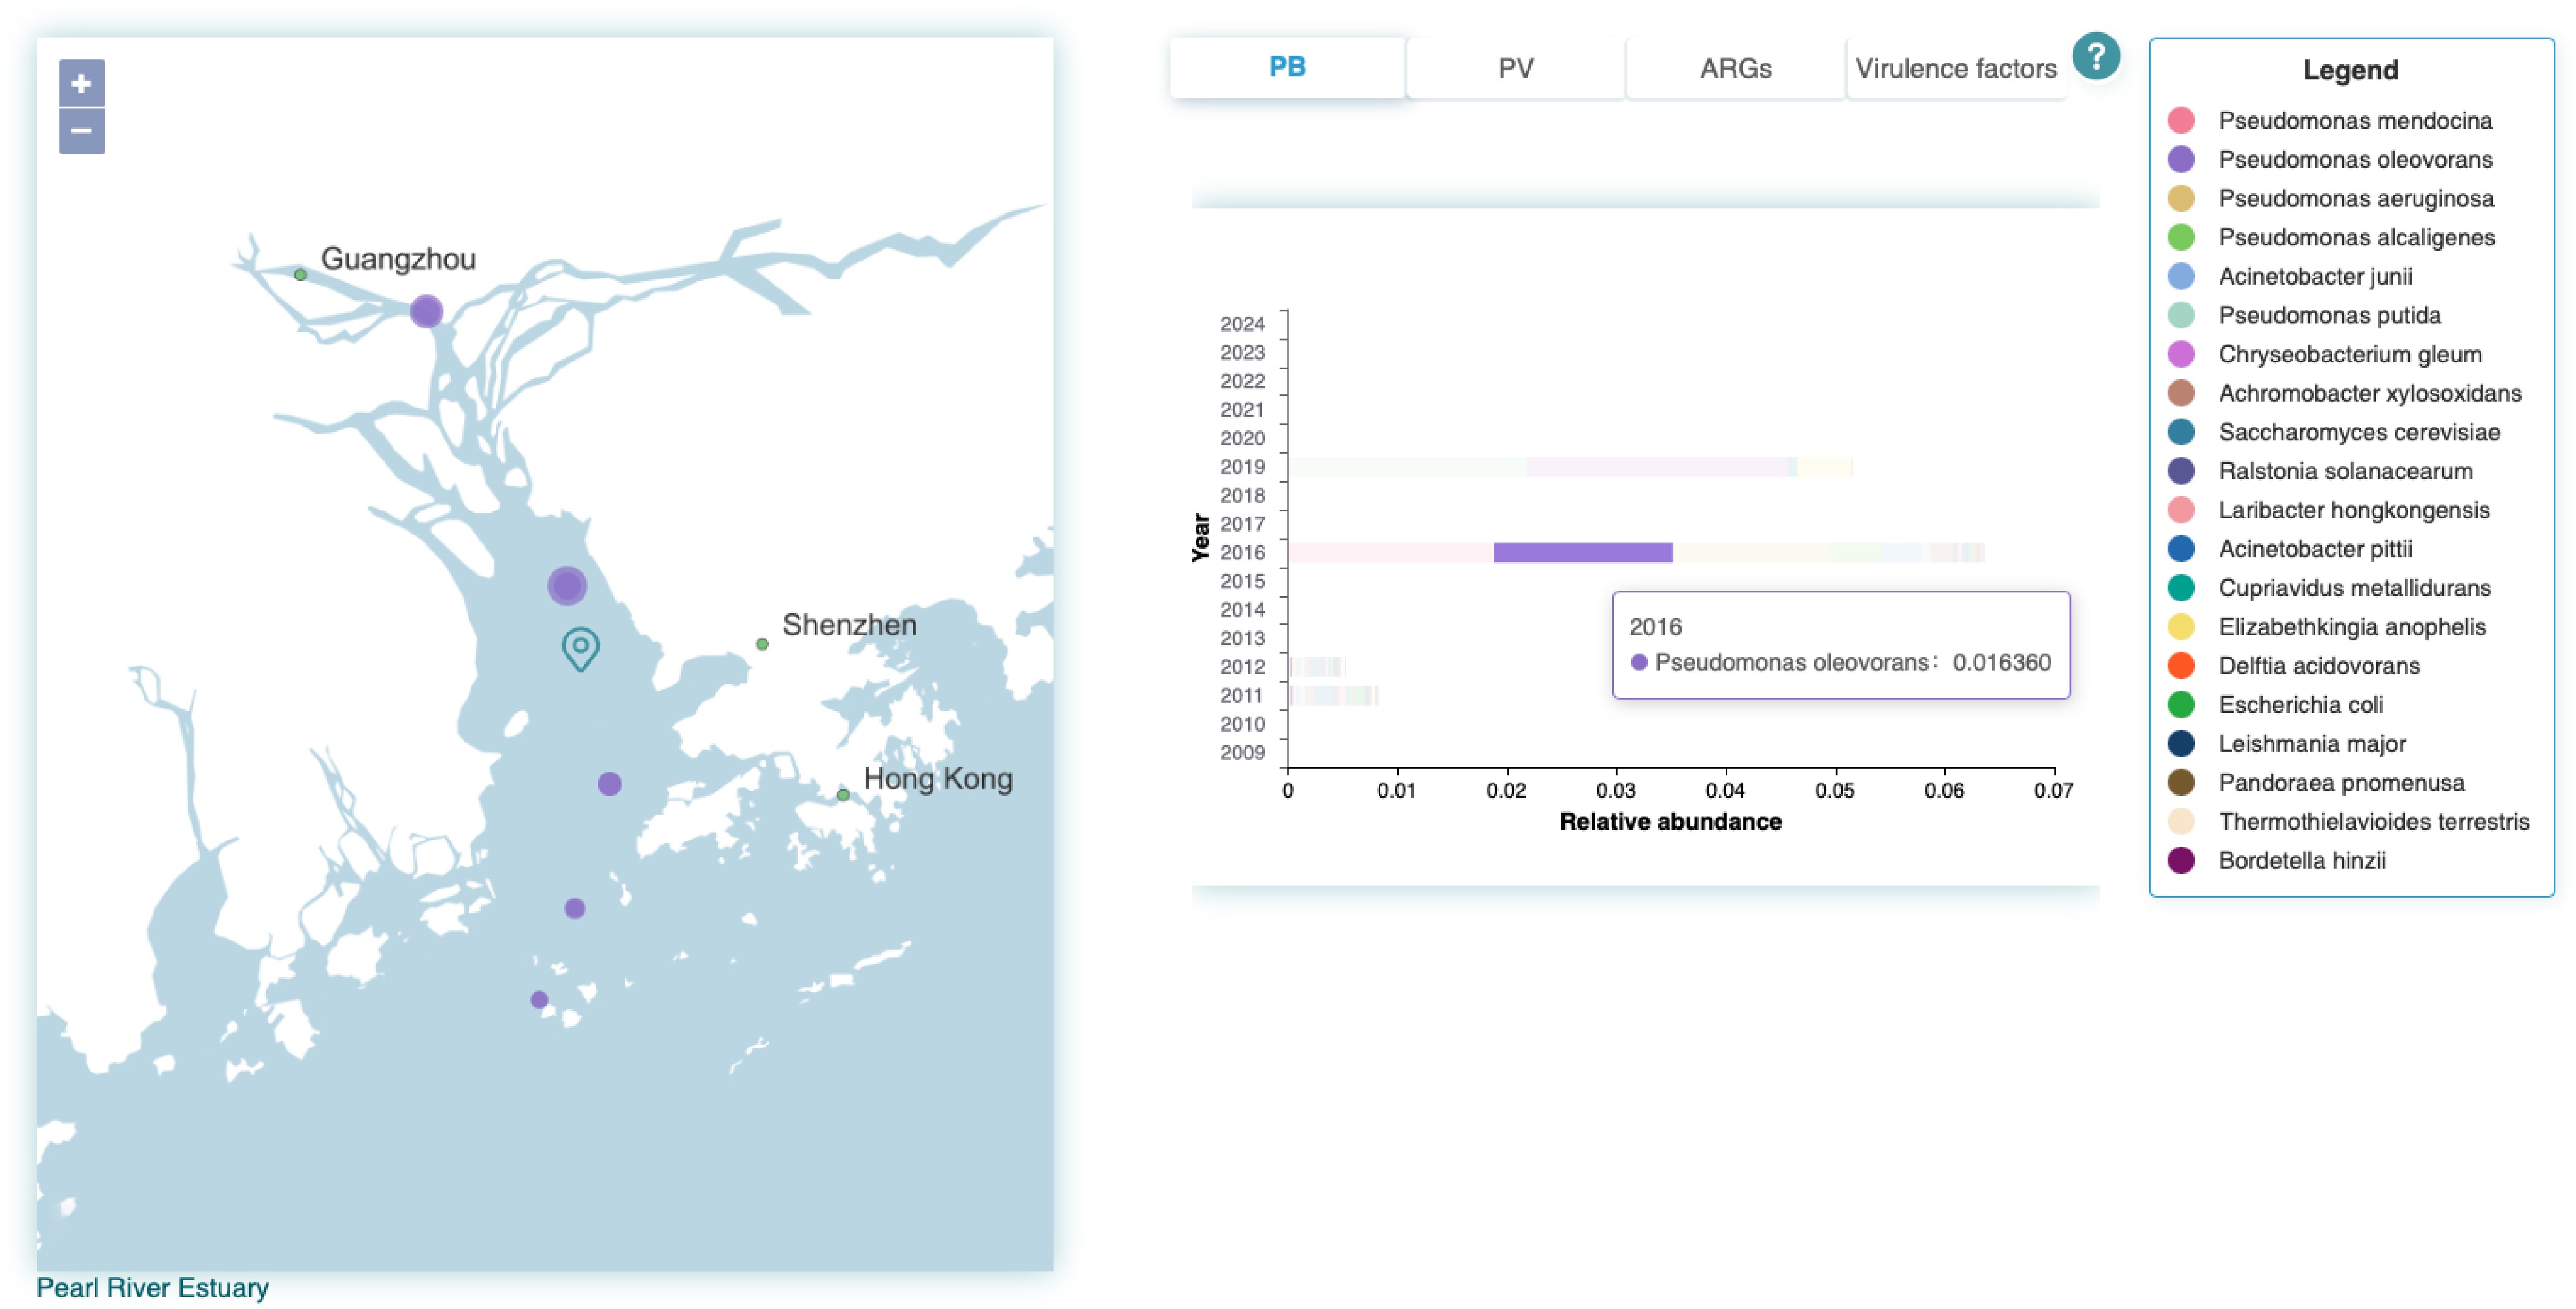
Figure 2.
BRF distribution bar chart. When the user hovers the mouse over the bar representing a specific pathogen, the annual average abundance of top pathogens is shown as the size of dots with their geographic distribution on the map of a specific coastal region.
-
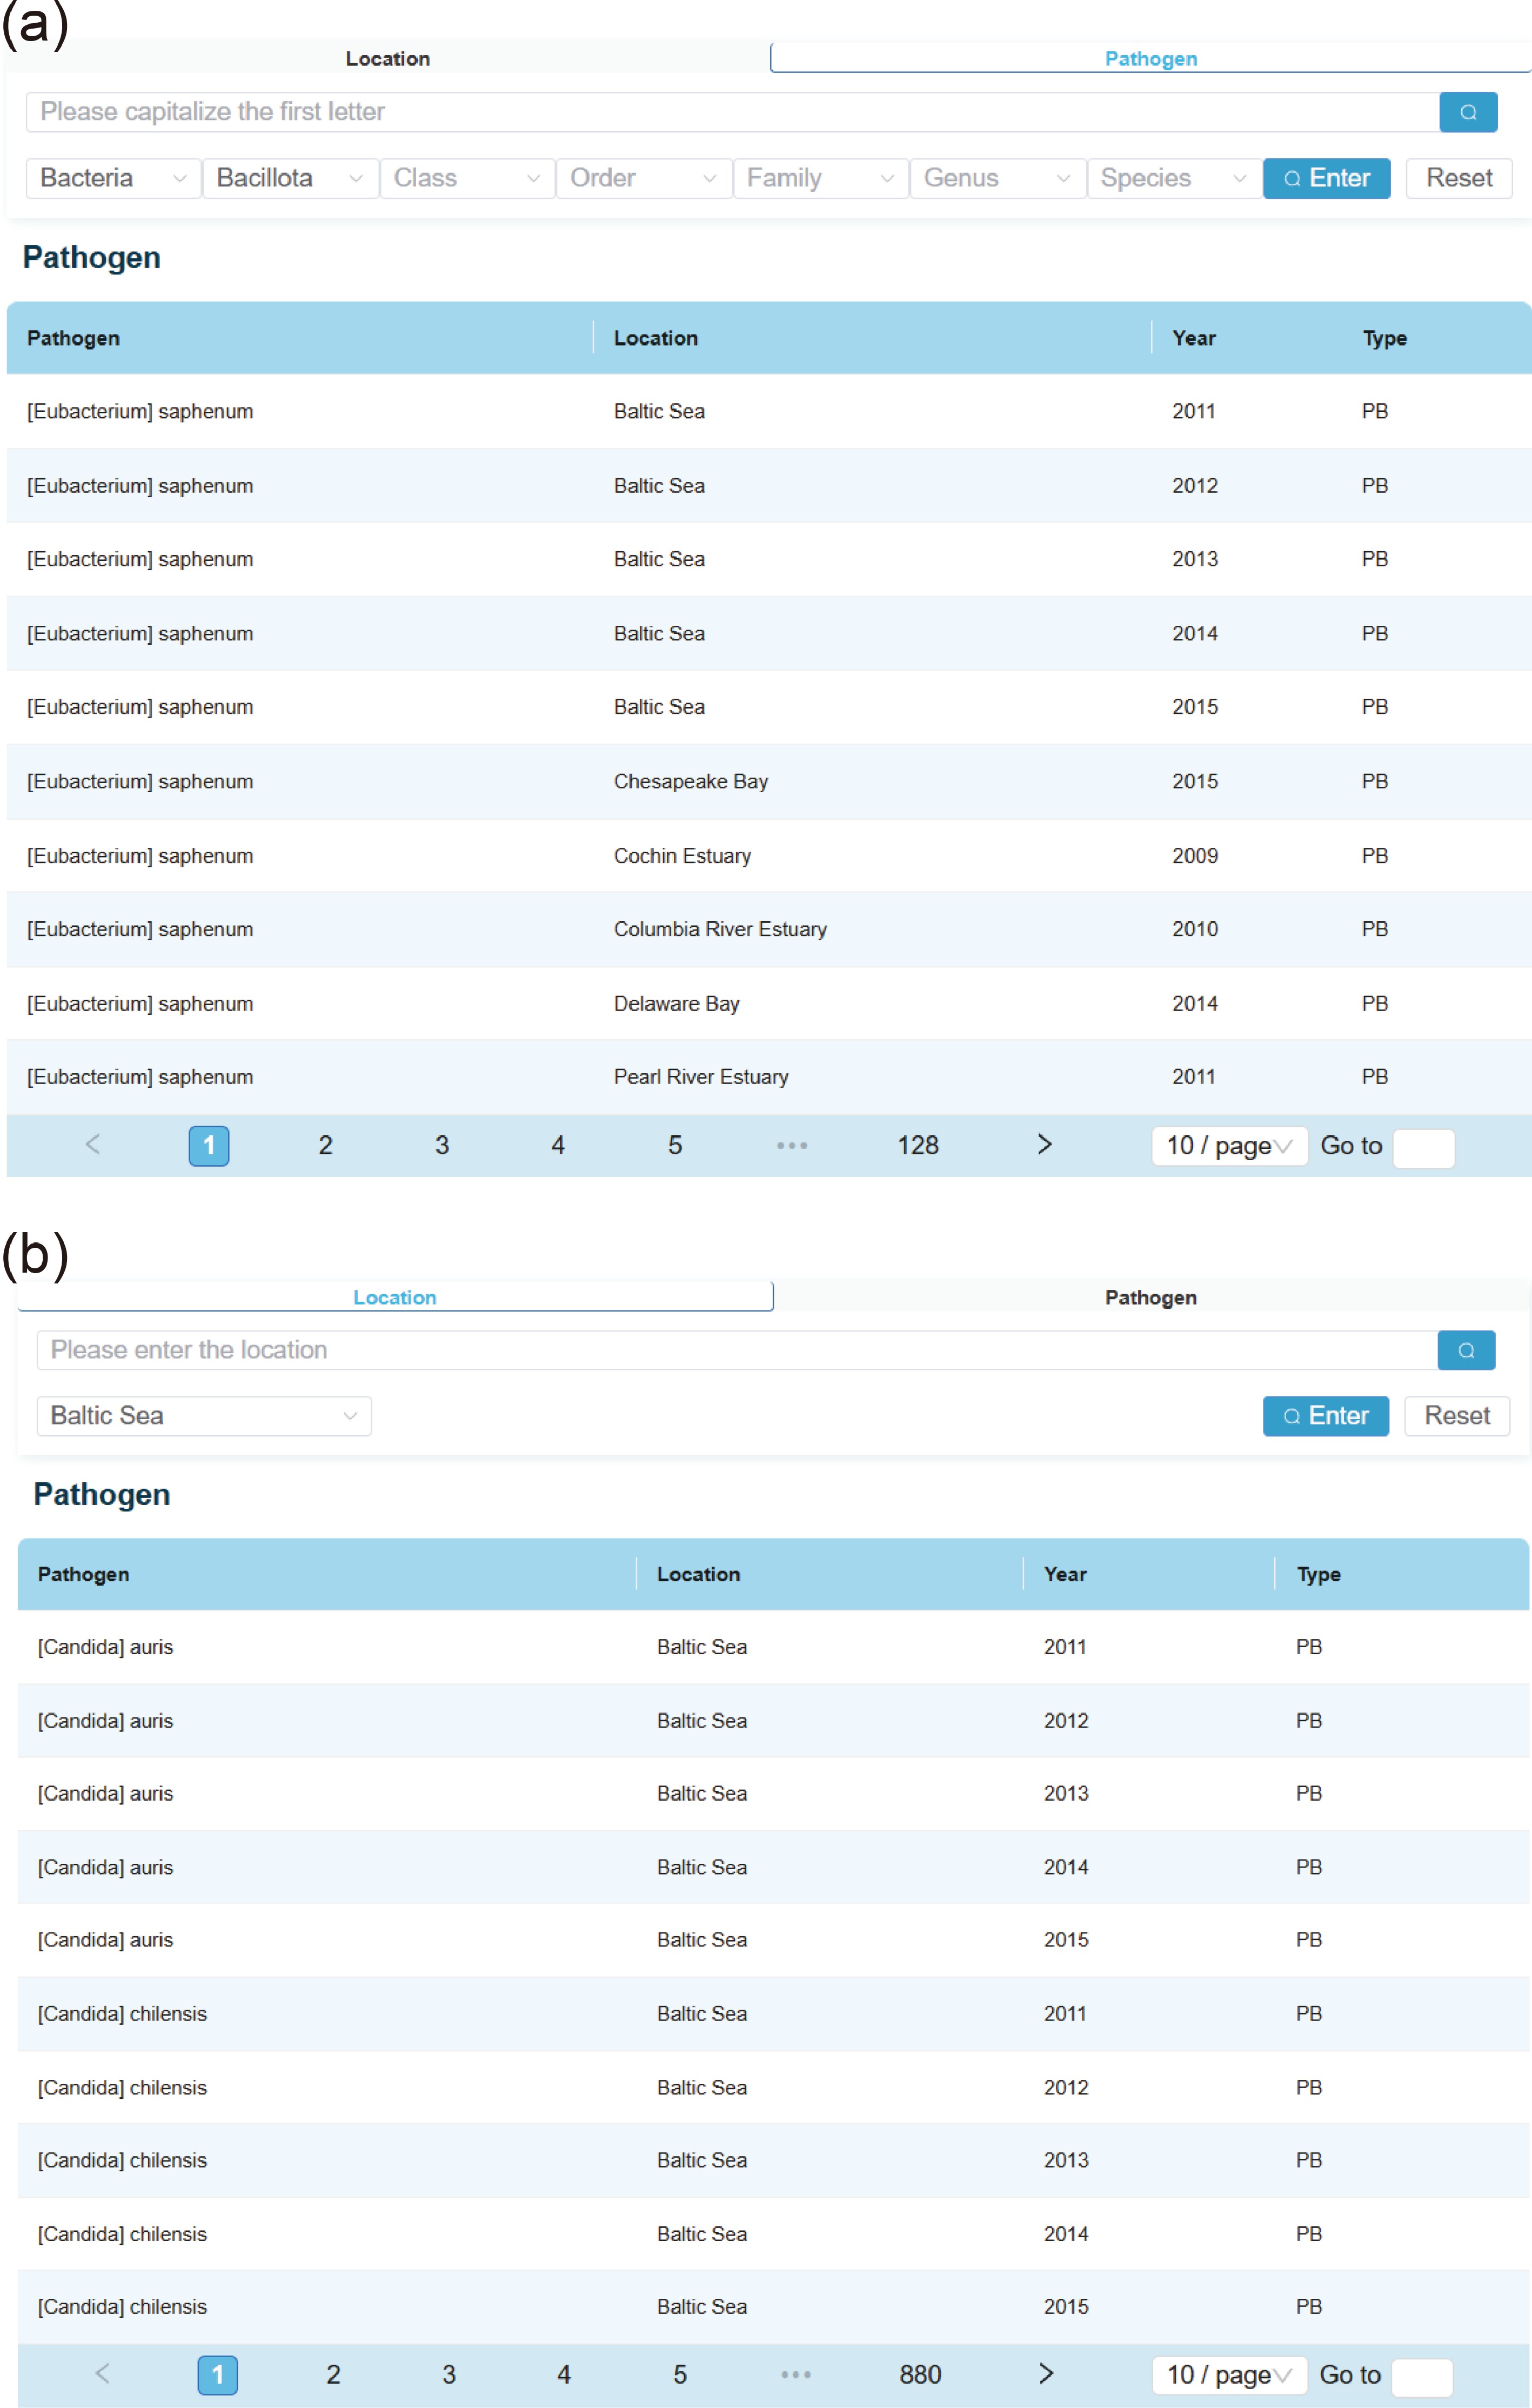
Figure 3.
Example of search results by (a) pathogens or (b) coastal regions. The names, locations, years, and types of certain pathogens are shown in the listed table.
-
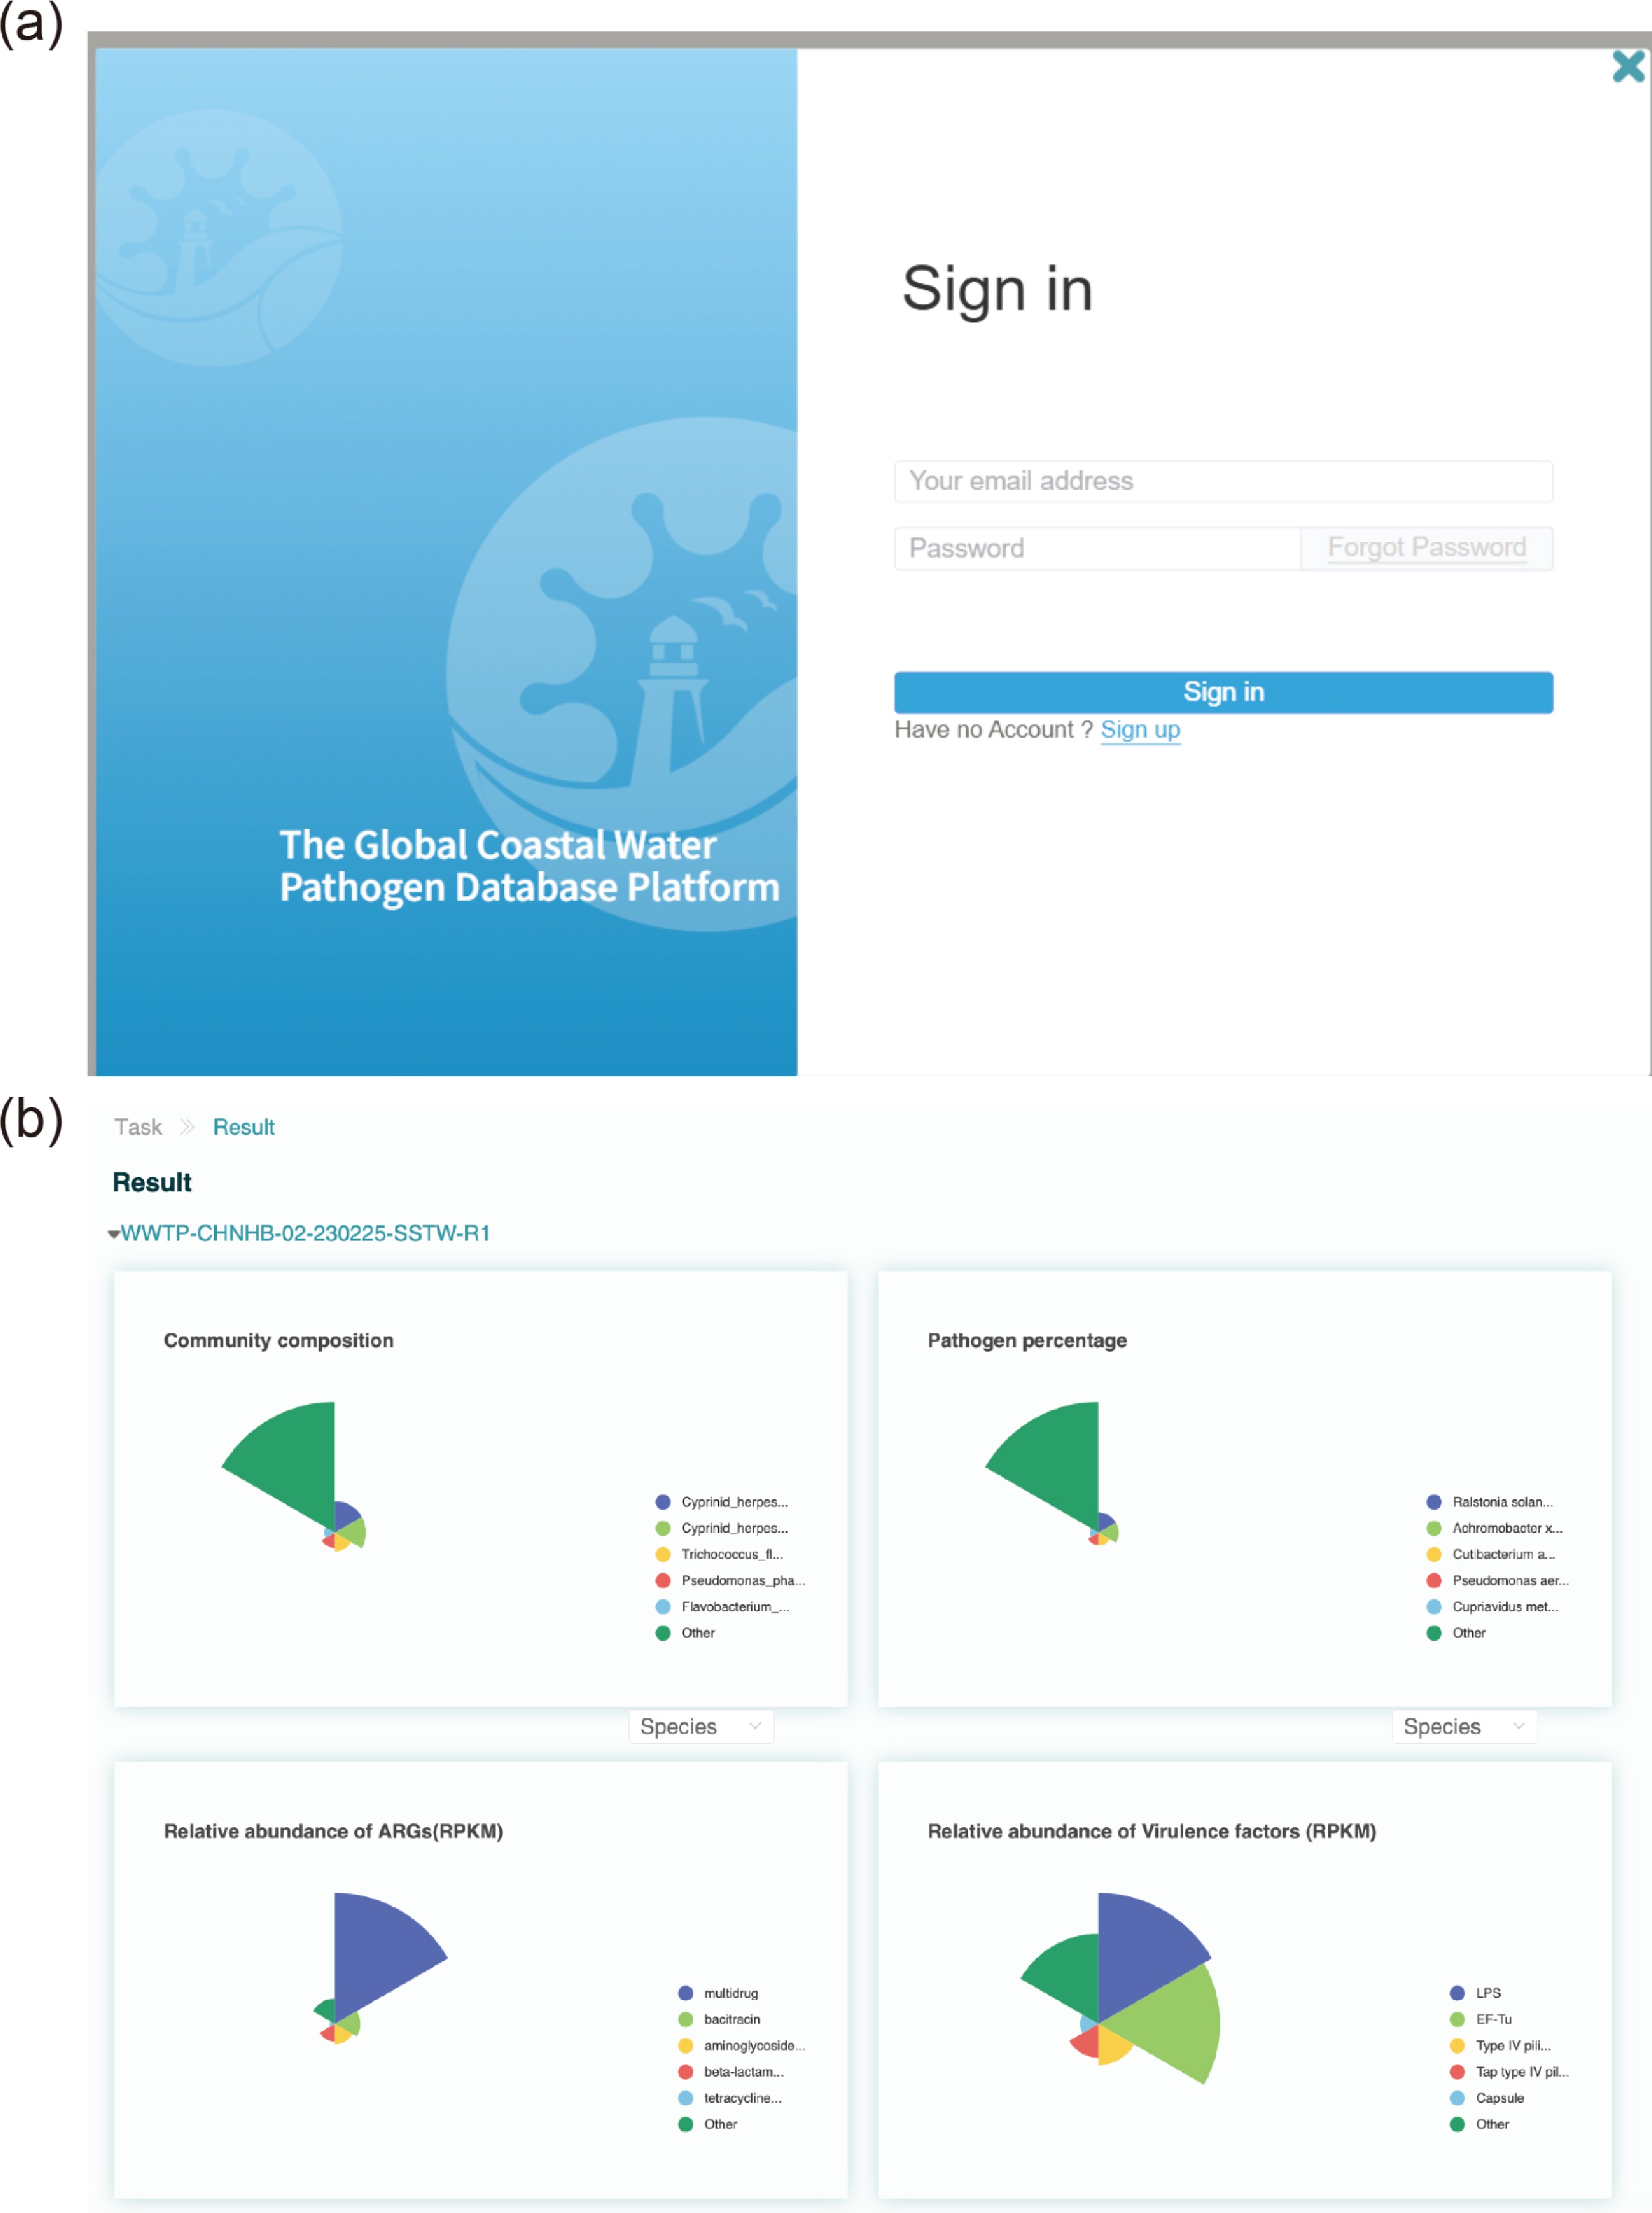
Figure 4.
User login interface and an example of analysis results of the online annotation pipeline. (a) In the login interface, new users can sign up using their email addresses. (b) The community composition, pathogen composition, ARG composition, and VF composition of the analyzed metagenomic sample are shown in the report.
-
Factors Numbers Samples 158 Coastal regions 6 Salinity 0.06‰–35.08‰ Temperature 1.64–31.50 °C Pathogens 403 (1,904) Bacteria 361 (991) Viruses 42 (514) Fungi 0 (399) ARGs ARG classes 30 (47) ARG subtypes 287 (2,373) VFs 10 (541) The number in parentheses indicates the total number of entries in the database knowledge dictionary. Table 1.
Summary of CWPD data
-
Feature CWPD DPiWE[9] ABPD[10] AquaPathogen X[11] Pathogen diversity Bacteria, viruses, fungi Bacteria Bacteria (aquaculture) Multi-taxa (isolates) Functional factors ARGs and VFs NA NA Epidemiological traits Data source type Shotgun metagenomics 16S rRNA/isolates eDNA metabarcoding Individual isolates Spatial visualization Interactive webGIS Static/result-based Regional profiles Template-based Analysis utility Online mNGS pipeline Sequence alignment Monitoring support Surveillance tool Temporal range 2010–2024 (global) Not specified One year (regional) Isolate history Table 2.
CWPD's advantages and limitations relative to existing resources
Figures
(4)
Tables
(2)