-
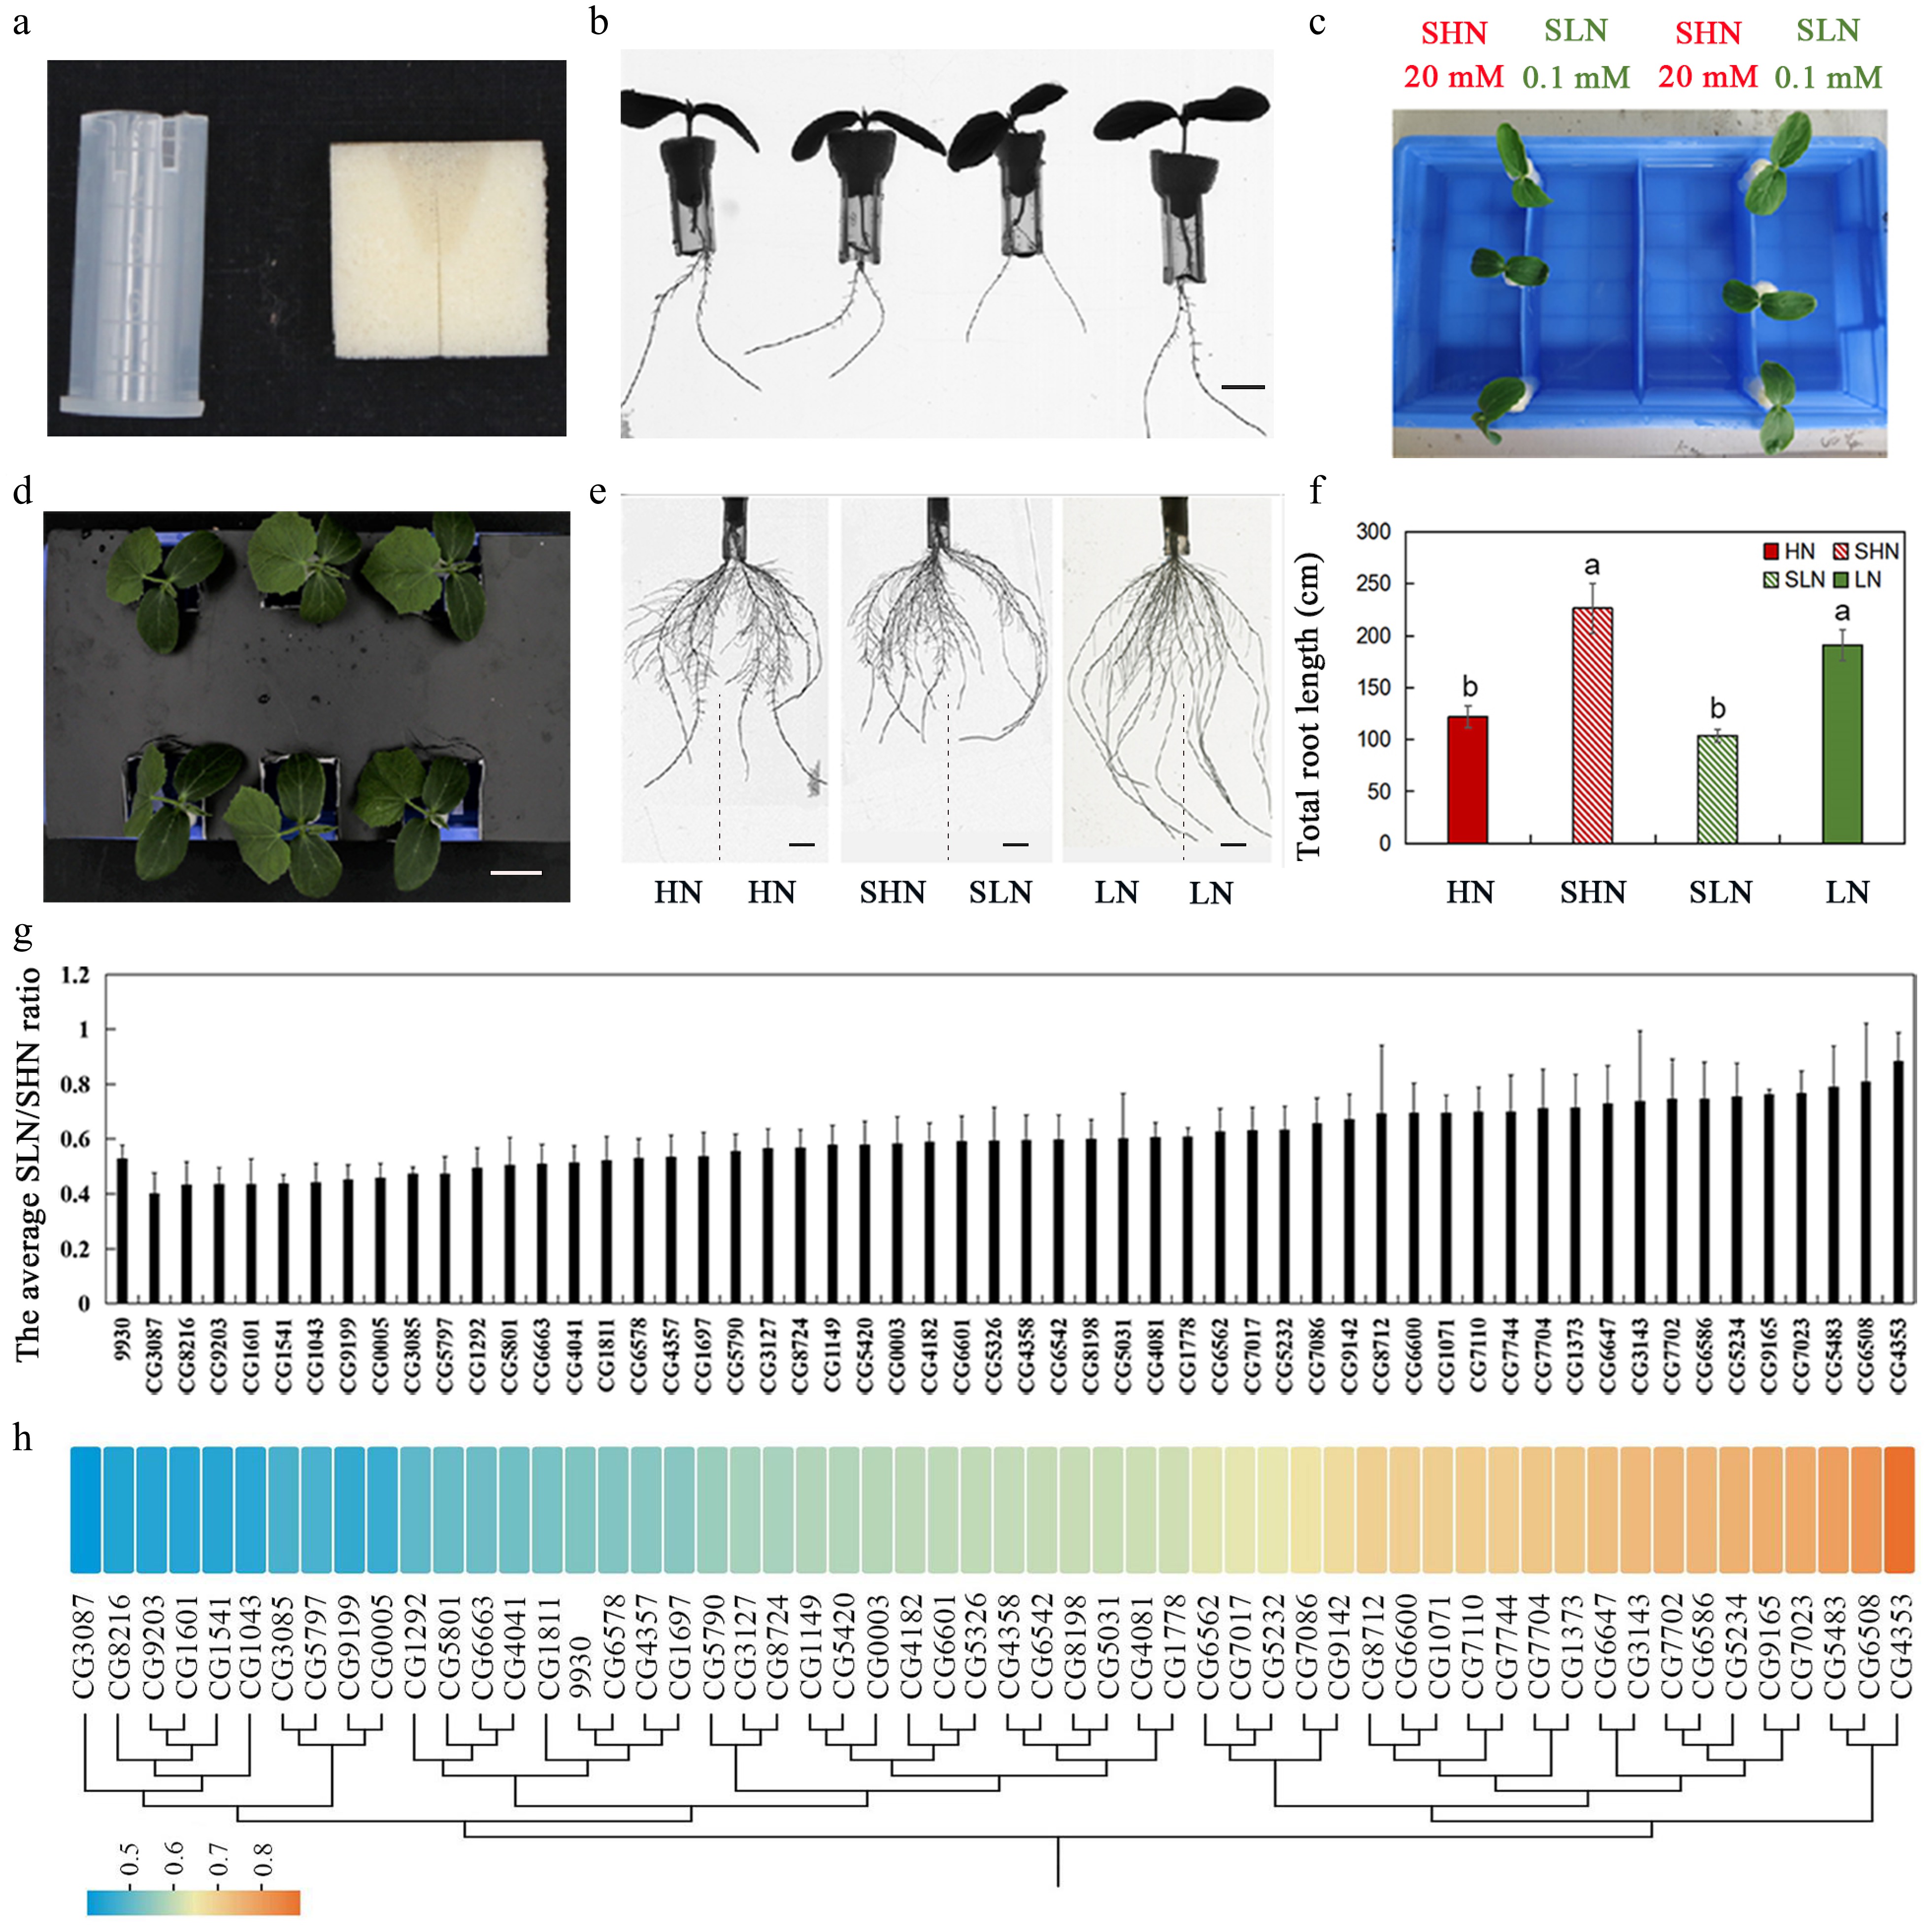
Figure 1.
Evaluation of systemic N signaling sensitivity in different cucumber germplasms using a split-root system. (a) Materials used to assemble the split-root system, including sponge blocks and modified conical (centrifuge) tubes. (b) Cucumber seedlings prepared for split-root experiments, the scale is 1 cm. (c) Configuration of the split-root hydroponic system. Lateral roots from the same seedling were evenly divided between two compartments of a partitioned container, with one side supplied with SHN (20 mM KNO3), and the other with SLN (0.1 mM KNO3). (d) Representative seedlings grown under homogeneous (HN or LN), and heterogeneous (SHN/SLN) conditions, the scale is 2 cm. (e) Representative root system phenotypes under homogeneous HN and LN conditions and under heterogeneous SHN/SLN conditions. Vertical dashed lines illustrate the physical separation of root systems into two compartments of a single plant in the split-root assay. Scale bar equals 1 cm. (f) Total lateral root length under different N concentrations. Different letters represent statistically significant differences. (g) Natural variation in SNS responsiveness among 56 cucumber germplasms, quantified as the SLN/SHN ratio of total LR length (mean ± SD). (h) Heat map of the sensitivity analysis of 56 cucumber germplasms to N signals. Color scale indicates SLN/SHN ratio. The figure also includes a cluster analysis based on the SLN/SHN ratio.
-
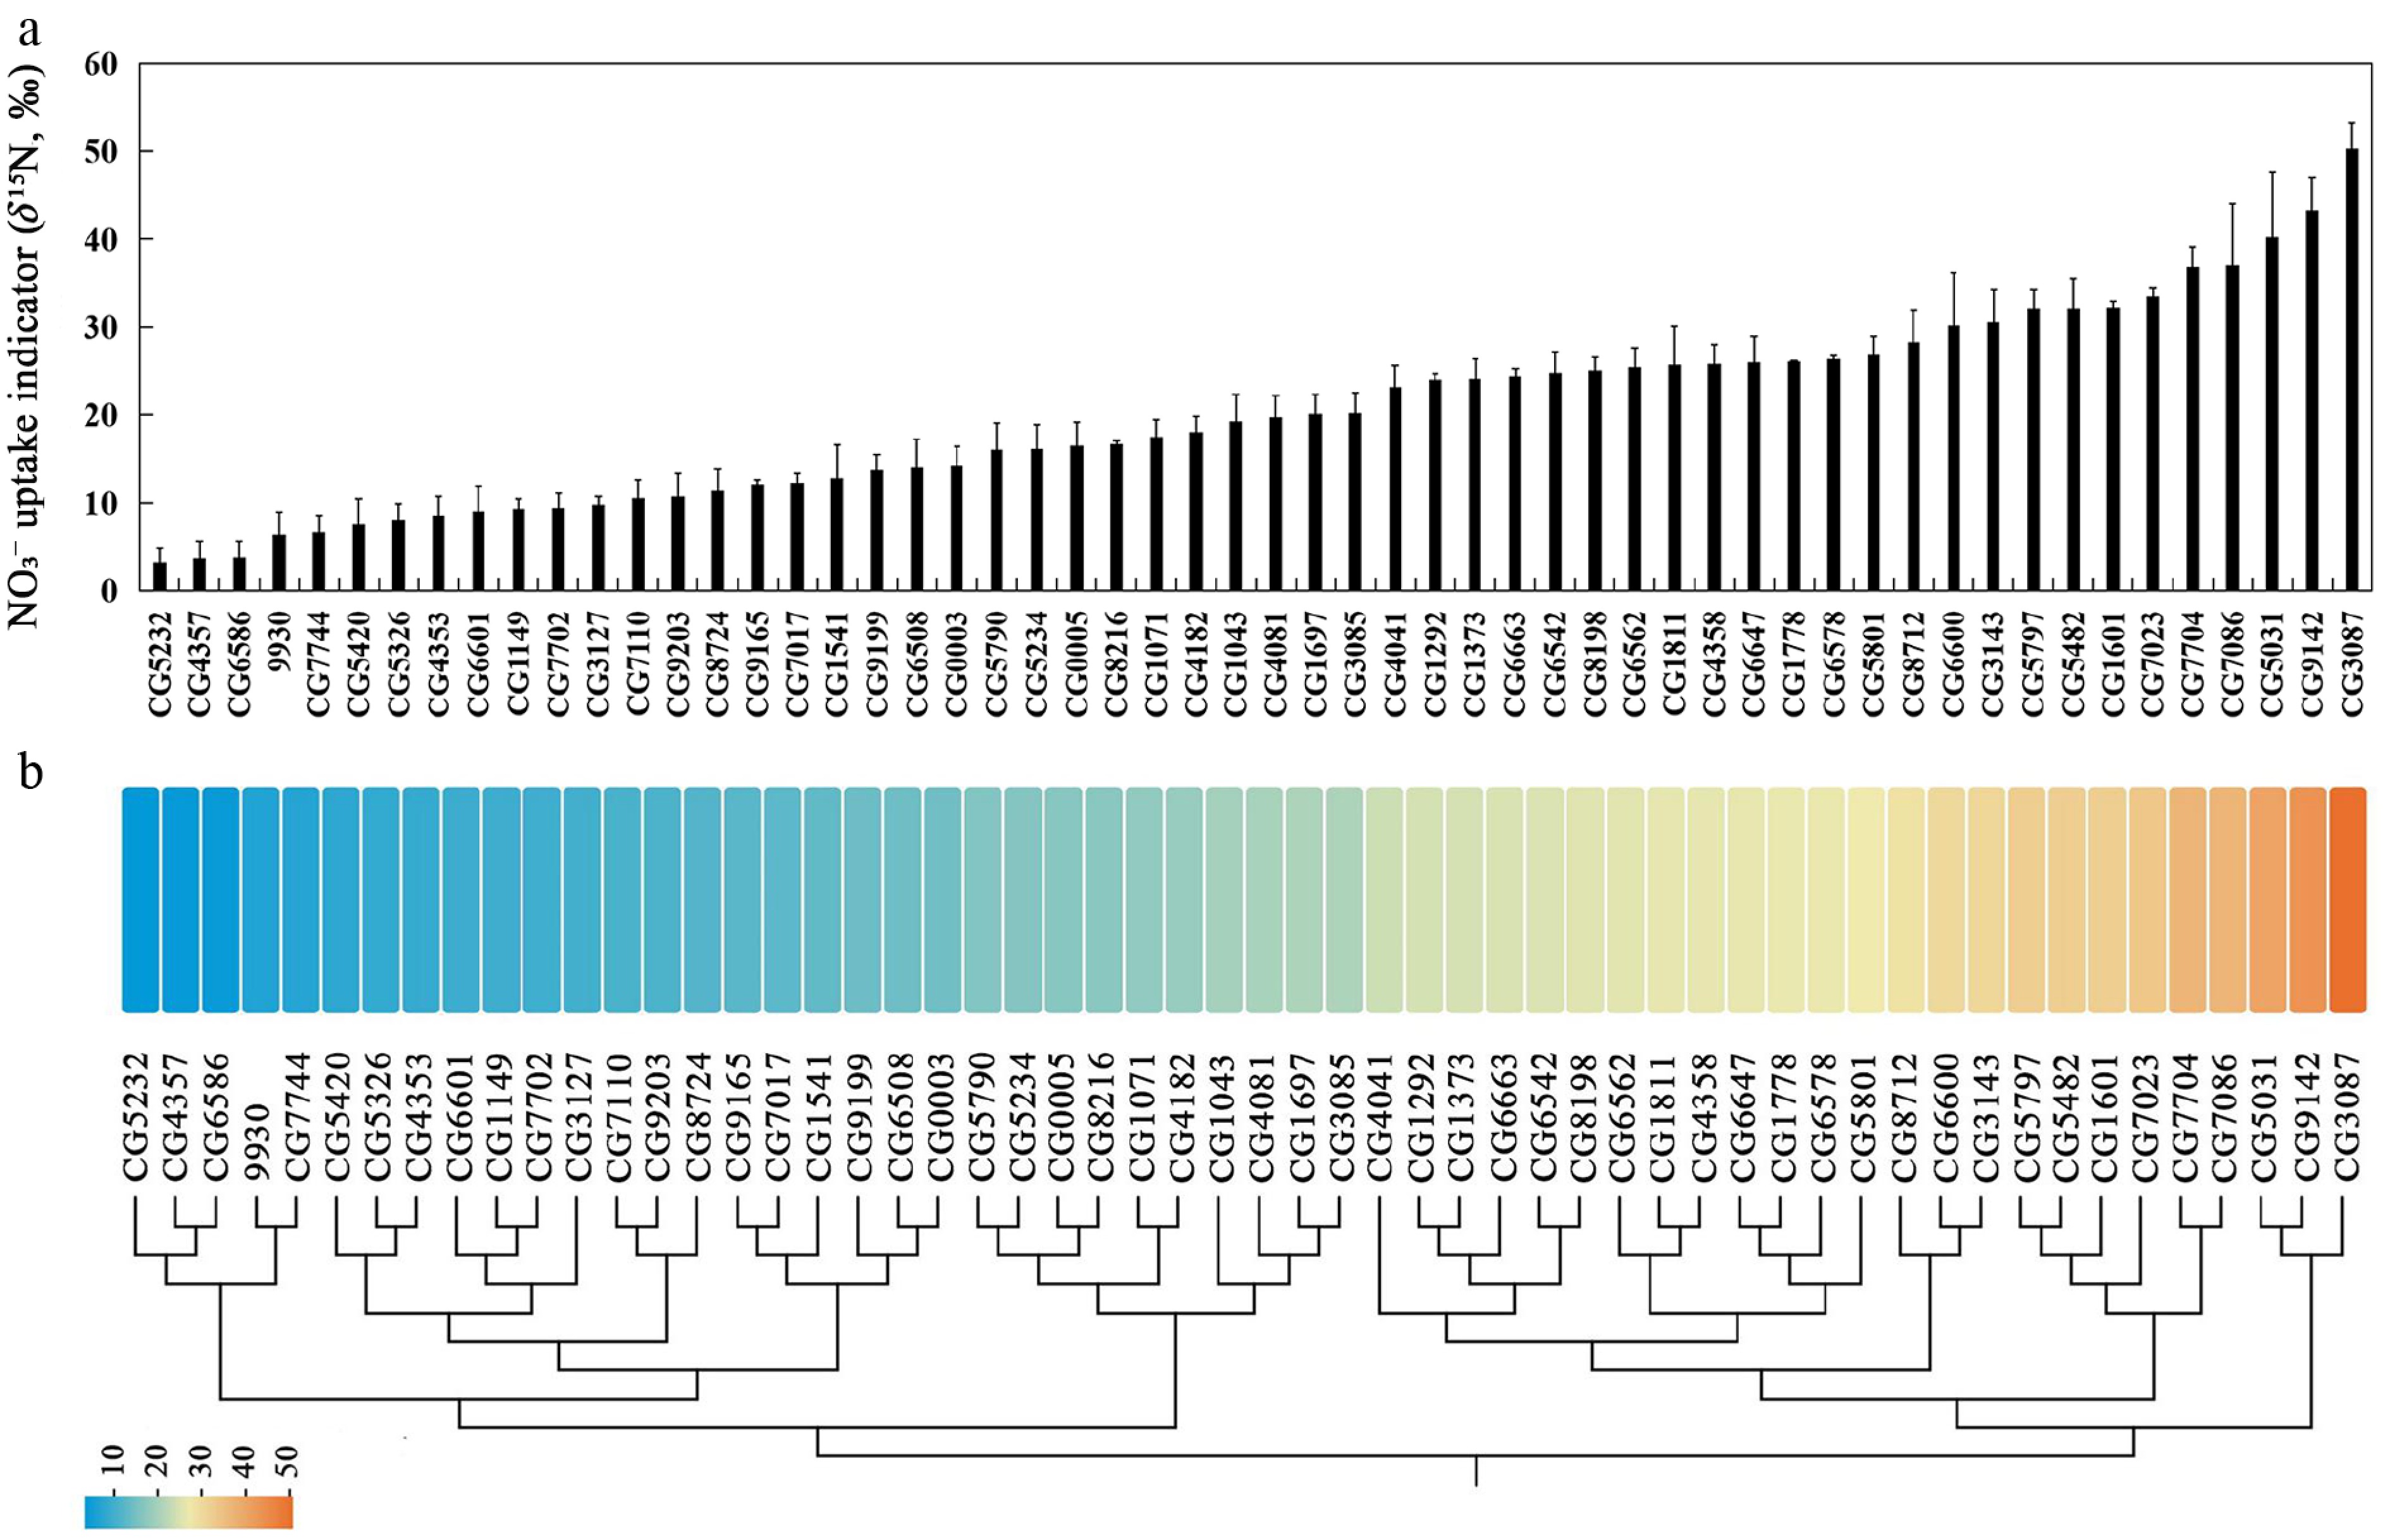
Figure 2.
Natural variation in NO3− uptake capacity among cucumber germplasms revealed by a 15NO3− tracer assay. (a) NO3− uptake capacity assessed by root δ15N (‰) after 15NO3− labelling across 56 cucumber germplasms. (b) Heat map of NO3− uptake capacity (root δ15N, ‰) in 56 cucumber germplasms. Colors bars from blue to red represent low to high NO3− uptake capacity. The dendrogram shows hierarchical clustering based on the NO3− uptake capacity.
-
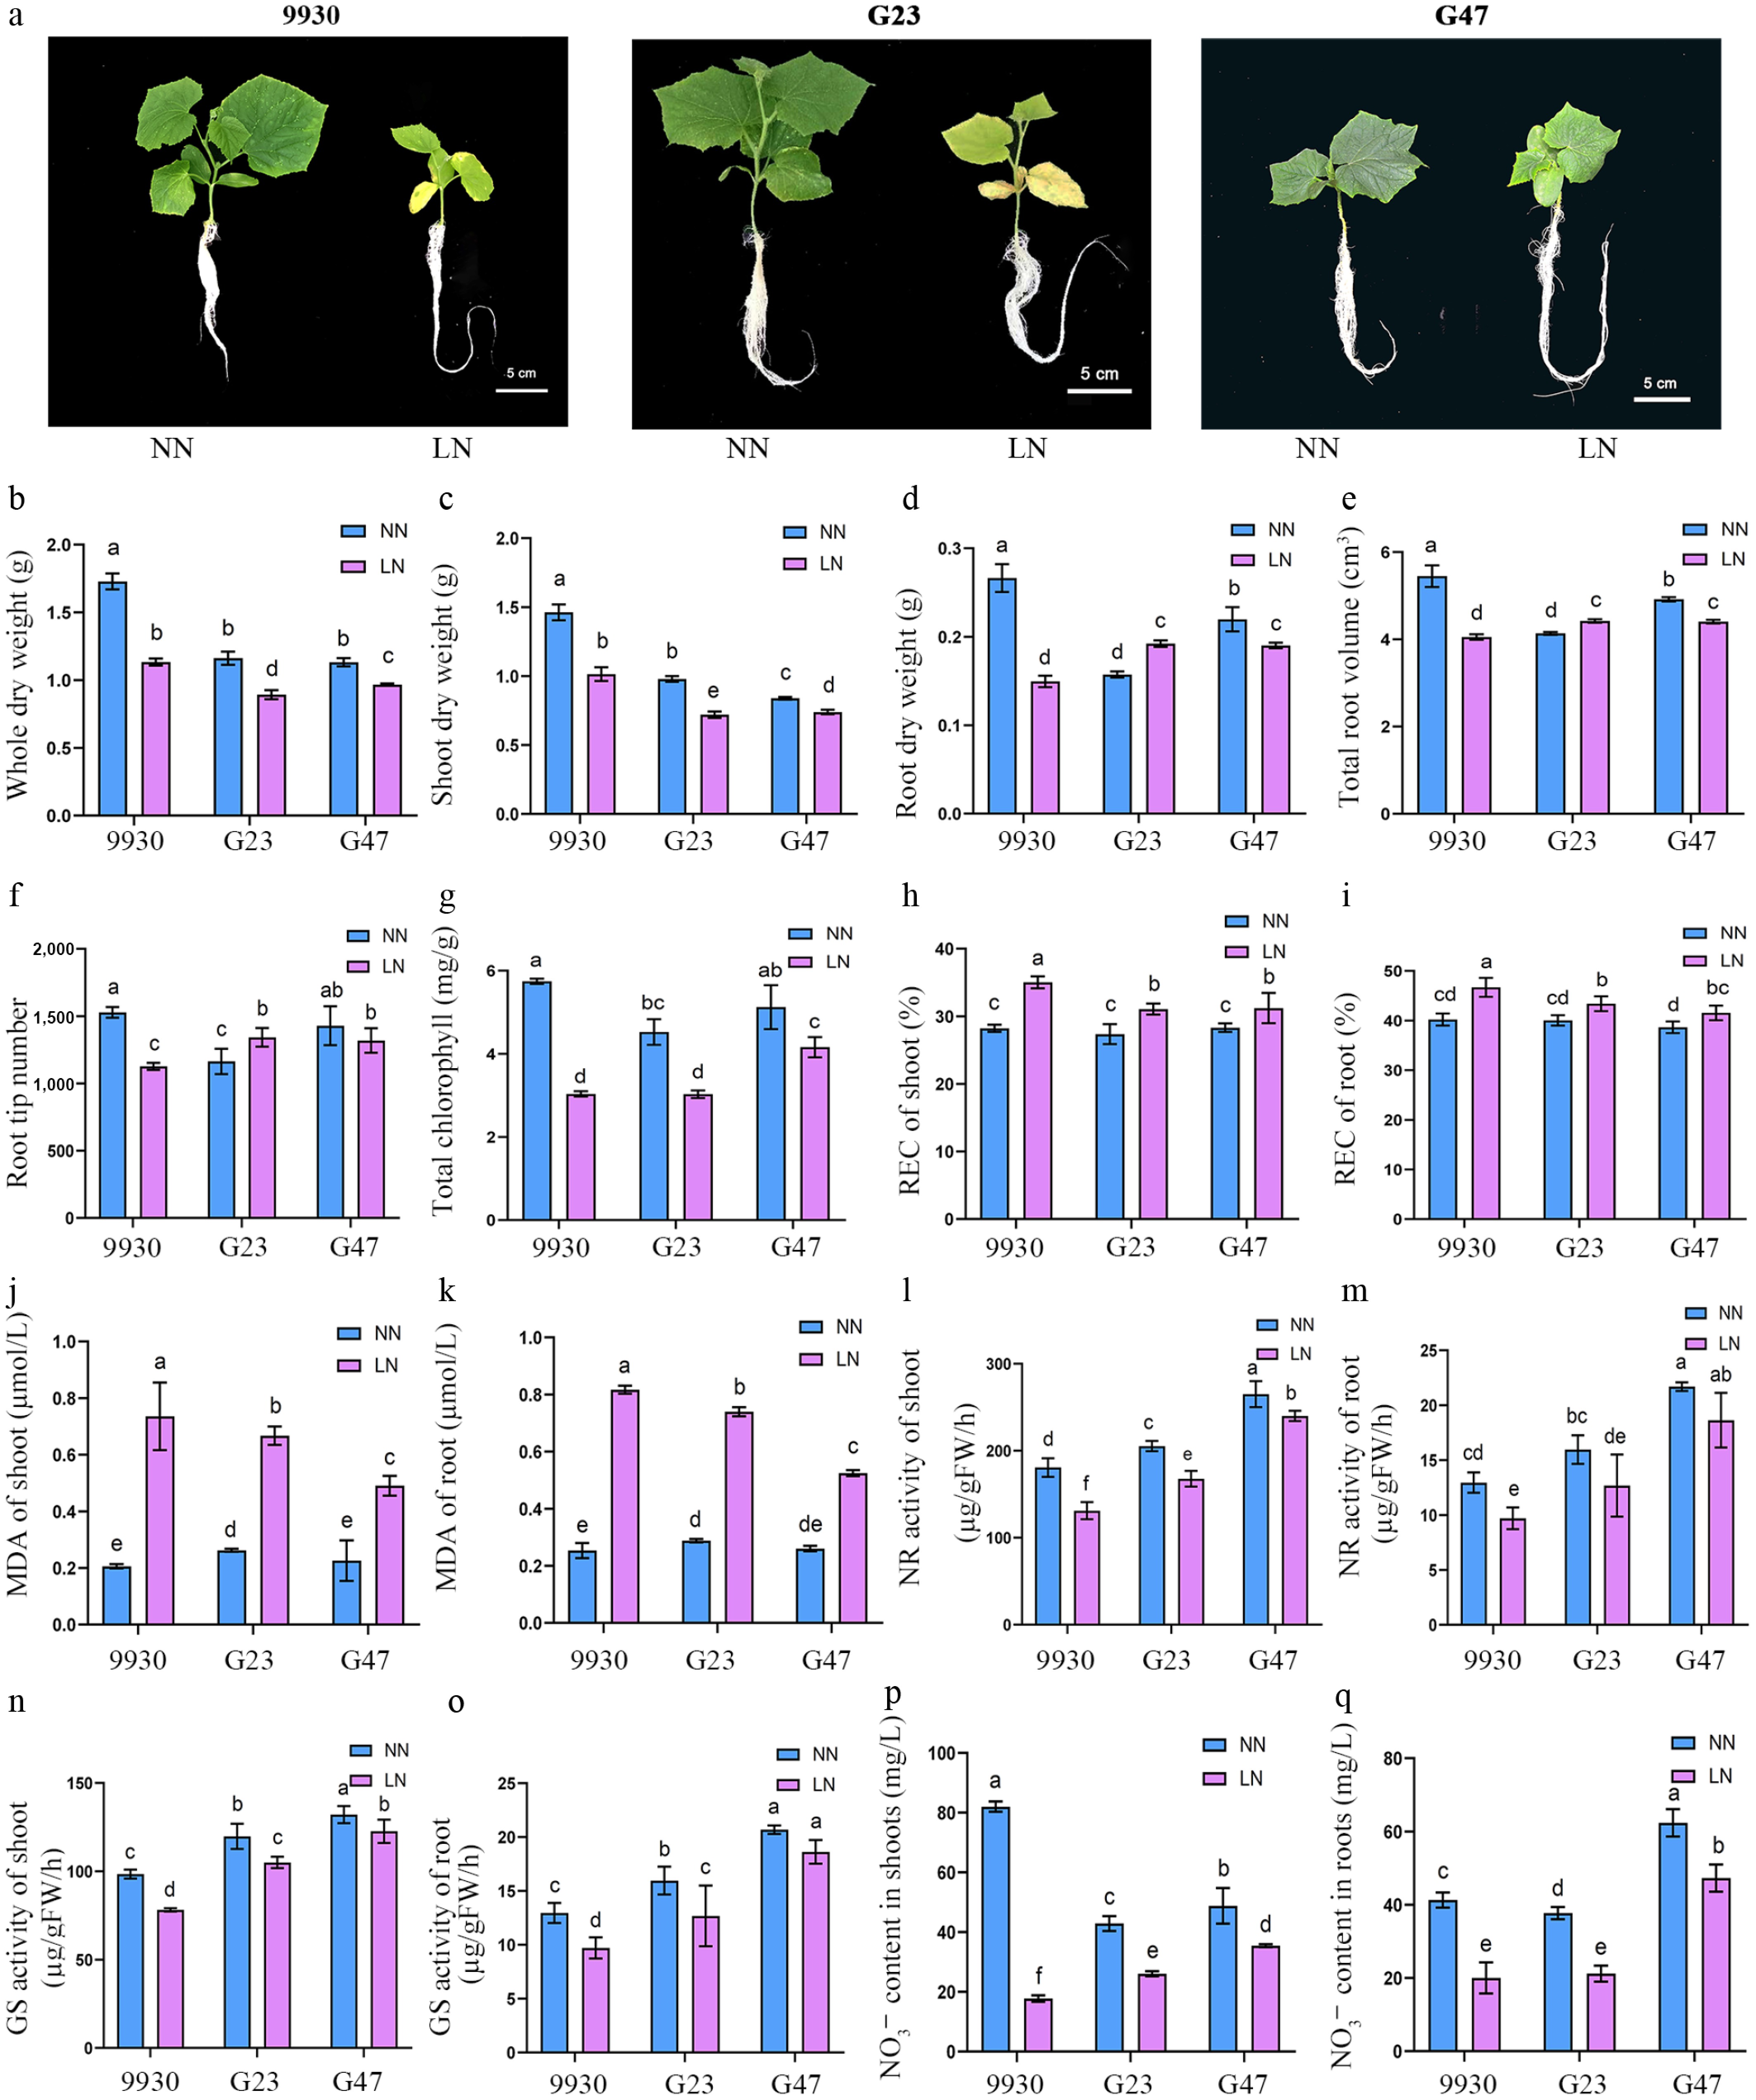
Figure 3.
Growth, physiological and biochemical responses of cucumber accessions 9930, G23 and G47 to LN stress. (a) Growth phenotypes, (b) whole-plant dry weight, (c) shoot dry weight, (d) root dry weight, (e) total root volume, (f) root tip number, (g) total chlorophyll content, (h) REC of shoots, (i) REC of roots. (j) MDA of shoots, (k) MDA of roots, (l) NR activity in shoots, (m) NR activity in roots, (n) GS activity in shoots, (o) GS activity in roots, (p) NO3− content in shoots, (q) NO3− content in roots, of cucumber germplasm 9930, G23, and G47 grown under LN and NN treatment for 8 d.
-
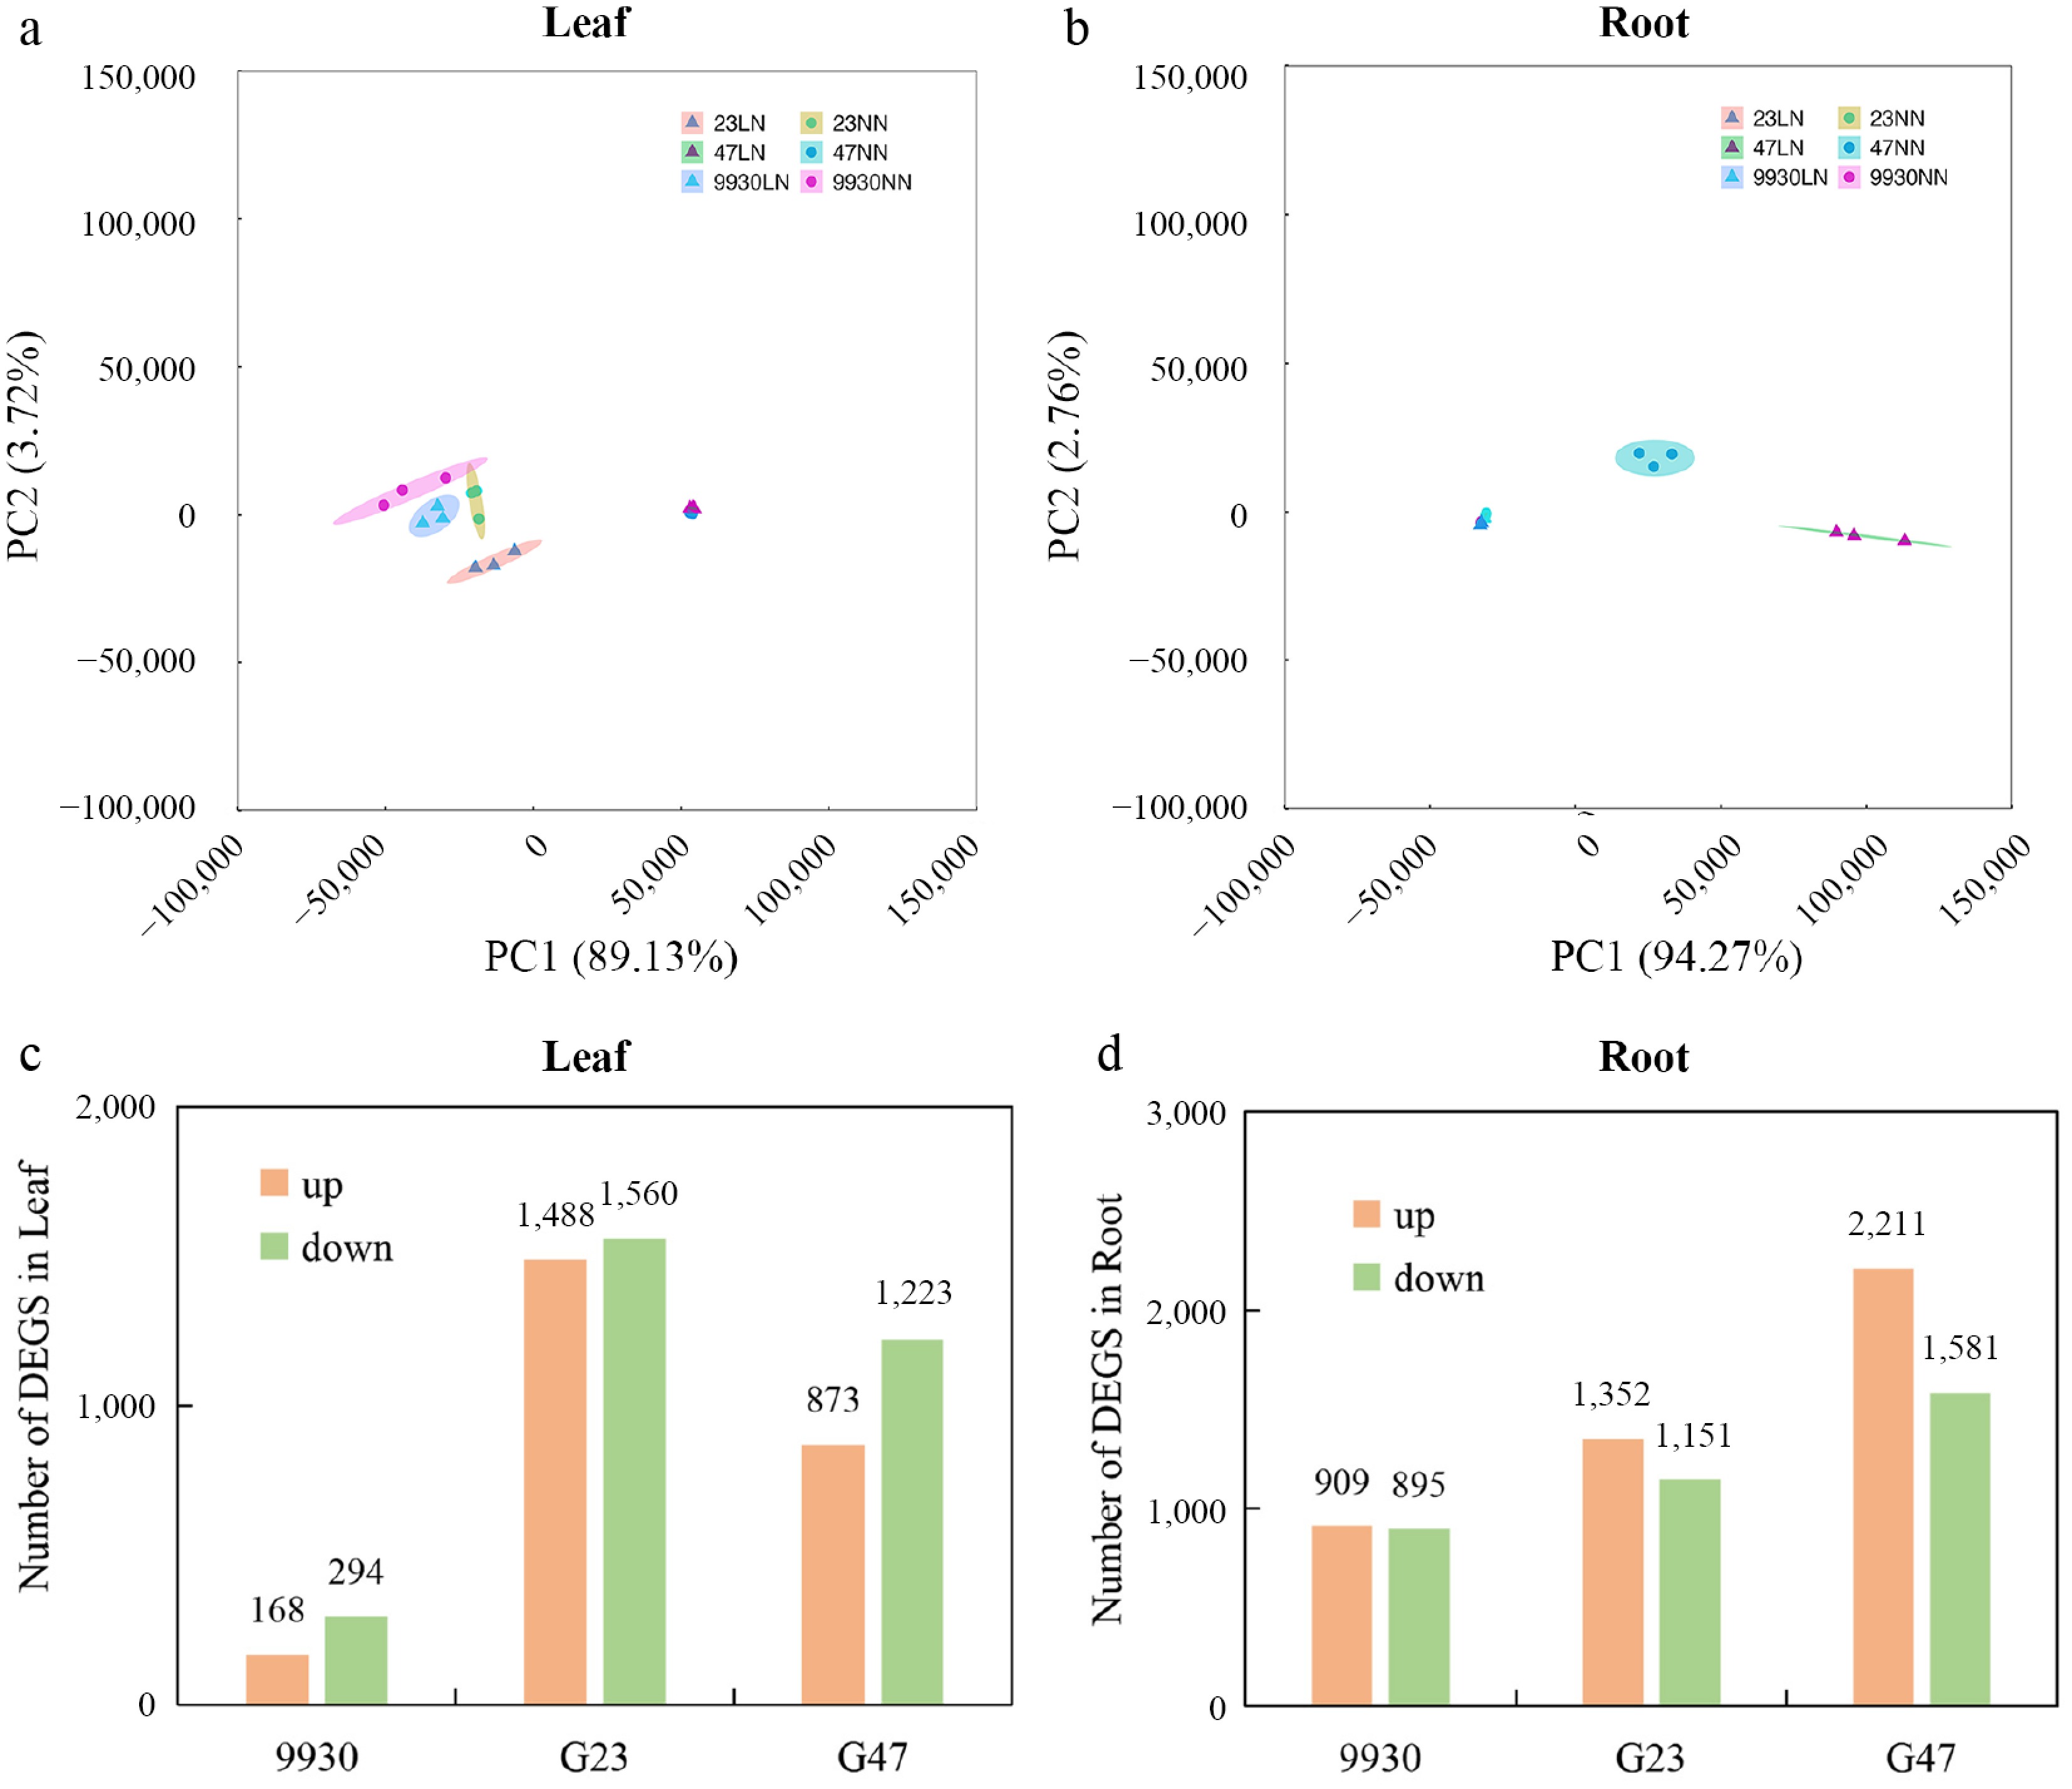
Figure 4.
RNA-seq analysis of leaf and root transcriptomes under LN stress. Principal component analysis (PCA) score plots (PC1 vs. PC2) of (a) leaf, and (b) root samples under LN and NN treatments. Numbers of DEGs that were upregulated (up), and downregulated (down) in (c) leaf, and (d) root of different genotypes after 2 d of LN treatment (relative to NN).
-
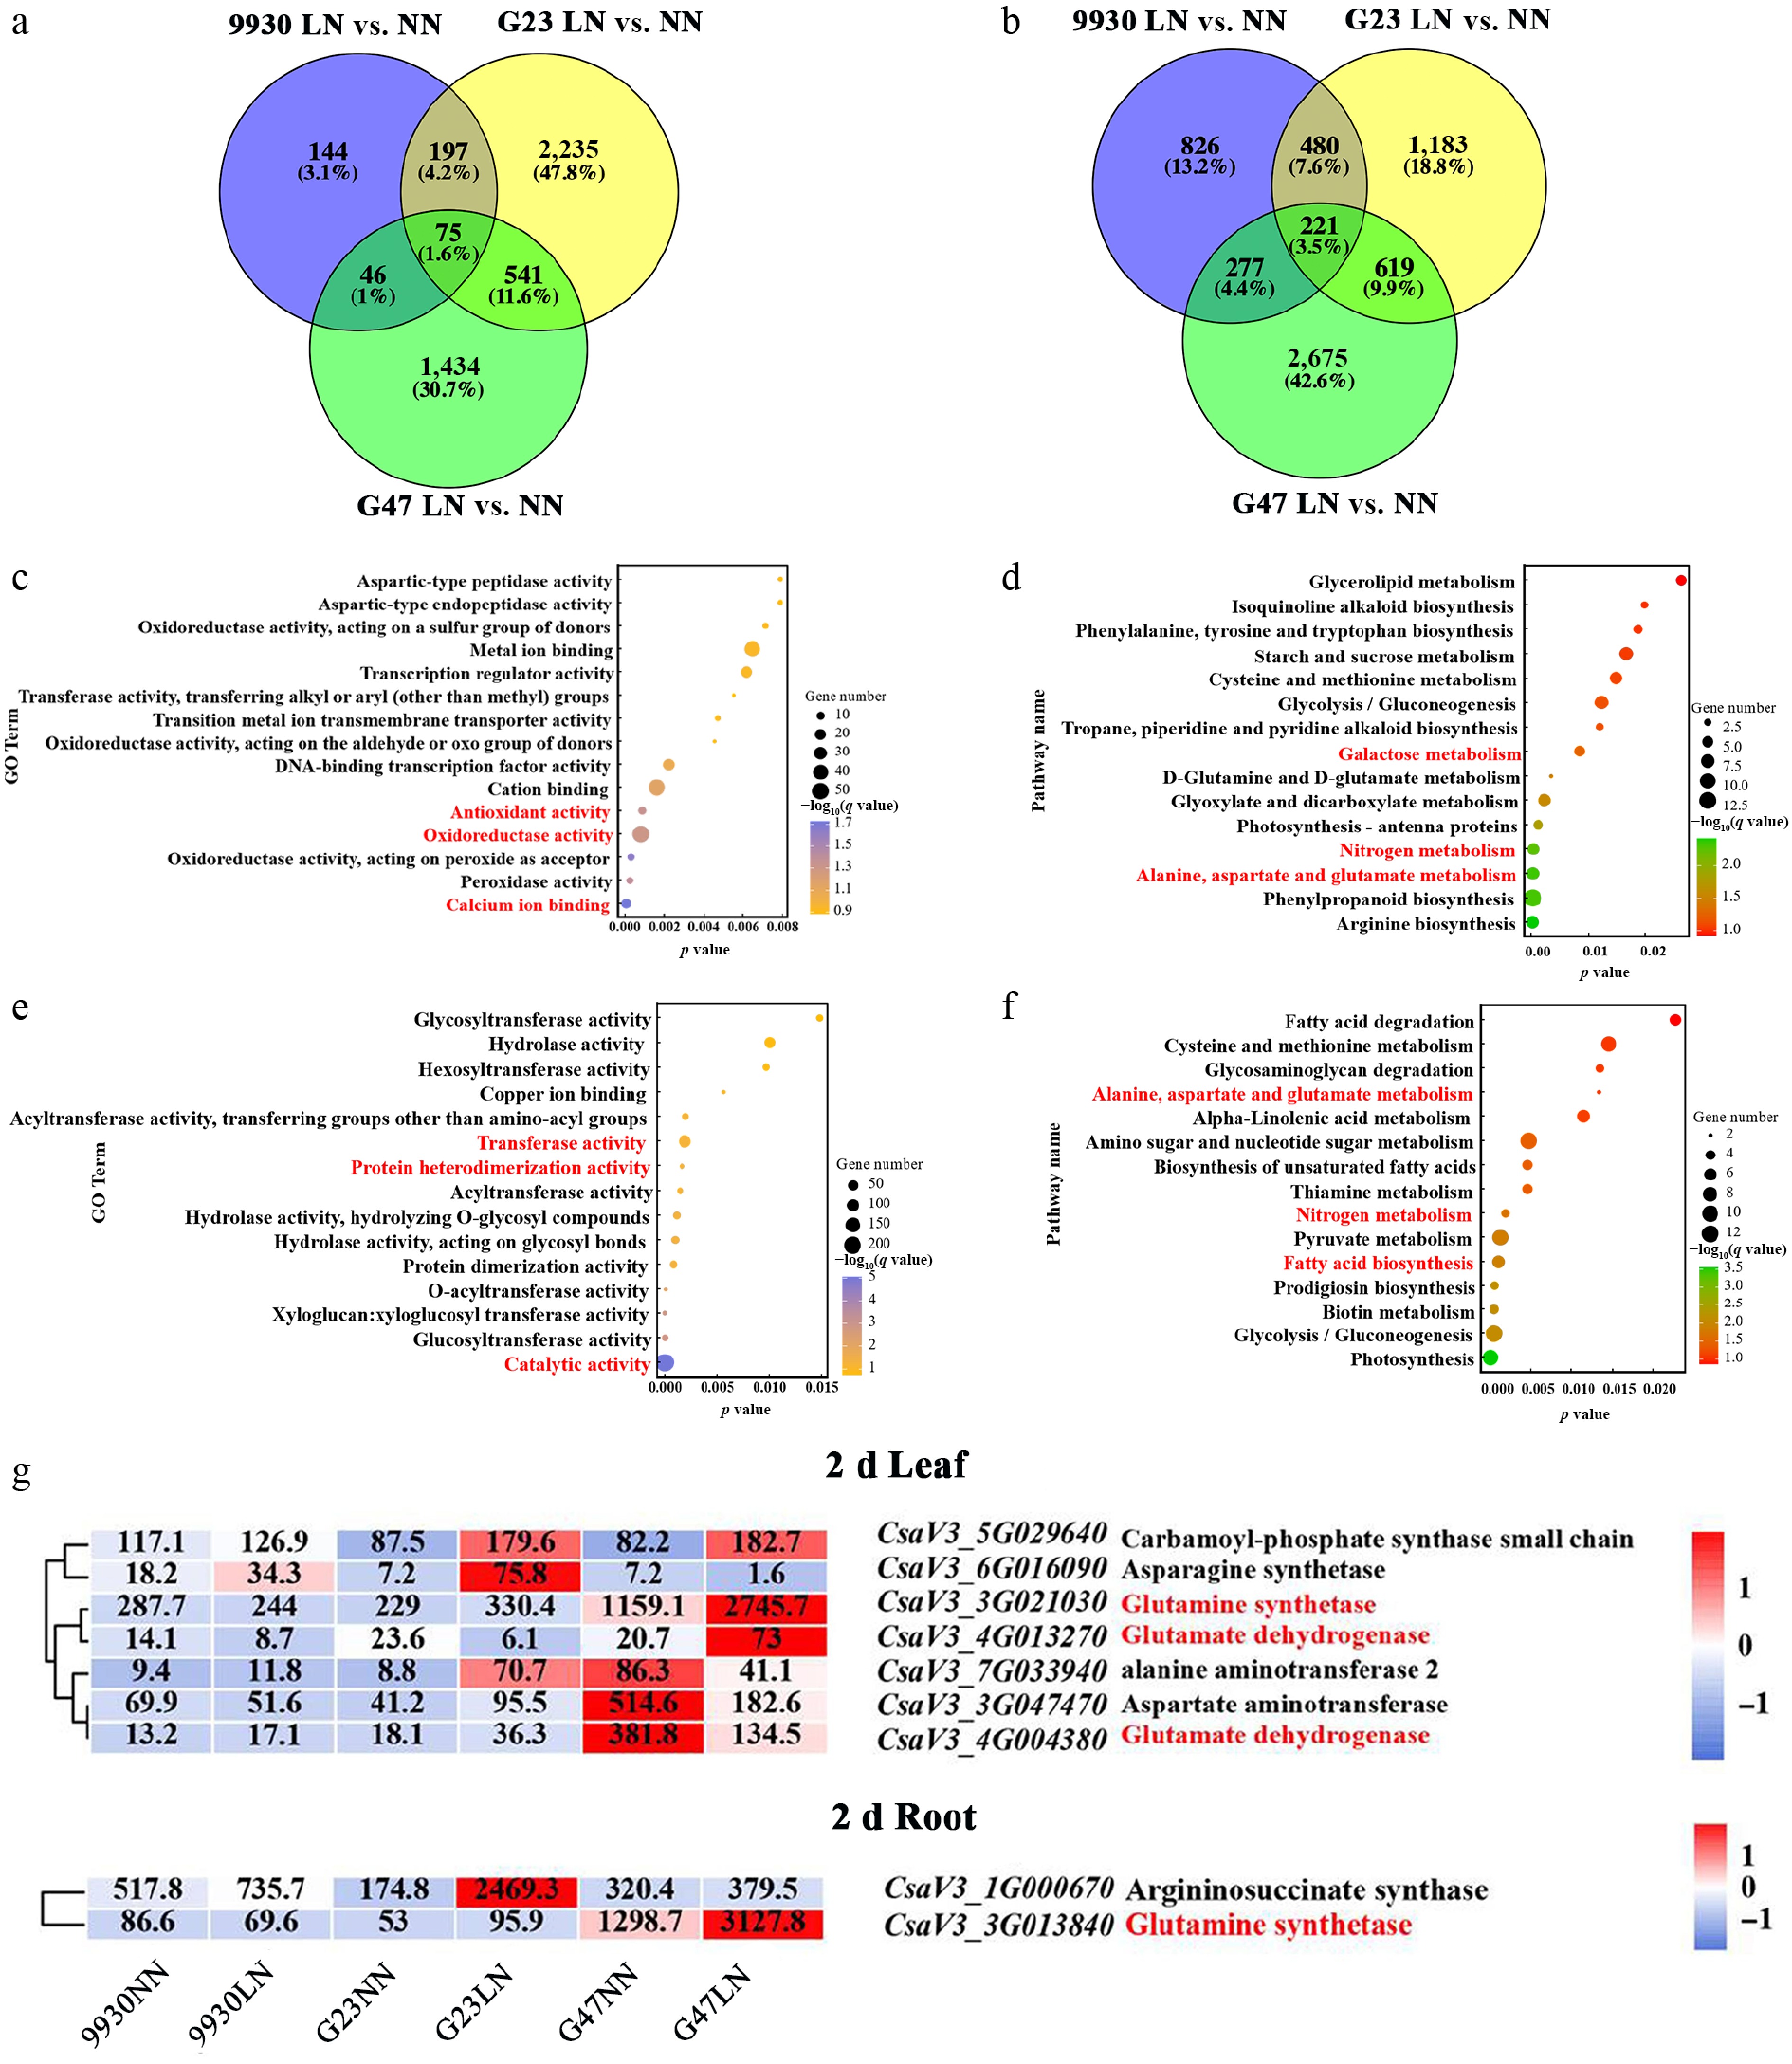
Figure 5.
DEG profiling of cucumber accessions 9930, G23, and G47 in leaves and roots after 2 d of LN treatment. Venn diagram showing DEGs identified for LN vs. NN in (a) leaves, and (b) roots. (c), (e) GO enrichment analysis, and (d), (f) KEGG pathway enrichment analysis of DEGs shared by G23 and G47 under LN in (c), (d) leaves, and (e), (f) roots. (g) Heatmaps show the expression of genes involved in GABA biosynthesis and metabolism in leaves and roots of 9930, G23 and G47 under LN for 2 d.
-
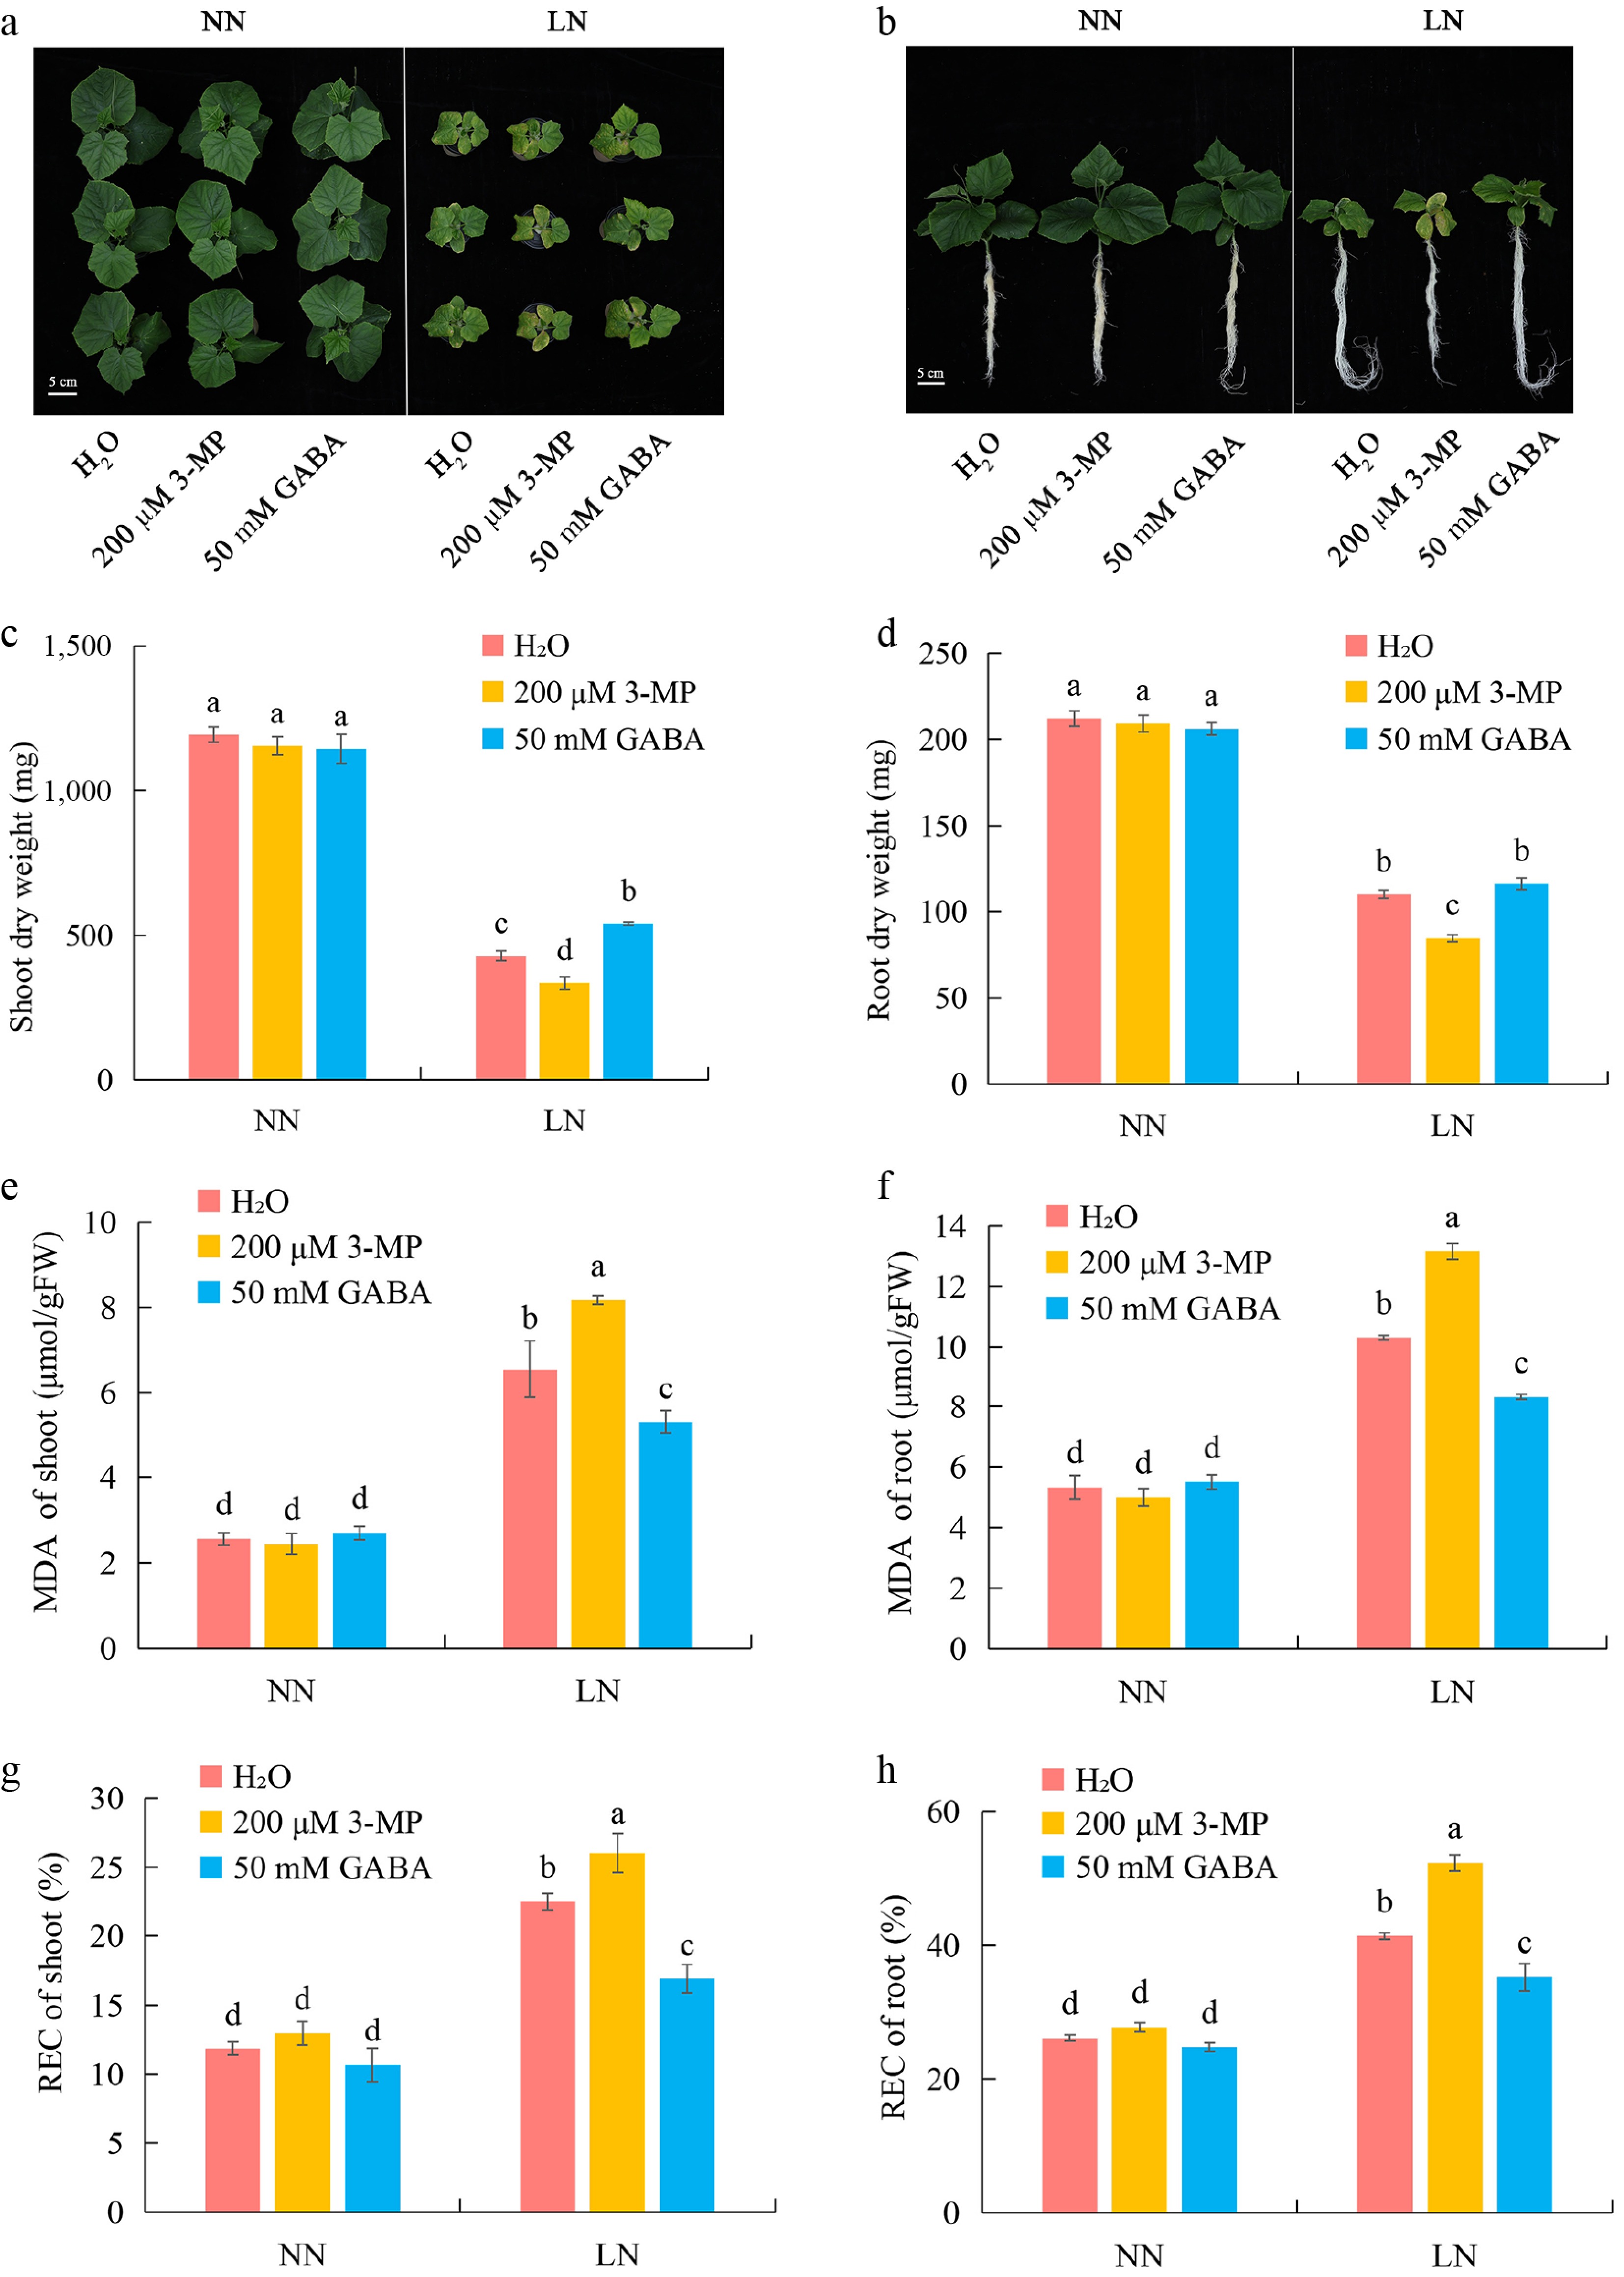
Figure 6.
Exogenous GABA application enhances LN tolerance of cucumber accession 9930. (a), (b) Representative shoot and root phenotypes of accession 9930 treated with water (H2O), 200 μM 3-MP, or 50 mM GABA under NN and LN conditions. (c), (d) Shoot and root dry weights under NN and LN conditions after the indicated treatments. (e), (f) MDA content in shoots and roots under NN and LN conditions. (g), (h) REC in shoots and roots under NN and LN conditions. Data are presented as mean ± SD. Different letters indicate significant differences (p < 0.05).
Figures
(6)
Tables
(0)